Thermal desorption of astrophysically relevant molecules from forsterite(010)
Abstract
We present temperature programmed desorption (TPD) measurements of CO, CH4, O2 and CO2 from the forsterite(010) surface in the sub-monolayer and multilayer coverage regimes. In the case of CO, CH4 and O2, multilayer growth begins prior to saturation of the monolayer peak, resulting in two clearly distinguishable desorption peaks. On the other hand a single peak for CO2 is observed which shifts from high temperature at low coverage to low temperature at high coverages, sharpening upon multilayer formation. The leading edges are aligned for all the molecules in the multilayer coverage regime indicating zero order desorption. We have extracted multilayer desorption energies for these molecules using an Arrhenius analysis. For sub-monolayer coverages, we observe an extended desorption tail to higher temperature. Inversion analysis has been used to extract the coverage dependent desorption energies in the sub-monolayer coverage regime, from which we obtain the desorption energy distribution. We found that owing to the presence of multiple adsorption energy sites on the crystalline surface the typical desorption energies of these small molecules are significantly larger than obtained in previous measurements for several other substrates. Therefore molecules bound to crystalline silicate surfaces may remain locked in the solid state for a longer period of time before desorption into the gas phase.
keywords:
astrochemistry – molecular data – methods: laboratory: molecular – ISM: clouds – ISM: molecules1 Introduction
A detailed understanding of molecular interactions on dust grain surfaces is of prime importance in a variety of astrophysical environments. In cold, dense regions of the interstellar medium (ISM) and on cometary bodies, molecules are frozen in the solid state and form icy mantles around dust grains. In addition to the carbonaceous grain population, silicate minerals of the olivine family are thought to be a common constituent of such dust grains. Cometary silicates are an unequilibrated and heterogenous mixture of crystalline and amorphous silicates (Hanner, 1999). In cold, dense regions of the ISM, silicates are generally thought to be amorphous (Li & Draine, 2002). Crystalline silicates are believed to be formed by high temperature annealing and predominantly reside close to evolved stars (Harker & Desch, 2002; Gail, 2004). Kemper et al. (2004) suggest a value of only 2.2% of crystalline silicates which must have been injected into the ISM by the stellar winds after their formation. However, based on recent observations, crystalline silicates have been detected as interstellar grains by the Stardust Mission (Westphal et al., 2014) and also in the ISM along several lines of sight towards the Galactic Centre (Wright et al., 2016). These authors showed further evidence for the presence of a measurable quantity of crystalline silicates in the envelopes of young stellar objects (YSOs) as well as along diffuse and dense cloud sight lines. They suggested that the quantity of crystalline silicates in ISM might be underestimated as their direct observation is complicated as a result of spectral overlap with other solid state species(Wright et al., 2016). Forsterite (Mg2SiO4) is a convenient analogue for magnesium-rich crystalline silicates, serving as a model surface with which to investigate the interactions between weakly bound physisorbed molecules and interstellar grain surfaces.
During the evolution of interstellar clouds, thermal processing of the icy mantles on grain surfaces commonly occurs, as is also the case for cometary ices when comets move closer to the sun (Wyckoff, 1982). The timescale for the return of ice species to the gas phase through thermal desorption depends on the strength of the interaction between adsorbed molecules and the grain surface as well as, for multilayer ices, the interactions between adsorbate molecules. Thus, measurements of the adsorption energy provide valuable input for astrochemical models of such environments. Temperature programmed desorption (TPD) measurements provide a means to extract the kinetic desorption parameters for molecules adsorbed on model grain surfaces. Several independent studies in recent years (Katz et al., 1999; Thrower et al., 2009; Noble et al., 2012; Clemens et al., 2013; Smith et al., 2014b; Suhasaria et al., 2015; Smith et al., 2015; He et al., 2016) have demonstrated that, in addition to the chemical nature of the surface, surface morphology plays a key role in determining the kinetic parameters for desorption. For example, coverage dependent kinetics arise where a grain surface displays multiple adsorption sites with differing adsorption energies.
In addition to water ice, CO, CO2, CH4 and O2 are also important components of interstellar and cometary ices (Mumma & Charnley, 2011). CO is the second most abundant molecule after H2O and has a relative abundance of up to 85% in low mass YSOs and up to 30% in comets (Boogert et al., 2015). Solid CO2 typically shows an abundance of 12-50% with respect to water in low mass YSOs and 4-30% in comets (Boogert et al., 2015). CH4 is the simplest organic molecule and its solid phase abundance with respect to H2O ice is found to be 1-11% in low mass YSOs and between 0.4 and 1.6% in comets (Boogert et al., 2015). O2 is expected to be an abundant molecule in the ISM (Larsson et al., 2007), although direct observation is difficult as it lacks a permanent dipole moment. Nevertheless, O2 is considered to be involved in the formation of H2O on grain surfaces (Goldsmith et al., 2011). Recently, the cometary sampling and composition (COSAC) experiment onboard the Philae lander of the Rosetta Mission has confirmed the presence of CO, CO2 and CH4 along with H2O and other organic species in cometary ices (Goesmann et al., 2015).
In recent years the desorption kinetics of these simple species has been studied experimentally for carbonaceous (Ulbricht et al., 2006; Burke & Brown, 2010; Edridge et al., 2013; Smith et al., 2015), water ice (Collings et al., 2003; Noble et al., 2012; Edridge et al., 2013; Smith et al., 2015; He et al., 2016), amorphous silicate (Noble et al., 2012) and amorphous silica (Collings et al., 2015) surfaces. To date the desorption of these species on crystalline silicate surfaces has not been investigated experimentally, except for one study of CO2 on the olivine(011) (Smith et al., 2014b). The adsorption of CO (Escamilla-Roa et al., 2017) and CO2 (Kerisit et al., 2013) on forsterite surfaces has, however, been investigated using density functional theory (DFT). Recently, we have experimentally studied the desorption kinetics of NH3 from two forsterite(010) surfaces prepared by cleaving and cutting the surface, the latter resulting in a surface with a significantly higher degree of surface heterogeneity. In both cases, a large distribution of desorption energies was observed, leading to a significantly longer desorption timescale compared to that suggested by a single desorption energy. Here we have extended this work to other, more weakly bound astrophysically relevant molecules that desorb at much lower temperatures from the cleaved forsterite(010) surface.
2 Experimental methods
Experiments were performed in an ultra-high vacuum chamber with a base pressure of 5 mbar which is described in detail elsewhere (Suhasaria et al., 2015). The sample is clamped to the end of a liquid helium cryostat which allows cooling to K. The sample is locally heated using a 50 W halogen bulb situated just behind the sample holder. The temperature of the sample is determined with a precision of better than 0.5 K by a calibrated silicon-diode which is mounted close to the sample on the sample holder. The sample is heated with the aid of proportional-integral-derivative control software written in LabView. A quadrupole mass spectrometer (QMS; Hiden Analytical HAL 7) detects the molecules desorbing from the sample surface. The QMS is contained within a glass shield with an entrance aperture of 2 mm which reduces the detection of molecules desorbing from surfaces other than that of the sample of interest.
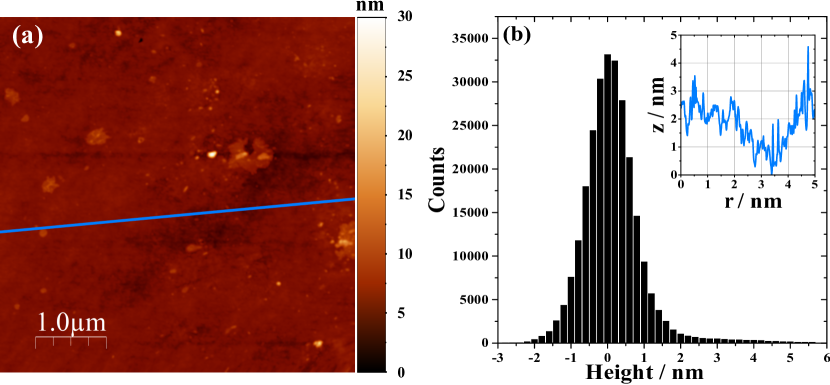
The sample was a synthetic forsterite single crystal, cleaved to expose the most stable forsterite(010), as confirmed through reflective diffraction measurements (Suhasaria et al., 2015; King et al., 2010). To understand the surface morphology, tapping mode atomic force microscopy (AFM) was used. The AFM images obtained were visualized using the WsxM 5.0 software package (Horcas et al., 2007). Figure 1 (a) shows a topographical 5 region of the cleaved forsterite(010) surface. The image indicates that the cleaving of forsterite surface yields atomically flat terraces with some atomic defects. Figure 1 (b) shows the height distribution, centred around the most common height, which demonstrates a maximum height variation of ca. nm. This is also clear in the line scan along the blue line displayed in the inset to Figure 1 (b). The root mean square (rms) roughness across the surface is found to be 0.8 nm. In comparison, the cut forsterite(010) surface used in our previous study (Suhasaria et al., 2015) has a rms roughness of 81 nm and a mean height variation of 326.1 nm. Thus, the cleaved surface is significantly smoother.
Prior to performing thermal desorption measurements, the sample was heated to 465 K in UHV for several minutes to remove surface contaminants, and to degas the heating filament. The sample was then rapidly cooled to ca. 17 K prior to exposure to the adsorbate of interest. A small UHV dosing chamber is connected to the main chamber and is isolated by a gate valve. The pressure in the dosing chamber is measured with a calibrated spinning rotor gauge. Gases from the dosing chamber are introduced into the main chamber by means of long tube terminated with a 50 m aperture. The sample is brought to within 5 mm of the dosing tube to ensure that the gas is dosed directly on the sample, strongly reducing adsorption on other surfaces of the sample holder as confirmed by only a small pressure rise to ca. 5.5 mbar in the main chamber during dosing. We note that dosing from a small aperture in this way will lead to some degree of non-uniformity in the film growth rate across the surface. Assuming a cosine flux distribution, we estimate that the flux at the surface varies by less than 10 % over ca. 85 % of the surface. Any effects of this non-uniformity are minimized by the aperture to the QMS which allows us to constrain the detection to molecules desorbing from the uniform region of the film. For each molecule the same initial pressure in the dosing chamber was used, with the exposure being determined by the duration of dose. The gases, carbon monoxide (CO) (99.97%, Westfalen AG), oxygen (O2) (99.999%; Westfalen AG), methane CH4 (99.995%; Westfalen AG) and carbon dioxide (CO2) (99.995%; Westfalen AG), were used directly without further purification.
3 Results and analysis
3.1 Coverage determination
In order to describe the desorption kinetics it is necessary to determine the surface coverage in terms of the number of adsorbed monolayers (ML) that result from a given exposure to the gas of interest. In order to determine the coverage for a given TPD trace we note that the mass spectrometer signal for a desorbing species is directly proportional to its rate of desorption, , as described by the Polanyi-Wigner equation: (King, 1975)
| (1) |
where denotes the pre-exponential factor (MLn-1 s-1), the desorption order, the desorption energy (kJ mol-1), the universal gas constant (kJ mol), and the surface temperature (K). denotes the relative coverage of adsorbate molecules on the forsterite(010) surface in ML. We define as the initial coverage at the start of the TPD measurement that results from the adsorbate deposition, i.e.:
| (2) |
where is in units of ML s-1.
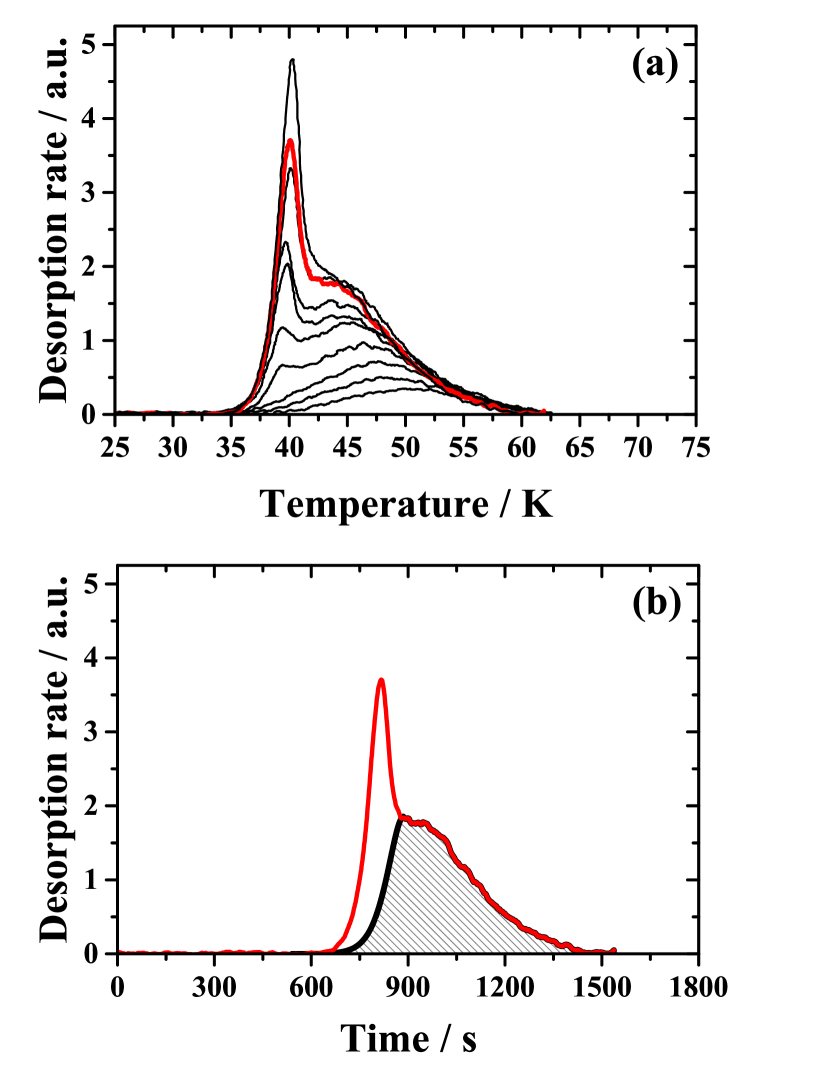
Although the proportionality constant between the QMS signal and is initially unknown, it can be obtained through the integration of the TPD trace corresponding to a known coverage. For example, in cases where the adsorbate first forms a monolayer on the surface prior to the growth of a multilayer film, a distinct peak in the TPD trace arises that saturates at 1 ML. However, in case of CO, CH4 and O2, we observe the appearance of a second desorption peak prior to that attributed to the monolayer. This indicates that multilayer growth, which results in a zero order desorption peak at lower temperature, commences prior to saturation of the monolayer peak at higher temperature. This suggests the formation of few layer islands during the film growth, rather than a simple layer by layer growth mechanism. This effect may arise to some extent as a result of the non-uniformity of the dosing flux as discussed in the Experimental Methods. Therefore, direct extraction of the integrated peak area corresponding to a coverage of 1 ML is more difficult. This is shown in Figure 2 (a), for the desorption of CH4 from forsterite(010) where the desorption peak at higher temperature corresponds to the monolayer while the other, at lower temperature, is due to desorption from CH4 multilayers. The TPD trace in red corresponds to the lowest exposure that results in a saturated monolayer peak and is therefore used in the coverage determination.
In order to isolate the desorption peak associated with the saturated monolayer alone, we construct a synthetic leading edge assuming first order desorption kinetics and match this to the experimental trailing edge. We assume that the peak maximum of the monolayer peak corresponds to the desorption out of the lowest energy adsorption sites and use the Redhead peak maximum method (Redhead, 1962) to extract the corresponding desorption energy. These parameters were then used to simulate the corresponding first order desorption peak using the 4th-order Runge-Kutta method to solve the Polanyi-Wigner equation. This is shown in Figure 2 (b) where the leading edge of the simulated monolayer peak (in black) is matched to the experimental trailing edge (in red) to reconstruct the monolayer peak. Thus, the grey shaded area corresponds to an initial coverage of 1 ML and can be used, by comparison, to obtain the initial coverages for the other exposures used. The same approach was used to determine the coverages for CO and O2. On the other hand, the CO2 desorption shows no clear distinction between monolayer and multilayer peaks. In this case, we therefore define 1 ML according to the distinctive sharpening in the lower temperature region that arises upon the appearance of multilayer desorption with zero order kinetics. This is discussed in more detail in Section 3.2 with reference to Figure 3.
We note that for all four molecules, the leading edges in the TPD traces are not coincident for first few multilayers which suggests fractional order desorption process, most likely resulting from the growth of multilayer islands, further consistent with a non layer by layer growth mechanism. This effect could again arise as a result of non-uniform dosing across the sample. We cannot therefore define monolayer peak as the coverage simply at which the leading edges of the TPD curves become coincident.
3.2 Thermal desorption
We begin by summarizing the observed thermal desorption characteristics for the four molecules investigated. Figure 3 shows the thermal desorption traces obtained for (a) CO, (b) CH4, (c) O2 and (d) CO2 from forsterite(010) following adsorption at 17 K. Linear heating rates of K s-1 for CO, CH4 and O2 and K s-1 for CO2, respectively, were employed. In each case, traces obtained from several different exposures covering the sub-monolayer and multilayer coverage regimes are presented. The initial coverage that results from each exposure has been determined according to the procedure described in Section 3.1. In all cases, the lowest exposures result in a desorption peak at high temperature that gradually extends to lower temperature with increasing exposure, leading to the development of a high temperature tail in the desorption peak. The tail extends typically about 15 K beyond the position of the peak maximum for the saturated monolayer. As this peak dominates at low exposures, and ultimately saturates with increasing exposure we attribute this peak to desorption from the first monolayer of adsorbate molecules on the forsterite(010) surface. The broad temperature range over which the desorption traces extends is reminiscent of that observed for NH3 adsorbed on the same surface (Suhasaria et al., 2015). Such behaviour can be attributed to either the presence of a variety of adsorption sites on the forsterite surface that give rise to a distribution of adsorption energies, or to increasing repulsive interactions between adsorbate molecules as the coverage increases. In both cases, the result is a coverage dependence of the desorption energy. Coverage dependent desorption energies have been observed previously for e.g. CO on MgO(100) (Dohnálek et al., 2001), D2 on amorphous solid water (Amiaud et al., 2007), benzene (C6H6) on amorphous silica (Thrower et al., 2009), CO2 and H2O on crystalline olivine(011) (Smith et al., 2014b) and NH3 on amorphous silicate (He et al., 2015). In the first scenario, the shift of the desorption to lower temperature with increasing exposure suggests a sequential filling of adsorption sites from higher to lower binding energy. We note that TPD is not sensitive to the initial population of adsorption sites prior to the commencement of heating as a result of thermally activated diffusion which would result in the migration of molecules to higher energy sites during the desorption measurement. Thus, the experimental desorption profile reflects the overall distribution of binding sites on the surface. In the second scenario, the shift of the desorption to lower temperatures with increasing exposure could also be attributed to repulsive adsorbate-adsorbate interactions. These increase as the adsorbate molecules occupy more sites on the substrate, reducing their average separation. This has been suggested previously by Sallabi & Jack (2000) for the desorption of CO from MgO(100) by considering Monte carlo simulations and experimentally for the desorption of O2 and CO on the fully oxidized TiO2 (110) surface (Dohnálek et al., 2006).
From Figure 3 it is clear that in the intermediate coverage regime, corresponding to the growth of the first few multilayers, the leading edges are not aligned which can be interpreted as fractional order desorption kinetics arising from island growth on the surface. We again note that this may arise as a result of the non-uniformity of dosing across the surface resulting in completion of the monolayer in some regions prior to others. As the exposure increases, all species show the formation of a sharper desorption peak at lower temperature. This peak gradually shifts to higher temperature with increasing coverage and does not saturate. These characteristics are indicative of desorption from a multilayer ice film. Furthermore, we note that this peak shows coincident leading edges, as highlighted in the insets to Figure 3 as expected for zero order multilayer desorption.
A clear difference is apparent in the sub-monolayer desorption of CO2 compared to the other three molecules. While CO, CH4 and O2 show two distinct desorption peaks, CO2 shows only a single peak that gradually extends to lower temperature with increasing coverage and then sharpens upon formation of the multilayer. Beyond this point the multilayer desorption peak evolves similarly to the other molecules.
Figure 3 (a) shows the TPD traces for CO for the sub-monolayer and intermediate regimes from = 0.2 to 1.2 ML. The sub-monolayer peak maximum shifts from 49.3 K at = 0.2 ML to 40 K at = 1.2 ML with the multilayer peak growing in at 31.7 K prior to the saturation of the monolayer peak. The high temperature tail extends up to ca. 65 K. The inset shows traces corresponding to multilayer coverages of = 1.3 to 2.8 ML. The leading edges begin to align at a total coverage of 2.0 ML.
Figure 3 (b) shows the TPD traces for CH4 for the sub-monolayer and intermediate coverage regimes from = 0.2 to 1.2 ML. For sub-monolayer coverages, the peak maximum shifts from 50.5 K at = 0.2 ML to 44.5 K at = 1.2 ML, with a high temperature tail extending up to ca. 62.5 K in all cases. The multilayer peak at 39.7 K begins to grow already at a total coverage of 0.7 ML, which again suggests the formation of islands on the surface before completion of the monolayer. The inset shows the traces corresponding to multilayer coverages ranging from = 1.3 to 2.3 ML. With increasing exposure, the multilayer peak maximum shifts to higher temperatures as expected for zero order kinetics. The leading edges are aligned for coverages greater than 1.9 ML.
Figure 3 (c) shows the TPD traces for O2 for the sub-monolayer and intermediate regimes from = 0.5 to 1.1 ML. The sub-monolayer peak maximum shifts from 38.7 K at = 0.5 ML to 37.3 K at = 1.1 ML. The multilayer peak appears at 34.4 K for a coverage of 0.9 ML before saturation of the monolayer peak. The high temperature tail extends up to ca. 55 K. The inset shows multilayer traces corresponding to coverages of = 1.3 to 2.6 ML, which again shift to higher temperature with increasing coverage. The leading edge starts to align at 2.0 ML.
Figure 3 (d) shows the TPD traces for CO2 for the sub-monolayer and intermediate regimes from = 0.3 to 1.3 ML. The peak maximum shifts from 92.2 K at = 0.3 ML to 78.6 K at = 1.1 ML. The high temperature tail extends up to ca. 110 K. Until a coverage of ca. 0.8 ML the peak resembles the submonolayer peaks observed for the other molecules. For larger exposures, a sharpening of the peak maximum at 78 K indicates the commencement of multilayer formation, consistent with the appearance of zero order kinetics. This feature we use to define the CO2 monolayer. The inset shows multilayer traces for coverages of = 1.9 to 12.2 ML. As for the other molecules, the multilayer peak shifts to higher temperatures with increasing coverage. The leading edges align at a coverage of 1.9 ML.

3.3 Desorption energy determination
Two different methods were used to determine the desorption energy in the sub-monolayer and multilayer coverage regimes, respectively. Multilayer desorption shows typical zero order kinetics with coincident leading edge behaviour. The desorption energy can therefore be determined by an Arrhenius analysis of the leading edge region as described previously (Habenschaden & Küppers, 1984; De Jong & Niemantsverdriet, 1990). We obtained multilayer desorption energies of = (6.7 kJ for CO, = (11.4 kJ for CH4, = (8.3 kJ for O2 and = (21.4 kJ for CO2. The multilayer desorption energies agree within experimental error with the values obtained from other measurements on different surfaces such as non-porous amorphous solid water (), crystalline water ice (), amorphous silicate (SiOx), gold (Au), potassium bromide (KBr), graphene, amorphous silica, highly oriented pyrolytic graphite (HOPG), magnesium oxide (MgO) and methanol:water (CH3OH:H2O) mixed ice as listed in Table LABEL:table1. The multilayer desorption energies would be expected to be similar to the sublimation energies, also listed in Table LABEL:table1 for comparison. The desorption energy of CO shows excellent agreement with sublimation energy values. However, for CH4 (Bondi, 1963) and O2 (Lide, 1993) the desorption energy is slightly higher than the sublimation energy. For CO2 the measured desorption energy is significantly lower than the reported sublimation energy (Bryson III et al., 1974), which is likely due to this being measured at a temperature of 102 K which is significantly higher than the typical desorption temperature of 80 K in the present measurements. The desorption order () and the pre-exponential factor () in ML s-1 (1 ML is commonly defined as 1015 molecules cm-2) for multilayer desorption of CO, CH4, O2 and CO2 from different surfaces are also listed in Table LABEL:table1 for comparison. The multilayer pre-exponential factors for CH4, O2 and CO2 are in good agreement with other studies while that for CO is several orders of magnitude smaller. We note that at a temperature of 27 K, corresponding to the onset desorption temperature for CO, transition state theory would indicate a lower limit of ML s-1. The reason for the low value obtained remains unclear, given the apparent agreement of the desorption energy, and we suggest use of values around ML s-1, consistent with this limit and other works.
For the sub-monolayer regime, the Redhead peak maximum method (Redhead, 1962) is generally used to obtain the desorption energy. In the present case we, however, observe a coverage dependent desorption energy which means that there is no unique desorption energy. Rather, we have inverted the Polanyi-Wigner equation to obtain an expression for the coverage dependent desorption energy () reflecting this distribution, assuming first order desorption kinetics, i.e., :
| (3) |
This analysis was performed for each species and all initial coverages up to 1 ML, assuming a pre-exponential factor = 1012 s-1 for CO, CH4 and O2 and = 1013 s-1 for CO2 molecule. These values are consistent with the mobile limit in transition state theory (TST) (Laidler et al., 1940) at the typical desorption temperature range observed for each molecule. According to TST, the is determined by the change in entropy in going from the adsorbed to the gas phase. Smith et al. (2014b) used similar arguments to obtain a value of s-1 for CO2.
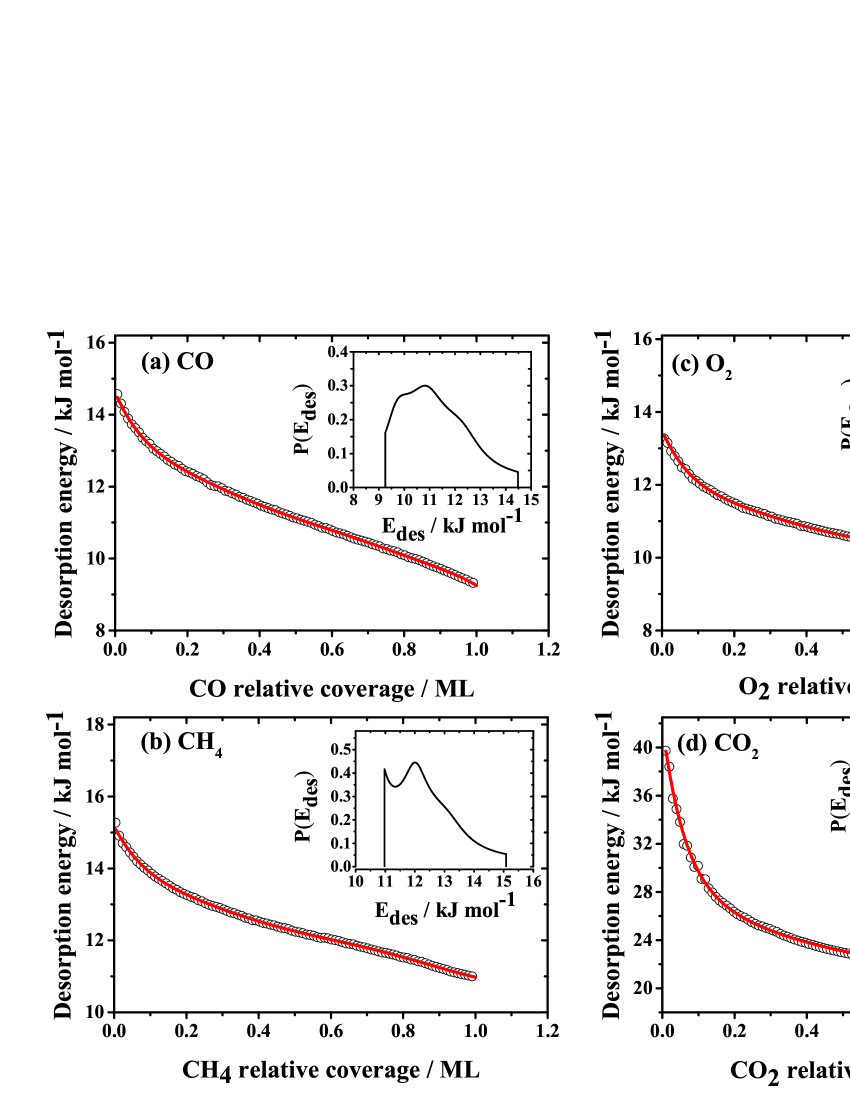
Figure 4 shows the resulting desorption energy as a function of coverage obtained using Equation 3 for ML for (a) CO, (b) CH4, (c) O2 and (d) CO2. For other smaller initial coverages (data not shown), the desorption energy curves are coincident with those obtained for ML. Furthermore, a 7th order polynomial fit (in red) was used to fit the resulting desorption energy curve for CO, CH4 and O2 and a bi-exponential decay fit (also in red) for CO2 as shown in Figure 4. It should be noted that these functional forms are purely empirical and provide a convenient way to include the coverage dependence of the desorption energy in kinetic simulations. From Figure 4 the CO2 coverage dependent desorption energy curve is clearly different to those for CO, CH4 and O2. In case of CO, CH4 and O2 the desorption energy curves extend over 4 to 5 kJ mol-1 whereas for CO2 a spread of more than ca. 20 kJ mol-1 is observed. The highest desorption energies are therefore 60, 29, 46 and 82 % larger than the lowest energy sites for CO, O2, CH4 and CO2, respectively.
The coverage dependent desorption energy can be converted to the corresponding desorption energy distributions, according to (Zubkov et al., 2007):
| (4) |
The resulting distributions are shown in the insets to Figure 4. Figure 4 (a) demonstrates that the desorption energy of CO is dominated by values of 9.5-12.0 kJ mol-1. In Figure 4 (b) the desorption energy of CH4 is dominated by values of 11.5-13.0 kJ mol-1. Figure 4 (c) illustrates that the desorption energy is dominated by values of 9.8-11.5 kJ mol-1 for O2 and Figure 4 (d) demonstrates the desorption energy are dominated by values close to 23 kJ mol-1 for CO2. However, the desorption tail at higher temperature means that desorption energies as high as 14.5 kJ mol-1, 15.1 kJ mol-1, 13.4 kJ mol-1 and 40 kJ mol-1 are present for CO, CH4, O2 and CO2, respectively. Table LABEL:table2 lists the desorption energy ranges obtained in the present work and compares these to similar studies utilizing different substrates some of which are already listed in Table LABEL:table1. In addition, measurements on porous amorphous solid water (), meteorite nanoparticles and titanium oxide (TiO2) are also listed. The desorption order () and pre-exponential factor () are also listed. The monolayer energy values in Table LABEL:table2 correspond to the lowest desorption energy, observed at saturation coverage. For systems in Table LABEL:table2 where no desorption energy range is quoted, this is due to a single desorption energy having been extracted by use of either the Redhead method (Mautner et al., 2006; Ulbricht et al., 2006) or an Arrhenius analysis of the leading edge in the sub-monolayer coverage regime (Burke & Brown, 2010; Edridge et al., 2013).
Table LABEL:table2 furthermore shows that all four molecules exhibit a larger desorption energy distribution on forsterite(010) as compared to other surfaces in similar studies except for ASW (Smith et al., 2015) and oxides. In the case of oxide surfaces the broader desorption energy distribution is much larger, as observed in the desorption of CH4 from MgO (Dohnálek et al., 2002) and also CO2 from TiO2 (Smith et al., 2014a). Similar to the silicate surfaces studied here, these surfaces also provide multiple adsorption sites that can result in different binding energies. For TiO2(110), CO2 shows site specific desorption peaks corresponding to metal and oxygen sites. In case of MgO(100), and forsterite(010) in the present work, single broad desorption peaks are instead observed, leading to coverage-dependent desorption energies.
| Molecule | Surface | Multilayer energy | Sublimation energy | Reference | ||
|---|---|---|---|---|---|---|
| (ML s-1) | (kJ ) | (kJ ) | ||||
| CO | Mg2SiO4(010) | 0 | 6.7 | this work | ||
| 0 | 7.1 | 6.9 | Noble et al. (2012) | |||
| 0 | 7.1 | 7.1 | Noble et al. (2012) | |||
| SiOx | 0 | 7.1 | 6.9 | Noble et al. (2012) | ||
| Au | 0 | 7.2 | 7.1 | Acharyya et al. (2007) | ||
| Polycrystalline Au | 0 | 7 | 7.1 | Bisschop et al. (2006) | ||
| 0 | 7 | 6.9 | Collings et al. (2003) | |||
| KBr | 0 | 6.5 | 7.4 | Martín-Doménech et al. (2014) | ||
| Graphene | 0 | 4.1 | 7.6 | Smith et al. (2015) | ||
| Amorphous silica | 0.03 | 1 | 7.3 | Collings et al. (2015) | ||
| - | - | - | - | 6.9 | Lide (1993) | |
| CH4 | Mg2SiO4(010) | 0 | 11.4 | this work | ||
| MgO(100) | 0 | 1 | 13 | Dohnálek et al. (2002) | ||
| HOPG | 0 | 4 | 11 | Ulbricht et al. (2006) | ||
| Graphene | 0 | 2.5 | 9.9 | Smith et al. (2015) | ||
| - | - | - | - | 9.2 | Bondi (1963) | |
| O2 | Mg2SiO4(010) | 0 | 8.3 | this work | ||
| 0 | 6.9 | 7.5 | Noble et al. (2012) | |||
| 0 | 7 | 7.8 | Noble et al. (2012) | |||
| SiOx | 0 | 6.9 | 7.4 | Noble et al. (2012) | ||
| Au | 0 | 6.9 | 7.6 | Acharyya et al. (2007) | ||
| Graphene | 0 | 3.2 | 8.6 | Smith et al. (2015) | ||
| HOPG | 0 | 8 | 9 | Ulbricht et al. (2006) | ||
| Au | 0 | 7 | 7.7 | Fuchs et al. (2006) | ||
| Amorphous silica | -0.07 | 1 | 7.5 | Collings et al. (2015) | ||
| - | - | - | - | 7.3 | Lide (1993) | |
| CO2 | Mg2SiO4(010) | 0 | 21.4 | this work | ||
| 0 | 9.3 | 18.8 | Noble et al. (2012) | |||
| 0 | 9.5 | 19.6 | Noble et al. (2012) | |||
| SiOx | 0 | 9.3 | 18.9 | Noble et al. (2012) | ||
| KBr | 0 | 5.2 | 21.7 | Martín-Doménech et al. (2014) | ||
| CO2 | 0 | 22.4 | Sandford & Allamandola (1990) | |||
| HOPG | 0 | 1.1 | 24.8 | Burke & Brown (2010) | ||
| 0 | 2.1 | 25.4 | Edridge et al. (2013) | |||
| CH3OH:H2O | 0 | 2.3 | 24.3 | Edridge et al. (2013) | ||
| 0 | 23.8 | Sandford & Allamandola (1990) | ||||
| HOPG | 0 | 6 | 23 | Ulbricht et al. (2006) | ||
| - | - | - | - | 27.2 | Bryson III et al. (1974) |
| Molecule | Surface | Monolayer energy | Energy distribution | Reference | ||
| (s-1) | (kJ ) | (kJ ) | ||||
| CO | Mg2SiO4(010) | 1 | 1 | 9.3 | 14.5-9.2 | this work |
| 1 | 1 | 14.2-8.6 | He et al. (2016) | |||
| 1 | 1 | 12.3-8.1 | He et al. (2016) | |||
| 1 | 1 | 7.2 | 10.9-7.2 | Noble et al. (2012) | ||
| 1 | 1 | 8.4 | 11.1-8.4 | Noble et al. (2012) | ||
| SiOx | 1 | 1 | 7.2 | 11.8-7.2 | Noble et al. (2012) | |
| Graphene | 0 | 1.9 | 12.5 | 12.5-7.5 | Smith et al. (2015) | |
| 1 | 3.5 | 11.8 | 16-11 | Smith et al. (2015) | ||
| HOPG | 1 | 2 | 13 | Ulbricht et al. (2006) | ||
| Meteorite | 1 | 1 | 13.5 | Mautner et al. (2006) | ||
| 1 | 5 | 9.8 | Collings et al. (2003) | |||
| Amorphous silica | 1 | 1 | 12.2-8.2 | Collings et al. (2015) | ||
| CH4 | Mg2SiO4(010) | 1 | 1 | 11 | 15.1-11.5 | this work |
| 1 | 1 | 12.2-9.3 | He et al. (2016) | |||
| Graphene | 0 | 2.1 | 14.9 | 15-10 | Smith et al. (2015) | |
| 1 | 9.8 | 11.4 | 16-11.4 | Smith et al. (2015) | ||
| MgO(100) | 1 | 1 | 20-11 | Dohnálek et al. (2002) | ||
| HOPG | 1 | 4 | 17 | Ulbricht et al. (2006) | ||
| O2 | Mg2SiO4(010) | 1 | 1 | 9.8 | 13.4-9.7 | this work |
| 1 | 1 | 7.6 | 9.7-7.6 | Noble et al. (2012) | ||
| 1 | 1 | 8.1 | 9.6-8.1 | Noble et al. (2012) | ||
| SiOx | 1 | 1 | 7.7 | 10.4-7.7 | Noble et al. (2012) | |
| 1 | 1 | 11.1-7.7 | He et al. (2016) | |||
| Graphene | 0 | 1.1 | 11.8 | 12-8.5 | Smith et al. (2015) | |
| 1 | 5.4 | 9.2 | 14-9.2 | Smith et al. (2015) | ||
| HOPG | 1 | 8 | 12 | Ulbricht et al. (2006) | ||
| Amorphous silica | 1 | 1 | 11.9-8 | Collings et al. (2015) | ||
| CO2 | Mg2SiO4(010) | 1 | 1 | 20.9 | 40- 21.1 | this work |
| Olivine | 1 | 1 | 80-30 | Smith et al. (2014b) | ||
| 1 | 1 | 18.6 | 19.5-18.6 | Noble et al. (2012) | ||
| 1 | 1 | 19.6 | 20.9-19.6 | Noble et al. (2012) | ||
| SiOx | 1 | 1 | 18.9 | 25-18.9 | Noble et al. (2012) | |
| TiO2 | 1 | 4.6 | 64-36 | Smith et al. (2014a) | ||
| HOPG | 1 | 6 | 24 | Ulbricht et al. (2006) | ||
| HOPG | 0.73 | 5.3 | 19.8 | Burke & Brown (2010) | ||
| HOPG | 0.73 | 9.9 | 20.2 | Edridge et al. (2013) | ||
| 1.09 | 2.7 | 17.5 | Edridge et al. (2013) |
4 Discussion
Experimental TPD traces for all four molecules described here show multilayer desorption sharing a common leading edge at high initial coverages. Multilayer desorption occurs from several layers of molecules on the surface and hence the underlying surface does not influence the desorption kinetics as strongly as for the monolayer, as adsorbate-adsorbate interactions dominate over adsorbate-substrate interactions. This is evident from the multilayer desorption energy of kJ mol-1 for CO ice on forsterite(010) which is in good agreement with previous studies of CO deposited on a variety of substrates as listed in Table LABEL:table1. The agreement in multilayer desorption energy value is excellent in the case of CO desorption from amorphous silica (Collings et al., 2015) and from amorphous silicates (Noble et al., 2012; Collings et al., 2015). In the case of CH4, there are no multilayer desorption measurements from silicate surfaces. The present value is, however, in good agreement with the multilayer desorption energy for desorption from HOPG (Ulbricht et al., 2006).The multilayer desorption energy of O2 agrees with those obtained for graphene (Smith et al., 2015) and for amorphous silicate and silica surfaces (Noble et al., 2012; Collings et al., 2015). For CO2 the multilayer desorption energy of kJ mol-1 shows reasonable agreement with values reported previously as listed in Table LABEL:table1. It is evident that there is some spread in the multilayer desorption energies obtained for CO2. Our multilayer desorption energy is in excellent agreement with the values reported for a KBr substrate by Martín-Doménech et al. (2014). However, the values reported for an HOPG surface (Ulbricht et al., 2006; Burke & Brown, 2010) and by Edridge et al. (2013) for ASW and a methanol-water mixed ice surface, is somewhat higher. On the other hand, the values reported by Noble et al. (2012) for water and silicate are somewhat lower than our value.
For sub-monolayer coverages we see a trailing edge for all molecules which extends to higher temperatures than would be expected for simple first order desorption from a single type of adsorption site. Such behaviour is similar to our previous studies of NH3 desorption from forsterite(010) (Suhasaria et al., 2015). We previously concluded that this desorption tail arises from the presence of a variety of adsorption sites on the forsterite surface due to presence of species such as O, Mg, Si and Fe which is also consistent with previous work by Smith et al. (2014b) on crystalline olivine(011). Thrower et al. (2009) and Collings et al. (2015) showed that the amorphous silica surface also presents a range of binding sites which influences the desorption kinetics of C6H6 and volatile species such as O2 and CO. Similarly, NH3 desorption showed a similar behaviour when deposited on an amorphous silicate surface (He et al., 2015). Furthermore, we observe that trailing edges for different initial coverages are aligned which indicates that the molecules are able to diffuse on the surface and find the high energy binding sites prior to adsorption. However, the nature of the TPD experiment means that we are unable to determine at which point this mobility becomes possible i.e. the molecules may begin to diffuse at any point during the heating process. Thus, the coverage dependent desorption energies we extract represent the available sites rather than necessarily providing insight into the population of these sites upon adsorption.
We observe that for CO, O2 and CO2 on the forsterite(010) surface, generally higher desorption energies are present compared to previous measurements on amorphous silicate and silica surfaces (Noble et al., 2012; Collings et al., 2015), as well as on H2O or HOPG, using similar pre-exponential factors as evident from Table LABEL:table2. Overall it is apparent that these molecules tend to bind with higher energy to the crystalline silicate forsterite(010) surface. For CH4, there are no reported desorption measurements for silicate surfaces. The desorption of CO2 from the olivine surface has been measured by Smith et al. (2014b), yielding a desorption energy range of 30-80 kJ mol-1. These energies are significantly higher than those for forsterite(010) which are in the range 21.1-40 kJ mol-1. This could be due to the use of a pre-exponential factor seven orders of magnitude larger than that employed in the present study. Such a high value for pre-exponential is difficult to reconcile with the desorption of a small molecule such as CO2 where significant entropic effects are not likely to play a large role in increasing the value several orders of magnitude from the mobile limit.
The observed appearance of the multilayer peak prior to completion of the monolayer for CO, CH4 and O2 is indicative of island growth on the surface. At low coverages, these molecules are bound to the silicate surface due to the strong adsorbate-substrate interaction revealed by the higher desorption energy tail. However, as the coverage increases progressively lower energy binding sites are populated and the probability of an incoming molecule landing on top of adsorbate covered regions becomes more likely. The clear separation between the monolayer and multilayer desorption features results from the multilayer desorption energy being somewhat smaller than the lowest monolayer desorption energy. For CO2 there appears to be be a gradual progression from occupation of monolayer sites to formation of the monolayer, most likely arising from the overlap of the desorption energies from the most weakly binding monolayer sites and the multilayer. Similar behaviour was observed in the case of desorption of NH3 from the same forsterite(010) surface (Suhasaria et al., 2015).
5 Astrophysical Implications
Laboratory experiments can provide the necessary kinetic parameters to simulate astrophysical processes. However, laboratory experiments are performed on a much shorter time scale compared to the typical lifetime of interstellar clouds (ca. yr.). During this timescale, in dense clouds, icy mantles are formed on the grain surfaces through a combination of freeze-out (e.g. CO) and recombinative surface reactions (e.g. to form H2O and CH3OH). As these clouds collapse, eventually leading to star formation, the temperature of the grains rises and molecules thermally desorb. To understand thermal desorption in the early stages of star formation on an astrophysical time scale, we have used a heating rate of 1 K century-1as proposed by Viti & Williams (1999) for hot cores. We have used our experimentally derived kinetic parameters to simulate the desorption traces for 1 ML coverage by numerically integrating the Polanyi-Wigner equation and incorporating the coverage dependent desorption energy () determined from our laboratory measurements. First order desorption kinetics and a pre-exponential factor of or depending on the molecules, as discussed above, were used in performing the simulations. A plot of the surface coverage against time was obtained. We have additionally performed similar simulations for water ice (Noble et al., 2012; He et al., 2016) and silicate (Noble et al., 2012) surfaces using the kinetic parameters reported in the other studies listed in Table LABEL:table2. In Figure 5, we compare the simulations for the different substrates. We note that an apparent mistake in one of the coefficients for precludes comparison with CO2 on the amorphous silicate surface reported by Noble et al. (2012).
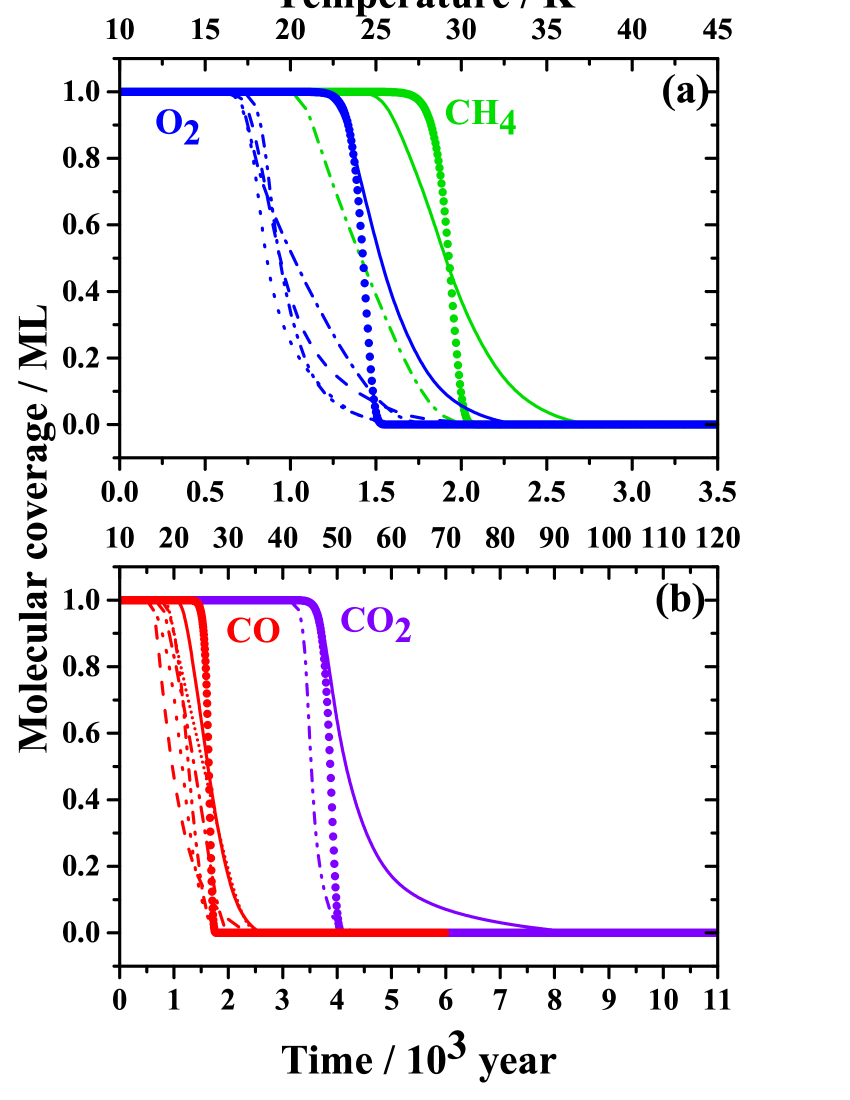
Figure 5 shows the surface coverage versus desorption time for CO (red), CH4 (green), O2 (blue) and CO2 (violet). The substrate used is indicated by the line style, (dash dot lines; (He et al., 2016)), (short dot lines; (He et al., 2016)), (dot lines; (Noble et al., 2012)), H2O(c) (dash dot dot lines; (Noble et al., 2012)), SiOx (dash lines; (Noble et al., 2012)), forsterite(010) (solid lines; this work).
In addition, the simulated desorption coverage curves for a constant desorption energy are shown in closed circles for each molecule to compare the effect of coverage dependent desorption energy. The constant desorption energy is calculated from the Redhead approximation method as mentioned in Section 3.3. For this calculation the maximum peak temperature is chosen at the 1 ML coverage which gives values of 10.8 kJ mol-1 (CO), 12 kJ mol-1 (CH4), 9.9 kJ mol-1 (O2) and 21.1 kJ mol-1 (CO2), representing the lowest energy sites present in the distribution. It is evident from the Figure 5 (a), that the onset of desorption of both CH4 and O2 occurs at a higher temperature and a later time (1200 and 1450 yr.) from the forsterite(010) as compared to the other surfaces and these molecules remain longer on the crystalline forsterite surface before they are fully desorbed. For CH4 desorbing from the forsterite(010) surface (green solid lines) takes 750 years longer to fully desorb in comparison to the (green dash dot lines) and O2 from forsterite(010) surface takes 500 years more on average compared to other surfaces shown in Figure 5 (a).
Similarly, from Figure 5 (b), we observe that much of the CO2 remains on the forsterite(010) surface (violet solid lines) for 3900 years longer in comparison to the surface (violet dash dot dot lines) and the onset of desorption is 300 years later on forsterite(010) surface compared to surface. CO also shows a delay in the onset of desorption from forsterite(010) surface by an average of 200 years as evident from Figure 5 (b) and remains on the forsterite surface for longer times. We observe that the desorption times for both O2 and CO from crystalline silicate (forsterite) are longer than from amorphous silicates by ca. 250 and 550 years respectively.
Longer desorption timescales mean that more molecules remain in the solid state for a longer time, increasing the probability that they actively take part in grain surface chemistry, compared to current astrochemical gas-grain models in which a single desorption energy is included.
6 Conclusions
We have investigated the thermal desorption of CO, CH4, O2 and CO2 from a forsterite(010) model grain surface representative of the silicate family of grains. We have characterized this stable crystalline silicate surface using AFM measurements which confirm atomic flatness over large areas. Morphological effects as observed in the case of rough and amorphous surfaces are therefore expected to be less important with the adsorption and desorption behaviour depending on the chemical nature of the sites available. Thermal desorption in the multilayer coverage regime for all the species investigated display coincident leading edges consistent with zero order desorption kinetics. This behaviour is in agreement with previous studies and demonstrates that, beyond the first few layers, the desorption behaviour is effectively insensitive to the nature of the underlying substrate. On the other hand, in the sub-monolayer coverage regime, all four molecules display coincident trailing edges that extend to high temperature. This indicates the presence of a coverage dependent desorption energy which could arise, either as a result of the present of a distribution of sites on the surface which present different binding energies, or the effect of increasing inter-molecular repulsion between adsorbate molecules with increasing coverage. While our measurements allow us to determine the range of possible desorption energy values, the TPD technique employed does not allow us to distinguish between these two possibilities. We, however note, that a variety of adsorption sites on the crystalline forsterite(010) surface is not unreasonable, and the observed behaviour may arise as a result of a combination of the two effects. We observe that for CO, CH4 and O2, the growth of multilayers commences prior to saturation of the monolayer peak while, CO2, shows a desorption behaviour which smoothly shifts from the sub-monolayer to multilayer as a result of the similarity between the multilayer and minimum monolayer desorption energies. In all cases, the forsterite(010) surface results in desorption energy distributions that extend to higher energy than other surfaces such as ASW, crystalline water and amorphous silica, suggesting the presence of higher energy binding sites. By using kinetic simulations employing astrophysically relevant heating rates, the onset of desorption for these species thus occurs at later times for forsterite(010) than other surfaces, and the extended desorption timescale results in significantly longer residence times for the most strongly bound molecules when compared to the other substrates.
7 Acknowledgements
We acknowledge financial support from the European Commission’s 7th Framework Programme through the "LASSIE" ITN under Grant Agreement Number 238258, the NRW International Graduate School of Chemistry, Münster. We would also like to acknowledge the European union (EU) and Horizon 2020 funding awarded under the Marie Sklodowska-Curie action to the EUROPAH consortium, grant number 722346.
References
- Acharyya et al. (2007) Acharyya K., Fuchs G. W., Fraser H. J., Van Dishoeck E. F., Linnartz H., 2007, A&A, 466, 1005
- Amiaud et al. (2007) Amiaud L., Dulieu F., Fillion J.-H., Momeni A., Lemaire J.-L., 2007, J. Chem. Phys., 127, 144709
- Bisschop et al. (2006) Bisschop S. E., Fraser H. J., Öberg K. I., Van Dishoeck E. F., Schlemmer S., 2006, A&A, 449, 1297
- Bondi (1963) Bondi A., 1963, J. Chem. Eng. Data, 8, 371
- Boogert et al. (2015) Boogert A. C. A., Gerakines P. A., Whittet D. C. B., 2015, ARA&A, 53, 541
- Bryson III et al. (1974) Bryson III C. E., Cazcarra V., Levenson L. L., 1974, J. Chem. Eng. Data, 19, 107
- Burke & Brown (2010) Burke D. J., Brown W. A., 2010, Phys. Chem. Chem. Phys., 12, 5947
- Clemens et al. (2013) Clemens A., Hellberg L., Grönbeck H., Chakarov D., 2013, Phys. Chem. Chem. Phys., 15, 20456
- Collings et al. (2003) Collings M. P., Dever J. W., Fraser H. J., McCoustra M. R. S., 2003, Ap&SS, 285, 633
- Collings et al. (2015) Collings M. P., Frankland V. L., Lasne J., Marchione D., Rosu-Finsen A., McCoustra M. R. S., 2015, MNRAS, 449, 1826
- De Jong & Niemantsverdriet (1990) De Jong A. M., Niemantsverdriet J. W., 1990, Surf. Sci., 233, 355
- Dohnálek et al. (2001) Dohnálek Z., Kimmel G. A., Joyce S. A., Ayotte P., Smith R. S., Kay B. D., 2001, J. Phys. Chem. B, 105, 3747
- Dohnálek et al. (2002) Dohnálek Z., Smith R. S., Kay B. D., 2002, J. Phys. Chem. B, 106, 8360
- Dohnálek et al. (2006) Dohnálek Z., Kim J., Bondarchuk O., White J. M., Kay B. D., 2006, J. Phys. Chem. B, 110, 6229
- Edridge et al. (2013) Edridge J. L., Freimann K., Burke D. J., Brown W. A., 2013, Phil. Trans. R. Soc. A, 371, 20110578
- Escamilla-Roa et al. (2017) Escamilla-Roa E., Moreno F., López-Moreno J. J., Sainz-Díaz C. I., 2017, Planet. Space Sci., 135, 17
- Fuchs et al. (2006) Fuchs G. W., et al., 2006, Faraday Discuss., 133, 331
- Gail (2004) Gail H.-P., 2004, A&A, 413, 571
- Goesmann et al. (2015) Goesmann F., et al., 2015, Science, 349, aab0689
- Goldsmith et al. (2011) Goldsmith P. F., et al., 2011, ApJ, 737, 1
- Habenschaden & Küppers (1984) Habenschaden E., Küppers J., 1984, Surf. Sci., 138, L147
- Hanner (1999) Hanner M. S., 1999, Space Sci. Rev., 90, 99
- Harker & Desch (2002) Harker D. E., Desch S. J., 2002, ApJL, 565, L109
- He et al. (2015) He J., Vidali G., Lemaire J.-L., Garrod R. T., 2015, ApJ, 799, 49
- He et al. (2016) He J., Acharyya K., Vidali G., 2016, ApJ, 825, 89
- Horcas et al. (2007) Horcas I., Fernández R., Gomez-Rodriguez J., Colchero J., Gómez-Herrero J., Baro A., 2007, Rev. Sci. Instrum., 78, 013705
- Katz et al. (1999) Katz N., Furman I., Biham O., Pirronello V., Vidali G., 1999, ApJ, 522, 305
- Kemper et al. (2004) Kemper F., Vriend W. J., Tielens A. G. G. M., 2004, ApJ, 609, 826
- Kerisit et al. (2013) Kerisit S., Bylaska E. J., Felmy A. R., 2013, Chem. Geology, 359, 81
- King (1975) King D. A., 1975, Surf. Sci., 47, 384
- King et al. (2010) King H. E., Stimpfl M., Deymier P., Drake M. J., Catlow C. R. A., Putnis A., de Leeuw N. H., 2010, E&PSL, 300, 11
- Laidler et al. (1940) Laidler K. J., Glasstone S., Eyring H., 1940, J. Chem. Phys., 8, 659
- Larsson et al. (2007) Larsson B., et al., 2007, A&A, 466, 999
- Li & Draine (2002) Li A., Draine B. T., 2002, ApJ, 564, 803
- Lide (1993) Lide D. R., 1993, CRC Handbook of Chemistry and Physics: A Ready-reference Book of Chemical and Physical Data: 1993-1994. Boca Raton, FL:CRC press
- Martín-Doménech et al. (2014) Martín-Doménech R., Caro G. M., Bueno J., Goesmann F., 2014, A&A, 564, A8
- Mautner et al. (2006) Mautner M. N., Abdelsayed V., El-Shall M. S., Thrower J. D., Green S. D., Collings M. P., McCoustra M. R. S., 2006, Faraday Discuss., 133, 103
- Mumma & Charnley (2011) Mumma M. J., Charnley S. B., 2011, A&A, 49, 471
- Noble et al. (2012) Noble J. A., Congiu E., Dulieu F., Fraser H. J., 2012, MNRAS, 421, 768
- Redhead (1962) Redhead P. A., 1962, Vacuum, 12, 203
- Sallabi & Jack (2000) Sallabi A. K., Jack D. B., 2000, J. Chem. Phys., 112, 5133
- Sandford & Allamandola (1990) Sandford S. A., Allamandola L. J., 1990, ApJ, 355, 357
- Smith et al. (2014a) Smith R. S., Li Z., Chen L., Dohnálek Z., Kay B. D., 2014a, J. Phys. Chem. B, 118, 8054
- Smith et al. (2014b) Smith R. S., Li Z., Dohnálek Z., Kay B. D., 2014b, J. Phys. Chem. C, 118, 29091
- Smith et al. (2015) Smith R. S., May R. A., Kay B. D., 2015, J. Phys. Chem. B, 120, 1979
- Suhasaria et al. (2015) Suhasaria T., Thrower J. D., Zacharias H., 2015, MNRAS, 454, 3317
- Thrower et al. (2009) Thrower J. D., Collings M. P., Rutten F. J. M., McCoustra M. R. S., 2009, J. Chem. Phys., 131, 244711
- Ulbricht et al. (2006) Ulbricht H., Zacharia R., Cindir N., Hertel T., 2006, Carbon, 44, 2931
- Viti & Williams (1999) Viti S., Williams D. A., 1999, MNRAS, 305, 755
- Westphal et al. (2014) Westphal A. J., et al., 2014, Science, 345, 786
- Wright et al. (2016) Wright C. M., Do Duy T., Lawson W., 2016, MNRAS, 457, 1593
- Wyckoff (1982) Wyckoff S., 1982, Overview of comet observations. Comets. Univ. of Arizona Press, Tucson, p. 20
- Zubkov et al. (2007) Zubkov T., Smith R. S., Engstrom T. R., Kay B. D., 2007, J. Chem. Phys., 127, 184707