Is HESS J1912101 Associated with an Old Supernova Remnant?
Abstract
HESS J1912101 is a shell-like TeV source that has no clear counterpart in multiwavelength. Using CO and H i data, we reveal that molecular clouds (MCs), together with shocked molecular gas and high-velocity neutral atomic shells, are concentrated toward HESS J1912101. The prominent wing profiles up to seen in 12CO (=1–0 and =3–2) data, as well as the high-velocity expanding H i shells up to , exhibit striking redshifted-broadening relative to the quiescent gas. These features provide compelling evidences for large-scale perturbation in the region. We argue that the shocked MCs and the high-velocity H i shells may originate from an old supernova remnant (SNR). The distance to the SNR is estimated to be kpc based on the H i self-absorption method, which leads to a physical radius of 29.0 pc for the (0.7–2.0) years old remnant with an expansion velocity of km s-1. The +60 km s-1 MCs and the disturbed gas are indeed found to coincide with the bright TeV emission, supporting the physical association between them. Naturally, the shell-like TeV emission comes from the decay of neutral pions produced by interactions between the accelerated hadrons from the SNR and the surrounding high-density molecular gas.
1 INTRODUCTION
Shell-type supernova remnants (SNRs) are believed to be efficient accelerators of high-energy cosmic rays (CRs) through diffusive shock acceleration (e.g., see the recent review of Reynolds, 2008). Such strong shocks of young SNRs put considerable energy into accelerated particles of CRs, resulting in high-energy X-ray and -ray emission. On the other hand, pp-interactions and the subsequent decay of neutral pions will significantly enhance the -ray emission in high-density environments. Molecular clouds (MCs) near SNRs are thus promising sources of -ray emission because of their high densities. Recently, theoretical (e.g., Yamazaki et al., 2006; Fujita et al., 2009; Li & Chen, 2010; Ohira et al., 2011) and observational studies (e.g., Aharonian et al., 2008aa; Tian et al., 2008; Castro & Slane, 2010; Tavani et al., 2010; Ackermann et al., 2013) have been performed to investigate the high-energy -ray emission toward SNRs and their ambient molecular gas (e.g., see a summary in Slane et al., 2015).
HESS J1912101 is an extended TeV source that was discovered by Aharonian et al. (2008b) and displays the prominent shell appearance of the TeV emission from the further increased H.E.S.S. exposure (Puehlhofer et al., 2015). However, no firm conclusion on the nature of the source can be drawn, due to the lack of the counterpart of HESS J1912101 at other wavebands. The TeV source was speculated to associate with a high spin-down luminosity pulsar PSR J19131011 or an old SNR (Aharonian et al., 2008b). The pulsar wind nebulae (PWN) scenario may be excluded because of no detectable X-ray emission around PSR J19131011 and/or the geometrical centroid of HESS J1912101 (Chang et al., 2008) and the presence of the TeV shell-like structure. Therefore, the shell-like source of HESS J1912101 is probably a TeV SNR candidate (Puehlhofer et al., 2015; Gottschall et al., 2016), although no corresponding radio counterpart has been found to match the TeV shell structure yet.
The high angular resolution of the very-high-energy (VHE, 100 GeV) data, which is better than 01 for the H.E.S.S. observation, allows us to compare the TeV structure with that seen in other wavelengths with the precision of several arcmin. Because little corresponding radio and X-ray emission matches the high-energy source, typical structures of the molecular and/or atomic gas on a large scale (e.g., shells, arcs, and bubbles, etc.), together with possible kinematic signatures of the disturbed gas (e.g., molecular line broadenings, high-velocity structures, and large-velocity gradients, etc.), are useful and important in investigating the association between HESS J1912101 and its environment.
In this paper, we present the molecular and atomic line study toward the shell-like TeV source of HESS J1912101. Both of CO and H i datasets reveal the partial shell-like structures and high-velocity gas emission in the field of view (FOV) of the TeV source, indicating an energetic source with high momentum and mechanical energy injection there. We suggest that the energetic source is an old SNR that is interacting with the surrounding km s-1 giant MC (GMC) located at a near kinematic distance of 4.1 kpc. Accordingly, the shell-like TeV -ray emission of HESS J1912101 arises from the interaction between the (0.7–2.0) years old SNR and its ambient dense molecular gas.
This paper is structured as follows. In Section 2, we briefly describe the CO observation, the data reduction, and other survey data used in the paper. In Section 3, we give our results of the shocked molecular gas and the high-velocity H i shells; investigate the association between the disturbed gas and an old SNR; and discuss the origin of the shell-like TeV emission of HESS J1912101. Finally, Section 4 summarizes the results.
2 CO and H i data
CO datasets are from the Milky Way Imaging Scroll Painting (MWISP111http://english.dlh.pmo.cas.cn/ic/, i.e., 12CO (=1–0), 13CO (=1–0), and C18O (=1–0) lines) and CO High-Resolution Survey (COHRS, 12CO (=3–2) line; Dempsey et al., 2013). The H i and 21 cm continuum emission data are from the VLA Galactic Plane Survey (VGPS; Stil et al., 2006).
The MWISP project is a large, unbiased, and highly sensitive CO, and its isotopes survey toward the Galactic plane using the 13.7 m millimeter-wavelength telescope located at Delingha, China. A Superconducting Spectroscopic Array Receiver (SSAR) system with a beam array (Shan et al., 2012) was used as the front end and a Fast Fourier Transform Spectrometer (FFTS) with a total bandwidth of 1 GHz was used as the back end. The half-power beamwidth (HPBW) of the telescope is about for the three lines. The typical rms noise level is about 0.5 K for 12CO (=1–0) at the channel width of 0.16 and 0.3 K for 13CO (=1–0) and C18O (=1–0) at 0.17. The final cube data were constructed with a grid spacing of . All data were reduced using the GILDAS software222http://ascl.net/1305.010 or http://www.iram.fr/IRAMFR/GILDAS.
The information of the 13.7 m telescope can be seen from the status report333http://www.radioast.nsdc.cn/mwisp.php. The detailed observing strategy, the instrument, and the quality of the CO observations can be found in our paper published recently (see Section 2 in Su et al., 2017). We summarize the data used in Table 1.
3 RESULTS AND DISCUSSIONS
3.1 CO emission and the shocked molecular gas
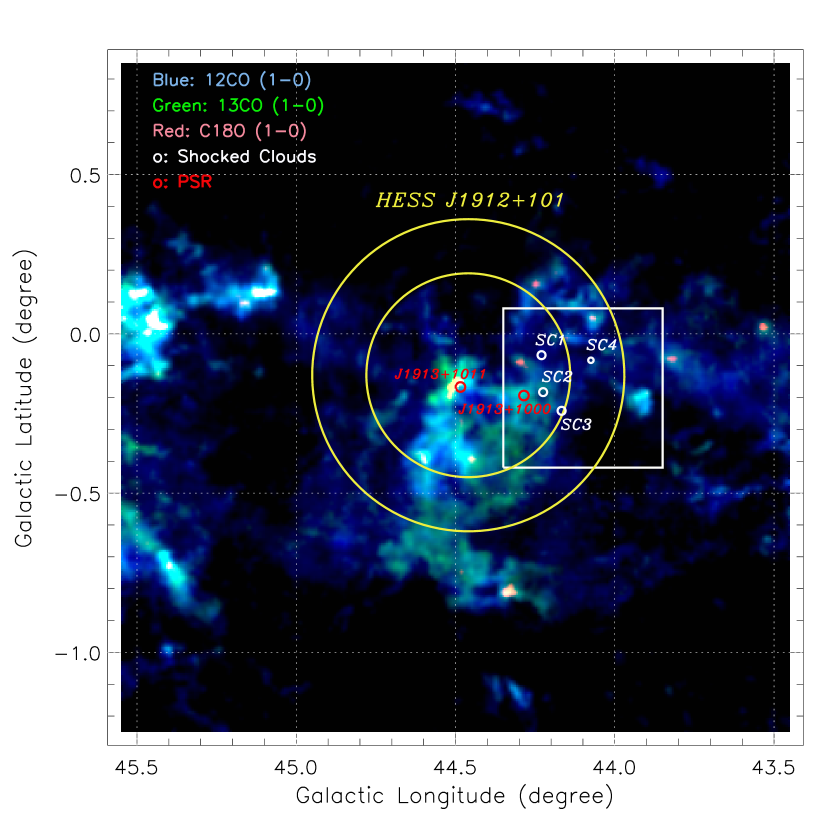
HESS J1912101 is a shell-like TeV source that is centered at ( 4446, 013) with an outer radius of 049 and an inner radius of 032 (Gottschall et al., 2016). Neither radio nor X-ray emission was detected toward the shell-like TeV source. Due to the significant extinction in the direction of the inner Galactic plane, optical observations are difficult to establish the nature of the source. Therefore, the submillimeter, millimeter, and centimeter emission is probably helpful in studying the nature of the counterpart of HESS J1912101.
Using the high-quality CO data, we find that molecular gas at a systemic velocity of +60 is concentrated toward the extended emission of the TeV source. Generally, 12CO emission, which is widely distributed in the FOV, is more diffuse and extended than that of 13CO. After carefully checking the CO data channel by channel, we distinguish several molecular partial shell-like structures toward the TeV source of HESS J1912101. These partial shells are relatively prominent in 13CO emission, which exhibits distinct velocity-coherent structure over the long curved line (length and width; see the thick-dashed gold lines in Figure 2). Meanwhile, optically thin C18O emission is also detected in some regions of partial shells, indicating the high-density there due to its rarer abundance.
Figure 1 shows the three-color intensity image of CO emission (12CO in blue, 13CO in green, and C18O in red; =58.5–62.0 ) toward the TeV source. Assuming the 13CO abundance of (H2)/CO) (Frerking et al., 1982) and the C18O abundance of (H2)/(C18O) (Castets & Langer, 1995), the H2 number density of the dense part of the molecular shells traced by the optically thin 13CO emission (denoted by the thick-dashed gold lines in Figure 2) is 400–1600 cm-3 at a distance of 4.1 kpc (see Section 3.3) with the shell’s width of . Adopting the mean CO-to-H2 mass conversion factor = cm-2K-1km-1s (Bolatto et al., 2013), the total mass of the molecular partial shells traced by the optically thick 12CO emission is about several thousands solar mass at a distance of 4.1 kpc. The total mass estimated from 13CO and C18O emission is somewhat less than that from 12CO emission. The mean volume density of the =+60 MCs is approximately several hundreds per cm3, while the density in some dense regions should be cm-3.
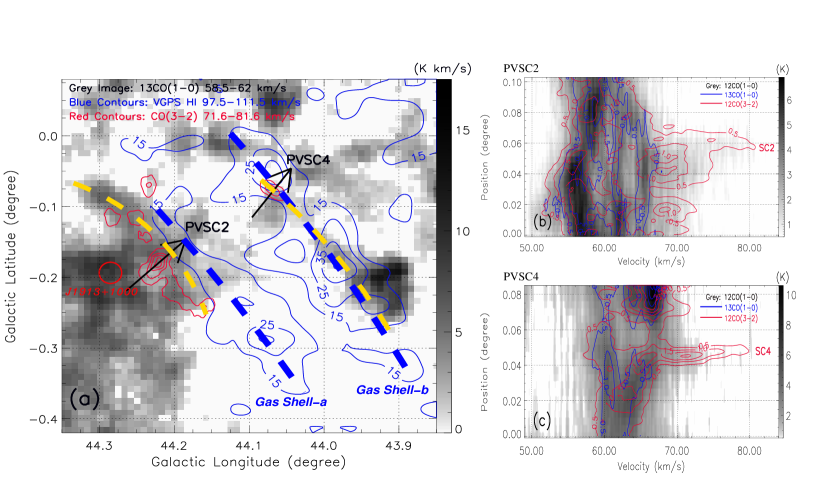
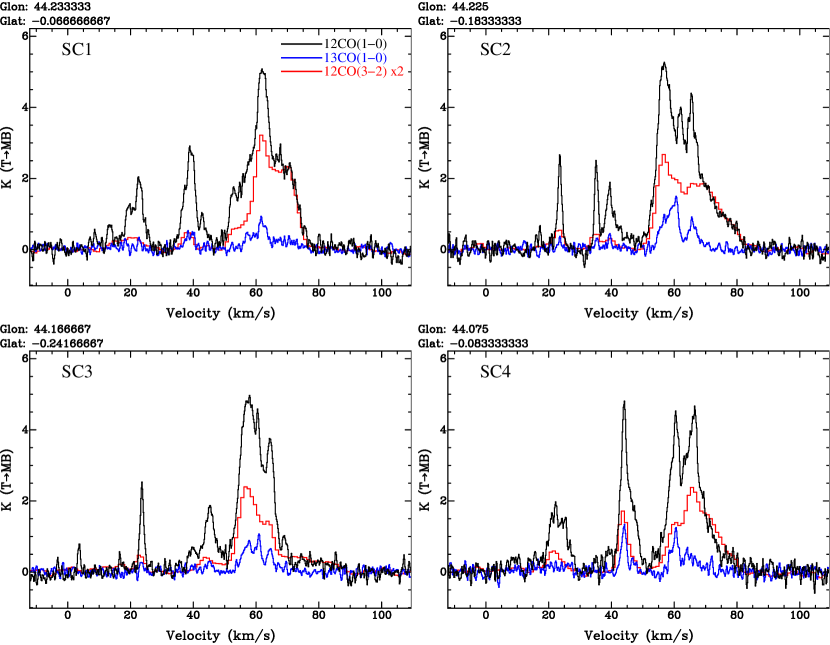
Furthermore, in combination with the MWISP and COHRS data, we identify several shocked regions projected toward the interior of the TeV shell of HESS J1912101 (see the four white circles of SC1–SC4 in Figure 1). By comparing the broadened 12CO (=1–0 and 3–2) lines with the narrow 13CO line, we can illustrate that the molecular gas in some regions exhibits striking redshifted-broadening with respect to the ambient MCs at +60 . As shown in Figures 2, the broadened red wing of 12CO (=3–2) emission is obviously up to from positionvelocity (PV) diagrams of SC2 and SC4. The typical spectra of the four regions, which display prominent redshifted-broadenings in 12CO (=1–0 and 3–2) emission, are shown in Figure 3.
Broadened profiles of 12CO emission usually come from the turbulent molecular gas that is readily and significantly influenced by local shocks. On the contrary, the optically thin 13CO emission is mainly from the quiescent and unperturbed MCs. Therefore, such features like broadenings, wings, or asymmetries in 12CO spectra with respect to 13CO line show convincing evidence for shocked and disrupted molecular material, which often occurs in SNR–MC interacting systems (e.g., Frail & Mitchell, 1998; Reach et al., 2005; Jiang et al., 2010; Kilpatrick et al., 2016).
SC2, which is likely a part of the shocked broad molecular line (BML) shell (see the red contours near the arrow of PVSC2 in Figure 2), exhibits the association between the shocked medium at =65–80 from the 12CO (=1–0 and 3–2) emission and the surrounding quiescent MCs at =+59.6 from the 13CO emission (see Figure 2). A piece of shocked gas or SC4 identified from broadened 12CO (=3–2) emission (2005, see the red contours near the arrow of PVSC4 in Figure 2) also displays the spatial coincidence with the nearby 13CO partial shell structure at the peak velocity of =+60.3 . We make a PV diagram perpendicular to the main axis of SC4 in Figure 2, in which the BML region of SC4 (the red contours) is distinct from the quiescent gas traced by 13CO emission (the blue contours). Especially, the shocked molecular gas shells traced by 12CO (=3–2) emission (the red contours in Figure 2) seem to resemble the unperturbed molecular shells traced by 13CO emission (the thick-dashed gold lines in Figure 2). These features imply that the shocked gas is indeed physically associated with the quiescent MCs at .
We try to investigate the distribution of the shocked gas in the whole region of HESS J1912101. However, the 12CO (=1–0) line profile may be contaminated by unrelated MCs along the same line of sight (LOS) in the direction of the inner Milky Way. Observations in higher CO transitions might show less confusion because the broadline emission in high is relatively strong with respect to the quiescent MCs. Unfortunately, the whole region of HESS J1912101 is not completely covered by the COHRS 12CO (=3–2) survey in the direction (see Table 1).
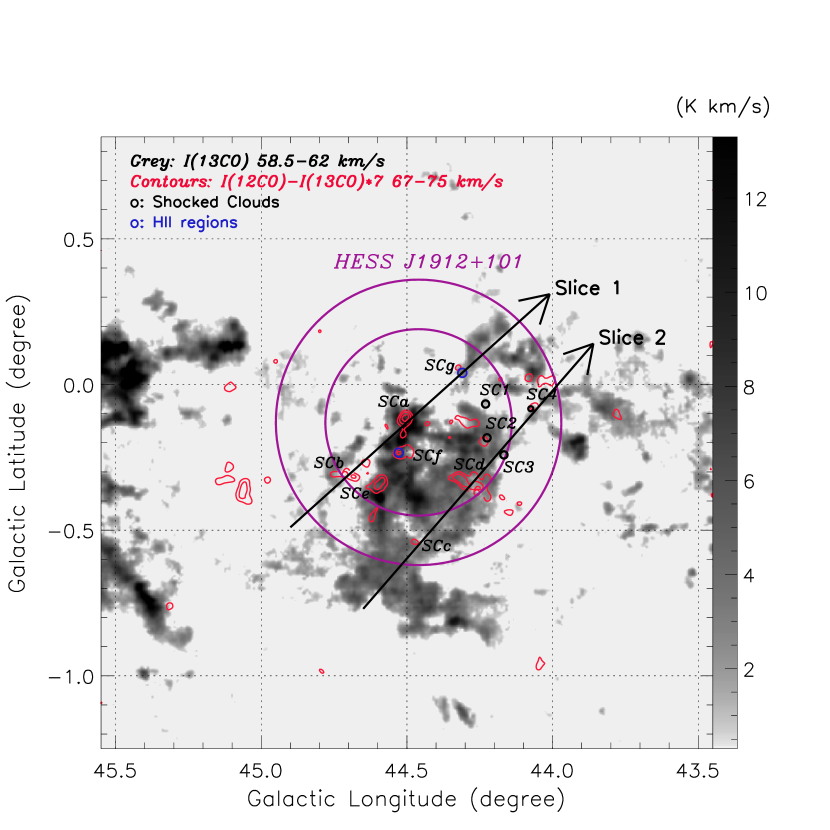
We attempt to construct a map of (12CO, ) (13CO, ) to illustrate the possible distribution of the shocked material, where (12CO, ) and (13CO, ) are the integrated intensity of 12CO (=1–0) and 13CO (=1–0) in the velocity range of to , respectively. Here, we adopt =+67 and =+75 . It roughly represents the velocity range of the possible redshifted CO wing component. The map will reveal the 12CO (=1–0) enhancement ( K ) in the velocity range of 67–75 , which may sketch the distribution of the shocked gas after subtracting the contribution of the unrelated CO emission (controlled by (13CO, )) in the whole FOV toward HESS J1912101.
The aim of the above operation is to reveal the potential redshifted-BML regions based on the 12CO and 13CO (=1–0) lines. Generally, the emission of typical MCs is optically thick for 12CO line and optically thin for 13CO line. On the contrary, the shocked molecular gas will exhibit optically thin 12CO emission with little 13CO emission for the broadened wing component. Using (12CO, 67:75) (13CO, 67:75), we can filter out much of the molecular emission from the unrelated MCs in 67–75 , leaving the enhanced 12CO emission in the same velocity interval along the LOS. The revealed 12CO enhancement is probably related to the BML regions for shocked gas. The shortcoming is that some shocked features in the map are lost because of the confusion between the unrelated MCs and the shocked gas along the LOS (e.g., SC1). Some realistic BML regions cannot be identified either due to the weak emission of the broadened 12CO wing and the high criterion of K (e.g., SC3).
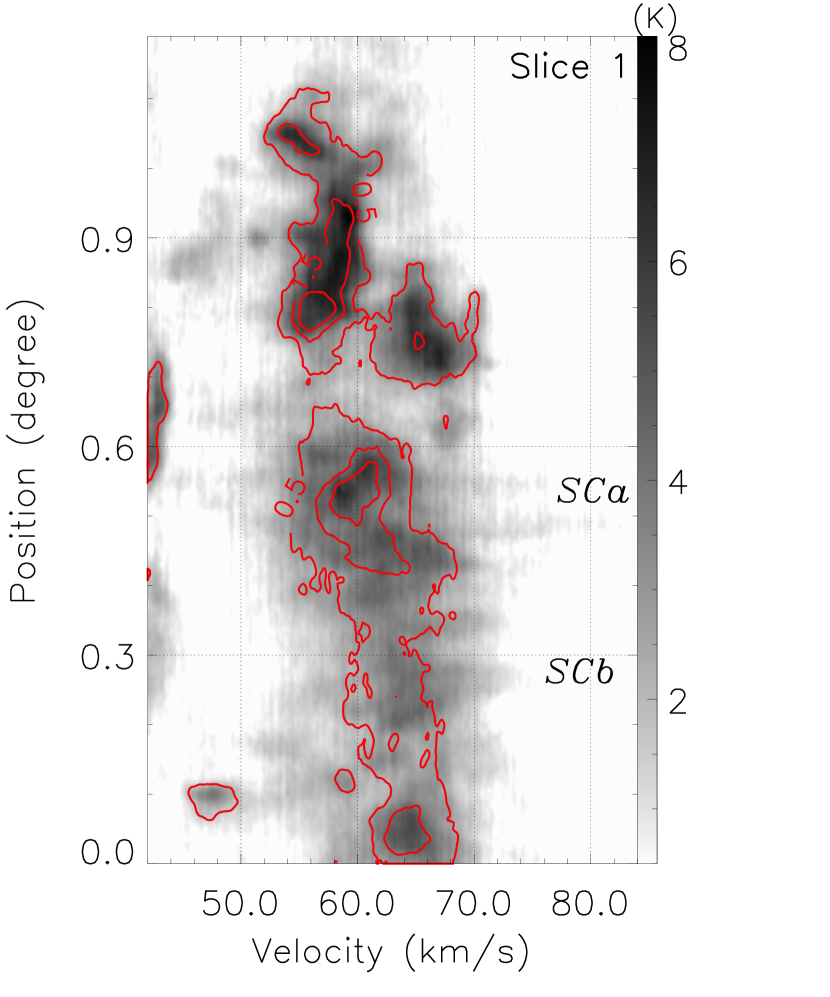
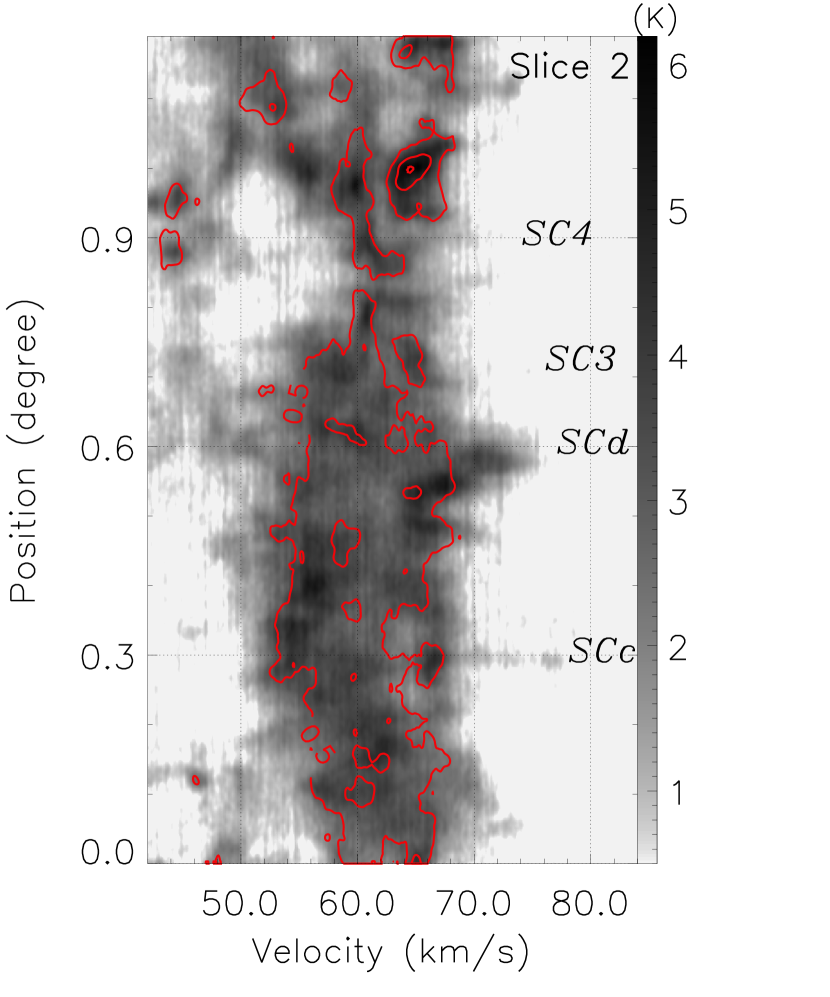
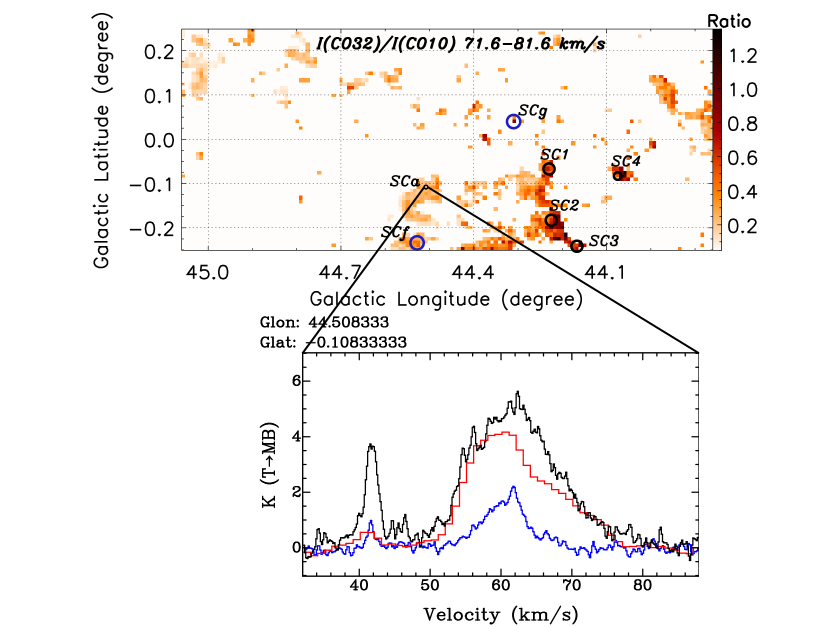
Figure 4 displays the distribution of the possible BML regions, in which the enhanced 12CO (=1–0) emission in 67–75 (the red contours) is overlaid with the 13CO emission in the velocity interval of 58.5–62.0 . An intriguing result is that most of the 12CO (=1–0) enhancements are concentrated within the TeV shell. We make two PV diagrams along Slice 1 and Slice 2 (see Figure 4) to search for possible kinematic features of the shocked gas further. In the PV diagrams (Figure 5), the redshifted protrusions of SCa–SCd in 12CO (=1–0) emission are actually discerned from the quiescent 13CO emission, suggesting that the samples of SCb–SCe are likely BML regions. We note that shocked molecular gas at SC2 and SC4 from the previous 12CO (=3–2) analysis is coincident well with its nearby strong 12CO (=1–0) wing emission in the velocity range of 67–75. Moreover, the identification of the possible shocked BML region SCa at (=44508, 0108) is also confirmed by its broadened 12CO (=3–2) emission up to (see the extracted spectrum in Figure 6), strengthening the validity of this method.
Some BML regions identified from the 12CO (=3–2) emission (e.g., SC1 and SC3) do not correspond to red contours, indicating the missing identification in Figure 4. Of course, some fragmental structures of red contours outside the TeV shell are not the BML region either. Additionally, H ii regions of HRDS G044.5280.234 (Anderson et al., 2011) and VLA G044.310300.0410 (Urquhart et al., 2009) are associated with the strong 12CO (=1–0) emission in 67–75 of SCf and SCg, respectively. All of these show the complexity for the 67–75 CO emission in the large-scale FOV. Therefore, the red contours in Figure 4 only roughly outline the distribution of the possible BML regions in the field (e.g., SCa–SCe).
Further observations and analysis are needed in order to identify the more reliable distribution of the shocked molecular gas in the whole region. As seen in Figure 6, the intensity ratio between 12CO (=3–2) emission and 12CO (=1–0) emission is high for BML regions in the velocity interval of 71.6–81.6 (or the redshifted-broadening part), which is consistent with the suggestion that an enhanced high-to-low ratio in CO line wings of MCs is a clear and useful indicator of shocked gas (e.g., Seta et al., 1998). High observations of CO are thus helpful in providing the unambiguous, direct signature of the distribution of the shocked material in the whole region of the TeV source.
3.2 High-velocity H i gas
In the above section, we have shown that the emission of the shocked molecular gas, which exhibits significant redshifted-broadening relative to the ambient gas, is concentrated toward the shell-like TeV source of HESS J1912101 (Figures 2, 4, and 6). The LSR velocity of the shocked molecular gas exceeds that of the tangent points in the direction (=445, = +71 ). As a result, one can readily discern that the disturbed gas from the surrounding emission if its LSR velocity is higher enough than the tangent point’s velocity. Accordingly, we wonder whether the possible high-velocity atomic gas can be discerned from the background emission in the FOV.
Although the H i emission displays a complex spatial morphology and is more diffuse than CO emission in the FOV, two features of the high-velocity atomic gas are actually revealed toward the concentration of the shocked molecular gas based on VGPS H i data (see the blue contours in Figure 2). The LSR velocity of the atomic gas is high enough so that such expanding features can be distinguished from the surrounding background emission at positive velocities of 97.5–111.5. The high-velocity atomic gas, which is observed projected close to the western edge of the TeV source, is spatially coincident with the surrounding molecular partial shell structures at traced by 13CO emission (see the thick-dashed gold lines in Figure 2).
The atomic gas emission displays partial shell structures from northeast to southwest (length and width; see the blue contours and the thick-dashed blue lines in Figure 2). The emission of the high-velocity atomic gas is very faint ( 2–3 K), but the shell structures are distinct from the background emission in the integrated intensity map of . The H i emission of the shell structures drops dramatically at and seems to disappear at . We cannot discern any H i structures from the integrated map of . At velocities 80–90 , the brightness temperature of the H i shells is 10 K, but the shell features are only marginally discerned due to confusion from the close by diffuse background emission.
The high-velocity H i gas Shell-a seems to be situated slightly outside the molecular shell (Figure 2). It is also interesting to note that the shocked molecular gas (red contours for 12CO (=3–2) emission), the quiescent molecular gas (gray image for 13CO (=1–0) emission), and the high-velocity atomic gas (blue contours for H i emission) are in contact with each other and seem to display an ordered arrangement from the inner side to the outer side (or from southeast to northwest), indicating that these shells are probably physically associated. The close morphological agreement between the shocked molecular gas and the high-velocity H i gas, together with the redshifted velocities of the disturbed gas with respect to the +60 quiescent gas, indicates that the gas shells probably have the same origin (see discussions in Section 3.3).
We summarize the properties of the high-velocity H i shells in Table 2. It should be noted that the estimated column density in Table 2 should be regarded as lower limits since the disturbed atomic gas at low velocities (e.g., 60–100) may has relatively higher than our estimates of 1 K at +100. Accordingly, the total mass and kinetic energy of the disturbed neutral gas in the Shell-a and Shell-b should also be viewed as lower limits.
3.3 An old SNR: its distance, age, and progenitor
So far, about one fourth of SNRs are thought to be associated with MCs (refer to, e.g., Jiang et al., 2010; Chen et al., 2014). These SNR–MC systems often display broadenings, wings, or asymmetric profiles in the molecular line spectra. On the other hand, some systematic searches for H i shells associated with Galactic SNRs were performed (e.g., Koo & Heiles, 1991; Koo et al., 2004). Several expanding H i shells are also confirmed to be associated with the SNR’s radio emission (e.g., Park et al., 2013).
These studies suggest that a significant fraction of the SNR’s mechanical energy is stored in the ambient interstellar medium (ISM). Disturbed by the SNR shock, the material in the vicinity of the remnant will be swept up and exhibit expanding molecular and/or atomic shell-like structures on a large scale. These shell-like features are often incomplete because of the inhomogeneous ISM.
Both shocked molecular gas and the associated expanding H i shells are found to be physically associated with MCs at (see Sections 3.1 and 3.2). It is thus natural to ascribe the disturbed gas to the perturbation of an SNR in the region. In such a scenario, the SNR provides the required kinetic energy and momentum for its ambient disturbed material. Broadly speaking, H i gas, tracing emission of more diffuse gas, may be swept farther away than molecular gas if the interaction happens early enough. As seen in Figure 2, Gas Shell-a may be the expected case that the high-velocity atomic gas displays more redshifted velocity structure with respect to that of the shocked molecular gas and expands somewhat farther toward the northwestern direction than the associated CO shell.
The separation between the molecular shell and the atomic shell is about 2’ (or 2.4 pc at a distance of 4.1 kpc, see Gas Shell-a in Figure 2). If the SNR encounters the molecular shell, the shock is significantly decelerated by the interaction with the dense gas. MCs are known to be clumpy (e.g., a volume filling factor of for dense clumps, Blitz, 1993). That is, the SNR shock evolves mainly in the interclump medium (e.g., 10 H atoms cm-3). Therefore, the shock in the interclump medium and the surrounding ISM with lower density may be still moving while the shock in dense molecular clumps nearly stalls out. The dynamic time of the moving atomic gas thus can be estimated as /2.4 pc/40 =0.6 years. The dynamic timescale of the moving atomic shell is slightly smaller and comparable with the remnant’s age of years (see below). On the other hand, both of the atomic and the molecular shells seem to almost overlap at the outer region (or the northwestern region, see Gas Shell-b in Figure 2), suggesting the recent interaction between the shock and the dense gas at the boundary of the remnant.
One might wonder whether the shocked molecular gas, as well as the associated high-velocity H i shells, is related to other energetic sources, such as nearby H ii regions and/or the stellar winds from massive OB stars. However, these possibilities can be excluded because of lacking the associated energetic sources in the direction. Some H ii regions with small sizes of (e.g., Anderson et al., 2011, 2014) are distributed in the FOV, but they are at least (7 pc at a distance of 4.1 kpc) away from identified shocked BML regions. Actually, the overlapping case between H ii regions and BML regions can be exactly picked out because H ii regions have bright IR and non-thermal radio emission (see the two blue circles in Figures 4 and 6). A young massive cluster of Mercer 20 located at (=4416, =007) contains several massive stars within a radius of (Mercer et al., 2005; Messineo et al., 2009). Although these OB stars at a distance of kpc (Messineo et al., 2009) or kpc (de la Fuente et al., 2015) are projected on the northeastern border of the high-velocity H i shells, they are unlikely responsible for the large-scale neutral atomic shells with sizes of 04 (or 28.6 pc at 4.1 kpc) and the widely distributed BML regions.
We thus suggest that an old SNR at a distance of 4.1 kpc (see below) appears to be a promising candidate for the surrounding shocked molecular gas and the high-velocity neutral atomic shells, although no corresponding radio feature has been detected in the VGPS 1.4 GHz continuum emission. The missing radio structure is probably due to the faint synchrotron emission of the old SNR (see Section 3.4), the sensitivity limitation of the radio observation, the contamination of the diffuse radio emission in the Galactic plane, and the confusion of bright radio sources projected onto the area. Further high-resolution and sensitivity radio observations toward the region should be carried out to investigate the possible non-thermal radio emission.
In subsequent analysis, we investigate properties of the likely SNR. First, the distance is one of the most important values for studying the nature of the source. Spectroscopic information of the quiescent molecular gas is thus helpful for identifying the LSR velocity of MCs and associating its kinematic distance to the target that we are interested in. For the =+60 molecular gas, we find that most of 13CO peaks from the shocked gas and the molecular shells correspond to H i dips, indicating that they are likely at near distance based on the H i self-absorption method (Roman-Duval et al., 2009). Accordingly, we adopt a near distance as the distance of the +60 GMC and exclude the far distance. Using the A5 rotation curve model of Reid et al. (2014), we place the +60 GMC and the associated SNR at a near kinematic distance of 4.1 kpc.
Second, as the brightness temperature of the H i shells is relatively low (1 K at +100), we may assume that the high-velocity atomic gas is optically thin. Then the H i mass of the high-velocity shells is estimated to be , where is the distance to the cloud in units of 4.1 kpc. Adopting a radius of 0405 (e.g., (049+032)/2, Gottschall et al., 2016), the solid angle of the high-velocity H i shells is about 0.24 sr. The derived total H i mass for a sphere with a radius of 0405 is , which corresponds to a kinetic energy of ergs for the expansion velocity of . A small fraction of 10 energy from a single supernova explosion with a total mechanical energy of 1.9 erg is sufficient to power the expanding atomic gas, favoring an SNR origin for the disturbed gas that is widely distributed in the FOV.
Third, the pre-explosion ambient density is estimated to be cm-3 if the neutral gas with total mass of was uniformly distributed within a sphere of a radius of 29.0 pc (0405 at a distance of 4.1 kpc). According to Cioffi et al. (1988) for an SNR in the pressure-driven snowplow phase, the explosion energy could be: erg erg, where cm-3, , pc, and /. The estimated explosion energy of erg is slightly larger than the typical value of ergs, but still reasonable. If the material inside the volume is not uniformly distributed, the above total mass of is probably overestimated, leading to the larger explosion energy for an SNR. It is a more realistic case because the neutral atomic shells with the highest velocity of 97.5–111.5 are only detected near the western boundary of HESS J1912101.
The age of the SNR could be /(2.0 years for a radius of 29.0 pc and an expansion velocity of in the radiative pressure-driven snowplow phase. We stress that the above value is an upper limit due to the somewhat underestimated velocity of the remnant’s shock. Some atomic gas structures with higher velocity but lower intensity may be lost because of confusion from the diffuse emission of the Galactic plane. Additionally, the evolutionary phase of the remnant should be speeded up if the SNR evolves in the environment of a pre-existent wind bubble (e.g., Dwarkadas, 2005, 2007).
The lower limit of the SNR age may be obtained from the view of radiative cooling of the remnant. According to little X-ray emission and the low shock velocity of in our case, we suggest that the SNR has lost a substantial amount of explosion energy from radiative cooling. The forward shock of the remnant is also significantly decelerated. The SNR age is thus at least 2–3 times larger than the transition time, which is defined as the time of an adiabatic Sedov–Taylor blast wave to a radiative pressure-driven snowplow phase. The transition time is given by years (e.g., Blondin et al., 1998). Assuming , , and , the SNR age is years, which is reasonably consistent with numerical simulations of (0.7–1.1) years that the SNR has radiated most of its explosion energy in the wind-bubble environment (e.g., Figures 3 and 8 in Tenorio-Tagle et al., 1991). The age of the SNR is thus (0.7–2.0) years.
We also note that two pulsars, PSR J19131000 and PSR J19131011, are situated within the inner shell of HESS J1912101. PSR J19131000 (Hobbs et al., 2004) is not related to the old SNR because of their different distances (7.9 kpc vs. 4.1 kpc) and ages (7.9 years vs. (0.7–2.0) years). Meanwhile, PSR J19131011, which is located at (=4448, 017) and is close to the geometric center of HESS J1912101 (see Figure 1), has a distance of 4.5 kpc from dispersion measurements and an age of 1.7 years from the spin-down method. Both of the two values are consistent well with the estimated distance and age of the remnant, indicating that PSR J19131011 is probably the result of the core collapse of the massive progenitor of the old SNR.
The progenitor’s wind of the old SNR may excavate its surrounding and form a pre-existing wind-blown bubble before the supernova explosion. Assuming that the remnant’s progenitor was a massive single star and the current molecular shells are mainly generated by its massive wind, we can estimate its mass from the cavity size. The size of the GMC is comparable to the TeV shell’s size of HESS J1912101 (Figures 1 and 4). Adopting the inner radius of 22.9 pc (032) as the radius of the wind bubble, an initial stellar mass of 26 is obtained from the linear relation between the progenitor’s mass and the wind bubble’s radius (see Equation 8 and Figure 1 in Chen et al., 2013). It implies that the progenitor’s spectral type is probably earlier than O9V in a constant interclump pressure of cm-3 K.
Briefly, an old SNR seems to be the origin of the shocked molecular gas and high-velocity H i shells. In this case, the mass of the ambient gas is swept up by the wind of the massive progenitor of the SNR and the gas in the formed shell is accelerated by the SNR’s shock. The kinetic energy of the disturbed gas is also provided by the remnant, resulting in the remarkable morphological and kinematic features of the molecular and atomic gas shown by us (Figure 2). The non-detection in the X-ray bands, together with the absence of corresponding radio structures in the surrounding, is consistent with the SNR’s old age of (0.7–2.0) years (see Section 3.4).
3.4 Origin of the shell-like TeV source of HESS J1912101
The PWN and the SNR scenarios for HESS J1912101 were discussed recently (Aharonian et al., 2008b; Puehlhofer et al., 2015). However, the origin of the TeV source is yet unconfirmed. It is worth mentioning that TeV sources of ARGO J19121026 (centered at 4459 and 020, the angular resolution 017–166, Bartoli et al., 2013) and 2HWC J1912099 (centered at 4415 and 008, the angular resolution 02–10, Abeysekara et al., 2017) were proposed to be associated with HESS J1912101. All of these characteristics indicate that the high-energy TeV emission is significantly enhanced in such a region. In our opinion, the high-energy -ray emission in the region can be explained by interactions between accelerated particles from the SNR and the surrounding dense medium.
We have revealed that shocked MCs, together with the associated high-velocity atomic gas, are concentrated toward HESS J1912101. Especially, the shocked MCs with broadline wings, as well as the expanding H i shells (Figure 2), are observed mainly projected close to the western boundary of the TeV source. These interesting features indicate large amounts of momentum and mechanical energy injection to the disturbed gas. We suggest that an energetic source is initially required at the southeast region of the gas shells to account for the kinematic features of the disturbed gas on a large scale. An old SNR may be a good choice and a reasonable candidate because of lacking other energetic sources, e.g., giant H ii regions or massive OB stars (see Section 3.3). As a consequence, the SNR would provide the required energy of the high-energy protons.
The angular resolution of H.E.S.S. observation is better than 01, which allows us to compare the TeV emission with the distribution of the shocked and/or dense molecular gas with the precision of several arcmin. The distribution of the high-energy emission of HESS J1912101 is not uniform. Several enhanced TeV peaks () can be seen at ( 443, 01), ( 442, 03), ( 446, 04), ( 448, 03), and ( 447, 00). Based on CO data, we find that the shocked gas and/or dense MCs are spatially coincident with the VHE -ray emission.
The size of the MC concentration is comparable to that of the TeV source of HESS J1912101 (Figures 1 and 4). Generally, the overall 13CO emission is strong in the western part of the TeV shell, which is consistent with the brighter high-energy emission on the western half of HESS J1912101. TeV source 2HWC J1912099 (Abeysekara et al., 2017) appears projected onto such the region, in which the disturbed ISM is also concentrated (see Figure 2). The BML regions (e.g., SCa, SCb, SCd, SCe, and SC1–SC4) show good spatial coincidences with the TeV enhancement (Figure 4). At ( 443, 01), the dense (traced by 13CO emission, – cm-3) and massive ( ) MC complex at +60, which is related to an IR bubble N91 (Churchwell et al., 2006) at a massive star-forming region (e.g., Gong et al. 2017 (to be submitted) and Dirienzo et al., 2012), is spatially coincident with the brightest TeV emission there. On the contrary, the eastern 13CO emission is relatively weak. However, a piece of 13CO cloud (size and ), together with more extended 12CO emission, is located at ( 4472, 003). Some patches of molecular gas with weak 13CO emission also can be seen along the eastern inner shell of the TeV source (Figures 1 and 4), which may be related to the relatively weak -ray emission on the eastern half of HESS J1912101.
The detection of the H i and CO partial shell-like structures, as well as the C18O emission in some regions, shows that the old SNR is located in the complex and dense ISM. Naturally, the established source-target (or SNR–MCs) system favors the hadronic scenario for the observed TeV emission (e.g., Yamazaki et al., 2006; Gabici et al., 2009). The hadronic -ray flux can be estimated by Drury et al. (1994) as . Here, is the fraction of the total supernova explosion energy converted to CR. Using numerical values of =4.5 photons cm-2 s-1, =0.1–0.01, erg, and =4.1 kpc, the hadronic scenario requires a mean target gas density of 6–60 cm-3 for the surrounding ISM, which is consistent with our finding of the molecular environment there.
According to the spectral fit of HESS J1912101 (Gottschall et al., 2016), the energy flux in the 1–10 TeV band is estimated to be =8.1 erg cm-2 s-1. Using data, Chang et al. (2008) found that the upper limit of the X-ray flux in the 0.3–10 keV band is 0.7 erg cm-2 s-1 for the center of gravity of HESS J1912101. It indicates that the flux ratio of should be larger than 120. The high flux ratio agrees with the case of interactions between an old SNR and its ambient GMC (e.g., Yamazaki et al., 2006).
In the scenario, the GeV emission from the system may be dim with respect to the TeV emission as shown in Table 2 of Yamazaki et al. (2006). If the contribution of CR protons for the GeV band emission can be neglected, the total energy of the accelerated protons for the 1–10 TeV emission is estimated to be , where, =4 erg s-1 is the luminosity of the source in the 1–10 TeV band. Adopting the characteristic cooling time of inelastic pp-interactions of =4.4 s (Aharonian, 2004) and a mean medium density of 60 cm-3 for the molecular environment, erg. Therefore, an SNR’s mechanical explosion energy of 1051 erg may be sufficient enough to explain the observed TeV flux by pp-interactions in a distance of 4.1 kpc and an average density of cm-3.
Finally, adopting =350–50 (Yamazaki et al., 2006) and a non-thermal radio spectral index of =0.5 for an SNR (e.g., a power-law spectrum of ), an integral flux from to Hz of =2.3–1.6 erg cm-2 s-1 corresponds to a flux density of 0.1–0.7 Jy at 1.4 GHz. Such a low radio flux density indicates that the remnant’s feature is difficult to be discerned from the diffuse background emission of the Galactic plane based on the current radio survey (e.g., see Figure 10 in Anderson et al., 2017).
4 SUMMARY AND CONCLUSIONS
We have studied the CO and H i data toward the shell-like TeV source of HESS J1912101. The main results and conclusions are summarized as follows.
1. Both of the shocked molecular gas and the high-velocity H i atomic gas are found to be toward the shell-like TeV source of HESS J1912101. The velocity of the 12CO broadening is obviously up to with respect to the unperturbed dense molecular gas at traced by 13CO and C18O (=1–0) emission.
2. The disturbed molecular gas shows compelling signs of the redshifted-broadening () in 12CO (=1–0) and 12CO (=3–2) lines, which is consistent with the discovery of the high-velocity atomic shells up to at the same region. The high-velocity H i shells are indeed found to be coincident with the molecular partial shells, suggesting the physical association between them.
3. The shocked molecular gas, the quiescent molecular gas, and the high-velocity atomic gas seem to be arranged orderly from southeast to northwest, indicating an energetic source with large momentum and mechanical energy injection in the southeastern region of the disturbed gas concentration. After excluding other energetic sources such as H ii regions and massive OB stars, we suggest that an old SNR is probably responsible for the origin of the disturbed gas.
4. We place the old SNR at a near kinematic distance of 4.1 kpc based on the association between the remnant and the +60 MCs. The far kinematic distance of the source can be excluded because most of the 13CO emission from the shocked gas and the molecular shells has corresponding H i dips at . The age of the remnant is estimated to be (0.7–2.0) years according to the evolution of the SNR in a pre-existent wind bubble from the massive progenitor star.
5. PSR J19131011, which seems to be just located near the centroid of HESS J1912101, probably results from the core collapse of the massive progenitor of the old SNR because of their comparable ages (1.7 years vs. (0.7–2.0) years) and distances (4.5 kpc vs. 4.1 kpc). The massive progenitor of the remnant blew or carved a molecular bubble via its energetic stellar winds, which has a comparable size with the TeV shell or the +60 GMC. Accordingly, the spectral type of its main-sequence star is probably earlier than O9V assuming that a massive single star evolved in a constant interclump pressure of cm-3 K.
6. We suggest that the old SNR may be a promising candidate for the shell-like TeV source HESS J1912101, although no corresponding radio and X-ray counterpart has been detected. The SNR’s old age of (0.7–2.0) years could be responsible for the absence of its radio and X-ray emission. In the scenario, the shell-like high-energy emission comes from the decay of neutral pions produced by interactions of accelerated hadrons from the SNR’s shock and the surrounding dense gas.
7. Further high-resolution and sensitivity radio observations toward the TeV source should be carried out to investigate the possible non-thermal radio emission of the old SNR.
References
- Abeysekara et al. (2017) Abeysekara, A. U., Albert, A., Alfaro, R., et al. 2017, ApJ, 843, 40
- Ackermann et al. (2013) Ackermann, M., Ajello, M., Allafort, A., et al. 2013, Science, 339, 807
- Aharonian et al. (2008aa) Aharonian, F., Akhperjanian, A. G., Bazer-Bachi, A. R., et al. 2008a, A&A, 481, 401
- Aharonian et al. (2008b) Aharonian, F., Akhperjanian, A. G., Barres de Almeida, U., et al. 2008b, A&A, 484, 435
- Aharonian (2004) Aharonian, F. A. 2004, Very high energy cosmic gamma radiation : a crucial window on the extreme Universe (World Scientific Publishing Co), doi:10.1142/4657
- Anderson et al. (2014) Anderson, L. D., Bania, T. M., Balser, D. S., et al. 2014, ApJS, 212, 1
- Anderson et al. (2011) Anderson, L. D., Bania, T. M., Balser, D. S., & Rood, R. T. 2011, ApJS, 194, 32
- Anderson et al. (2017) Anderson, L. D., Wang, Y., Bihr, S., et al. 2017, ArXiv e-prints, arXiv:1705.10927
- Bartoli et al. (2013) Bartoli, B., Bernardini, P., Bi, X. J., et al. 2013, ApJ, 779, 27
- Blitz (1993) Blitz, L. 1993, in Protostars and Planets III, ed. E. H. Levy & J. I. Lunine, 125–161
- Blondin et al. (1998) Blondin, J. M., Wright, E. B., Borkowski, K. J., & Reynolds, S. P. 1998, ApJ, 500, 342
- Bolatto et al. (2013) Bolatto, A. D., Wolfire, M., & Leroy, A. K. 2013, ARA&A, 51, 207
- Castets & Langer (1995) Castets, A., & Langer, W. D. 1995, A&A, 294, 835
- Castro & Slane (2010) Castro, D., & Slane, P. 2010, ApJ, 717, 372
- Chang et al. (2008) Chang, C., Konopelko, A., & Cui, W. 2008, ApJ, 682, 1177
- Chen et al. (2014) Chen, Y., Jiang, B., Zhou, P., et al. 2014, in IAU Symposium, Vol. 296, Supernova Environmental Impacts, ed. A. Ray & R. A. McCray, 170–177
- Chen et al. (2013) Chen, Y., Zhou, P., & Chu, Y.-H. 2013, ApJ, 769, L16
- Churchwell et al. (2006) Churchwell, E., Povich, M. S., Allen, D., et al. 2006, ApJ, 649, 759
- Cioffi et al. (1988) Cioffi, D. F., McKee, C. F., & Bertschinger, E. 1988, ApJ, 334, 252
- de la Fuente et al. (2015) de la Fuente, D., Najarro, F., Trombley, C., Davies, B., & Figer, D. F. 2015, A&A, 575, A10
- Dempsey et al. (2013) Dempsey, J. T., Thomas, H. S., & Currie, M. J. 2013, ApJS, 209, 8
- Dirienzo et al. (2012) Dirienzo, W. J., Indebetouw, R., Brogan, C., et al. 2012, AJ, 144, 173
- Drury et al. (1994) Drury, L. O., Aharonian, F. A., & Voelk, H. J. 1994, A&A, 287, 959
- Dwarkadas (2005) Dwarkadas, V. V. 2005, ApJ, 630, 892
- Dwarkadas (2007) —. 2007, ApJ, 667, 226
- Frail & Mitchell (1998) Frail, D. A., & Mitchell, G. F. 1998, ApJ, 508, 690
- Frerking et al. (1982) Frerking, M. A., Langer, W. D., & Wilson, R. W. 1982, ApJ, 262, 590
- Fujita et al. (2009) Fujita, Y., Ohira, Y., Tanaka, S. J., & Takahara, F. 2009, ApJ, 707, L179
- Gabici et al. (2009) Gabici, S., Aharonian, F. A., & Casanova, S. 2009, MNRAS, 396, 1629
- Gottschall et al. (2016) Gottschall, D., Capasso, M., Deil, C., et al. 2016, ArXiv e-prints, arXiv:1612.00261
- Hobbs et al. (2004) Hobbs, G., Faulkner, A., Stairs, I. H., et al. 2004, MNRAS, 352, 1439
- Jiang et al. (2010) Jiang, B., Chen, Y., Wang, J., et al. 2010, ApJ, 712, 1147
- Kilpatrick et al. (2016) Kilpatrick, C. D., Bieging, J. H., & Rieke, G. H. 2016, ApJ, 816, 1
- Koo & Heiles (1991) Koo, B.-C., & Heiles, C. 1991, ApJ, 382, 204
- Koo et al. (2004) Koo, B.-C., Kang, J.-H., & McClure-Griffiths, N. M. 2004, Journal of Korean Astronomical Society, 37, 61
- Li & Chen (2010) Li, H., & Chen, Y. 2010, MNRAS, 409, L35
- Mercer et al. (2005) Mercer, E. P., Clemens, D. P., Meade, M. R., et al. 2005, ApJ, 635, 560
- Messineo et al. (2009) Messineo, M., Davies, B., Ivanov, V. D., et al. 2009, ApJ, 697, 701
- Morris et al. (2002) Morris, D. J., Hobbs, G., Lyne, A. G., et al. 2002, MNRAS, 335, 275
- Ohira et al. (2011) Ohira, Y., Murase, K., & Yamazaki, R. 2011, MNRAS, 410, 1577
- Park et al. (2013) Park, G., Koo, B.-C., Gibson, S. J., et al. 2013, ApJ, 777, 14
- Pety (2005) Pety, J. 2005, in SF2A-2005: Semaine de l’Astrophysique Francaise, ed. F. Casoli, T. Contini, J. M. Hameury, & L. Pagani, 721
- Puehlhofer et al. (2015) Puehlhofer, G., Brun, F., Capasso, M., et al. 2015, in International Cosmic Ray Conference, Vol. 34, 34th International Cosmic Ray Conference (ICRC2015), ed. A. S. Borisov, V. G. Denisova, Z. M. Guseva, E. A. Kanevskaya, M. G. Kogan, A. E. Morozov, V. S. Puchkov, S. E. Pyatovsky, G. P. Shoziyoev, M. D. Smirnova, A. V. Vargasov, V. I. Galkin, S. I. Nazarov, & R. A. Mukhamedshin, 886
- Reach et al. (2005) Reach, W. T., Rho, J., & Jarrett, T. H. 2005, ApJ, 618, 297
- Reid et al. (2014) Reid, M. J., Menten, K. M., Brunthaler, A., et al. 2014, ApJ, 783, 130
- Reynolds (2008) Reynolds, S. P. 2008, ARA&A, 46, 89
- Roman-Duval et al. (2009) Roman-Duval, J., Jackson, J. M., Heyer, M., et al. 2009, ApJ, 699, 1153
- Seta et al. (1998) Seta, M., Hasegawa, T., Dame, T. M., et al. 1998, ApJ, 505, 286
- Shan et al. (2012) Shan, W. L., Yang, J., Shi, S. C., et al. 2012, IEEE Transactions on Terahertz Science and Technology, 2, 593
- Slane et al. (2015) Slane, P., Bykov, A., Ellison, D. C., Dubner, G., & Castro, D. 2015, Space Sci. Rev., 188, 187
- Stil et al. (2006) Stil, J. M., Taylor, A. R., Dickey, J. M., et al. 2006, AJ, 132, 1158
- Su et al. (2016) Su, Y., Sun, Y., Li, C., et al. 2016, ApJ, 828, 59
- Su et al. (2017) Su, Y., Zhou, X., Yang, J., et al. 2017, ApJ, 836, 211
- Tavani et al. (2010) Tavani, M., Giuliani, A., Chen, A. W., et al. 2010, ApJ, 710, L151
- Tenorio-Tagle et al. (1991) Tenorio-Tagle, G., Rozyczka, M., Franco, J., & Bodenheimer, P. 1991, MNRAS, 251, 318
- Tian et al. (2008) Tian, W. W., Leahy, D. A., Haverkorn, M., & Jiang, B. 2008, ApJ, 679, L85
- Urquhart et al. (2009) Urquhart, J. S., Hoare, M. G., Purcell, C. R., et al. 2009, A&A, 501, 539
- Yamazaki et al. (2006) Yamazaki, R., Kohri, K., Bamba, A., et al. 2006, MNRAS, 371, 1975
|
|
|
|
|
|
||||||
|---|---|---|---|---|---|---|---|---|---|---|---|
| 12CO (=1–0) | 50′′, 0.2 km s-1 | 0.5 K | |||||||||
| MWISP | -10, | 13CO (=1–0) | 50′′, 0.2 km s-1 | 0.3 K | (1) | ||||||
| C18O (=1–0) | 50′′, 0.2 km s-1 | 0.3 K | |||||||||
| 1025175, 05 | |||||||||||
| COHRS | 17255025, 025 | 12CO (=3–2) | 17′′, 1 km s-1 | 1 K | (2) | ||||||
| 50255525, 05 | |||||||||||
| 18, 13 | H i line | 1′, 1.56 km s-1 | 2 K | ||||||||
| VGPS | 46, 19 | 21 cm continuum | 1′ | 0.3 K | (3) | ||||||
| 59, 23 |
| Name | Size | aaThe LSR velocity of the quiescent gas from the 13CO and/or C18O emission. | bbThe expansion velocity from the difference between the mean velocity of the shocked gas and the velocity of the quiescent gas. | ccThe mean temperature of the H i shell at 100 after subtracting the surrounding background of 0.5 K. | Column DensityddThe column density calculated from 1.822 cm-2. | e,fe,ffootnotemark: | H i MassffParameter is the distance to the cloud in units of 4.1 kpc (see Section 3). | ffParameter is the distance to the cloud in units of 4.1 kpc (see Section 3). |
|---|---|---|---|---|---|---|---|---|
| (arcminarcmin) | () | () | (K) | ( cm-2) | (cm-3) | () | ( ergs) | |
| Shell-a | 3.320.4 | 60 | 40 | 0.9 | 0.7 | 5.8 | 70 | 1.1 |
| Shell-b | 4.724.6 | 61 | 40 | 1.2 | 0.9 | 5.2 | 160 | 2.6 |