Mass transport from the envelope to the disk of V346 Nor: a case study for the luminosity problem in an FUor-type young eruptive star
Abstract
A long-standing open issue of the paradigm of low-mass star formation is the luminosity problem: most protostars are less luminous than theoretically predicted. One possible solution is that the accretion process is episodic. FU Ori-type stars (FUors) are thought to be the visible examples for objects in the high accretion state. FUors are often surrounded by massive envelopes, which replenish the disk material and enable the disk to produce accretion outbursts. However, we have insufficient information on the envelope dynamics in FUors, about where and how mass transfer from the envelope to the disk happens. Here we present ALMA observations of the FUor-type star V346 Nor at 1.3 mm continuum and in different CO rotational lines. We mapped the density and velocity structure of its envelope and analyze the results using channel maps, position-velocity diagrams, and spectro-astrometric methods. We found that V346 Nor is surrounded by gaseous material on 10 000 au scale in which a prominent outflow cavity is carved. Within the central 700 au, the circumstellar matter forms a flattened pseudo-disk where material is infalling with conserved angular momentum. Within 350 au, the velocity profile is more consistent with a disk in Keplerian rotation around a central star of 0.1. We determined an infall rate from the envelope onto the disk of 610 yr-1, a factor of few higher than the quiescent accretion rate from the disk onto the star, hinting for a mismatch between the infall and accretion rates as the cause of the eruption.
1 Introduction
Sun-like stars form when dense cores in the interstellar matter gravitationally collapse. Nascent stars are surrounded by circumstellar disks, from which material is accreted onto the growing star. Initially, the star+disk system is embedded in an envelope, the remnant of the initial core, which feeds material to the disk. A long-standing problem with this paradigm is the luminosity problem: theoretical models for the collapse of cloud cores predict infall rates on the order of 10 yr-1, which imply luminosities typically 10-100 times higher than what is observed for embedded protostars (Dunham et al., 2014, and references therein). One way to overcome this conundrum is to assume that the accretion rate is not constant in time, but episodic: the protostar normally accretes at a very low rate, and this quiescent accretion is occasionally interspersed by brief episodes of highly enhanced accretion (Kenyon 1990). By combining radiative transfer with hydrodynamical simulations, our group found that models predicting accretion rates that both decline with time and feature short-term variability and episodic bursts reproduce well the observed protostellar luminosity function, offering a solution for the luminosity problem (Dunham & Vorobyov, 2012; Dunham et al., 2013).
FU Orionis-type variables (FUors) are thought to be the visible examples of episodic accretion. FUors exhibit 5-6 mag optical outbursts attributed to highly enhanced accretion (Hartmann & Kenyon, 1996). During these outbursts, accretion rates from the circumstellar disk onto the star are on the order of 10 yr-1, three orders of magnitude higher than in quiescence. The exact physical mechanism of FUor outbursts is debated. Explanations include viscous-thermal instabilities in the disk (Bell & Lin, 1994), a combination of gravitational and magneto-rotational instability (Armitage et al., 2001), or accretion of clumps in a gravitationally fragmenting disk (Vorobyov & Basu, 2006, 2010, 2015). Yet another type of theory involves a close stellar or sub-stellar companion that perturbs the disk and triggers the onset of the enhanced accretion (Lodato & Clarke, 2004; Bonnell & Bastien, 1992; Nayakshin & Lodato, 2012).
Envelopes play a significant role in the outburst of FUors by replenishing the disk material after each outburst and sustaining gravitational instability, the key ingredient of several outburst models (Zhu et al., 2009; Vorobyov & Basu, 2010, 2015). A fundamental parameter is the mass infall rate from the envelope onto the disk, which regulates all these processes and determines the periodicity of disk fragmentation and, indirectly, the frequency of bursts caused by clump infall (Vorobyov et al., 2013). A general prediction of the instability models is that the mass transport rate towards the inner disk regions should exceed a critical value of a few times 10 yr-1, otherwise the material is accreted steadily onto the star, and no eruptions are produced (Bell & Lin, 1994). With a reasonable assumption that the mass infall rate from the envelope onto the disk is of the same order as the mass transport through the disk, this also implies the existence of a critical envelope infall rate. With ALMA, it is now possible to study the infall process and characterize the FUor envelopes in details.
In this paper, we use new ALMA observations to analyze the structure and properties of the circumstellar matter around V346 Nor, an embedded FUor located in the Sandqvist 187 dark cloud, at a distance of 700 pc (Reipurth, 1981). It went into eruption some time between 1976 and 1980, reached a peak accretion rate of 10 yr-1 in 1992, produced an unexpected, rapid fading in 2010-11, and after a minimum, brightened again (Kraus et al., 2016; Kóspál et al., 2017b). It is associated with the Herbig-Haro object HH 57 (Reipurth, 1985). Sandell & Weintraub (2001) observed V346 Nor with the JCMT/SCUBA in the submillimeter continuum, measuring a size of 228′′ and a total (gas+dust) envelope mass of 0.5. Evans et al. (1994) detected very strong 12CO(3–2) and 13CO(2–1) lines with the CSO, indicating an outflow, and measured an envelope mass of about 1. Recently, we also measured CO emission from V346 Nor, using APEX for the 12CO(3–2), 12CO(4–3), and 13CO(3–2) lines (Kóspál et al., 2017a). We obtained an envelope mass of 0.3 within a radius of 10 000 au (143), which is consistent with previous results for the extended envelope, considering the uncertainties in mass determination. We also detected the energetic outflow in the wings of the 12CO lines.
With ALMA, we performed continuum and CO line observations of V346 Nor with better sensitivity, spatial, and velocity resolution than ever before. In Section 2 we give details about our observations and data reduction, in Section 3 we present our results, and in Section 4 we analyze the ALMA data and discuss the observations in the context of what we know about the infall process and envelope structure of Class 0/I objects and other FUors.
2 Observations
We observed V346 Nor using ALMA in Cycle 2 with the 12 m array on April 28, 2015, with the 7 m (Morita) array on June 6, June 8, and August 8, 2014, and with the Total Power antennas on June 14-15 and July 16-18, 2015 (project 2013.1.00870.S, PI: Á. Kóspál). The 12 m array observations were executed with 37 antennas, using Titan as flux calibrator, J1617-5848 and J1517-2422 as bandpass calibrators, and J1623-4501 as phase calibrator. The 7 m array observations were done with 9-11 antennas using Mars and Titan as flux calibrators, J1427-4206 as bandpass calibrator, and J1636-4102 as phase calibrator. The Total Power observations were obtained with 3 antennas, and Uranus was used as a flux calibrator.
Tab. 1 shows the log of observations. The interferometric observations were single pointings, while the Total Power measurements were on-the-fly maps of about 8080′′, with an OFF position at RA = 1910 and DEC = +4498, selected to be emission-free in CO at the expected velocity of our science target. The 12 m array had projected baseline lengths between 14 m and 349 m (11 – 268 k), while the 7 m array had projected baseline lengths between 8.3 m and 48 m (6 – 37 k). The observations were done in Band 6. Three spectral windows of 58.6 MHz bandwidth and 30 kHz (40 m s-1) resolution were centered at the 12CO, 13CO, and C18O J=2–1 lines, while one spectral window of 1875 MHz bandwidth was centered at 233 GHz to measure the 1.3 mm continuum.
All data sets were calibrated using the standard ALMA reduction software CASA (v4.5; McMullin et al. 2007). The visibilities on the baselines in common for both the 7 m array and the 12 m array interferometric data sets were in good agreement, therefore they were concatenated into a single measurement set. This data set was used to create a continuum image by excluding channels contaminated by line emission, and cleaning with Briggs weighting using a robustness parameter of 0.5. For the line data, we first fitted a continuum to the line-free channels and subtracted it in the space, then cleaned the images with Briggs weighting using a robustness parameter of 0.5. Finally, Total Power data cubes were prepared with the same spatial and spectral gridding as the interferometric data, and they were combined together in the image space using CASA’s “feather” algorithm. We emphasize that the combination of the three data sets allows us to image the emission on all spatial scales without flux loss.
| Image | Frequency (GHz) | Beam size | Beam P.A. |
|---|---|---|---|
| Continuum | 226.70856 | 090111 | 851 |
| 12CO J=2–1 | 230.53800 | 091111 | 866 |
| 13CO J=2–1 | 220.39868 | 095116 | 854 |
| C18O J=2–1 | 219.56035 | 097119 | 860 |
3 Results and Analysis
3.1 Continuum image
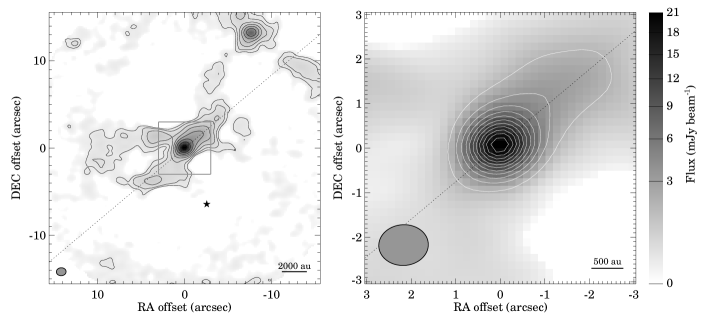
As Fig. 1 shows, V346 Nor is firmly detected at 1.322 mm continuum. The rms noise in the image is 0.07 mJy beam-1. The peak flux is 19.7 mJy beam-1 (280 detection). The peak is located at =16h32m3220, =44∘55′3069, which is only 011 away from the phase center, and 010 away from the 2MASS location of the central star in the near-infrared. Therefore, the peak of the continuum emission coincides with the stellar location. The central part of the continuum emission, displayed in Fig. 1 right, is dominated by a fairly compact source. The lower contours show an asymmetry: the continuum emission is stronger in the northwestern direction, forming a finger-like, narrow extension. This may be due to another, nearby source, some denser clumps in the circumstellar envelope of V346 Nor, or a stream of material falling toward the center. In an attempt to separate the central peak from this extension, we fitted the brightness distribution by two elliptical 2D Gaussians.
The fit revealed that the central source is marginally resolved, with a deconvolved FWHM of 046060. It is elongated along the northwest-southeast direction, with a position angle similar to that of the rotating disk seen in the CO emission (Sec. 3.2). At a distance of 700 pc, its size corresponds to a radius of 210 au. The fitted flux of this structure is 273 mJy, where the uncertainty already contains 10% absolute flux calibration uncertainty added in quadrature. Assuming optically thin emission, this can be converted to dust mass using the following formula:
| (1) |
We obtained a dust mass of 710 using = 700 pc for the distance of the source, =0.17 m2 kg-1 for the dust opacity at 850m (Zuckerman & Becklin, 1993), = 50 K for the temperature, and =1 for the dust emissivity (Sandell & Weintraub, 2001). In order to check our assumption about the optical depth , we calculated a map by comparing the observed emission with blackbody radiation using 50 K dust temperature. The resulting peak was around 0.01, and even with = 20 K, the stays below 0.03. Therefore, our calculated dust mass do not underestimate the true value. As we will show in Sec. 3.4, the Keplerian disk around the star approximately fills the central beam, thus, no significant beam dilution is expected, further supporting our mass estimate. According to our fit, the nearby extended source to the northwest is at a distance of 19 from V346 Nor and is elongated in the same direction with a deconvolved FWHM of 19. Its peak brightness is about 7 times fainter than that of V346 Nor. Therefore, V346 Nor dominates the continuum emission within about 1′′ radius.
There is a significant amount of even fainter (but still detectable at a high signal-to-noise ratio), extended emission around the target. The lowest contour levels in Fig. 1 left (2, 4, and 8 ) hint at four protrusions/tongues, which may indicate the walls of an outflow cavity. We found that an aperture radius of 9′′ (6300 au) includes all these features. The total millimeter flux within this radius is 42 mJy. Subtracting from this the flux of the central source, 27 mJy, we computed the mass of the extended part assuming 20 K for the temperature and =2 for the dust emissivity (Sandell & Weintraub, 2001). The resulting dust mass for the extended component is 1.610. Adding to that the mass of the central source, we obtained 2.310 as the total dust mass within 6300 au.
There is an additional continuum source visible in the ALMA image, located 152 to the northwest of V346 Nor, at =16h32m3148, =44∘55′1750, with a peak flux of 19.9 mJy and a total flux of 277 mJy. This source is unknown in the literature, although it is clearly visible in Herschel 70m and 100m images. It is more difficult to discern it at longer wavelengths due to the degrading spatial resolution of Herschel. The Herschel/PACS Point Source Catalogue (Marton et al., 2017) gives a flux of 4.10.4 Jy and 7.40.4 Jy at 70 and 100m, respectively. The source is invisible at optical and near-infrared wavelengths, thus, it is probably a deeply embedded protostar.
3.2 CO spectra
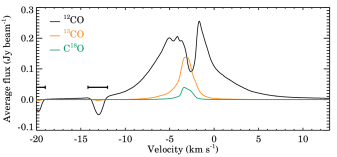
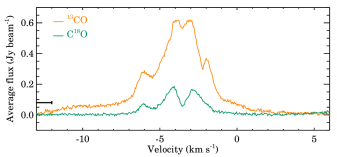
Fig. 2 shows the line profile of the three CO isotopologues for an area with a radius of 14 000 au (20′′), and the two rarer isotopologues for the central beam (the 12CO spectrum for the central beam suffers heavily from self-absorption, and will not be discussed here). Negative features, unrelated to the source, can be seen between 12 and 14.5 km s-1 and between 19 and 21.5 km s-1. These are artifacts due to emission in the OFF position in the total power maps, and they are not present in the interferometric-only data. These velocity ranges are omitted from our analyses. The spectra of the larger area show profiles similar to what is typical for infalling envelopes around highly embedded objects (Evans, 1999). The optically thinner 13CO and C18O lines peak around the systemic velocity (see below), while the optically thicker 12CO has strong self-absorption at a velocity slightly redshifted from the systemic velocity. This kind of line profile is explained in the literature as an envelope with a radial velocity gradient: the outer part of the envelope is mostly static, causing the absorption feature, while the inner part is infalling toward the central star (Shu, 1977; Evans et al., 2015, and references therein).
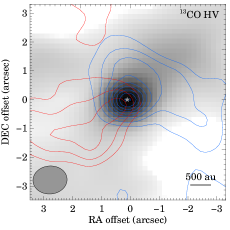
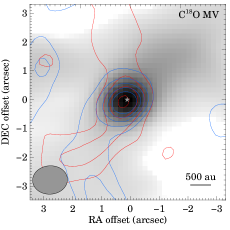
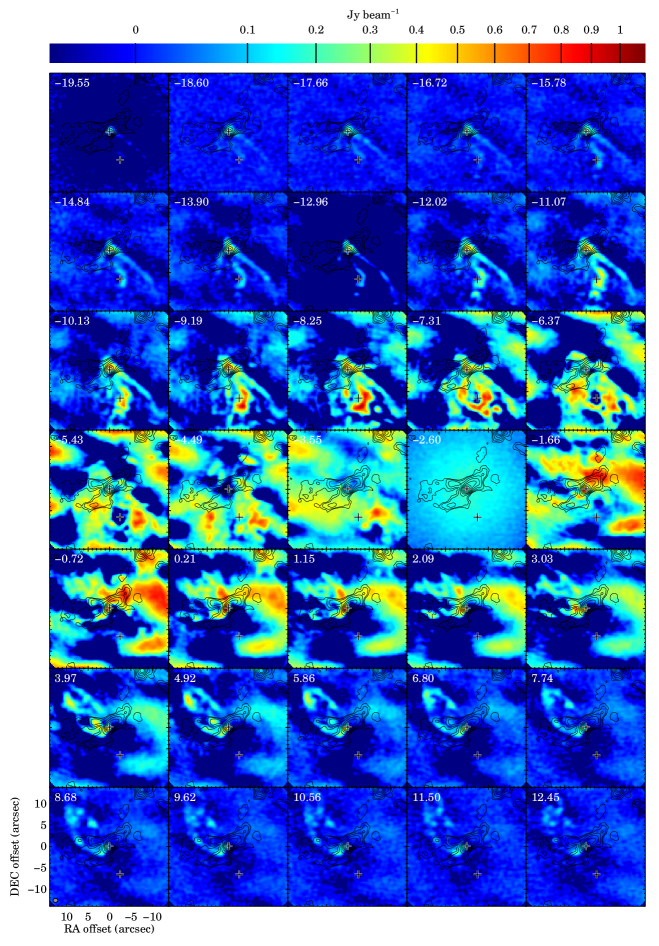
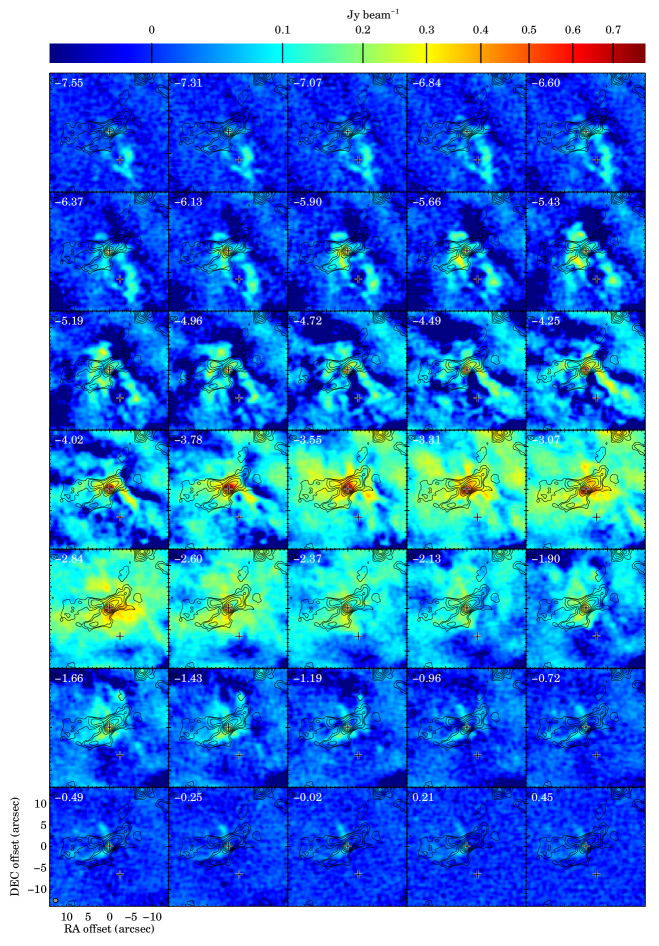
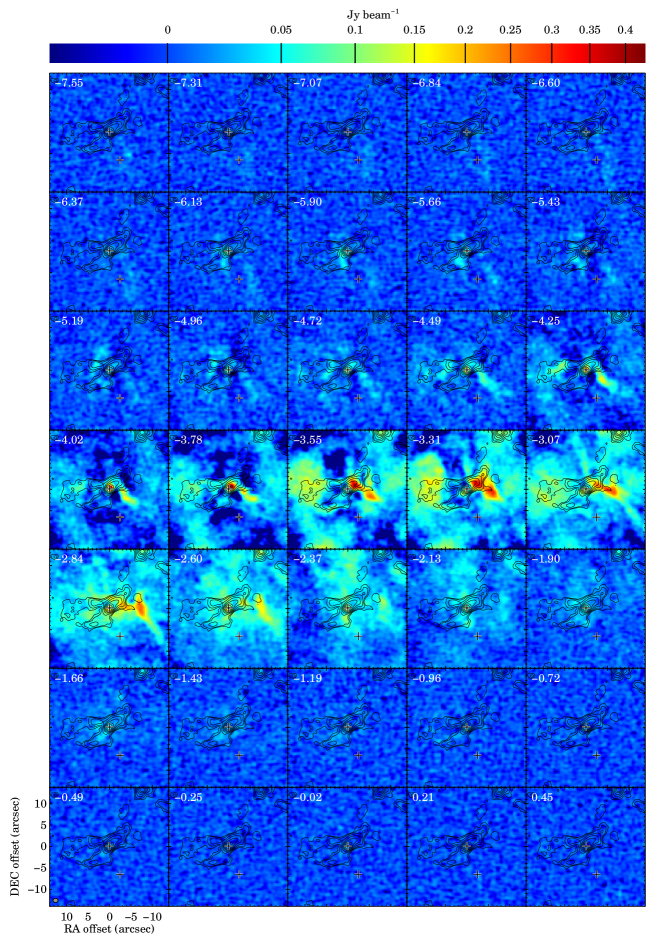
The 13CO and C18O spectra of the central beam (Fig. 2, bottom) show two prominent peaks close to the line center, symmetrically around a dip at 3.55 km s-1, which we will adopt as the systemic velocity. The double-peaked line profiles may indicate rotation in a compact source. There is a clear indication of line wings, especially well visible in the stronger 13CO line, up to 9 km/s from the systemic velocity. This may indicate outflows launched very close to the central star, or material rotating at relatively high velocities. Based on the appearance of these line profiles, we defined three velocity ranges symmetrically around the systemic velocity: low velocity (LV) within 1.5 km s-1, medium velocity (MV) between 1.5…3.5 km s-1, and high velocity (HV) between 3.5…8.5 km s-1. These velocity ranges are marked in Fig. 2 as well. We integrated the CO emission in these velocity ranges, and plotted the redshifted and blue-shifted emission as contours in Fig. 3. In the Appendix, we also show selected channel maps, in the case of 12CO for channels within 16 km s-1 of the systemic velocity, while in the case of the fainter 13CO and C18O within 8 km s-1.
3.3 CO maps
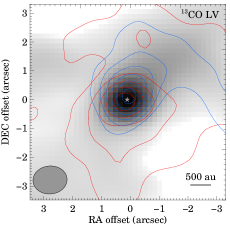
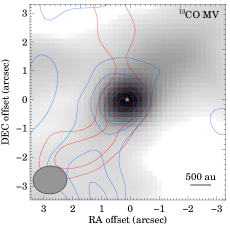
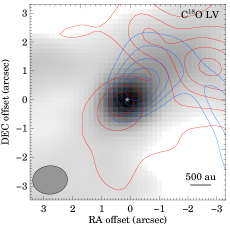
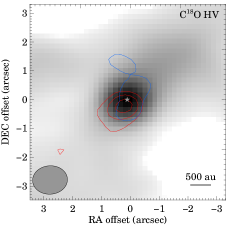
In Fig. 3 the LV emission is quite extended, but shows a centrally concentrated peak. The emission farther from the image center is probably coming from the gaseous envelope extending out to at least 10′′ from the central star, clearly seen in the channel maps in Figs. 6, 7, and 8. The emission towards the center in Fig. 3 shows a slight offset between the blueshifted and redshifted centroids (redshifted is offset toward the southeast, blueshifted is offset to the northwest compared to the stellar position). This is clearly visible in 13CO, but even more pronounced in C18O. This suggests a small rotating structure no larger than about 2′′ in radius.
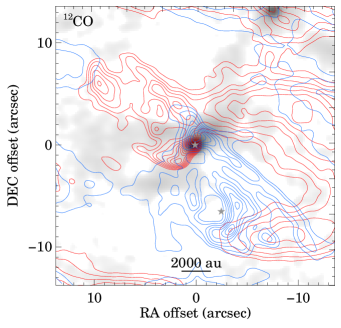
The MV emission is more compact. The maps show a structure where emission is mostly concentrated along narrow clumpy filaments with multiple bright peaks. There is a peak centered on the stellar position, and we see no offset between the blueshifted and redshifted centroids in Fig. 3. This result may reflect that in case of Keplerian rotation, the higher velocity material is closer to the central star. Allowing for the difference in signal-to-noise ratio, the 13CO and C18O maps are very similar an appearance. The redshifted emission shows a parabola opening towards the northeast with a relatively wide opening angle of about 80∘, while the blueshifted emission looks like a somewhat narrower ellipse extending towards the southwest with an opening angle of about 40∘. These structures are best visible at the appropriate velocities in the 13CO channel maps in Fig. 7. This geometry is very reminiscent of an outflow cavity, where emission is coming from the swept-up material in the cavity walls. HH 57 seems to be situated along the axis of the southwestern CO-emitting ellipse, close to its farther edge.
The HV emission (the first few and last few channels in Figs. 7 and 8) is very similar in structure to the MV emission, so part of it is possibly tracing the outflow cavity walls. The strong blueshifted emission to the southwest surrounds the position of the Herbig-Haro object HH 57, therefore, the strong CO emission may indicate the place where the jet hits the ambient interstellar material. At these velocities, the central part (Fig. 3) again shows an offset between the redshifted and blueshifted emission. This is unexpected for the rotating structure mentioned before. We propose that instead, we may see a large-scale rotation at the base of the parabolic/elliptic outflow cavities. Remarkable, the direction of rotation is the same for both sides of the bipolar outflow and for the compact central rotating object as well.
Fig. 6 in the Appendix reveals the structure of the 12CO emission at even higher velocities, as far as 15 km s-1 from the systemic velocity. In the blueshifted part, a curious new feature appears as a very straight line pointing from the star toward the southwest. In addition, the southwest elliptical structure seen in the MV and HV maps in 13CO and C18O is also discernible in 12CO. On the redshifted side, a new ellipse appears to the northeast. This seems to be different from the parabolic structure seen in 13CO and C18O, as it appears at higher velocities, and has a narrower opening angle of about 40∘, although its position angle is similar. The red and blueshifted emission displayed in Fig. 4, integrated for a very wide velocity range to account for the broad 12CO J=2–1 line wings, also show these structures, but with higher spatial resolution than any previous data, such as the single-dish 12CO J=3–2 maps published in Evans et al. (1994) and Kóspál et al. (2017a).
3.4 Spectro-astrometry
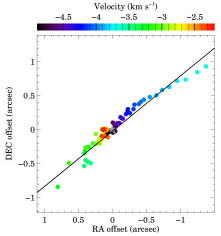
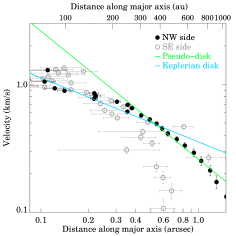
The rotation seen close to the central star at low velocities gives us the opportunity to further study this compact rotating structure and quantify its properties. We performed spectro-astrometry in our C18O data cube by calculating the centroid of the emission for each velocity channel. The centroid positions lined up very precisely along a position angle of 1293∘ east of north (Fig. 5). This outlines the direction of the major axis perpendicular to the rotation axis. Next, we plotted a position-velocity diagram along this major axis. Within about 1′′, this diagram looks as it is expected for a rotating disk. The northwestern part is brighter, just like in the continuum map.
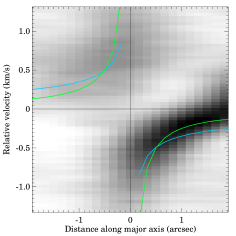
In Fig. 5 we also plotted the velocities as a function of the distance along the major axis as determined from the centroid position for each channel map. We overplotted two possible interpretations: a Keplerian disk with a radial profile of (blue curve), and a pseudo-disk corresponding to infall with angular momentum conservation, with a radial profile of (green curve). It seems that the inner part of the disk (within about 05) is Keplerian, while the outer part is sub-Keplerian and is more consistent with a pseudo-disk. This is mostly based on the brighter northwestern part of the disk, because the southeastern part is fainter and noisier, although a similar trend is apparent in the southeastern part as well. The deviation from the curve at distances 1′′ in the northwest side might be caused by contamination from the nearby source or stream of material seen in the continuum map and described in Sect. 3.1. Graphs showing similar transition from Keplerian to pseudo-disk with increasing distance were found, e.g., in Class I sources in Taurus by Harsono et al. (2014).
The stellar mass of the best-fitting Keplerian curve is 0.1 M⊙, corresponding to a rather low mass central star. This value is independent of the inclination, because it was measured along the major axis. We estimate an uncertainty of the stellar mass of about 20%, including the uncertainty coming from the distance, 700100 pc. From the pseudo-disk fit, we can derive the angular momentum of the disk, which is 183 au km s-1 (cf. 168 au km s-1 for L1551 IRS 5, Momose et al. 1998). We estimated the mass of the disk by integrating the 13CO line flux in a circular aperture within 05 and within 10, and obtained 0.01 and 0.03, respectively. We assumed that the emission is optically thin and assuming 50 K average gas temperature, and taking an isotopic ratio of 69 between 12CO and 13CO (Wilson, 1999) and a canonical CO-to-H2 abundance ratio of 10-4. Mass estimates from C18O give consistent results, a posteriori validating our assumption about the low optical depth both in the 13CO and C18O lines. The value obtained for the smaller area can be compared with the mass estimate from the continuum for the central source. Assuming a dust-to-gas mass ratio of 100, the total mass from the continuum measurement is 0.07, while it is only 0.01, if calculated from the CO. This hints for possible CO depletion (due to, e.g., freeze-out or conversion into other species) in the center of the system. Similar results were obtained also by Jørgensen et al. (2002) for low-mass protostellar envelopes and by Murillo & Lai (2013) in the VLA 1623 system.
4 Discussion
4.1 Comparison to Class 0/I protostars
Our observations revealed that in the V346 Nor system, there is an inner Keplerian disk surrounded by a infalling-rotating pseudo-disk, and an extended envelope, including a relatively narrow outflow cavity. These components are typically found in Class 0/I protostellar systems as well. At the beginning, the kinematics are dominated by the infalling motion within the envelope, but then the envelope starts a combination of rotation and infall with conserved angular momentum, as demonstrated by measurements of the velocity profile (e.g., VLA 1623 A, Murillo et al. 2013). In more evolved cases, a disk in Keplerian rotation is present as well (e.g., L1489 IRS, Hogerheijde 2001; Yen et al. 2014).
Table 4.1 shows the envelope and disk parameters of some well-studied Class 0/I protostars from the literature. A comparison with V346 Nor shows that the main characteristics of our target fall within the parameter range defined by these protostars. Concerning the velocity field in V346 Nor, a Keplerian disk is already present, but there are still signs of infall in the outer parts as indicated by the sub-keplerian rotation. This suggests that among protostars, our target represents an intermediate evolutionary state. In summary, the measured kinematic properties of V346 Nor enabled us to determine its evolutionary status, which could not be directly derived from its SED and bolometric temperature and luminosity due to the outburst.
| L1527 IRS | VLA 1623 A | HH 212 | L1551 IRS 5 | V346 Nor | |
|---|---|---|---|---|---|
| () | 0.19 | 0.22 | 0.18 | 0.1 | 0.1 |
| (au) | 150 | 180 | 120 | 160 | 350 |
| () | 0.9 | 0.8 | 0.1 | 0.06 | 0.23 |
| (au) | 10 000 | 2000 | 1200 | 6300 | |
| ( yr-1) | 710-6 | 510-6 | 6.410-6 | 610-6 | |
| Reference | (1) | (2) | (3) | (4) | (5) |
4.2 Comparison to other FUors
There are several high spatial resolution millimeter wavelength observations in the literature for FUors. In the following, we summarize their main findings and compare V346 Nor with them.
Z CMa is a complicated binary system of a FUor of 3 and a Herbig Be star of 16, with a separation of 105 au (Koresko et al., 1991; van den Ancker et al., 2004). Alonso-Albi et al. (2009) found a massive and compact envelope in the form of a toroid extending from 2000 au to 5000 au. To reproduce the SED, they needed a disk with an outer radius of 180 au, and they also mention the possibility of an outer, cold, spherical envelope. According to our APEX 12CO(3–2) data (Kóspál et al., in prep.), the CO emission has a deconvolved size of about 30 000 au, corroborating the claim of Alonso-Albi et al. (2009). Z CMa is known to drive a molecular outflow and has associated jets and HH objects (Poetzel et al., 1989; Evans et al., 1994).
L1551 IRS 5 is a well-studied prototypical embedded protostar which underwent an FU Orionis-type outburst, and which is also a binary object with a 50 au separation, including circumstellar disks, a circumbinary structure, and a large-scale envelope as well (Looney et al., 1997). L1551 IRS 5 drives a strong molecular outflow discovered by Snell et al. (1980). Fridlund et al. (2002) give a summary of the millimeter molecular line observations of the object, and present new observations indicating a large (7000 au radius) rotationally supported flattened structure, embedded in an even more extended (10 000 au radius) envelope. There are signs for infall of gas towards this disk-like structure (Ohashi et al., 1996; Momose et al., 1998, see also). Chou et al. (2014) suggests a Keplerian disk of radius 64 au and mass 0.07 around the protobinary with a central mass of 0.5, and a flattened, rotating-infalling envelope of 1 that connects to the inner Keplerian disk.
With a stellar mass of 0.25 , V2775 Ori is one of the lowest luminosity and lowest mass FUors (Caratti o Garatti et al., 2011). Using ALMA, Zurlo et al. (2017) found a very low-mass disk around the object (3). They also detected an outflow cavity marked by the CO emission of the material in the cavity walls, with an opening angle of about 30∘. The half-axis length of the outflow cavity is about 2500 au, so there should be an envelope of at least this radius around the system.
HBC 722 is a young eruptive star which has been in outburst since 2010. In quiescence, it was a normal T Tauri star with a K7-type (0.5–0.6 ) central star and a disk which remains undetected at millimeter wavelength, giving an upper limit of 0.01–0.02 for the total disk mass (Miller et al., 2011; Kóspál et al., 2011; Dunham et al., 2012). Kóspál et al. (2016) discovered a flattened molecular gas structure with a diameter of 1700 au and mass of 0.3 centered on HBC 722. No outflows are driven by the FUor (see also Dunham et al. 2012).
HBC 494 is an embedded object showing FUor characteristics associated with the Reipurth 50 N nebula (Reipurth & Bally, 1986; Reipurth & Aspin, 1997). Based on ALMA observations, Ruíz-Rodríguez et al. (2017) found a wide-angle outflow extending to 8000 au. The opening angle of the outflow cavity is 150∘, the widest known cavity among Class I protostars. At low velocities, the material at the base of the cavity shows infall toward the central object.
These previous sources are mostly young, embedded objects. Interestingly, the prototype object, FU Ori is different from them. It is a relatively wide separation binary (225 au, Wang et al. 2004). ALMA observations by Hales et al. (2015) suggest disks around both components with sizes of 45 au. The small disk sizes were confirmed by Liu et al. (2017). They detected no extended emission on spatial scales smaller than 3000 au, however, in our APEX data we resolved the 12CO(3–2) emission, and found an envelope with a radius of about 8000 au around the system (Kóspál et al., in prep.). FU Ori is not alone among FUors with having a more tenuous envelope. Similarly small-mass gas envelopes were found around Bran 76 and HBC 687 (Kóspál et al., 2017a).
The wide variety of envelope properties observed in FUors demonstrates that the eruptive phenomenon is present during the whole evolution from the earliest protostellar phases until the disk-only state. This was also the conclusion of the APEX CO survey of Kóspál et al. (2017a), where we found that the observed FUor sample could be divided into high (0.3) and low (0.01–0.02) envelope mass classes. We suggested that this division is also consistent with the findings of Quanz et al. (2007), who proposed that FUors evolve from an embedded state showing 10m silicate absorption to a more evolved state showing 10m silicate emission. The increasing visibility of the inner part of the system, reflected in the silicate feature, is driven by the subsequent eruptions associated with strong outflows. Green et al. (2006) argued that the opening angle of the outflow cavity would increase as the FUor evolves.
Our ALMA data show that V346 Nor is surrounded by an envelope with a total gas mass of 0.23. This result indicates that it belongs to the embedded subgroup of FUors. We measured opening angles of the outflow cavity between 40 and 80∘, which is relatively wide compared to some Class 0/I protostars but narrower than that of HBC 494. These results suggest that V346 Nor is still at a relatively early evolutionary phase, although its envelope properties and kinematics suggest that the outbursts already had an impact on the circumstellar material and it is on its way toward the T Tauri phase.
4.3 Infall/accretion mismatch
Momose et al. (1998) studied the gas kinematics around L1551 IRS 5, and found that the outer parts of the envelope show infall with conserved angular momentum, which shifts to a rotationally supported Keplerian disk in the inner regions. They explain that in such case, the infall rate can be estimated from the mass of the envelope and the infall velocity as follows:
| (2) |
Using the similarity of the velocity field observed in V346 Nor to that of L1551 IRS 5, we estimated the infall rate from the envelope onto the disk in V346 Nor using the equation above, obtaining 610 yr-1. Taking into account the uncertainty in the stellar mass, envelope mass, and envelope size, we estimate that this number is correct within a factor of 3. In the following, we relate this value to the quiescent and outburst accretion rates from the disk onto the star.
Using a simple accretion disk model, Kóspál et al. (2017b) estimated the accretion rate at multiple epochs throughout the outburst. While this gives fairly good indication on how the accretion rate changes with time in V346 Nor, its absolute value is more uncertain, as it depends strongly on the inclination (the model assumes a geometrically thin disk, which is probably not true in such a young system). In order to have independent estimates for the accretion rate in V346 Nor, we can calculate the bolometric luminosity by integrating the area under the outburst SED at peak brightness plotted in , assume that it is dominated by the accretion luminosity (good assumption for a FUor in outburst), and calculate from the following expression, which assumes that all gravitational potential energy is radiated away (Evans et al., 2009):
| (3) |
The SED gives an = 160 , which gives an accretion rate of yr-1 using and . This is close to the value given by Kóspál et al. (2017b) for the maximal accretion rate, which was yr-1. Another way to estimate the accretion rate is to use the Br line luminosity as an accretion rate tracer. Connelley & Greene (2010) measured a Br equivalent width of 2.26 . Using the KS-band photometry of 7.21 mag to calibrate the line flux, we obtained 1.310-16 W m-2 for the Br line flux (or 0.002 for the line luminosity). Using the empirical relationship between the Br line luminosity and the accretion luminosity from Mendigutía et al. (2011), we obtained yr-1, by correcting for a reddening of = 14 mag Kóspál et al. (2017b). This may be lower than what we obtained from the SED because at the time of the Br measurement of Connelley & Greene (2010), V346 Nor might have already started its fading due to a temporary decrease in the accretion.
Kóspál et al. (2017b) claimed that the accretion rate during the 2010 minimum of V346 Nor was at least a factor of 100 less than during its high accretion phase. This means it should be less than about yr-1. There is no other way to estimate the accretion rate pre-outburst, because the full optical-mm SED is not available before 1980, neither is there a Br measurement from that time. Comparing this with the envelope infall rate we calculated, 610 yr-1, there is a hint for a mismatch between the two values. The infall rate is larger, suggesting that the disk receives more material from the envelope than it can transfer onto the star with the quiescent accretion. It was speculated in the literature that the piling up of material in such a situation is the explanation for the FUor phenomenon (Bell & Lin, 1994). In V346 Nor, we might witness the first observational support that the mismatch between the infall and accretion rates indeed leads to FUor outbursts.
The large infall rate of 610yr -1, has another interesting implication. According to the numerical calculations of Ohtani et al. (2014), bursts induced by magneto-rotational instability (MRI) only happen below a critical value of 310 yr-1, above which bursts are suppressed and accretion proceeds in a quasi-stable manner. The critical value may be higher, as suggested by simulations of the MRI-induced bursts by Bae et al. (2014) and Zhu et al. (2008). Nevertheless, there always exists a threshold value for the mass infall rate above which the MRI-induced bursts cease. Such threshold does not exist in the disk fragmentation model of Vorobyov & Basu (2010), in which higher infall rates only promote more vigorous disk fragmentation. In the following, we discuss whether this model can explain the outburst history of V346 Nor.
In the disk fragmentation scenario, luminosity outbursts are caused by gaseous fragments forming via disk gravitational fragmentation and in-spiralling onto the star due to the loss of angular momentum caused by the gravitational interaction with spiral arms (Vorobyov & Basu, 2015). Depending on the ability of the fragments to withstand the tidal torques when approaching the star, two types of bursts can occur. In isolated bursts, the fragment is accreted almost intact, producing a well-defined burst. In clustered bursts, the fragment is stretched into a knotty filament when approaching the star, thus producing a series of closely packed bursts of varying amplitude separated from each other by several decades. The light curve of V346 Nor indicated a temporary halt in the accretion around 2010, followed by a re-brightening, all happening within a few years (Kraus et al., 2016; Kóspál et al., 2017b). This time span is too short to allow for a disk refill and transport of matter from the outer disk (scales of 100 au). The character of the V346 Nor outburst is reminiscent of the clustered burst phenomenon, although the mass of the disk we found in our ALMA observations (0.01–0.07) may be too low for gravitational fragmentation. We estimated the Toomre Q parameter for our disk following Equation (2) of Kratter & Lodato (2016), and found that the disk can either be graviationally unstable or stable depending on the disk mass we use in the 0.01–0.07 range. Other physical possibilities for the interrupted outburst of FU Ori-type stars are reviewed in Ninan et al. (2015). Finally, we note that in the gravitation fragmentation scenario, the luminosity between the closely packed bursts rarely falls below the pre-burst value (Fig. 12 in Vorobyov & Basu 2015), suggesting that the pre-outburst mass accretion rate in V346 Nor was even lower than that during the 2010 minimum.
5 Summary
We present the first ALMA observations of the FUor-type young outbursting star V346 Nor at 1.322 mm continuum and in the J=2–1 lines of 12CO, 13CO, C18O. In order to image the emission correctly at all spatial scales, we combined interferometric data from the 12 m and 7 m arrays with Total Power observations. Our main results and conclusions are the following:
-
•
We detected a fairly compact continuum source coinciding with the near-infrared stellar location, surrounded by more extended, fainter emission out to 6300 au. The dust mass in the compact source within 210 au is 710.
-
•
We detected extended CO emission in all three isotopologues. The spectra show profiles similar to what is typical for infalling envelopes around highly embedded objects.
-
•
Within the central beam, the 13CO and C18O spectra exhibit double-peaked profiles, symmetric around the systemic velocity of 3.55 km s-1, suggesting rotation.
-
•
A spectro-astrometric analysis of the C18O data cube revealed that from 350 to 700 au, the radial velocity profile is consistent with a pseudo-disk, while the inner 350 au more resembles a Keplerian disk around a 0.1 central star. The total gas mass within 350 and 700 au is 0.01 and 0.03, respectively.
-
•
The channel maps at large velocities reveal structures that we interpret as the walls of an outflow cavity, and measure a relatively wide opening angle of 40–80∘.
-
•
A comparison of V346 Nor with well-studied Class 0/I protostars show that the main characteristics of our target fall within the parameter range defined by these protostars.
-
•
Comparison with FUors having similar high spatial resolution millimeter CO data indicates that it belongs to the embedded subgroup of FUors.
-
•
We determined an infall rate from the envelope onto the disk of 610 yr-1, which is a factor of few higher than the quiescent accretion rate from the disk onto the star, hinting for a mismatch between the infall and accretion rates. This is the first observational support for such mismatch in a FUor, previously invoked to explain FUor outbursts.
-
•
The computed infall rate cannot exclude the MRI-driven outburst mechanism. Accretion of clumps in a gravitationally fragmenting disk is also a possibility, although the measured disk mass may be too low for this process.
Appendix A Channel maps of V346 Nor
References
- Alonso-Albi et al. (2009) Alonso-Albi, T., Fuente, A., Bachiller, R., et al. 2009, A&A, 497, 117
- Armitage et al. (2001) Armitage, P. J., Livio, M., & Pringle, J. E. 2001, MNRAS, 324, 705
- Bae et al. (2014) Bae, J., Hartmann, L., Zhu, Z., & Nelson, R. P. 2014, ApJ, 795, 61
- Bell & Lin (1994) Bell, K. R., & Lin, D. N. C. 1994, ApJ, 427, 987
- Bonnell & Bastien (1992) Bonnell, I., & Bastien, P. 1992, ApJ, 401, L31
- Caratti o Garatti et al. (2011) Caratti o Garatti, A., Garcia Lopez, R., Scholz, A., et al. 2011, A&A, 526, L1
- Chou et al. (2014) Chou, T.-L., Takakuwa, S., Yen, H.-W., Ohashi, N., & Ho, P. T. P. 2014, ApJ, 796, 70
- Connelley & Greene (2010) Connelley, M. S., & Greene, T. P. 2010, AJ, 140, 1214
- Dunham et al. (2012) Dunham, M. M., Arce, H. G., Bourke, T. L., et al. 2012, ApJ, 755, 157
- Dunham & Vorobyov (2012) Dunham, M. M., & Vorobyov, E. I. 2012, ApJ, 747, 52
- Dunham et al. (2013) Dunham, M. M., Arce, H. G., Allen, L. E., et al. 2013, AJ, 145, 94
- Dunham et al. (2014) Dunham, M. M., Stutz, A. M., Allen, L. E., et al. 2014, Protostars and Planets VI, 195
- Evans et al. (2009) Evans, N. J., Dunham, M. M., Jørgensen, J. K., et al. 2009, ApJS, 181, 321
- Evans (1999) Evans, II, N. J. 1999, ARA&A, 37, 311
- Evans et al. (1994) Evans, II, N. J., Balkum, S., Levreault, R. M., Hartmann, L., & Kenyon, S. 1994, ApJ, 424, 793
- Evans et al. (2015) Evans, II, N. J., Di Francesco, J., Lee, J.-E., et al. 2015, ApJ, 814, 22
- Fridlund et al. (2002) Fridlund, C. V. M., Bergman, P., White, G. J., Pilbratt, G. L., & Tauber, J. A. 2002, A&A, 382, 573
- Green et al. (2006) Green, J. D., Hartmann, L., Calvet, N., et al. 2006, ApJ, 648, 1099
- Hales et al. (2015) Hales, A. S., Corder, S. A., Dent, W. R. D., et al. 2015, ApJ, 812, 134
- Harsono et al. (2014) Harsono, D., Jørgensen, J. K., van Dishoeck, E. F., et al. 2014, A&A, 562, A77
- Hartmann & Kenyon (1996) Hartmann, L., & Kenyon, S. J. 1996, ARA&A, 34, 207
- Hogerheijde (2001) Hogerheijde, M. R. 2001, ApJ, 553, 618
- Jørgensen et al. (2002) Jørgensen, J. K., Schöier, F. L., & van Dishoeck, E. F. 2002, A&A, 389, 908
- Koresko et al. (1991) Koresko, C. D., Beckwith, S. V. W., Ghez, A. M., Matthews, K., & Neugebauer, G. 1991, AJ, 102, 2073
- Kóspál et al. (2017a) Kóspál, Á., Ábrahám, P., Csengeri, T., et al. 2017a, ArXiv e-prints, arXiv:1701.05018
- Kóspál et al. (2017b) Kóspál, Á., Ábrahám, P., Westhues, C., & Haas, M. 2017b, ArXiv e-prints, arXiv:1701.00250
- Kóspál et al. (2011) Kóspál, Á., Ábrahám, P., Acosta-Pulido, J. A., et al. 2011, A&A, 527, A133
- Kóspál et al. (2016) —. 2016, ArXiv e-prints, arXiv:1607.05925
- Kratter & Lodato (2016) Kratter, K., & Lodato, G. 2016, ARA&A, 54, 271
- Kraus et al. (2016) Kraus, S., Caratti o Garatti, A., Garcia-Lopez, R., et al. 2016, MNRAS, 462, L61
- Lee et al. (2014) Lee, C.-F., Hirano, N., Zhang, Q., et al. 2014, ApJ, 786, 114
- Liu et al. (2017) Liu, H. B., Vorobyov, E. I., Dong, R., et al. 2017, ArXiv e-prints, arXiv:1701.06531
- Lodato & Clarke (2004) Lodato, G., & Clarke, C. J. 2004, MNRAS, 353, 841
- Looney et al. (1997) Looney, L. W., Mundy, L. G., & Welch, W. J. 1997, ApJ, 484, L157
- Marton et al. (2017) Marton, G., Calzoletti, L., Perez Garcia, A. M., et al. 2017, ArXiv e-prints, arXiv:1705.05693
- McMullin et al. (2007) McMullin, J. P., Waters, B., Schiebel, D., Young, W., & Golap, K. 2007, in Astronomical Society of the Pacific Conference Series, Vol. 376, Astronomical Data Analysis Software and Systems XVI, ed. R. A. Shaw, F. Hill, & D. J. Bell, 127
- Mendigutía et al. (2011) Mendigutía, I., Calvet, N., Montesinos, B., et al. 2011, A&A, 535, A99
- Miller et al. (2011) Miller, A. A., Hillenbrand, L. A., Covey, K. R., et al. 2011, ApJ, 730, 80
- Momose et al. (1998) Momose, M., Ohashi, N., Kawabe, R., Nakano, T., & Hayashi, M. 1998, ApJ, 504, 314
- Murillo & Lai (2013) Murillo, N. M., & Lai, S.-P. 2013, ApJ, 764, L15
- Murillo et al. (2013) Murillo, N. M., Lai, S.-P., Bruderer, S., Harsono, D., & van Dishoeck, E. F. 2013, A&A, 560, A103
- Nayakshin & Lodato (2012) Nayakshin, S., & Lodato, G. 2012, MNRAS, 426, 70
- Ninan et al. (2015) Ninan, J. P., Ojha, D. K., Baug, T., et al. 2015, ApJ, 815, 4
- Ohashi et al. (1996) Ohashi, N., Hayashi, M., Ho, P. T. P., Momose, M., & Hirano, N. 1996, ApJ, 466, 957
- Ohtani et al. (2014) Ohtani, T., Kimura, S. S., Tsuribe, T., & Vorobyov, E. I. 2014, PASJ, 66, 112
- Poetzel et al. (1989) Poetzel, R., Mundt, R., & Ray, T. P. 1989, A&A, 224, L13
- Quanz et al. (2007) Quanz, S. P., Henning, T., Bouwman, J., et al. 2007, ApJ, 668, 359
- Reipurth (1981) Reipurth, B. 1981, A&AS, 44, 379
- Reipurth (1985) —. 1985, A&A, 143, 435
- Reipurth & Aspin (1997) Reipurth, B., & Aspin, C. 1997, AJ, 114, 2700
- Reipurth & Bally (1986) Reipurth, B., & Bally, J. 1986, Nature, 320, 336
- Ruíz-Rodríguez et al. (2017) Ruíz-Rodríguez, D., Cieza, L. A., Williams, J. P., et al. 2017, MNRAS, 466, 3519
- Sandell & Weintraub (2001) Sandell, G., & Weintraub, D. A. 2001, ApJS, 134, 115
- Shu (1977) Shu, F. H. 1977, ApJ, 214, 488
- Snell et al. (1980) Snell, R. L., Loren, R. B., & Plambeck, R. L. 1980, ApJ, 239, L17
- Tobin et al. (2012) Tobin, J. J., Hartmann, L., Chiang, H.-F., et al. 2012, Nature, 492, 83
- van den Ancker et al. (2004) van den Ancker, M. E., Blondel, P. F. C., Tjin A Djie, H. R. E., et al. 2004, MNRAS, 349, 1516
- Vorobyov & Basu (2006) Vorobyov, E. I., & Basu, S. 2006, ApJ, 650, 956
- Vorobyov & Basu (2010) —. 2010, ApJ, 719, 1896
- Vorobyov & Basu (2015) —. 2015, ApJ, 805, 115
- Vorobyov et al. (2013) Vorobyov, E. I., Zakhozhay, O. V., & Dunham, M. M. 2013, MNRAS, 433, 3256
- Wang et al. (2004) Wang, H., Apai, D., Henning, T., & Pascucci, I. 2004, ApJ, 601, L83
- Wilson (1999) Wilson, T. L. 1999, Reports on Progress in Physics, 62, 143
- Yen et al. (2014) Yen, H.-W., Takakuwa, S., Ohashi, N., et al. 2014, ApJ, 793, 1
- Zhu et al. (2008) Zhu, Z., Hartmann, L., Calvet, N., et al. 2008, ApJ, 684, 1281
- Zhu et al. (2009) Zhu, Z., Hartmann, L., Gammie, C., & McKinney, J. C. 2009, ApJ, 701, 620
- Zuckerman & Becklin (1993) Zuckerman, B., & Becklin, E. E. 1993, ApJ, 414, 793
- Zurlo et al. (2017) Zurlo, A., Cieza, L. A., Williams, J. P., et al. 2017, MNRAS, 465, 834