Hydrostatic-pressure effects on the pseudogap in slightly doped single crystals
Abstract
The influence of hydrostatic pressure up to P=1.05 GPa on resistivity, excess conductivity and pseudogap is investigated in slightly doped single crystals of (49.2 K and 0.5). The critical temperature is found to increase with increasing pressure at a rate , while decreases at a rate . Near , independently on pressure, the is well described by the Aslamasov-Larkin and Hikami-Larkin fluctuation theories, demonstrating a 3D-2D crossover with increase of temperature. The crossover temperature determines the coherence length along the c-axis Å at P=0, which is found to decrease with increasing P. At the same time, and the BCS ratio both increase with increasing hydrostatic pressure at a rate , implying an increase of the coupling strength with increasing P. At low temperatures below , the shape of the curve is found to be almost independent on pressure. At high temperatures, the shape of the curve changes noticeably with increasing P, suggesting a strong influence of pressure on the lattice dynamics. This unusual behavior is observed for the first time.
pacs:
74.25.Fy, 74.62.Fj, 74.72.Bk
The pseudogap (PG), which is opening in the excitation spectrum at the characteristic temperature , remains to be one of the most interesting and intriguing property of high-temperature superconductors (HTSCs) with the active CuO2 plane (cuprates) Kord ; S1 ; PB . According to the definition proposed by Mott M ; M2 , PG is a specific state of matter with a reduced density of the quasiparticle states (DOS) at the Fermi level at temperatures , where, is the superconducting transition temperature. In YBa2Cu3O7-δ (YBCO) a noticeable reduction of DOS at , i.e. PG, was observed soon after the discovery of the cuprates by the measurement of the Knight shift, , i. e. the frequency shift in the nuclear magnetic resonance (NMR) Al . NMR measurements allow one to deduce the spin susceptibility of the charge carriers. The Knight shift being proportional to the spin polarization in external magnetic field determines the static () and homogeneous () parts of the susceptibility, that is . In the Landau theory LP , where is the dependence of the density of the Fermi states on the energy in the normal phase. In the classical superconductors (DOS) and, hence, remains nearly constant in the whole temperature range of the existence of the normal phase, whereas in HTSCs it rapidly decreases at Al . Recently, the reduction of DOC and PG at K have been directly measured by angle resolved photoemission spectroscopy (ARPES) for the cuprate Bi2201 Kon . It was observed that as in the case of classical metals, DOS does not depend on temperature above , but it starts to rapidly decrease at . In consequence of this, a depleted DOS, i. e. PG is observed in a broad temperature range from to K. However, the physics of the processes leading to the decrease of DOS at remains uncertain so far Kord ; S1 ; PB ; Tel .
There is a noticeable number of theoretical models addressing the non-superconducting nature of the appearance of PG, see e. g. Refs. Kord ; Tel ; Gab ; Nor ; Ber and references therein. However, we adhere another viewpoint that PG appears in consequence of the formation of paired fermions (local pairs) in HTSCs at , see e. g. Refs. S1 ; EK ; Cho ; Yaz ; Mis ; Tch ; Kag and references therein. According to the theories of systems with small charge carrier density L ; H ; Eng , right those as HTSCs are, the local pairs (LP) can appear at in the form of the so-called strongly-bound bosons (SBB). By definition, SBB are low-dimensional, but exceptionally strongly bound pairs obeying the theory of Bose-Einstein condensation (BEC). The pair size is determined by the coherence length in the -plane, , the typical value of which in YBCO with a close-to-optimal doping level Å Sug ; WzK . Accordingly, the bound energy in this pair, , is very large H ; Eng . In consequence of this, SBB are not destroyed by thermal fluctuations and do not interact one with another since the pair size is much smaller than the distance between them. However, LP can only condensate at L ; H ; Eng . For this reason, upon approaching SBB have to transform into fluctuating Cooper pairs (FCP) which obey the Bardeen-Cooper-Schrieffer (BCS) theory DeGen . In this way, the theory predicts the BEC-BCS transition with decreasing , as observed experimentally Kon2 ; ST . In YBCO thin films, the temperature of this transition amounts to K S2 . At the same time, there exists one more characteristic temperature . According to the theory, the wave function phase stiffness has to be maintained up to EK ; Cho . This means that the superfluid density, , maintains a nonzero value up to EK ; Cor ; Tal ; DTS . However, the details of the BEC-BCS transition are not fully clear so far as well S1 ; H ; Eng ; ST ; Gus .
Pressure is a powerful tool for studying various properties of the cuprates Liu ; Wan ; Fer ; She ; V1 ; V2 ; V3 and it is widely used in experiments since the discovery of HTSCs Chu till present days Fan . Pressure noticeably affects and the resistance of HTSCs in the normal state. In contrast to the conventional superconductors, in the cuprates in the vast majority of cases the dependence is positive, whereas the derivative is negative and relatively large Liu ; Wan ; Fer . Here, is the resistivity in the -plane, that is parallel to the CuO2 conducting layers. The pressure impact mechanisms on are not ultimately understood for the reason that the nature of the transport properties of HTSCs, strictly speaking, is not completely clear. As is well known, the main contribution to the conductivity of the cuprates is provided by the planes between which there is a relatively weak interlayer interaction. Pressure is likely to lead to a redistribution of the charge carriers and to an increase of their concentration in the conducting CuO2 planes that should lead to a reduction of . Properly, the increase of under pressure should also lead to an increase of , i.e. to a positive value of observed in experiment. This process should take place easier in slightly doped samples S4 , where is small and there is a large number of oxygen vacancies Cav ; Ast .
The theoretical problem of the effect of hydrostatic pressure on in HTSCs was addressed in Ref. Liu . There are also several works where the influence of pressure on the fluctuation conductivity (FLC) in various cuprates was studied Wan ; Fer ; She . Recently, it has been shown that pressure also noticeably increases the value of the superconducting gap in various cuprates Kha ; DT . At the same time, there has been few works addressing the pressure effect on PG S4 ; S5 .
Here, we investigate of the hydrostatic pressure effect on the temperature dependencies of the resistivity in slightly doped Cu3O7-δ single crystals (YBCO) with K at . We investigated the fluctuation contributions to the conductivity, chiefly focusing on the temperature dependence of the excess conductivity .
From the analysis of the excess conductivity the value and the temperature dependence of FLC
and the pseudogap at pressures up to GPa ( GPa= kbar) are obtained.
The analysis is conducted in the framework of our model of the local pairs S1 ; ST , as detailed in the text.
Comparison of our results with the results obtained for Bi2Sr2CaCu2O8-δ (BiSCCO-2212) Liu , (Hg-2223) She and slightly doped HoBa2Cu3O7-δ S4 should help to understand better the mechanisms of the pressure effect on , , FLC and .
II. EXPERIMENT
The YBa2Cu3O7-δ (YBCO) single crystals were grown by the solution-melt technique according to Refs. V1 ; V2 ; V3 ; V4 . For electrical resistance measurements were selected crystals of rectangular shape with typical dimensions of mm3. The minimal dimension corresponds to the -axis. To obtain sample with a given oxygen content, the crystals were annealed in an oxygen atmosphere as described in Refs. V1 ; V4 . The electrical resistance in the -plane was measured in the standard four-probe geometry with a dc current up to 10 mA V5 in the regime of fully automated data acquisition. The measurements were conducted in the temperature sweep mode, with a rate of K/min near and about K/min at .
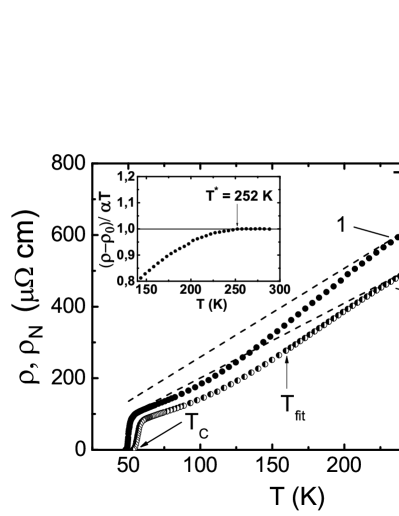
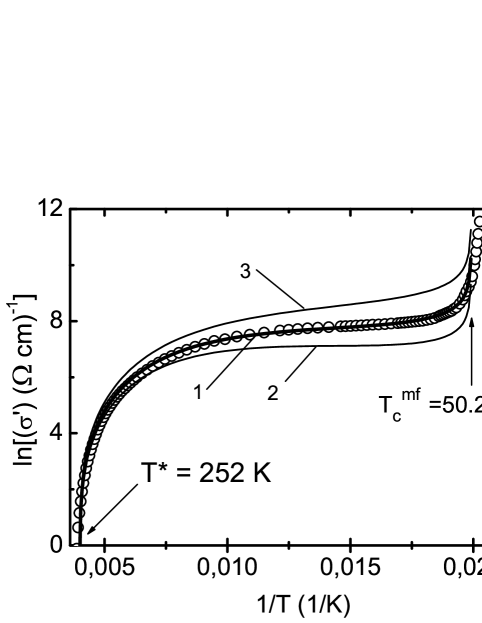
Hydrostatic pressure was created in an autonomous chamber of the cylinder-piston type according to the technique described in Refs. V5 ; Tho . For the determination of the effect of the oxygen redistribution the measurements were conducted in two to seven days after the application of pressure, after the relaxation processes had been completed S4 . Fig. 1 displays the temperature dependencies of the resistivity of the Cu3O7-δ single crystal with K and the oxygen index Ito measured at (curve 1) and GPa (curve 2). The curves have an expected -shaped form typical for slightly doped YBCO films S1 ; Mo and single crystals An ; Ito .

Besides, as it follows from the theory Tal ; Tch ; L ; H ; Eng , in this case the values of the characteristic temperature are noticeably higher than K observed in optimally doped YBCO compounds Ito ; Mo . Nevertheless, in the temperature range from K (curve 1) and K (curve 2) to K, the dependence is linear with the slopes cm/K-1 and cm/K-1 for and GPa, respectively (Fig. 1). The slopes were determined by computer linear fitting which confirms a rather good linearity of the dependences in the stated temperature range with the standard error of about at all applied pressures. The PG temperature is taken at the point where the experimental resistivity curve starts to turn down from the linear high-temperature behavior depicted by the dashed lines in the figure.
A more precise approach for the determination of relies upon the criterion DeM . Now is the temperature at which turns down from 1 as shown in the insert in Fig. 1. Both approaches yield the same T*’s values. In fact, we have six curves (six samples:Y0 - Y6) measured at P=0, 0.29, 0.56, 0.69, 0.78 and 1.05 GPa. The sample parameters obtained at different P are listed in Tables I and II. The dependencies measured for all intermediate pressure values also have the -shaped form and are located between the two curves shown in Fig. 1. The whole set of curves resembles that shown in Fig. 1 in Ref. S4 .
As can be seen from Table II, the pressure actually does not affect the values . At the same time, the linear slope is found to linearly decrease with P at a rate . Simultaneously the pressure increase leads to a noticeable reduction of the resistance of the sample. The relative reduction of as a function of pressure is practically independent on temperature above K and amounts to (Fig 2, curve 1). This value is smaller than GPa-1 for BiSCCO single crystals Liu , but it is noticeably larger than GPa-1 obtained by us for slightly doped HoBCO single crystals S4 .
At the same time amounts to GPa-1 (Fig 2, curve 2). The typical value for YBCO single crystals GPa-1 is in good agreement with our results, given the different doping level of the samples (see Ref. Liu and references therein). We note that demonstrates a nearly linear dependence on P with a standard error of about 0.00323 (Fig 2, curve 2) which is typical for the monocrystalline cuprates Liu . In contrast, of the studied YBCO single crystal displays the noticeable deviation from linearity centered at (Fig. 2, curve 1). The peculiarity is also seen in the PG results, as will be discussed in a follow-up paragraph.
In spite of a number of studies of the relaxation processes in the 1-2-3 system under high pressure, many aspects, such as the charge transfer and the nature of redistribution of the vacancy subsystem, still remain uncertain Liu ; Fer ; V1 ; V2 ; V3 ; S4 ; V4 . Thus, the electrical resistivity decreases not only as a consequence of the high pressure, but also in the isobar process of retaining the sample at room temperature, following the application of pressure S4 ; V2 ; V3 . Importantly, when the pressure is removed, finally coincides with the original curve obtained before the application of pressure S4 . This experimental fact confirms the reversibility of the process.
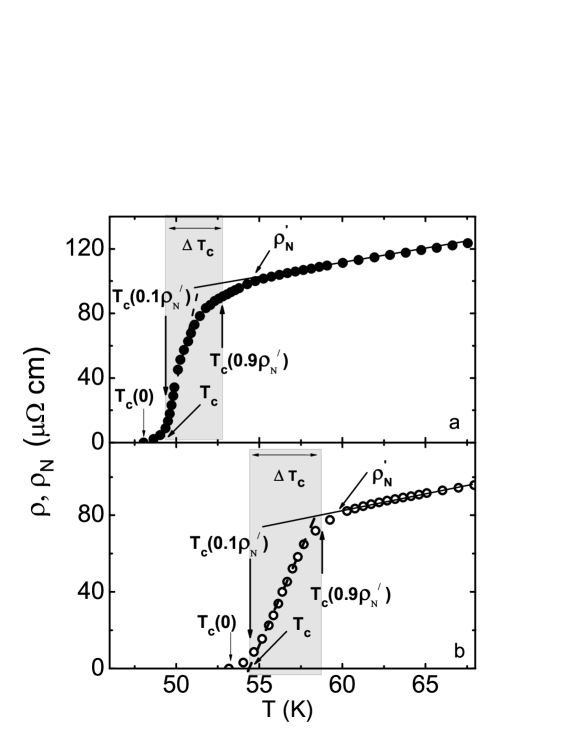
Figure 3 displays the resistive curves in the vicinity of for (a) and GPa (b), respectively, which contain all characteristic temperatures of the superconducting (SC) transition. As usually, the transition temperature is determined by extrapolation of the linear part of the resistive transition (dashed lines in Fig. 3) to Lang . It is seen that the resistive transitions are rather broad: and K ( GPa). Here and correspond to the temperatures at which resistivity decreases 10% and 90%, respectively, with respect to the value just above the resistive transition designated by the upper straight line (Fig. 3). In this way, pressure broadens the resistive transition by about , that is not so pronounced as in HoBCO single crystals where the effect is of the factor of S4 . In addition to this, one sees that expectedly rises from up to with increasing pressure, (see also Fig. 4).
From Fig. 3 and 4 we deduce that increases with increasing hydrostatic pressure at a rate KGPa-1 which is in a good agreement with our results for slightly doped (SD) HoBCO single crystals where KGPa-1 S4 .
The same value KGPa-1 was also observed by pressure experiments in SD polycrystalline by muon spin rotation () Mai .
This result confirms the expressed assumption that in cuprates, is likely to rise at the expense of the increase of the charge carrier density in the planes under pressure.
Meanwhile, it is likely that the oxygen vacancies in slightly doped cuprates provide the possibility for a more easy redistribution of as compared with optimally doped samples where the number of vacancies is small and is, in turn, rather large.
III. RESULTS AND DISCUSSION
A. Fluctuation conductivity
Independently on the value of the applied pressure, below the PG temperature resistivity curves of studied single crystal turn down from the linear behavior of (T) observed at higher temperatures (Fig.1). This leads to appearance of the excess conductivity
| (1) |
where = aT+ is the linear normal state resistivity extrapolated to the low- region S1 ; SP and is the intercept with the y-axis. This procedure of the normal state resistivity determination is widely used in literature (see S1 ; DeM ; Lang ; Oh ; ND and references therein) and has been justified theoretically within the frame-work of the nearly antiferromagnetic Fermi liquid (NAFL) model SP .

Here we focus on the analysis of FLC and PG derived from measured excess conductivity within our LP model. We mainly perform the analysis for the sample Y0 (P=0) and compare the results with those obtained for sample Y6 (with P=1.05 GPa applied for five days) as well as with the results obtained for BiSCCO, YBCO Liu ; Kha ; Mai and HoBCO S4 single crystals. Naturally, the same analysis has been performed for all other samples under study. The sample parameters derived from the analysis at different values of pressure are listed in Tables I and II.
First of all, the mean field critical temperature has to be found. Here is the critical temperature in the mean-field approximation, which separates the FLC region from the region of critical fluctuations or fluctuations of the SC order parameter directly near (where , neglected in the Ginzburg-Landau (GL) theory LP ; GL1 . In all equations used in the analysis the reduced temperature HL is used, viz.,
| (2) |
The correct determination of is hence crucial for the FLC and PG calculations.
Within the LP model it was convincingly shown that FLC measured for all HTSCs always demonstrates a crossover from the 2D () in 3D () regime as T approaches (S1 ; Beas ; Xie and references therein). As a result, near FLC is always extrapolated by the standard equation of the Aslamasov-Larkin (AL) theory AL with the critical exponent (Fig. 5, dashed line 1) which determines FLC in any 3D system
| (3) |
where is a coherence length along the c-axis, d is a distance between the conducting layers HL , and is a numerical factor to fit the data to the theory S1 ; Oh ; Beas . This means that the conventional 3D FLC is realized in HTSCs as T approaches S1 ; Xie . The result is most likely a consequence of Gaussian fluctuations of the order parameter in 2D metals which were found to prevent any phase coherence organization in 2D compounds L ; H ; Eng . As a result, the critical temperature of an ideal 2D metal is found to be zero (Mermin-Wagner-Hoenberg theorem) and a finite value is obtained only when three-dimensional effects are taken into account Tch ; L ; H ; Eng . From Eq. (3), one can easily obtain . Evidently, when (Fig. 4). This way of the determination of was proposed by Beasley Beas and justified in different FLC experiments S1 ; S5 ; Oh ; ND . Moreover, when is properly chosen, the data in the 3D fluctuation region near can always be fitted to Eq. (3).
Fig. 4 a displays the vs T plot (dots) for sample Y0 (P=0 GPa). The interception of the extrapolated linear with the T-axis determines (Table I). Now, when is found, Eq.(2) allows one to determine . Above the crossover temperature (, Fig. 5) the data deviate on the right from the line, suggesting the 2D Maki-Thompson (MT) Mak ; Th fluctuation contribution to FLC S1 ; HL ; S6 . Evidently, at the crossover temperature the coherence length is expected to amount to d ST ; HL ; S6 , which yields
| (4) |
and allows one to determine which is one of the important parameters of the PG analysis. Fig. 4b demonstrates the same consideration (circles) for sample Y6 (P=1.05 GPa) which yields . Also shown in the figure is the representative temperature . It is this temperature which is generally accounted for by the Ginzburg criterion which is related to the breakdown of the mean-field GL theory to describe the superconducting transition as mentioned above DeGen ; GL1 ; Kap . Above this criterion is identified down to the lowest temperature limit for the validity of the Gaussian fluctuation region. In Fig. 4 and 5 we denote as the crossover temperature delimiting the 3D Al fluctuation and critical intervals, and assign this temperature to the point where the data deviate from the straight lines corresponding to the 3D AL regime.
When is determined, the role of the fluctuating pairing in the PG formation can be clarified S1 ; Tch ; L ; H ; Eng ; HL . To accomplish this, vs is plotted in Fig. 5 (a — P=0 GPa, and b — P=1.05 GPa) in comparison with the fluctuation theories. As expected, above and up to = 54.5 K () vs is well extrapolated by the 3D fluctuation term by Eq. (3) of the AL theory (Fig. 5a, dashed line 1) with Å determined by Eq. (4) and (see Table I). Besides, by analogy with YBCO films Mo ; Lang ; Oh ; S6 and single crystals Liu ; Ito ; An , we use d=11.67Å=c which is the c-axis lattice parameter Chr . Accordingly, above and up to K () can be described well by the MT fluctuation term (5) (Fig. 5a, solid curve 2) of the Hikami-Larkin (HL) theory HL
| (5) |
which dominates well above in the 2D fluctuation region S6 ; Xie ; HL . In Eq. (5)
| (6) |
is a coupling parameter,
| (7) |
is the pair-breaking parameter, and defined by the relation
| (8) |
is the phase relaxation time, and sK. The factor ), where is the mean-free path and is the coherence length in the ab plane in the clean limit () S1 ; S6 .
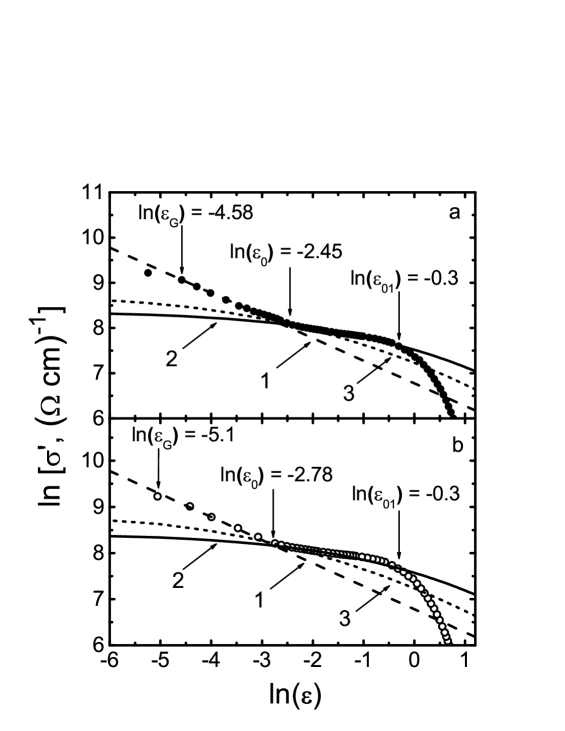
Unfortunately, neither nor are accessible in our experiments. To proceed with the analysis we will use the experimental fact that when all other parameters are properly chosen S6 . Thus, to calculate the MT fluctuation contribution using Eq. (5), only the coupling parameter by Eq. (6) remains to be defined. To determine we have to use another experimental fact that Å S2 ; S4 . Here corresponds to and is a distance between conducting planes in YBCO compounds. Substituting d=11.67 Å one can easy obtain which is actually the inter-planar distance in SD at P=0 GPa Chr ). This finding suggests that is properly chosen. The same considerations performed for Y6 (P=1.05 GPA) provide a very similar vs (Fig. 5b) with Å and Å (Table I).
Both and as well as are marked by the arrows in Fig. 5. Within the LP model it is believed that below , the exceeds and couples the planes by the Josephson interaction resulting in the appearance of 2D FLC of the MT type which lasts down to S1 ; Xie . Thus, it turns out that only has to govern Eq. (5) now and its proper choice is decisive for the FLC analysis. As mentioned above, the corresponding temperature is introduced to determine the temperature range in which the SC order parameter wave function stiffness has to be maintained EK ; Cho . As it is clearly seen from our analysis, it is just the range of the SC fluctuations which obey the conventional fluctuation theories. That is why we have to substitute instead of into Eq. (8) to find (100K) = (0.404 0.002)10-13s. If we use d=11.67Å and set = in Eq.(8), it results in (100K) = (3.47 0.002)10-13s, and we get the curve 3 (Fig. 5) which does not meet the experimental case. The result has to support the above considerations.
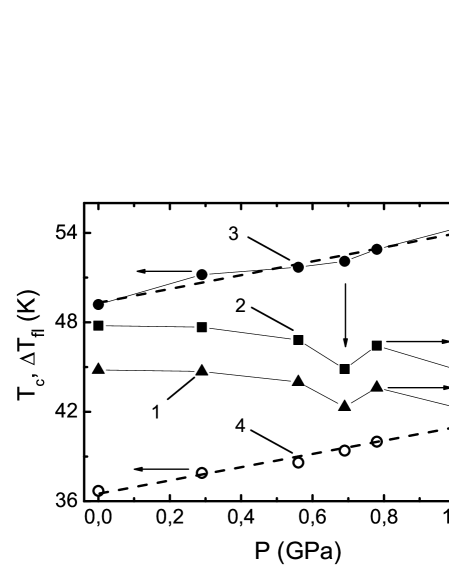

Importantly, the similar set of vs , as shown in Fig. 5, was obtained within our analysis for all applied pressure values used in the experiment. The data demonstrate a very good fit with both, the 3D AL and the 2D MT theories in the whole temperature region of interest, in perfect agreement with the above considerations. Somewhat surprisingly, despite of the pronounced decrease of the (Figs. 1 and 2) the value of is found to be nearly pressure-independent (Fig. 5). Moreover, at all pressures the range of the wave function stiffness, or the range of the SC fluctuations, is restricted by (Fig. 5). At the same time, the crossover temperature is slightly shifted towards (Fig.5, b) suggesting an increase of the range of the 2D MT fluctuations. As a result, both and smoothly decrease with pressure (Table I) but have noticeable peculiarity again at about 0.7 GPa (Fig. 6, curves 1 and 2, respectively). It is rather tempting to connect the observed peculiarity with , which demonstrates a hint on the similar peculiarity at (Fig. 6, curve 3). But, on the one hand, the same increase of at P=0.29 GPa produces no effect on and (Fig. 6). On the other hand, if decreases, has to increase (see Table I) in contrast with experiment.
It should be also noted that the range of FLC is located below 100 K. At the same time, measured at (Fig. 2, curve 2) demonstrates no visible peculiarity suggesting that the applied pressure is properly evaluated. Thus, the observed peculiarity can likely be attributed to the specific reaction of the electronic subsystem of the studied single crystal on the applied pressure. Apart from (Fig. 6, curve 3) all other characterictic FLC temperatures are also found to increas with pressure (Table I). Moreover, the increase is mainly linear. Also shown in Fig. 6 is (curve 4) which determines the range of SC fluctuations above EK ; Cor ; Tal . The found depenmdence looks rather linear without any pronounced peculiarities. Both, and also increase with increase of P, but increases a little bit faster, see Table I. Thus, pressure increases the range of the SC fluctuations in which the stiffness of the wave function of the SC order parameter is maintained EK ; Cho ; Cor ; DTS . It is worthy to emphasize that both, and are rather large, which is typical for the slightly doped cuprates EK ; Cor ; Tal ; S6 .
The obtained results allows one to consider the pressure effects on the extent of the resistive transition and the critical fluctuation regime S4 ; Wa ; Pur ; Sh .. As can be seen from Fig. 6 and Table I, both and are found to decrease at the similar rate with pressure. The total decrease is about 15% in both cases. It also means that the coupling constant by Eq. (6) or the coupling strength for the neighboring planes HL ; Sh ; Pur is nearly pressure-independent. This is in contrast with the HoBCO single crystals S4 , for which 9.4% increase of the was found at almost constant d, resulting in increase of both, given by Eq. (6) and . However, like in HoBCO single crystals, the range of critical fluctuation, , noticeably increases from 1.5 K at P=0 GPa up to 2.7 K at P=1.05 GPa (Fig. 4) resulting in the corresponding decrease of the 3D AL fluctuation region, - , from 3.7 K down to 2.6 K (Figs. 3 and 4). At the same time, in HoBCO the rate is a factor of larger, namely versus . As mentioned above, under pressure the width of the resistive transition, (Fig. 3), also increases but not so pronounced as found for HoBCO S4 . It is worthy to note that both, and demonstrate the expected peculiarity at P=0.7 GPa (Table II).
Having determined and for each applied pressure one can calculate the Ginzburg number defined as . Figs. 4a and b show that Gi also increases by about 20% when P increases from 0 to P=1.05 GPa (see also Table II). Together with the increase of (Fig. 3) and (Fig. 4) it implies that the genuine critical fluctuations are somewhat enhanced when the pressure is applied. It appears somewhat surprising that the pressure seems to improve the sample structure S4 . But similar results have been obtained for OD Pur as well as for HoBCO S4 ; S5 . According to the anisotropic GL theory, the Ginzburg number is defined as Kap ; Sch
| (9) |
where is a constant of the order of and is the jump of the specific heat at . According to the microscopic theory Sch , , where is the single-particle DOS at the Fermi level. is expected to be weakly P-dependent in this range since , as deduced from the Pauli susceptibility above , is rather insensible to pressure in HTSCs Sc . The analysis of the FLC amplitude points to a 15% decrease of under pressure. Together with the supposed corresponding decrease of it can completely provide the observed increase of Gi.
Parameters of the single crystal. P (GPa) 0 180.4 49.2 50.2 87.4 50.7 36.7 3.98 3.43 0.29 169.1 51.2 52.1 90.7 52.8 37.9 3.96 3.41 0.56 159.2 51.7 52.6 91.6 53.0 38.6 3.8 3.28 0.69 155.6 52.1 54.3 94.5 55.1 39.4 3.44 2.97 0.78 152.4 52.9 54.8 95.4 55.4 40.0 3.73 3.21 1.05 144.4 54.6 56.6 98.6 57.3 41.3 3.37 2.91
Parameters of the single crystal. P Gi D* (GPa) 0 0.01 1.5 252 5 122.1 184.17 231.6 170 0.29 0.013 1.6 252 5.4 136.5 192.28 229.2 165 0.56 0.008 1.3 252 5.8 145.8 199.76 226.2 159 0.69 0.015 3.0 252 6.4 164.3 190.71 217.0 153 0.78 0.011 2.5 253 6.5 167.7 190.3 152.8 138 1.05 0.012 2.7 254 6.6 178.4 198.41 205.7 135
This appears reasonable since
the relative increase of both the determined Ginzburg number and is in good agreement with the corresponding parameters obtained for OD single crystals under the same pressure ( and ) Pur .
It should be also noted that both Gi(P) and demonstrate the expected peculiarity showing the anomalously large values just at (Table II).
Naturally, we expected to find similar specific features in the PG behavior of our single crystals.
B. Pseudogap analysis
The main subject of the present study is the pressure effect on PG . In the resistivity measurements of HTSCs (Fig. 1), PG becomes apparent through the downturn of the longitudinal resistivity at from its linear behavior at higher temperatures above S2 ; Gus ; SP ; TS ; P ; Max . This results in appearance of the excess conductivity , as mentioned above (Eq. (1)). If there were no processes in the HTSCs resulting in the PG opening at , would remain linear down to Iye . Thus, the excess conductivity emerges as a result of the PG opening. Consequently, has to contain information about the value and the temperature dependence of PG Kord ; S1 ; L ; Gus ; Lang ; ND .
It is well established now S1 ; S6 ; TS that the conventional fluctuation theories modified for the HTSCs by Hikami and Larkin (HL) HL perfectly fit the experimental curves but only up to approximately . Clearly, to attain information about the pseudogap one needs an equation which specifies the whole experimental curve from down to and contains PG in explicit form. Besides, the dynamics of pair-creation and pair-breaking (exp) [see Eq.(11)] above must also be taken into account in order to correctly describe experiment S1 ; S2 . Due to the absence of a complete fundamental theory, the equation for has been proposed in Ref. S2 with respect to the local pairs:
| (10) |
Here is a numerical factor which has the meaning of the C-factor in the FLC theory S1 ; S2 ; Oh . The values of , (Eq. (2)) and by Eq. (4) have already been determined from the resistivity and the FLC analysis and are summarized in Table I. The rest of parameters, such as the theoretical parameter LL , the coefficient , and St , can be directly derived from the LP model analysis now S1 ; S2 . In the range (Fig. 7) or accordingly () (insert in Fig. 7), exp) S1 ; S2 ; LL . This feature turns out to be the basic property of the majority of the HTSCs including FeAs-based superconductors S7 . As a result, in this temperature interval ln() is a linear function of with a slope =1.06 which determines parameter LL for the sample Y0 (insert in Fig. 7). The same graphs, but with increasing up to 1.4 (=0.71) at P=1.05 GPa, where obtained for all applied pressures. This allowed us to get reliable values of which are found to noticeably affect the shape of the theoretical curves displayed in Figs. 7 and 8.
To find , we calculate using Eq. (10) and fit the experimental data in the range of 3D AL fluctuations near (Fig. 7) where is a linear function of the reduced temperature with the slope = 1/2. Besides, is assumed S2 ; St . To estimate , which we use in Eq. (10), we plot as a function of 1/T S2 ; Pr (Fig. 8, circles). In this case the slope of the theoretical curve by Eq. (10) turns out to be very sensitive to the value S1 ; S2 . The best fit (solid curve 1 in the figure) is obtained when , which is typical for the underdoped YBCO cuprates S1 ; S6 ; Wan ; Za . With all found parameters Eq. (10) perfectly describes the experimental now (Fig. 7, dashed curve 1). Similar graphs were revealed at all pressures applied. In all cases a very good fit is obtained allowing us to get reliable values of D* at all pressure values (Table II). Note that the found =5 (P=0) and =6.6 (P=1.05 GPa) correspond to the strong coupling limit being typical for HTSCs in contrast to the BCS weak coupling limit ( established for the d-wave superconductors Ino ; Fish ). The found values are in good agreement with results of the mentioned above experiment Mai in which a similar increase of the SC gap as well as of the BCS ratio is reported at the same pressure.
Solving Eq. (10) for the pseudogap one can readily obtain
| (11) |
Here (T) is the experimentally measured excess conductivity in the whole temperature interval from down to . The fact that is perfectly described by Eq. (10) (Figs. 7 and 8) allows one to conclude that Eq. (11) yields reliable both, the magnitude and the temperature dependence of the PG now. Fig. 9 displays the results of the PG analysis for samples Y0 and Y6. The bottom curve 1 (dots) is computed at P=0 using Eq.(11) with the following set of parameters derived from experiment: K, K, Å, , and = 122.1 K (Tables I and II). The upper curve 2 (semicircles) is computed at P=1.05 GPa with the following set of parameters: K, K, Å, , and = 178.4 K (Tables I and II). As can be seen in the figure, both curves look rather similar, especially in the range of low temperatures. At the same time, a pronounced increase of with increase of P is observed. The values of for the slightly doped samples investigated in this work are summarized in Table II. The revealed increase of PG under pressure is explicitly observed for the first time and represents the main result of our study. The details of the PG behavior under hydrostatic pressure are analyzed next.
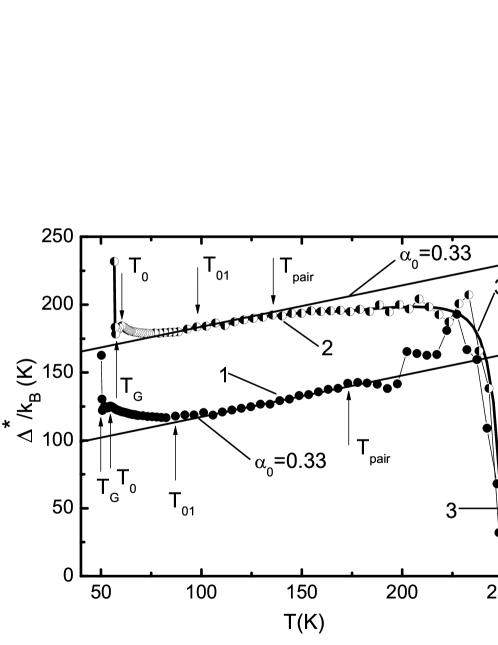
Fig. 9 shows that each typical feature of the curve occurs at the corresponding characteristic temperature. Indeed, below appears to be linear down to . The linearity is designated by the straight solid lines with the slope which is found to be pressure-independent (see also Fig. 10). In accordance with the LP model, above the LPs have to exist mostly in the form of SBBs. Below they have to transform into FCP. Thus, separates both regimes S1 ; ST ; L ; Gus . Here is introduced as a temperature at which turns down from its linear behavior with increase of T. Below PG increases gradually likely due to the formation of SC fluctuations, showing maximum at . Below it rapidly decreases down to , which is determined as a leftmost temperature with the reliable value. Below increases irregularly because this is the region of critical fluctuations where the LP model does not work. Thus, the LP model approach allows one to get precise values of and, hence, reliable values of summarized in Tables I and II. Evidently, noticeably increases with increasing pressure as mentioned above.
In many experiments S2 ; LL ; Pr it was revealed that determined by Eq. (11) is very sensitive to any uncertainties in the determination which stems from the spread in the resistivity data. It results in pronounced jumps of calculated at high temperatures near (Fig. 9), where changes at a very high rate (see Fig. 7), which have no intrinsic physical meaning. To avoid these jumps all resistivity curves were fitted by a polynomial down to (e.g. see Fig. 1 curve 2). Solid curve 3 in Fig. 9 indicates the result of such an approach based on the analysis of the resistivity curve fitted at P=1.05 GPa. As is evident from the figure, the polynomial fit provides a precise description of the raw data.
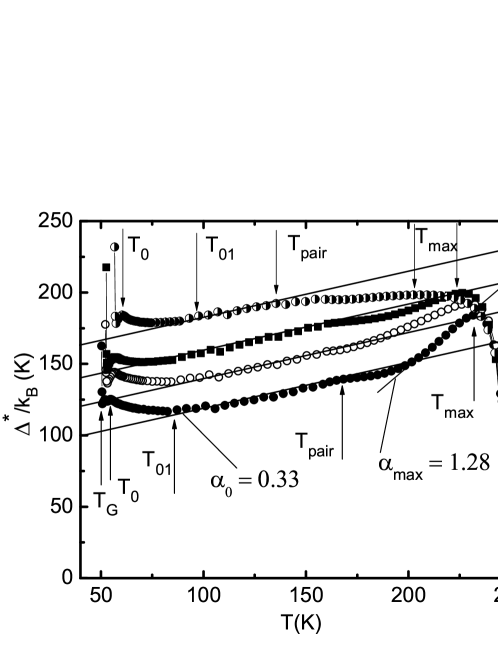
Analogous curves calculated at P=0, 0.29, 0.56 and 1.05 GPa using the same fitting procedure are plotted in Fig. 10. The curves calculated at P=6.9 and 7.8 GPa are not shown to simplify reading the data. The calculations were performed using Eq. (11) with the corresponding sets of parameters determined in the above analysis (Tables I and II). It should be emphasized that all parameters listed in the Tables, except and , where determined using FLC and the curves calculated with the raw resistivity data. As can be observed in the figure, the only difference from the curves shown in Fig. 9 is the appearance of the expected high-temperature maximum at followed by the region of the linear behavior with the positive slope . The maximum appears to be a typical feature of the SD single crystal PG behavior S4 ; S5 . With increase of pressure, the slope rapidly decreases and the maximum disappears already at . Simultaneously, as well as decreases gradually with P, whereas the corresponding and increase, but again with the expected peculiarity at as shown in Fig. 11, curve 1 and curve 2, respectively. Thus, the bulk of the sample parameters demonstrate the peculiarity at which appears to be the particular pressure in our case. As a result, with increase of pressure the shape of the dependence changes noticeably in the range of high T. But it remains almost pressure-independent below . Eventually, at P=1.05 GPa the curve acquires the specific shape with being typical for SD YBCO films at P=0 S1 ; S2 . This suggests a strong influence of pressure on the lattice dynamics Mai especially in the high-temperature region.

.
Also plotted in Fig. 11 is (curve 3, triangles). As expected, D* and (curve 2, squares) both demonstrate identical pressure dependences. It is important to emphasize that has been obtained from the fundamentally different approach, namely from fitting of the measured excess conductivity to Eq. (10), as illustrated in Fig. 8. Thus, the different approaches give the same result which indicates that PG increases with pressure at a rate . This value is a factor of larger than that reported using tunneling spectroscopy of Ag-Bi2223 point contacts DT but again in good agreement with the results of the mentioned above experiment on the SD polycrystalline Mai .
Thus, for slightly doped YBCO single crystals both and the BCS ratio increase upon increasing applied pressure. This suggests an increase of the coupling strength with increasing pressure. Strictly speaking, the increase of PG, as well as the SC gap Mai ; DT in the HTSCs under hydrostatic pressure remains even less comprehensible than the corresponding increase of . In fact, the pressure dependence of the SC transition temperature is determined by two mechanisms. First, it is the pressure induced charge transfer to planes, , as mentioned above. The second mechanism consists in the possible increase of the pairing interaction which depends on pressure. For underdoped cuprates the former mechanism dominates in the pressure effect on (see Ref Mai and references therein). It is well known that in YBCO the unique proximity between the Cu and O states is realized L ; Im . As a result, the band structure of the cuprate HTSCs is determined by the strongly correlated electron motion on the orbital which is likely under the influence of the one. Hydrostatic pressure can very likely affect the interaction. The possible increase of under pressure could result in increase of both and . However, it is not clear whether this mechanism strong enough to provide the observed rather large increase of both, the SC gap and the pseudogap.
Details of the electron-phonon interaction in HTSCs, which are known to be rather specific Max ; Zu , were thoroughly analyzed in Ref.DT by means of tunneling spectroscopy of Ag-Bi2223 point contacts under hydrostatic pressure. It was shown that the SC gap increases with increasing pressure at a rate resulting in the corresponding increase of D*. Simultaneously, the phonon spectrum was found to be noticeably shifted towards low energies. The anomalous softening of the phonon frequencies under pressure is believed to be the result of the specific electron-phonon interaction in Bi2223 arising from the electron hopping between the conducting planes and is concluded to cause the observed increase of the SC gap (see Ref.DT and references therein). Unfortunately, there is lack of such experiments for YBCO. As a result, the physics behind the pronounced increase of the pseudogap observed in the present study under hydrostatic pressure as well as the corresponding increase of the superconducting gap reported in Ref. Mai still remains uncertain.
IV Conclusion
The pressure dependence of the resistivity, excess conductivity and pseudogap (PG) of slightly doped single crystals of was studied within the local pair model. It was expectedly found that with increasing pressure the sample resistivity decreases at a rate whereas the critical temperature increases at a rate , which both are in good agreement with those obtained for the YBCO compounds by different experimental technique. Pressure is believed to stimulate the processes of the charge carriers redistribution resulting in increase of in the conducting CuO2 planes, that should lead to the observed reduction of as well as to the increase of . Simultaneously, the noticeable decrease of the distance between the conducting planes with pressure was observed. It could lead to a modification of the pairing interaction by pressure, which, in turn, also can lead to increase . Independently on pressure near , is well described by the Aslamasov-Larkin and Hikami-Larkin fluctuation theories demonstrating a 3D-2D crossover with increase of temperature. The crossover temperature determines the coherence length along the c-axis Å at P=0 GPa. The revealed value of is typical for the slightly doped cuprates and it is found to decrease with P. The rest of the sample parameters also change with increasing pressure, demonstrating a noticeable peculiarity at , suggesting a strong influence of pressure on the lattice dynamics likely due to the pressure effect on the pairing interaction in the cuprates.
The same conclusion arises from the observation that pressure noticeably changes the shape of the curve at high temperatures above but leaves it almost invariant at .
The pseudogap and the BCS ratio both increase with increasing applied hydrostatic pressure at a rate , implying an increase of the coupling strength in the curates with pressure.
The explicit modification of the temperature dependence of PG in the slightly doped HTSCs with increasing pressure is observed for the first time.
The found rate of the PG modification is a factor of larger than that observed by pressure experiments in OD polycrystalline Bi2223 using a tunneling technique.
In Bi compounds the enhancement of both, SC gap and was attributed to
the specific electron-phonon interaction in Bi2223 arising from possible electron hopping between the conducting
planes.
It seems to be rather tempting to ascribe the observed increase of the PG in single crystal to the similar softening of the phonon spectra under pressure.
However, there is lack of such experiments with YBCO, and the physics behind the observed PG increase under hydrostatic pressure still remains uncertain, thus demanding a further study.
References
- (1) A. A. Kordyuk, arXiv:1501.04154v1 [cond-mat.suprcon] (2015).
- (2) A. L. Solovjov, Superconductors - Materials, Properties and Applications. Chapter 7: Pseudogap and local pairs in high-Tc superconductors, InTech, Rijeka, 137 (2012).
- (3) R. Peters, and J. Bauer, arXiv:1503.03075v1 [cond-mat.suprcon] (2015).
- (4) N. F. Mott, Rev. Mod. Phys. 40, 677 (1968).
- (5) N.F. Mott, Metal Insulator Transition, World Scientific, London, 1974.
- (6) H. Alloul, T. Ohno, and P. Mendels, Phys. Rev. Lett. 63, 1700 (1989).
- (7) E. M. Lifshitz and L. P. Pitaevski, Statistical Physics, vol. 2, Moscow: Nauka, 1978.
- (8) Takeshi Kondo, A. D. Palczewski, Y. Hamay et al. arXiv:1208.3448v1 (2012).
- (9) L. Taillefer, Annu. Rev. Condens.Matter Phys. 1, 51 (2010).
- (10) A. M. Gabovich and A. I. Voitenko, Phys. Rev. B, 80, 224501 (1-9) (2009).
- (11) M.R. Norman, in: Novel Superfluids, vol. 2, K.H. Bennemann and J.B. Ketterson (eds.), Oxford University Press (2013).
- (12) C. Berthod, Y. Fasano, I. Maggio-Aprile, A. Piriou, E. Giannini, G. Levy de Castro, Q. Fischer, Phys. Rev. B 88, 014528 (2013).
- (13) V. J. Emery and S. A. Kivelson, Nature, 374, 434 (1995).
- (14) H-Y. Choi, Y. Bang, and D. K. Campbell, Phys. Rev. B 61, 9748 (2000).
- (15) A Yazdani, J. Phys.: Condens. Matter 21, 164214 (9pp) (2009).
- (16) Vivek Mishra, U. Chatterjee, J. C. Campuzano, and M. R. Norman, Nature Phys. Lett. 10, 357 (2014).
- (17) O. Tchernyshyov, Phys. Rev. B 56, 3372 (1997).
- (18) R. Combescot, X. Leyronas, and M. Yu. Kagan, Phys. Rev. A 73, 023618 (2006).
- (19) V.M. Loktev, Low Temp. Phys. 22, 488 (1996).
- (20) R. Haussmann, Phys. Rev. B, 49, 12975 (1994).
- (21) J.R. Engelbrecht, A. Nazarenko, M. Randeria, and E. Dagotto, Phys. Rev. B 57, 13406 (1998).
- (22) J. Sugawara, H. Iwasaki, N. Kabayashi, H. Yamane, and T. Hirai. Phys. Rev. B 46, 14818 (1992).
- (23) Winzer K. and Kumm G. Z. Phys. B.- Condensed Matter,82, 317 (1991).
- (24) T. Kondo, Y. Hamaya, Ari D. Palczewski, T. Takeuchi, J. S.Wen, Z. J. Xu, G. Gu, J. Schmalian and A. Kaminski, Nature Phys Lett. 7, 21 (2011).
- (25) P. G. De Gennes, Superconductivity of metals and alloys (W. A. Benjamin, INC., New York - Amsterdam, 1966), p. 280.
- (26) A. L. Solovjov, M. A. Tkachenko, Metallofiz. Noveishie Tekhnol. —bf 35, 19 (2013), arXiv:1112.3812v1 [cond-mat.supr-con] (2012).
- (27) A. L. Solovjov, V. M. Dmitriev. Low Temp. Phys. 32, 99 (2006).
- (28) J. Corson, R. Mallozzi and J. Orenstein , J.N. Eckstein, I. Bozovic. Nature, 398, 221 (1999).
- (29) J. L. Tallon, F. Barber, J. G. Storey and J. W. Loram, Phys.Rev. B 87, 140508(R) (2013).
- (30) A.I. D’yachenko, V. Yu. Tarenkov, S. L. Sidorov, V. N. Varyukhin, and A. L. Solovjov, Low. Temp. Phys. 39, 323 (2013).
- (31) V. P. Gusynin, V. M. Loktev, S. G. Sharapov. ZETF Lett. 65, 170 (1997).
- (32) H.J. Liu, Q. Wang, G.A. Saunders, D.P. Almond, B. Chapman, K. Kitahama, Phys. Rev. B 51, 9167 (1995).
- (33) Q. Wang, G.A. Saunders, H.J. Liu, M.S. Acres, D.P. Almond, Phys. Rev. B 55, 8529 (1997).
- (34) L.M. Ferreira, P. Pureur, H.A. Borges, P. Lejay, Phys. Rev. B 69, 212505 (2004).
- (35) L.J. Shen, C.C. Lam, J.Q. Li, J. Feng, Y.S. Chen, H.M. Shao, Supercond. Sci. Technol. 11, 1277 (1998).
- (36) R.V. Vovk, Z.F. Nazyrov, M.A. Obolenskii, I.L. Goulatis, A. Chroneos, V.M. Pinto Simoes, Philos. Mag. 91, 2291 (2011).
- (37) R.V. Vovk, M.A. Obolenskii, Z.F. Nazyrov, I.L. Goulatis, A. Chroneos, V.M. Pinto Simoes, J. Mater Sci.: Mater. Electron. 23, 1255 (2012).
- (38) R.V. Vovk, A.A. Zavgorodniy, M.A. Obolenskii, I.L. Goulatis, A. Chroneos, V.P. Pinto Simoes, J. Mater. Sci. Mater. Electron. 22, 20 (2011).
- (39) C.W. Chu, P.H. Hor, R.L. Meng, L. Gao, A.J. Huang, and Y.Q. Wang, Phys. Rev. Lett. 58, 405 (1988).
- (40) Y. Fang, D. Yazici, B. D. White, and M. B. Maple, arXiv:1507.03172v1 [cond-mat.supr-con], 2015.
- (41) A. L. Solovjov, M. A. Tkachenko, R. V. Vovk , A. Chroneos, Physica C 501, 24 (2014).
- (42) R. J. Cava, Science 243 (4943), 656 (1990).
- (43) M. Asta, D. de Futaine, G. Ceder. E. Salomons, and M. Kraitchman, J. Less. Common Metals 168, 39 (1991).
- (44) R. Khasanov, M. Bendele, A. Amato, K. Conder, H. Keller, H.-H. Klauss, H. Luetkens, and E. Pomjakushina, arXive:0912.0471v1[cond-mat.supr-con], 2009.
- (45) A.I. D’yachenko, V. Yu. Tarenkov, Phys. Techn. High Pres. 24, 24 (2014).
- (46) A. L. Solovjov, M. A. Tkachenko, R. V. Vovk , M. A. Obolenskii, Low. Temp. Phys. 37, 840 (2011).
- (47) R. V. Vovk, M. A. Obolenskii, A. A. Zavgorodniy, I. L. Goulatis, V. I. Beletskii, A. Chroneos, Physica C 469, 203 (2009).
- (48) R.V. Vovk, M.A. Obolenskii, A.A. Zavgorodniy, A.V. Bondarenko, I.L. Goulatis, A.V. Samoilov, A.I. Chroneos, J. Alloys Comp. 453, 69 (2008).
- (49) J.D. Thompson, Rev. Sci. Instrum. 55 231 (1984).
- (50) T. Ito, K. Takenaka, and S. Uchida, Phys. Rev. Lett. 70, 3995(1993).
- (51) B. Wuyts, V. V. Moshchalkov, and Y. Bruynseraede. Phys. Rev. B 53, 9418 (1996).
- (52) Y. Ando, S. Komiya, K. Segawa, S. Ono, and Y. Kurita, Phys. Rev. Lett. 93, 267001 (2004).
- (53) E. V. L. de Mello, M. T. D. Orlando, J. L. Gonzalez, E. S. Caixeiro, and E. Baggio-Saitovich, Phys. Rev. B, 66, 092504 (2002).
- (54) W. Lang, G. Heine, P. Schwab, X. Z. Wang, and D. Bauerle, Phys. Rev. B, 49, 4209 (1994).
- (55) A. Maisuradze, A. Shengelaya, A. Amato, E. Pomjakushina, and H. Keller. Phys. Rev. B 84, 184523 (2011).
- (56) B. P. Stojkovic, D. Pines, Phys. Rev. B 55, 8576 (1997).
- (57) B. Oh, K. Char, A. D. Kent, M. Naito, M. R. Beasley et al., Phys. Rev. B, 37, 7861 (1988).
- (58) R. K. Nkum and W. R. Datars, Phys. Rev. B, 44, 12516 (1991).
- (59) V. L. Ginzburg, L. D. Landau, JETP, 20, 1064 (1950).
- (60) S. Hikami, A.I. Larkin, Mod. Phys. Lett. B, 2, 693 (1988).
- (61) M. R. Beasley, Phisica B 148, 191 (1987).
- (62) Y. B. Xie, Phys. Rev. B, 46, 13997 (1992).
- (63) L. G. Aslamazov and A. L. Larkin, Phys. Lett., 26A, 238 (1968).
- (64) K. Maki, Prog. Theor. Phys., 39, 897 (1968).
- (65) R. S. Thompson, Phys. Rev. B, 1, 327 (1970).
- (66) A.L. Solovjov, H.-U. Habermeier, T. Haage, Low Temp. Phys., 28, 22 (2002), and, 28, 144 (2002).
- (67) A. Kapitulnik, M. R. Beasley, C. Castellani, and C. Di Castro, Phys. Rev. B 37, 537 (1988).
- (68) G.D. Chryssikos, E.I. Kamitsos, J.A. Kapoutsis et al. : Physica C 254, 44 (1995).
- (69) B.N. Goshchitskii, V.L. Kozhevnikov, M.V. Sadovskii, Int. J. Mod. Phys. B2, 1331 (1988).
- (70) A. L. Solovjov, V. N. Svetlov, V. B. Stepanov, S. L. Sidorov, V.Yu. Tarenkov, A. I.D yachenko, and A.B.Agafonov, arXiv:1012.1252v [cond-mat,supr-con]. Twelfth Int. Conf. on Low Temp. Phys., Kyoto, 1970, edited by E. Kanda (Keigaku, Tokyo, 1971), p. 361.
- (71) Q. Wang, G. A. Saunders, H. J. Liu, M. S. Acres, and D. P. Almond, Phys. Rev. B 55, 8529 (1997).
- (72) L. M. Ferreira, P. Pureur, H. A. Borges, and P. Lejay, Phys. Rev. B 69, 212505 (2004).
- (73) L J Shen, C C Lam, J Q Li, J Feng, Y S Chen and H M Shao, Supercond. Sci. Technol. 11, 1277 (1998).
- (74) T. Schneider and J. M. Singer, Phase Transition Approach to High Temperature Superconductivity: Universal Properties of Cuprate Superconductors (Imperial College Press, London, 2000).
- (75) J. S. Schilling and S. Klotz, in Physical Properties of High Temperature Superconductors, edited by D. M. Ginsberg (World Scientific, Singapore, 1992), Vol. 3, p. 59.
- (76) Y. Iye Transport properties of high Tc cuprates. Phys. Properties of High- Temp. Superconductors. Ed. D. M. Ginsberg. Singapore: World Scientific, 1992, Vol.3, 285-361.
- (77) T. Timusk and B. Statt. Rep. Prog. Phys. 62, 161 (1999).
- (78) A. A. Pashitskii, Low Temp. Phys. 21, 763 (1995); and Low Temp. Phys. 21, 837 (1995).
- (79) E. G. Maksimov, Physics-Uspekhi 43, 965 (2000).
- (80) B. Leridon, A. Defossez, J. Dumont, J. Lesueur, and. J. P. Contour, Phys. Rev. Lett. 87, 197007(1- 4) (2001).
- (81) E. Stajic, A. Iyengar, K. Levin, B. R. Boyce, and T. R. Lemberger, Phys. Rev. B 68, 024520 (2003).
- (82) D. D. Prokof ev, M. P. Volkov, and Yu. A. Bojkov, Fiz. Tverd. Tela, 45, 11 (2003).
- (83) K. W. Wang, W. Y. Ching, Physica C, 416, 47 (2004).
- (84) R. O. Zaitsev, Zh. Eksp. Teor. Fiz. (JETF), 125, 891 (2004).
- (85) D.S. Inosov, J.T. Park, A. Charnukha, Yuan Li, A.V. Boris, B. Keimer, V. Hinkov, Phys. Rev. B83, 214520 (2011).
- (86) Q. Fischer, M. Kugler, I. Maggio-Aprile, Christophe Berthod, Rev. Mod. Phys. 79, 353 (2007).
- (87) M. Imada, A. Fujimori, Y. Tokura, Rev. Mod. Phys.- 1998. 70, 1040 (1998).
- (88) E.E. Zubov, Physica C, 497, 67 (2014).