Current address: ]Department of Physics and James Franck Institute, The University of Chicago, 5720 S. Ellis Ave, Chicago, Illinois 60637, USA Current address: ]LMGC, UMR 5508 CNRS-University Montpellier, 34095 Montpellier, France
Force and Mass Dynamics in Non-Newtonian Suspensions
Abstract
Above a certain solid fraction, dense granular suspensions in water exhibit non-Newtonian behavior, including impact-activated solidification. Although it has been suggested that solidification depends on boundary interactions, quantitative experiments on the boundary forces have not been reported. Using high-speed video, tracer particles, and photoelastic boundaries, we determine the impactor kinematics and the magnitude and timings of impactor-driven events in the body and at the boundaries of cornstarch suspensions. We observe mass shocks in the suspension during impact. The shockfront dynamics are strongly correlated to those of the intruder. However, the total momentum associated with this shock never approaches the initial impactor momentum. We also observe a faster second front, associated with the propagation of pressure to the boundaries of the suspension. The two fronts depend differently on the initial impactor speed, , and the suspension packing fraction. The speed of the pressure wave is at least an order of magnitude smaller than (linear) ultrasound speeds obtained for much higher frequencies, pointing to complex amplitude and frequency response of cornstarch suspensions to compressive strains.
pacs:
47.57.Gc, 81.05.Rm, 78.20.hbDense suspensions, such as cornstarch in water, provide a rich set of phenomena, including complex non-Newtonian response to shear Brady85 ; Wagner09 ; Brown10 ; Roche13 ; Wyart14 ; BrownJaeger14 , discontinuous shear thickening (DST) Wyart14 , and impact-activated solidification (IAS), the focus of this study. Brown and Jaeger BrownJaeger14 provide a good snapshot of the field. Cornstarch suspensions are also remarkable for striking behavior such as the formation under strong vertical vibration of holes and fingers merkt04 ; vankann14 . Also, it is possible to run but not walk across a pool of suspension without sinking. During IAS, the suspension responds to a rapid impact with large normal stresses. DST and IAS occur for packing fractions, , that are close to the jamming transition, i.e. where suspensions, granular materials, etc. become solid-like and support finite stresses Ohern03 ; Bi11 ; Seto13 ; Wyart14 ; Peters16 The details of the dynamics of impacts into suspensions is crucial to understanding the nature of IAS, and its connection to a much broader range of static and dynamic phenomena in suspensions and other particulate systems. Frictional granular materials jam under shear strain Bi11 for , and frictional effects may play an important role in suspensions Seto13 ; Wyart14 ; Peters16 . Impact experiments on dry frictional granular systems Wildenberg13 ; Clark15 ; Clark_pre16 show shock-like response, where again friction/no-friction matters Clark15 . Experiments Liu10 ; Jaeger12 ; Jaeger14 ; Brown14 ; Kann11 suggest that during IAS, a dynamic jamming and unjamming process occurs: the suspension temporarily solidifies above a critical impact velocity Brown14 , and the force on the impactor depends on interactions with the suspension boundary Brown14 ; Jaeger14 . There may also be a connection between force propagation in impact experiments and non-locality/cooperativity reported recently Katgert10 ; Goyon08 ; Kamrin12 .
However, quantitative experiments on the forces experienced by the boundaries of the suspension have not been reported, to our knowledge. An important finding of this work is a fast pressure signal that reaches the boundary before a mass shock, and carries the majority of the momentum. This signal may provide insight into non-local response in other particulate systems.
Here, we measure the strain response within the suspension, and the force response from the boundaries of the suspension, due to impact of an intruder into a vertical channel of a water-cornstarch suspension. We observe a transient solid within the suspension, with dynamics that are strongly correlated with those of the impactor, and a second impactor driven front, with different dynamics from the solid front.
We correlate the dynamics of the fronts formed inside the suspension and the forces on the suspension boundaries with the impactor dynamics using two separate sets of experiments. In both, we dropped a metal disc from varying heights into a cornstarch suspension with packing fractions . In most experiments, the suspension was enclosed in a rectangular acrylic channel ( mm), with % occupied by the gelatin boundary, whose shape is shown in Fig. 2A. The disk was guided by a chute located above the container. The disk had a diameter of 63.5mm, width 11mm, mass 291g, and had a 10mm hole in the center for tracking. We recorded impacts with a Photron FASTCAM SA5. We tracked the impactor using a circular Hough transform at each video frame, then numerically computed the velocity and acceleration of the impactor, filtering out noise with a low-pass filter (cut-off Hz). We tracked the intruder position in both the polarized and unpolarized experiments, described below.
To gain access to the boundary stresses, (first experiments) we lined one side of the container with gelatin, a good photoelastic material kilcast84 that has a low friction coefficient with acrylic (). The container plus suspension was placed between crossed circular polarizers, yielding the photoelastic boundary response. The apparatus was lit from behind using a halogen lamp with diffuser hood. To capture the photoelastic response, we recorded video at a frame rate of 42,000 frames per second.
The second experiments visualized the suspension flow field. The suspension was mixed with tracer particles (black glitter, diameter mm). We recorded the tracer particle motion with front lighting, and without crossed polarizers at 10,000 frames per second. We used particle image velocimetry (PIV) to extract the velocity field inside the suspension and to deduce the position of the wavefront. We also characterized the flow of the material by finding the difference between successive frames from direct high speed video, producing a space-time plot of the movement of tracer particles in the suspension.
In order to test whether there was significant coupling between the Plexiglas faces and the cornstarch, we carried out a third and limited study in which additional mm thick layers of gel were placed between the Plexiglas and the cornstarch. As discussed in supplementary information, the propagation speeds were not affected by replacing the Plexiglas faces with soft faces.
We are therefore able to combine data for the timings of (i) impactor dynamics events, (ii) photoelastic boundary events, and (iii) events in the body of the suspension, providing insight into the physical basis of the impact-activated solidification of the cornstarch suspension.
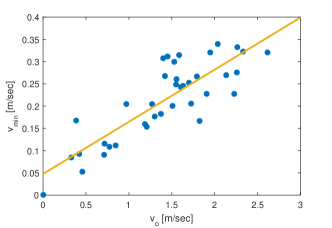
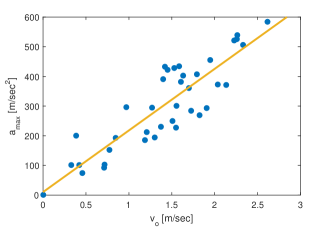
We begin with the dynamics of the impactor. These events and their timing are shown in Fig. 1. After striking the surface of the suspension, the impactor settles into the suspension for a short period of time. It then experiences a significant upward normal force from the suspension, stopping the impactor motion at a maximum depth, . This normal force lasts for an extremely brief period of time, as seen in the rapid increase in the intruder acceleration to . This causes the impactor to rebound with a peak velocity , before settling into the suspension at a much lower speed.
Beneath the impactor, the local suspension velocity just after impact rises well above the background fluctuations, as in Fig. 1 inset. The lower boundary of this region moves downward with speed that is strongly correlated with the impactor acceleration, producing a sharp peak in the cross-correlation signal between the two (not shown), as well as a small delay between the time of maximum impactor acceleration, , and , the time of maximum . This suggests the formation of a solid mass beneath the impactor, which might transmit internal stresses quickly, and moves at a uniform velocity.
We estimate the total momentum transferred to the suspension over the course of an impact by integrating over the velocity field shown in Fig. 1 inset, multiplying each velocity element by its associated volume and density, and assuming that the observed motion at the surface is typical of the motion inside the sample. The total momentum transferred to the suspension as a function of time, along with the momentum of the impactor over the course of the same impact, are shown in the bottom panel of Fig. 1. Strikingly, the momentum transferred to the suspension never approaches the initial intruder momentum, suggesting that the majority of the impactor momentum must be absorbed by the apparatus, without appearing in the mass flow of the suspension.
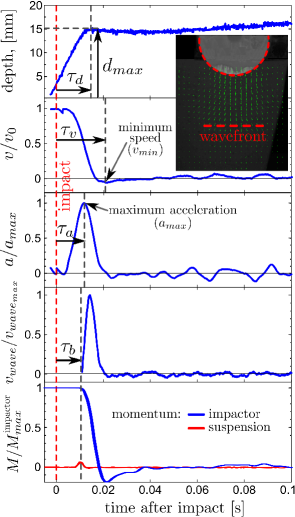


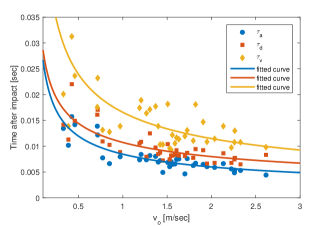
These results indicate several key timings in the suspension and impactor dynamics for comparison to events at the boundaries. These timings characterize the motion of the impactor and mass shock in the suspension, and include , the time at which the impactor reaches its maximum depth in the suspension before sinking, and , the time at which the mass shock is formed. In addition, there is a pressure front, separate from the mass shock, that transmits the majority of the impactor momentum to the suspension boundary.
The propagation of stresses to the boundary provides key insight into the these events. Figure 2-A-inset shows a typical photoelastic image from the boundary of the suspension during an impact. In the main panel, we show the total intensity of the signal from the photoelastic boundary over the course of the impact. Two events are clearly visible, marked by red and yellow lines: the time at which the first signal from the impactor reaches the boundary, , and the time at which the intensity signal of the boundary is maximal, respectively. 120 Hz oscillations are present in the signal due to the flickering of the light source. These have been substantially reduced by a notch filter. In B, the times for the two events of part A are plotted vs. initial impactor speed , along with fitted curves. For a more complete picture of events in the suspension during impact, we also plot on the same axes. The timing of both and is inversely proportional to the impactor speed, and thus also inversely proportional to the deformation rate of the suspension, where is the impactor diameter, suggesting that the timescales in the suspension result from a wave speed in the suspension which scales approximately linearly with .
We gain further insight into the nature of these signals by correlating events in the boundary with the impactor dynamics and the bulk suspension motion. We show data in Fig. 3. Part A shows and on the same axes: the time at which the mass shock in the suspension begins moving and the time when the first signal reaches the suspension boundary are indistinguishable, despite the fact that the mass shock wavefront is millimeters below the impactor, while the boundary is centimeters from the impactor. This points to a fast timescale: information about the impactor reaches the boundaries faster than the formation of the solid mass beneath the impactor. We propose that this information is carried to the boundaries by a pressure wave in the suspension, which may also carry the bulk of the intruder momentum to the apparatus. Figure 3-B compares and : the time at which the stress on the boundary is maximal is indistinguishable from the time when the depth of the impactor is maximal. The very short time delay between and further supports our argument that there is a fast timescale for force/pressure propagation between the suspension boundary and the impactor.
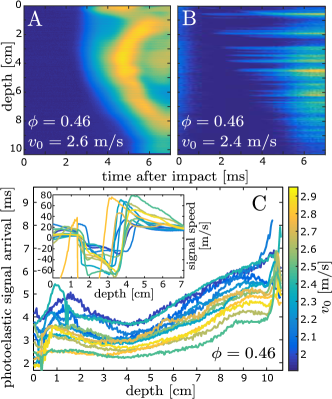
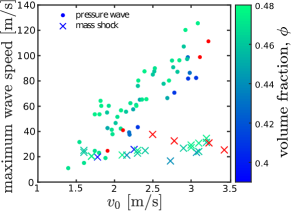
To better characterize the propagation of this pressure wave through the suspension, we find the first arrival time of signals from the suspension along the edge of the photoelastic boundary (see blue dashed line in the inset of Fig. 2A). Fig. 4A gives a typical space-time plot of the pressure signal moving along the boundary of the photoelastic material. This pressure wave arrives first at a depth of m, then propagates in both directions along the boundary away from the point where the signal first arrived, slowing as it progresses. Fig. 4C shows the first arrival times of the pressure wave along the photoelastic material as a function of depth, for various initial impactor speeds . As is increased, the overall nonlinearity in the propagation of the signal along the boundary remains consistent, in particular in the first arrival of the wave at a depth m. Fig. 4C inset shows the speed of the pressure wave plotted against its depth: the speed of the pressure wave depends strongly on its depth in the suspension along the gel boundary. A space-time plot of the mass shock, shown in Fig. 4B, does not show a similar nonlinearity in propagation along the boundary as the pressure wave, supporting our argument that the pressure wave and mass shock are two separate fronts propagating through the suspension.
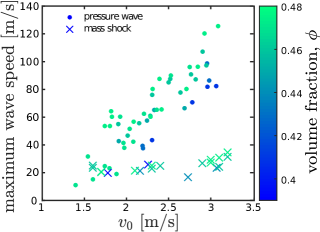
Figure 5 explicitly compares the maximum speed of the mass shock and the maximum speed of the pressure wave, for different . We also show data for different suspension packing fractions . While the speed of the mass shock does not show measurable dependence on for the ’s studied here, there is a systematic moderate increase in the speed of the pressure wave for increasing . In addition, the mass shock and pressure wave show different dependencies on , with the speed of the pressure wave being equal to or exceeding the speed of the mass shock. Again, this supports our argument that there exists a pressure front in the suspension, separate from the mass shock, which precedes it and which may propagate forces to the suspension boundary before the arrival of the mass shock. The pressure wave speeds observed here, which are for frequencies , differ substantially from ultrasound data Johnson13 ; han17 for the sound speed, e.g. sounds speeds of at frequencies in the range. Our imaging speed of frames per second should be able to detect waves at this speed, if they were present. That is, a wave of speed would cover the closest distance from intruder to side wall () in . This is only slightly different from our temporal resolution of .
As noted above, we carried out additional experiments in which the Plexiglas faces were isolated from the suspension by layers of soft gel. These data, presented in more detail in the supplementary materials, agree with the results of Figure 5.
It is also interesting to compare the present results to experiments involving impacts into dry granular materials Clark15 ; Clark_pre16 . In these studies, the mass flow tracked the intruder speed very closely. However, the stress signal propagated faster than the intruder speed, and depended nonlinearly on that speed. In the granular case, the force propagation was known experimentally at the particle scale, which is not the case here. Hence, comparisons between the present experiments and granular impacts can only be qualitative.
To conclude, we observe that two separate fronts reach the boundary of the suspension. The first is a mass shock, consistent with the front observed in Jaeger12 ; Jaeger14 ; Waitukaitis14 . However, the total momentum of the suspension during impact does not approach the initial impactor momentum, suggesting that the majority of the impactor momentum is propagated to the suspension boundary by a different process. At the same time, information concerning the impactor dynamics reaches the boundary of the suspension before it is carried outward via the mass shock. That is, we observe a second front, by visualizing the arrival of a pressure wave along our photoelastic boundary material. The dynamics of this front are not strongly correlated with the motion of cornstarch particles in the suspension, but rather with the impactor dynamics. The pressure front speed, which grows strongly with , and exhibits nonlinear dynamics along the boundary of the suspension, is generally faster than the mass shock speed, which grows only moderately with . The pressure wave speeds observed here for timescales , hence frequencies , are an order of magnitude or more lower than ultrasound speeds obtained at frequencies Johnson13 ; han17 . In addition to being at lower frequencies than the ultrasound measurements, the present experiments are in a manifestly nonlinear regime. These differences point to intriguing and little investigated phenomena in the response of cornstarch suspensions to compressive strain as a function of frequency and amplitude. Given the complex response of these suspensions to shear strain, it is not surprising that they also have a complex frequency and amplitude response to compressive strains. We close by noting a possible heuristic connection to the fact that one can run but not walk across a large container of cornstarch without sinking. Although it may be circumstantial, it is interesting that the pressure wave speeds observed here rise above the mass shock speeds for ’s that separate walking and running speeds.
Acknowledgements: This work is supported by NSF grant DMR1206351 and NASA grants NNX10AU01G and NNX15AD38G.
References
- [1] J. F. Brady and G. Bossis. Journal of Fluid Mechanics, 155:105–129, 1985.
- [2] N. Wagner and J. Brady. Phys. Today, Oct. 2009, 2009.
- [3] E. Brown, N. A. Forman, C. S. Orellana, H. Zhang, B. W. Maynor, D. E. Betts, J. M. DeSimone, and H. M. Jaeger. Nature materials, 9(3):220–224, 2010.
- [4] M. Roché, E. Myftiu, M. C. Johnston, P. Kim, and H. A. Stone. Phys. Rev. Lett., 110:148304, 2013.
- [5] M. Wyart and M. E. Cates. Phys. Rev. Lett., 2014.
- [6] E. Brown and H. M. Jaeger. Rep. Prog. Phys. 77, 2014.
- [7] Florian S. Merkt, Robert D. Deegan, Daniel I. Goldman, Erin C. Rericha, and Harry L. Swinney. Phys. Rev. Lett, 92:184501, 2004.
- [8] Stefan von Kann, Jacco H. Snoeijer, and Deveraj van der Meer. Phys. Fluids, 26:113302, 2014.
- [9] C. S. O’Hern, L. E. Silbert, A. J. Liu, and S. R. Nagel. Phys. Rev. E, 68:011306, 2003.
- [10] D. Bi, J. Zhang, B. Chakraborty, and R. P. Behringer. Nature, 480:355–358, 2011.
- [11] R. Seto, R. Mari, J. F. Morris, and M. M. Denn. Phys. Rev. Lett., 111:218301, 2013.
- [12] I. R. Peters, S. Majumdar, and H. M. Jaeger. Nature, in Press, 2016.
- [13] S.van den Wildenberg, R. van Loo, and M. van Hecke. Phys. Rev. Lett., 111:218003, 2013.
- [14] A. H. Clark, A. J. Petersen, L. Kondic, and R. P. Behringer. Phys. Rev. Lett., 114:144502, 2015.
- [15] L. Kondic A. H. Clark and R. P. Behringer. 2016.
- [16] M. Shelley B. Liu and J. Zhang. Phys. Rev. Lett. 105, 2010.
- [17] S. R. Waitukaitis and H. M. Jaeger. Nature, 487:205–209.
- [18] I. R. Peters and H. M. Jaeger. Submitted to ArXiv, 2014.
- [19] B. Allen S. Mukhopadhyay and E. Brown. Submitted to ArXiv, 2014.
- [20] J. H Snoeijer S. von Kann and D. van der Meer. Phys. Rev. E, 84.
- [21] G. Katgert, B. P. Tighe, M. E. Mobius, and M. van Hecke. Europhysics Letters, 90:54002, 2010.
- [22] J. Goyon, A. Colin, G. Ovarlez, A. Ajdari, and L. Bocquet. Nature, 454(7200):84–87, 2008.
- [23] K. Kamrin and G. Koval. Phys. Rev. Lett., 108:178301, 2012.
- [24] D. Kilcast, M. M. Boyar, and J. B. Hudson. Journal of Food Science, 49:654–655, 1984.
- [25] B. L. Johnson, M. R. Holland, J. G. Miller, and J. I. Katz. The Journal of the Acoustical Society of America, 2013.
- [26] Endao Han, Nigel Van Ha, and Heinrich M. Jaeger. Soft Matter, 13:3506–3513, 2017.
- [27] S. R. Waitukaitis. PhD thesis, U. of Chicago, 2014.
Description of supplementary material
PhotoelasticImpact.mpeg
An impact on a suspension with , and m/s, filmed at 10,000 frames per second. The movie is played at 7 frames per second. In this experiment, the suspension was placed between crossed circular polarizers, and lit from behind, providing visual access to the strain in the photoelastic boundary.
TracerImpact.mpeg
An impact on a suspension with and m/s, filmed at 10,000 frames per second. The movie is played at 30 frames per second. In this experiment, the suspension was mixed with black tracer particles, and filmed with front lighting without crossed polarizers. The resulting movie reveals the motion of the suspension during the impact.
PivImpact.mpeg
The same impact as in TracerImpact.mpeg, overlaid with the local velocity field at each point in the suspension (represented by green arrows). The local velocity field was extracted using particle image velocimetry.
Coupling between Plexiglas faces and cornstarch suspension
In order to test whether there was significant coupling between the Plexiglas faces of the experimental setup and the cornstarch suspension, we carried out a limited study in which additional layers of gelatin were placed between the Plexiglas and the cornstarch suspension. A schematic is shown in Fig. 6.
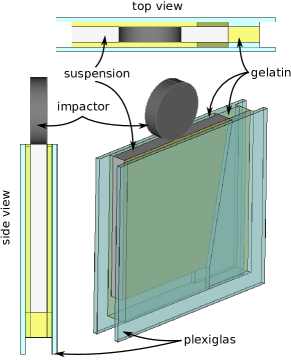
Figure 7 shows the propagation of the pressure wave (A) and mass shock (B) in the altered experimental setup. The space time plots do not show significant qualitative differences to those shown in Fig. 4 of the main text, despite the addition of the gelatin walls.
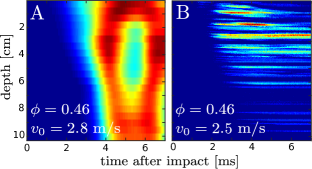
Figure 8 quantitatively compares the experiments with direct contact between the Plexiglas and suspension, and the experiments with a gel layer between the Plexiglas and suspension. We overlay data for the mass shock speed with gelatin walls (red) with the original data in the main text (see Fig. 5). Within the scatter in the data, the new experiments do not produce obviously different results to the experiments without the gel layer in either the speed of the mass shock or the speed of the pressure wave, implying that the original data are not affected by the presence of the Plexiglas walls.
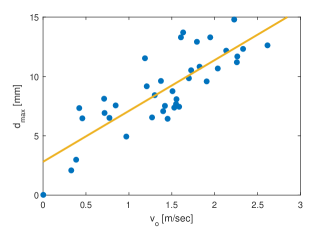
Dependencies of impactor kinematics on
Figure 1 in the main text shows that there are several key events in the motion of the impactor during impact on a suspension: , the maximal impactor depth, , the maximum velocity at which the impactor rebounds from the suspension, and , the maximum impactor acceleration. We find that the magnitude of each of these events scales linearly with , the initial impactor velocity. Data is shown in Figs. 9-11. We show also a time-series of these events, again as a function of , in Fig. 12.