The modeling of the Vela pulsar pulses - from optical to hard gamma-ray energy
Abstract:
The pulsed radiation from PSR B0833-45 (Vela) has a phased-averaged spectral energy distribution (SED) of an apparently simple structure across a wide energy range, from optical light to hard gamma-rays. However, the Vela pulses in narrow energy bands reveal astonishing complexity of the directional pattern of the radiation. These pulses are, therefore, a unique clue to the underlying radiative processes. We present the results of a 3D modeling of the Vela radiation properties within an outer-gap scenario. We show how the inverse Compton scattering of photons by primary and secondary particles in its magnetic and non-magnetic regimes reproduces qualitatively, and in some cases quantitatively, the observed energy-dependent pulses of Vela.
1 Introduction
The Vela pulsar (PSR B0833-45) is one of best studied rotation-powered pulsars in the high-energy radiation domain due to its proximity. No wonder, there have been many theoretical efforts to explain the mechanisms of its activity, applying various models. This paper presents an attempt to model inverse Compton scatterings expected between various sets of relativistic electro-positron pairs operating in the pulsar magnetosphere and two different radiation fields: 1) non-thermal near-IR to optical emission interpreted as due to synchrotron emission originating near the accelerating gaps; 2) thermal X-rays from the neutron star surface. The consequences of those interactions are shown to be present at the optical domain as well as the very-high energy domain (VHE).
2 The Outer Gap model
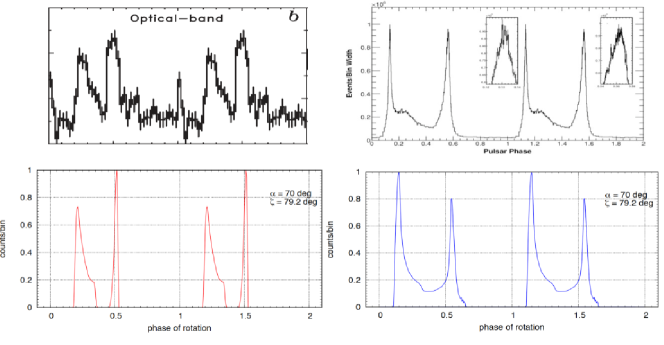
The physical model of OG used in this work is unavoidably simplified due to the fact that some aspects of physical conditions in OG pose still open questions. We use a standard corotating magnetosphere in the low charge density approximation. The magnetic field is taken as a vacuum retarded dipolar solution. The numerical 3D code calculates curvature radiation (CR) from primary charges in the inertial observer frame (IOF) as described in [8] and [4]. The charges (primary pairs) are subject to an accelerating electric field which is assumed to be constant in the gaps (i.e. no azimutal or radial dependence is considered). The assumed accelerating field allowed the primaries to reach Lorentz factors of a few . The model doesn’t follow the pair creation due to interaction of CR photons with a soft-photon field. Instead, we assume that secondary pairs are formed in a layer which is attached to (placed on top of) the outer gap layers. These pairs are the source of the soft photon field - synchrotron radiation (SR) which extends across the wide energy range, from hard X-rays to UV and optical up to midIR, and likely to far IR ( eV). To determine the directional characteristic of the SR radiation which would agree with the observed pulses from the Vela pulsar, with used the geometrical version of OG ([8]). The geometrical model assumes a uniform distribution of emissivity in the energy range of interest, with photons emitted tangentially to local magnetic filed lines. Therefore, for a given location of the layer in terms of the magnetic-line footprints on the polar cap, the pulses of radiation (CR in the case of the gap, or SR in the case of the secondary-pairs layer) will be a function of two angles: the inclination angle of the magnetic axis with respect to the spin axis, and the viewing angle between the line-of-sight and the spin axis. Taking the thickness of both layers to be the same and equal 0.1 (ie. 10% of the polar-cap radius) the best set of and was determined as 70 deg and 79 deg, respectively. The resulting ’geometrical’ lightcurves of CR (gamma-rays) and SR (optical) along with the data are presented in Fig.1. The optical lightcurve in the geometrical model consists of two peaks located at phases 0.25 and 0.5, similarly as two major peaks (called P1 and P2, respectively) observed in the lightcurve of Vela ([9]). Also, the shape and thickness of the model peaks are roughly similar to the observed peaks. The similar situation is for the geometrical and observed lightcurves in the gamma-rays, where two peaks are located at phases 0.13 and 0.56 ([1]).
Two important ingredients of the physical model are:
1) The electron-positron pairs of present in the inner part of open magnetic field-lines,
ie. concentrated around the magnetic axis (hereafter ’the inner PC pairs’). The justification for this component it twofold:
a) the outer gap and its adjacent SR layer occupy about 20% (in terms of the
polar cap radius) of the magnetic-field lines at the outer rim of the polar cap; there is no reason to prevent the inner part of polar cap to develope a potential drop across it,
high enough to lead eventually to the creation of electron-positron pairs; b) a narrow radio pulse (”a core” emission) is present in Vela.
2) The field of thermal soft X-ray emission from the Vela surface ([15]).
Three different ICS processes were considered in an attempt to either predict or to explain the existence of specific features in the Vela’s non-thermal radiation:
-
1.
primary electrons in the gap interacting with optical-infrared photons originating from the SR layer,
-
2.
inner PC pairs interacting with optical-infrared photons originating from the SR layer,
-
3.
inner PC pairs interacting with thermal X-ray photons from the neutron star surface.
These processes are expected to lead to the formation of, respectively,:
-
1.
spectral component in the VHE range,
- 2.
- 3.
3 Results
3.1 A component in the VHE range
An important role in shaping the resulting directionality of the ICS emission in this case plays the bending of trajectories of the SR photons in the corotating frame (CF) with respect to the primary electrons moving along magnetic field lines in the gaps. For high inclination angles this leads to lower rates of photon-electron collisions at at the leading side than at the trailing side (see fig.6 in [7]).
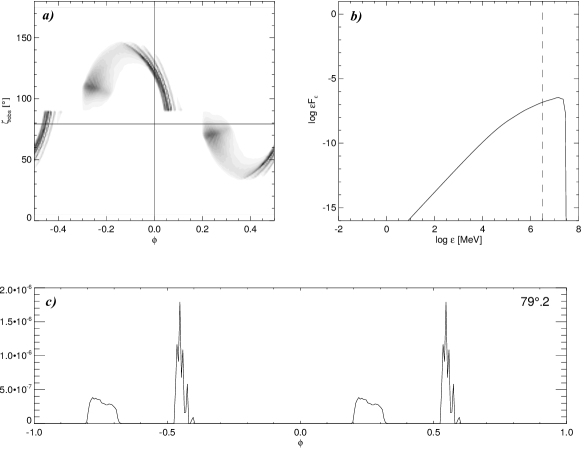
Fig.2 presents the photon map of ICS in the VHE range, as well as the phase averaged spectrum and the lightcurve for the viewing angle
chosen in the previous section and Fig.3 shows the phase averaged spectra of ICS and CR, with the normalization to match the maximum energy flux of CR
with the value derived from observations. Note, that an overall shape of the modelled CR component has too little power
at the low-energy part ( MeV) as well as above GeV. This is a well known fact, and there have been attempts to cure it
by introducing a set of gaps with different external currents and with the time variability at least of the crossing time-scale of
the light cylinder ([13], [20]). The observed gamma-ray spectrum would then be a superposition of CR components from these gaps.
Other ways out have also been proposed recently (e.g. [10]).
For the purpose of this work, the precise shape of the CR component is not essential, however; the key element are ultrarelativistic electrons
in the gap due to an assumed electric field there (see Section 1).
Two cases of the input SR spectrum were considered to interact with primary pairs from the gaps via the ICS, both with identical power-law
model , with , and the same upper limit of 4 eV,
but with two different low-energy limits: 1) eV in the near-IR ([19]; see also [5]); 2) eV in the far-IR
(in principle, one cannot exclude that the
SR spectrum extends that far, although no observations exist supporting such a statement) .
In the first case, the scatterings proceeds
in the Klein-Nishina regime, and the result is marked with dashed line in Fig.3.
In the second case, the scattering proceeds in both, the K-N and Thomson, regimes, and the result is marked in Fig.3 with continuous line.
3.2 A core-like pulse formed in the optical and UV
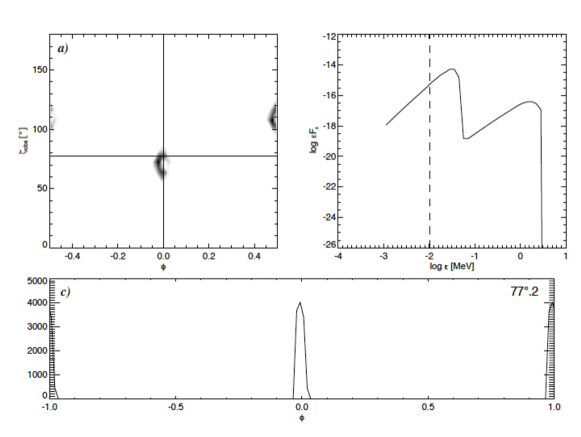
With justification given in Section 1 we assume the presence of inner PC pairs with moderate Lorentz factors () outflowing along the open magnetic-field lines concentrated uniformly around the magnetic axis within a fractional radius on the polar cap. The pairs are followed up to the distance of (the light cylinder radius) as they interact via the ICS with photons from the SR layer. The first case of the SR spectrum mentioned in the previous subsection is used (i.e. with the lower limit at eV in the near-IR) in the computations. Fig.4 presents the photon map of ICS in the optical range. Whether the origin of the so-called P4 peak visible at the phase is due to the ICS as suggested by the vertical dashed line, remains to be verified by more detailed numerical calculations. The second peak in the model, at the phase slightly below 0.5 is not expected to be detectable as it is overlaid by the peak P2 (of the SR). A similar peak is also formed in the UV range (the spectrum in Fig.4 extends to the UV and even the Xrays), and it may correspond to P4 visible at the phase 0 in the UV ([18].
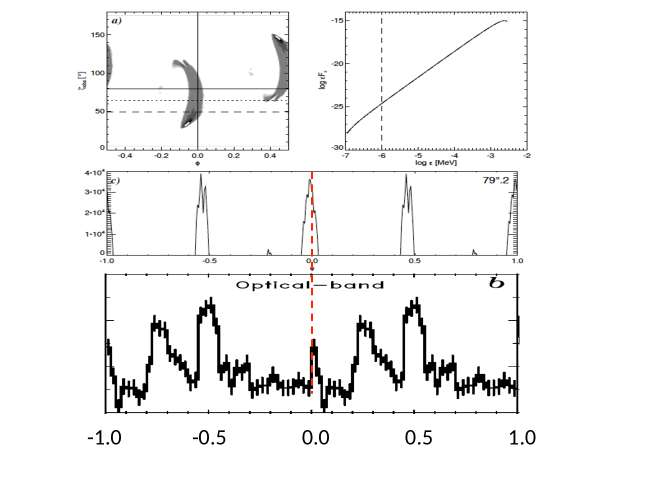
3.3 A core-like pulse formed in the hard X-rays
The inner PC electron-positron pairs are also capable of scattering thermal photons from the neutron star surface. After [15] we took a blackbody spectrum with K and total luminosity erg/s. The pairs we followed up to in the altitude. In the range of interest, between keV and keV, the scatterings proceed in the magnetic resonance regime ([6]), forming thus a strong flux of X-ray photons at phase 0.0 (Fig.5). This may explain the presence of the narrow peak at phase in the X-ray lightcurves between 0.8 keV and 50 keV (see the compilation of lightcurves in fig.4 of [12]).
3.4 Summary
The simplified OG model used in this work is the first attempt to account for the presence of specific features in the lightcurves of Vela in optical, UV and hard-Xrays at the phase where the radio core peak is located. If the origin of the optical and hard-Xray ”core” peaks presented above is correct, it will be an addidtional argument (besides the radio core peak) for an inner gap operating in the central part above the polar cap. The coexistence of inner and outer gaps which occupy different magnetic-field lines would have to be taken into account by new models of dissipative magnetospheres.
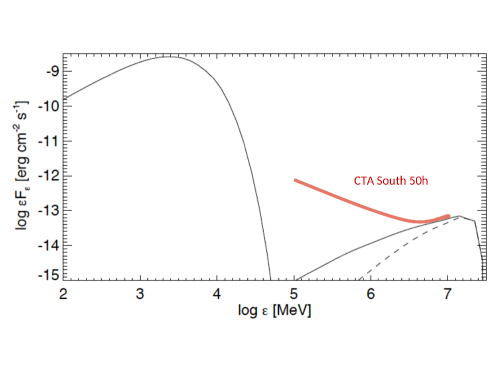
Moreover, a spectral component
in the VHE gamma-ray domain is found of potential interest to the Cherenkov Telescope Array (CTA), provided
a rather long integrated time of observations (a least 50 hours) is granted (see [14] for the expected CTA-South sensitivity of point-like sources).
The energy flux of the VHE component is much smaller than derived in the past with ’one-dimensional’ models of the OG ([17],
[3]), which also are inconsistent with the HESS upper limits ([2]). It is, however, much bigger than the flux expected in other models of Vela (e.g. [10], [16]).
A detailed account of the method and the results presented in this contribution will be given elsewhere (Rudak & Dyks 2017, in prep.).
Acknowledgments
BR acknowledges discussions with Iwona Mochol and Arache Djannati-Ataï. The authors acknowledge financial support by the National Science Centre grant DEC- 2011/02/A/ST9/00256.
References
- [1] A.A. Abdo et al. The Vela Pulsar: Results from the First Year of Fermi LAT Observations, ApJ 2010 (713) 154.
- [2] F.A. Aharonian et al. Search for pulsed VHE gamma-ray emission from young pulsars with HESS, A&A 2007 (466) 543.
- [3] F.A. Aharonian and S.V. Bogovalov Exploring physics of rotation powered pulsars with sub-10 GeV imaging atmospheric Cherenkov telescopes, New Astronomy 2003 (8) 85.
- [4] Bai, A. Spitkovsky, Modeling of Gamma-ray Pulsar Light Curves Using the Force-free Magnetic Field, ApJ 2010 (715) 1282.
- [5] A.A. Danilenko, D.A. Zyuzin, Yu.A. Shibanov, S.V. Zharikov, The Vela and Geminga pulsars in the mid-infrared, MNRAS 2011 (415) 867.
- [6] C.D. Dermer, Compton scattering in strong magnetic fields and the continuum spectra of gamma-ray bursts - Basic theory, ApJ 1990 (360) 197.
- [7] J. Dyks and B. Rudak, Shaping the gamma-ray pulsar profiles: caustic effects versus intrinsic emissivity, 33rd ICRC 2013
- [8] J. Dyks, A.K. Harding, B. Rudak, Relativistic Effects and Polarization in Three High-Energy Pulsar Models ApJ 2004 (606) 1125.
- [9] C. Gouiffes, Optical Observation of the VELA Pulsar, Neutron Stars and Pulsars : Thirty Years after the Discovery : Proceedings of the International Conference on Neutron Stars and Pulsars held on November 17-20, 1997, at Tachikawa Hall, Rikkyo University, Tokyo, Japan. Edited by N. Shibazaki [et al.]. Tokyo, Japan : Universal Academy Press, c1998. (Frontiers science series) 1998 (24) 363.
- [10] A.K. Harding and C. Kalapotharakos, Synchrotron Self-Compton Emission from the Crab and Other Pulsars, ApJ 2015 (811) 63.
- [11] A.K. Harding et al. 2002, The Multicomponent Nature of the Vela Pulsar Nonthermal X-Ray Spectrum ApJ 2002 (576) 376.
- [12] L. Kuiper and W. Hermsen The soft -ray pulsar population: a high-energy overview, MNRAS 2015 (449) 3827.
- [13] G.C.K. Leung et al. Fermi-LAT Detection of Pulsed Gamma-Rays above 50 GeV from the Vela Pulsar, ApJ 2014 (797) 13.
- [14] S. Mangano, on behalf of the CTA Consortium, Cherenkov Telescope Array Status Report, Very High Energy Phenomena in the Universe, Rencontres de Moriond 2017 [astro-ph.HE 1705.07805].
- [15] A. Manzali, A. De Luca, and P. A. Caraveo, Phase-resolved Spectroscopy of the Vela Pulsar with XMM-Newton, ApJ 2007 (669) 578.
- [16] I. Mochol and J. P tri Very high energy emission as a probe of relativistic magnetic reconnection in pulsar winds, MNRAS 2015 (449) 51.
- [17] R.W. Romani Gamma-Ray Pulsars: Radiation Processes in the Outer Magnetosphere, ApJ 1996 (470) 469.
- [18] R.W. Romani, O. Kargaltsev and G.G. Pavlov, The Vela Pulsar in the Ultraviolet, ApJ 2005 (627) 383.
- [19] Yu.A. Shibanov,A.B. Koptsevich, J. Sollerman, P. Lundqvist, The Vela pulsar in the near-infrared, A&A 2003 (406) 645.
- [20] J. Takata, C. W. Ng, K.S. Cheng, Probing gamma-ray emissions of Fermi-LAT pulsars with a non-stationary outer gap model, MNRAS 2016 (455) 4249.