| Ergodicity breaking of iron displacement in heme proteins† | |
| Salman Seyedia and Dmitry V. Matyushov∗b | |
| We present a model of the dynamical transition of atomic displacements in proteins. Increased mean-square displacement at higher temperatures is caused by softening of the vibrational force constant by electrostatic and van der Waals forces from the protein-water thermal bath. Vibrational softening passes through a nonergodic dynamical transition when the relaxation time of the force-force correlation function enters, with increasing temperature, the instrumental observation window. Two crossover temperatures are identified. The lower crossover, presently connected to the glass transition, is related to the dynamical unfreezing of rotations of water molecules within nanodomains polarized by charged surface residues of the protein. The higher crossover temperature, usually assigned to the dynamical transition, marks the onset of water translations. All crossovers are ergodicity breaking transitions depending on the corresponding observation windows. Allowing stretched exponential relaxation of the protein-water thermal bath significantly improves the theory-experiment agreement when applied to solid protein samples studied by Mössbauer spectroscopy. |
1 Introduction
Atomic displacements in proteins are viewed as a gauge of the overall flexibility of macromolecules. Displacements of the hydrogen atoms are reported by neutron scattering,1 and mean-square displacements (B-factors) of all atoms are known from X-ray crystallography. Neutron scattering reports ensemble averages of scattering from many hydrogen atoms of a single protein.1, 2, 3 In contrast, Mössbauer spectroscopy often probes the displacements of a single atom in the protein,4, 5 which is the heme iron in this study focused on cytochrome c (Cyt-c) and myoglobin proteins.
The temperature dependence of atomic displacements from both neutron scattering and Mössbauer spectroscopy shows a number of crossovers. They are marked by changes in the slope of atomic mean-square displacement vs temperature,6, 7 deviating from expectations from the fluctuation-dissipation theorem.8, 9 This problem has attracted significant attention in the literature.2, 10, 5, 11, 12, 13 The accumulation of the data over several decades of studies, combined with their recent refinements through the comparison of the results obtained on spectrometers with different resolution,14, 15, 16, 17 have lead to a convergent phenomenological picture.
Two low-temperature crossovers are now identified (Fig. 1). The higher-temperature crossover , originally assigned to the protein dynamical transition,7, 11 depends on the observation window of the spectrometer10, 14, 15, 16 and shifts to lower temperatures when the resolution is increased (a longer observation time in Fig. 1). The lower crossover temperature, K, is independent of the observation window (in the range of resolution windows available to spectroscopy) and is assigned to the glass transition of the protein hydration shell.7, 16, 11, 15
All motions, rotations and translations, in the hydration shell (except for cage rattling) terminate at the lower temperature . While this interpretation is consistent with the basic phenomenology of glass science, it does not address the question of how the structure and dynamics of the hydration shell affect atoms inside the protein, the heme iron for Mössbauer spectroscopy. The basic question here is whether the observations can be fully related to stiffening of the hydration shell at lower temperatures, thus reducing elastic deformations of the protein,18 or there are some long-range forces acting on the heme, which are reduced in their fluctuations when the hydration shell dynamically freezes. It is possible that no simple answer to this question can be obtained in the case of neutron scattering since there are several classes of motions of protein hydrogens: cage rattling, methyl rotations, and jumps between cages.19 To avoid these complications, we focus here on a single heavy atom, heme iron, probed by Mössbauer spectroscopy on the resolution time ns.
The question addressed here is what are the physical mechanisms propagating fluctuations of the protein-water interface to an internal atom within the protein.20, 21 This question, also relevant to how enzymes work,22 was addressed by the electro-elastic model of the protein,23, 24 where both the effect of the viscoelastic deformation and the effect of the long-range forces acting on the heme iron were considered. The main conclusion of that theoretical work was the recognition of the two-step nature of the crossover in the mean-square fluctuation (MSF) of the heme iron. The low-temperature crossover, K, was assigned to an enhancement of viscoelastic deformations above the glass transition of the protein-water interface.23 The increment in the MSF at was, however, insignificant, as confirmed below based on new molecular dynamics (MD) simulations. It was, therefore, concluded that altering elastic stiffening is not sufficient to describe the rise of the MSF above and long-range forces need to be involved.
The iron MSF significantly increases when electrostatic forces acting on the iron are included.23 The dynamical transition and the corresponding enhancement of the MSF are promoted by ergodicity breaking when the longest relaxation time crosses the instrumental time. The equation for the MSF resulting from this perspective involves the MSF from local vibrations of the heme and the global softening of the heme motions through the long-ranged forces acting on it. This second component enters the denominator of Eq. (1) through the variance of the force acting on heme’s iron
| (1) |
The subscript “r” in the angular brackets, , indicates that the average is constrained by the observation window . Correspondingly, the fluctuations of the long-range forces are mostly frozen at low temperatures when is low, yielding . Since the relaxation time of the long-range forces depends on temperature according to the Arrhenius law, it shortens with increasing temperature, ultimately reaching the point23, 25, 26, 12 , at which the high-temperature crossover occurs. Fluctuations of the long-range forces become dynamically unfrozen at this temperature, leading to an increase of both and .
In the present paper, we present new extensive simulations of Cyt-c in solution at different temperatures. The goal is to assert the role of long-range forces in achieving the vibrational softening of atomic displacements at high temperatures (Eq. (1)). We consider the entire heme as a separate unit experiencing the force from the surrounding thermal bath. This coarse graining allows us to focus on the long-time relaxation of the force-force correlation function relevant for the long observation time, ns, of the Mössbauer experiment. We find that the longest relaxation time follows the Arrhenius law with the activation barrier characteristic of a secondary relaxation process (-relaxation of glass science27). We therefore support the proposal advanced by Frauenfelder and co-workers10, 28 that the higher-temperature crossover is caused by ergodicity breaking when the relaxation time of the secondary process characterizing the protein-water interface enters the experimental observation window. This relaxation process effects the heme iron through the combination of non-polar (van der Waals) and polar (electrostatic) forces.

Our focus on the protein in solution has a limited applicability to experiments done with solid samples. Nevertheless, computer simulations produce results close to observations for the reduced state of Cyt-c. The length of simulations is also insufficient to sample the dynamics on the time-scale of ns. In addition, the solution setup does not reproduce highly stretched dynamics observed in protein powders.19, 29, 12 We find that the agreement between theory and experiment30 is much improved when stretched exponential dynamics from dielectric spectroscopy31 are used in our model.
Despite limitations of our simulations in application to experimental data, there is one significant advantage of the solution setup. Experiments done with solid samples cannot claim that the observed phenomenology directly applies to solutions. The similarity between our simulations and such experiments gives credit to the idea that dynamical transition, caused by ergodicity breaking, is a general phenomenon relevant to physiological conditions. From a more fundamental perspective, ergodicity breaking is broadly applicable to enzymetic activity at physiological conditions and is described by a formalism carrying significant similarities with the problem of dynamical transition of atomic displacements.22
2 Formalism
The standard definition adopted for the fraction of recoiless absorption of the -photon in Mössbauer spectroscopy is through the average
| (2) |
The average is over the statistical configurations of the system accessible on a given time resolution of the experiment specified through the observation (resolution) time . Further, is the wavevector aligned with the -axis of the laboratory frame and is the displacement of the heme iron.
The average over the stochastic variable of iron displacement can be represented by an ensemble average with the free energy
| (3) |
where is the inverse temperature.
The free energy is distinct from the usual thermodynamic free energy in two regards. First, it is a partial free energy corresponding to the reversible work performed by all degrees freedom of the system at a fixed displacement . Therefore, is analogous to the Landau functional of the thermodynamic order parameter.32 There is another distinction of from the thermodynamic free energy specified by the subscript “r”. This free energy is defined by sampling the constrained part of the phase space which can be accessed on the resolution time . The definition of should thus include two constraints: (i) a fixed value and (ii) a restricted phase space available to the system. Both constraints are mathematically realized by the following equation33, 34, 22
| (4) |
Here, is the unit vector along the -axis and is the iron’s displacement vector. The restriction of the phase space is realized as a dynamical constraint on the frequencies over which the correlation functions appearing in the response functions are integrated.22 A simple cutoff, , is used in the statistical averages below.
We will next consider the displacement of the iron as composed of the displacement of the heme’s center of mass and the normal-mode vibrations relative to the center of mass. The Hamiltonian in Eq. (4) can therefore be separated into a linear term involving the external force acting on the heme from the protein-water thermal bath and the Hamiltonian of intra-heme vibrations
| (5) |
By expanding the iron’s displacement in the normal-mode vibrations , we can re-write the free energy in the form
| (6) |
where is the mass of the iron atom. Further, the average is over the fluctuations of the classical protein-water thermal bath which creates movements of the heme as a whole. It is reasonable to anticipate that these relatively large-scale fluctuations follow the Gaussian statistics with the force variance , . The average over such fluctuations in Eq. (6) then becomes
| (7) |
In addition, the integral over the normal modes in Eq. (6) is a Gaussian integral such that
| (8) |
where the variance due to intramolecular vibrations is
| (9) |
Here, is the average occupation number of the normal mode with the frequency . By substituting Eqs. (7) and (8) into Eq. (6), one obtains the harmonic free energy function23
| (10) |
with the variance
| (11) |
The basic result of this derivation is straightforward: adding Gaussian fluctuations of the heme’s center of mass to intramolecular vibrations of the heme leads to the softening of the force constant of the harmonic free energy .20 Combining this result with Eqs. (2) and (3), one obtains the Gaussian form for the recoiless fraction
| (12) |
with given by Eq. (1) in which .
The subscript “r” in specifies that the average over the stochastic fluctuations of the force acting on the heme from the thermal bath is understood in the spirit of the dynamically restricted average over a dynamically accessible subspace of the system , as specified in Eq. (4). In practical terms, this implies that only frequencies greater than can contribute to the observables. The effective variance can therefore be calculated as10, 22
| (13) |
Here, is the Fourier transform of the time auto-correlation function
| (14) |
where .
3 Results
The force acting on the entire heme, , was calculated from MD simulations. This procedure averages out the short-time fluctuation of the forces caused by internal vibrations and allows us to focus on the long-time dynamics, produced by the bath, and its potential effect on the observable displacement of the iron. We found that the force-force time correlation function calculated for the iron atom is dominated by intramolecular vibration and is oscillatory (see ESI†). The long-time dynamics is hard to extract from that correlation function, which is the reason for our focus on the overall force acting on the heme. However, this overall force needs rescaling when applied to the individual iron atom. Assuming that the heme moves as a rigid body, the re-scaling is given by the ratio of the iron mass g/mol and the mass of the heme g/mol
| (15) |
This re-scaling, assuming the heme moving as a rigid body, can obviously apply only to the slowest dynamical components of the force. In contrast, the correlation function calculated from simulations shows a number of time-scales, from sub-picoseconds, to long-time dynamics on the time-scale of 6–25 ns ( K). While the slowest relaxation process usually constitutes about half of the amplitude of the time correlation function, the scaling in Eq. (15) does not discriminate between the slow and fast dynamics. It is therefore clear that our estimate of the overall amplitude of the force acting on heme’s iron is good only up to some effective coefficient accounting for imperfect rigidity of the heme. Elastic deformations of the heme shifting its center of mass are effectively disregarded in the re-scaling assuming the rigid-body motions. Given these uncertainties, we estimate in Eq. (1) from the following equation
| (16) |
The nonergodicity parameter here comes from the dynamic restriction imposed on the integral over the frequencies in Eq. (13). Assuming that only the slowest component in the relaxation of the force can potentially enter the observation window, ns, we can write22 in the form corresponding to exponential relaxation of in Eq. (14) (see below the discussion of non-exponential, stretched dynamics)
| (17) |
In this equation, is the relaxation time of the slowest component of . A similar expression accounting for the finite resolution of the spectrometer was used in the past for the integrated elastic intensity.35
It is clear from Eq. (17) that the nonergodicity parameter is equal to unity when and the fluctuations of the force are ergodic. In the opposite limit of slow fluctuations, , the force fluctuations are dynamically frozen on the observation time and do not contribute to the softening of iron’s displacement, . This corresponds to low temperatures when intra-heme vibrations dominate. The crossover temperature is reached at .
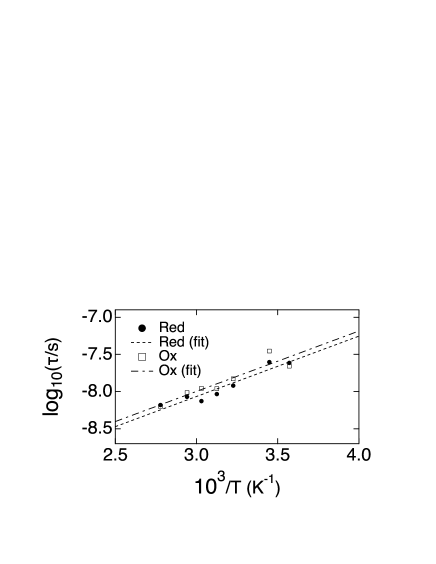
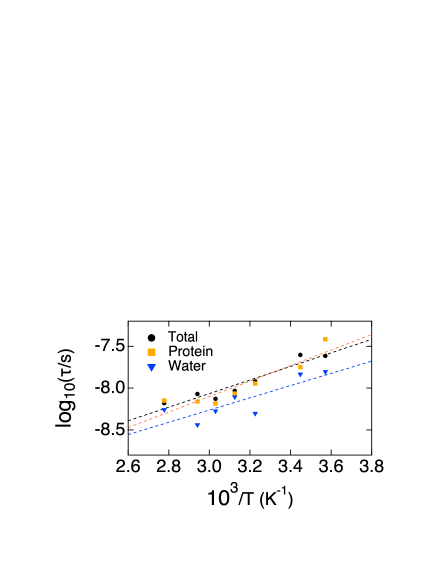
The long-time relaxation times are shown in Fig. 2. The activation barrier of this relaxation time, K, is below the typical values for the -relaxation of condensed materials, thus pointing to a localized (secondary) relaxation process of the protein-water interface.10, 29 This relaxation time is determined in the range of temperatures K, where our simulations demonstrate sufficient convergence. The Arrhenius fits of the simulation data (lines in Fig. 2) are then extrapolated to lower temperature where the experimental Mössbauer data are available. These extrapolated relaxation times are used in Eq. (17) to calculate the nonergodicity factor in Eq. (16).
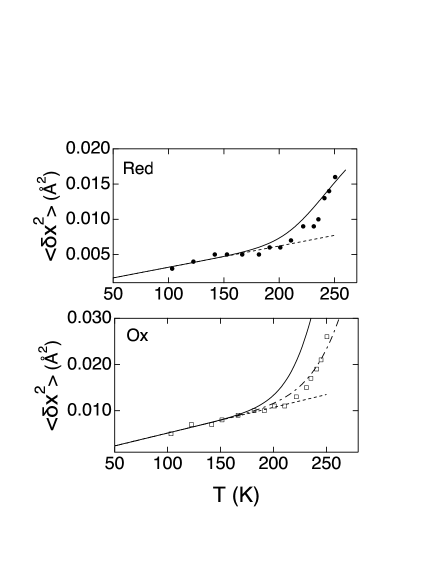
Calculations of displacements of the heme iron based on Eqs. (1), (16), and (17) are shown in two panels of Fig. 3. The experimental results36 are reasonably reproduced by our calculations in the Red state of the protein without any additional fitting. The shift of the crossover temperature to a higher value in the Ox state observed experimentally would imply, in our model, slower dynamics of the force or a larger value of . While a larger value of is indeed observed (Table 1), its overall result is insufficient to explain the shift of the experimental crossover temperature. The experimental results are recovered by multiplying from simulations by a factor of 2.65. While this factor is obviously arbitrary, the need for a correction might be related to our insufficient sampling of the long-time dynamics, extrapolation of the high-temperature relaxation times to lower temperatures, and the assumption of exponential dynamics not supported by measurements with protein powders19, 29, 12 (see below).
| Redox State | El. | vdW | Prot. | Water | Total |
|---|---|---|---|---|---|
| Red | 8.86 | 23.17 | 9.60 | 3.12 | 14.52 |
| Ox | 16.62 | 12.65 | 19.34 | 2.87 | 17.05 |
Despite some difficulties with the long-time dynamics in the cyt-Ox state, the short-time dynamics produced by simulations are consistent with experiment. This is confirmed by the calculation of the vibrational density of states
| (18) |
where are expansion coefficients for the linear transformation from the Cartesian displacement of the Fe atom to normal coordinates in Eq. (6). The normalization of the density of states adopted in producing the experimental data shown in Fig. 4 requires37
| (19) |
With this normalization, the density of states from simulations was computed from the velocity-velocity autocorrelation function (see ESI† for more detail) and displayed in Fig. 4. There is an excess of low-frequency modes relative to experiment,38, 39 which might be related to the expansion of the protein at K, at which simulations were performed, compared to the experimental temperature of K.
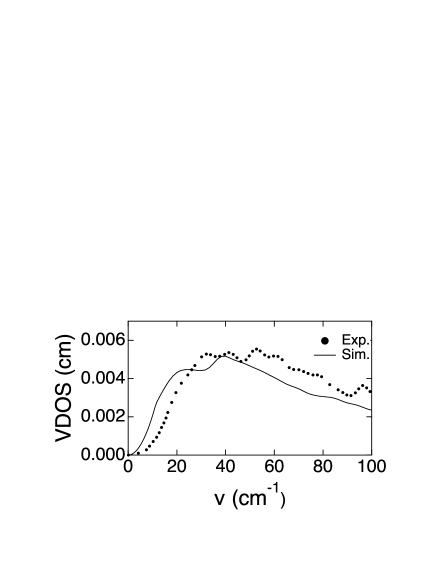
Table 1 shows the splitting of the variance of the force acting on the heme into electrostatic and van der Waals (vdW) components and, additionally, into the components from the water and protein parts of the thermal bath. Note that the components do not add to the total force variance because of cross-correlations. The splitting into components indicates that vdW interactions and electrostatics contribute comparable magnitudes to the force variance. The softening of iron vibrations cannot therefore be fully attributed to electrostatics (dielectric effect40, 10, 28). It cannot be attributed to the hydration shell28 either and is in fact a combined effect of protein and water, with the dominant contribution from the protein. The water contribution can be further diminished in solid samples used in neutron scattering or Mössbauer spectroscopy.
The separation of the force variance between protein and water allows us to comment on the idea of “slaving” of the protein dynamics by water suggested by Frauenfelder and co-workers.40, 41, 10 The “slaving” phenomenology implies the equality of the enthalpy of activation for a relaxation process in the protein with the enthalpy of activation for the structural relaxation of bulk water (-relaxation). When plotted in the Arrhenius coordinates ( vs ) the two plots are then parallel.
The origin of this phenomenology is easy to appreciate within the framework of Kramers’ activated kinetics dominated by friction with the thermal bath (Fig. 5). The rate constant of an activated process is the product of an effective frequency in the reactant well with the Boltzmann factor involving the free energy of activation . If the motions along the reaction coordinate are represented by an overdamped harmonic oscillator with the frequency and the friction coefficient , the direct solution of the Langevin equation leads to the relaxation frequency . Therefore, “slaving” appears when most of energy dissipation occurs to the water part of the thermal bath (which has a higher heat capacity than the protein42). In that case, the temperature dependence of , and of the corresponding relaxation process in water, would determine the temperature dependence of the relaxation rate in the protein, which is only shifted to lower rates due to an additional activation barrier (assuming is temperature-independent). This is the “slaving” scenario.

While there are reported instances when this picture is correct,29, 43 one can argue that energy dissipation for localized processes occurs to the protein hydration shell, which possesses its own relaxation spectrum. Indeed, Frauenfelder and co-workers10 argued that localized processes in the protein have to be “slaved” to the relaxation of the hydration layer. Consistently with that notion, relaxation processes related to protein function are often characterized by the activation barrier much lower than those for -relaxation of bulk water (Fig. 2). For instance, the Stokes shift dynamics directly related to the redox activity of Cyt-c show the activation barrier of its relaxation time K.44 This is much lower than K (increasing to K upon cooling) from diffusivity and viscosity of water (-relaxation).45 The idea of “slaving” to -relaxation of the hydration shell is less useful, and is harder to prove, since relaxation of the shell is mostly inaccessible experimentally. Our simulation results allow us such a test since the dynamics of both the hydration layer and of the heme’s iron are available.
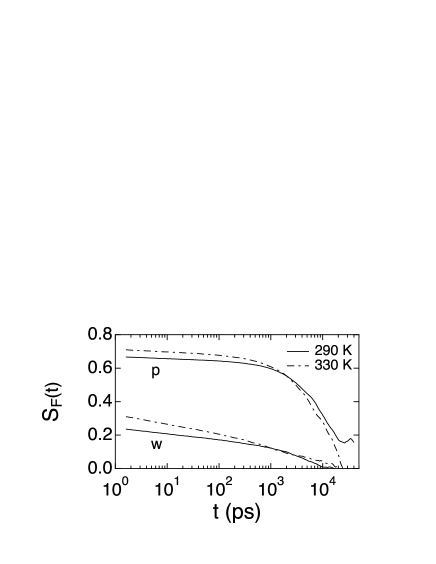
In application to Mössbauer experiment, our data do not support “slaving”. Only % of the force variance acting on heme’s iron comes from from hydration water (Table 1). This also implies that the dynamics should be biomolecule-specific.46 In this scenario, “slaving” would be only possible if the protein dynamics followed the dynamics of water. The results of simulations do not support this conjecture: the dynamics of are distinctly different for the protein and its hydration water (Fig. 6). The dynamics of water is on average significantly faster (a larger drop from the initial value , not resolved in Fig. 6), and the slow dynamics of the protein and water are not consistent either. Nevertheless, the temperature dependence of the relaxation time of the force-force correlation function is consistent between the protein and water components (Fig. 7). The enthalpies of activation for the protein and water relaxation are, therefore, close in magnitude, in a general accord with the “slaving” phenomenology. The origin of this effect can be traced to coupled fluctuations of the protein and hydration water,47, 48, 49, 50, 51 without invoking a dominant role of water in the dynamics.
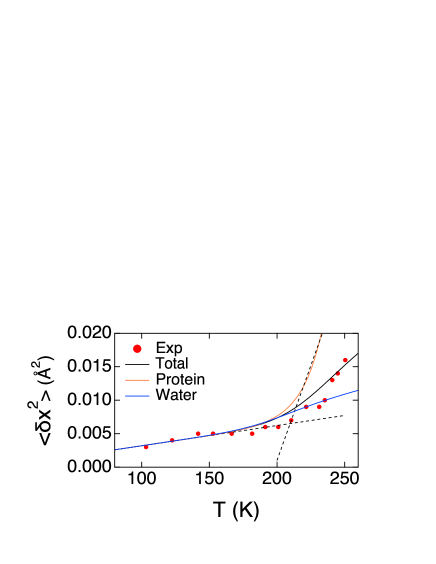
Water is a faster subsystem producing a shorter relaxation time of . One therefore anticipates that the temperatures of ergodicity breaking should separate for the water and protein components of the thermal bath.52 This indeed happens, as is illustrated in Fig. 8 for the reduced state of Cyt-c. The rise of due to water occurs at K, while the transition temperature for the protein is K. The water’s onset is hard to disentangle because the force produced by water on the heme is relatively low. One might expect that the water transition is better resolved in neutron scattering experiments52 since a large number of protons located close to the interface potentially contribute to the signal. Overall, this calculation clearly points to a nonergodic origin of the dynamical transition, as we stress again below when considering the separation of rotational and translational motions of water in the hydration shell.
4 Stretched relaxation
Difficulties with reproducing ergodicity breaking of Cyt-Ox (Fig. 3 lower panel) might be related to a limited applicability of the results obtained for solutions to dynamics in protein powders and crystals studied experimentally. In addition to the obvious uncertainty of extrapolating the high-temperature simulation results to lower temperatures, the dynamics of hydration water can be qualitatively different in those environments compared to solutions. The relaxation of hydration water in powders was associated by Ngai and co-workers16, 12 with the general phenomenology of confined water in water-containing glass-formers. The -process characterizing such dynamics is highly stretched, with a very slow decay of the high frequency tail of the loss function: for the dielectric loss53, 31 and for the neutron scattering loss.19 A low value of stretching exponent, , is observed in both cases.
The -process observed in lysozyme and myoglobin powders by dielectric spectroscopy was identified to cause the dynamical transition in neutron scattering.43 We can therefore use the corresponding relaxation time reported from dielectric measurements to explain Mössbauer data for met-myoglobin30 (oxidized form of myoglobin). Before we do that, we have to extend the nonergodicity parameter obtained in Eq. (17) for exponential relaxation to stretched exponential relaxation. Cole-Cole function was used to fit the dielectric data.31 We therefore can re-write the nonergodicity parameter as follows
| (20) |
where is the stretching exponent of the Cole-Cole function. At , Eq. (20) transforms to Eq. (17). This nonergodicity factor can be used in the following form for the force variance
| (21) |
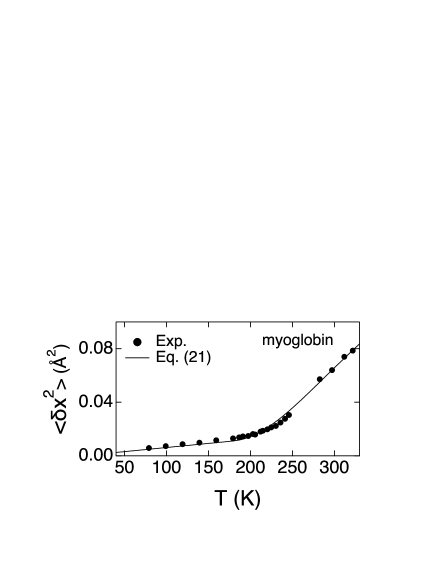
where, according to the standard prescription of the fluctuation-dissipation theorem, the amplitude is held constant. The use of this form along with and the experimental (see Fig. S4 in ESI†) in Eq. (20) produce the MSF of myoglobin shown by the solid line in Fig. 9. The fit requires nN2 at K, which is roughly consistent with nN2 for Cyt-Ox in Table 1 when Eq. (15) is applied. The quality of the fit is significantly reduced with , which testifies to the need of applying stretched relaxation to describe ergodicity breaking in protein powders.
5 Glass transition
The lower crossover temperature of the protein MSF represents the glass transition of the hydration shell. It was previously identified with the onset of translational diffusion of the water molecules in the shell.54 However, glass science requires one to pay attention not only to translations, but also to molecular rotations. There are a number of reasons for that. First, the configurational entropy of fragile glass-formers is mostly rotational55 (e.g., the heat capacities of supercooled ethanol and its plastic crystal are nearly identical56). Reducing the configurational entropy is required for reaching the glass transition57 and, therefore, the rotational configuration space has to be strongly constrained close to . Second, the temperature dependence of the dielectric relaxation time can be superimposed with the relaxation time from viscosity27 and with the diffusion coefficient. Therefore, both rotations and translations are expected to dynamically freeze near .
The density of water in the hydration shell is enhanced compared to the bulk,58, 59 and shell water, being heterogeneous and more disordered than the bulk,60, 51 is close in physical properties to a mixture of low-density and high-density amorphous ice.61 Nevertheless, the positional structure of the shell (pair distribution function) does not change with cooling, and there is no structural transition associated with crossing the temperature .62 Compared to the positional structure and diffusional dynamics,63 there is much less experimental and computational evidence on orientational correlations and rotational dynamics of water in the hydration shell. The single-particle rotational dynamics are slowed down by a factor of 2–4, as is seen by NMR64 and computer simulations.65 Collective relaxation probed by Stokes shift of optical dyes are much slower, in the range of sub- to nanonoseconds,66, 67, 68 pointing to a significantly slower collective response of water dipoles69 compared to single-molecule rotations.
The fact that the collective response of the shell dipole is quite different from single-particle MSF is illustrated in Fig. 10, which shows the dipole moment variance for hydration shells of Cyt-Ox and Cyt-Red with varying temperature and thickness of the shell. More specifically, we present the dimensionless variance of the shell dipole moment defined analogously to the dielectric susceptibility of bulk dielectrics
| (22) |
Here, is the volume of a single water molecule (effective diameter Å70) and is the number of water molecules in the shell of thickness measured from the van der Waals surface of the protein; is the total dipole moment of the water molecules in the shell, .
The main qualitative difference between the temperature dependence of the MSF and the shell dipole is that the latter clearly violates the fluctuation dissipation theorem,8 which predicts . The phenomenology of susceptibility decaying with temperature, in violation of the fluctuation-dissipation theorem,71 is shared by most polar liquids.72 However, in contrast to homogeneous liquids, the protein hydration shells are heterogeneous and highly frustrated.69 This is because polarized interfacial water has to follow a nearly uniform mosaic of positively and negatively charged surface residues. Surface charges orient water dipoles into polarized domains. These domains are mutually frustrated by altering sign of the charged residue, but stay in the fluid state with the fluctuations of the shell dipole significantly slowed down (hundreds of picoseconds to nanoseconds73, 69) compared to the bulk. This new physics, quite distinct from bulk polar liquids, connects hydration shells to relaxor ferroelectrics, where mutual frustration of dipolar crystalline cells breaks the material into ferroelectric nanodomains at the glass transition reached above the Curie point.74
The phenomenology of relaxor ferroelectrics suggests that the dipolar response of the shell is determined by reorienting the polarized domains, instead of predominantly single-particle rotations found in bulk polar liquids.75 This interpretation is supported by nanosecond time-scales characterizing the dynamic susceptibility of the shell 69 (see the ESI†). This picture does not contradict to the dynamic (fluid) nature of the hydration shell in which water can diffuse along the surface visiting a residue per ps.76 Moving from a positive to a negative residue can be accompanied with a dipole flip, still preserving the domain structure, which requires much longer times to be altered. The dipole flip of a water molecule moving to a neighboring residue will also produce a short relaxation time for single-particle rotations.64, 65
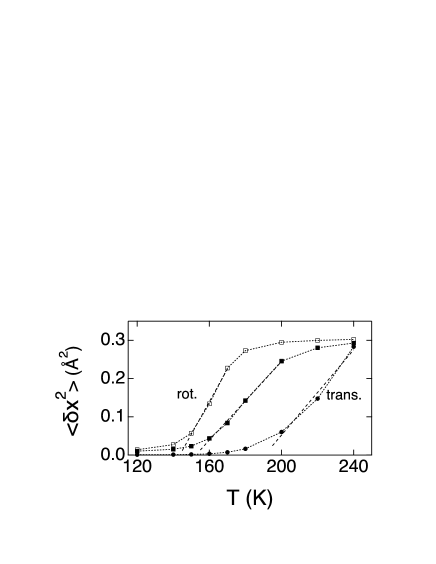
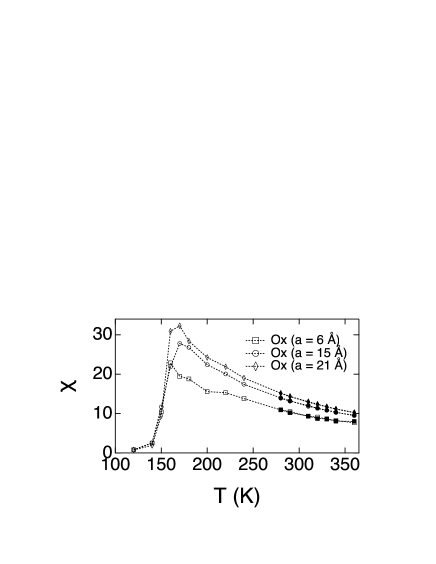
A sharp drop of at about K signals reaching the glass transition on the time scale of MD simulations (Fig. 10). This is somewhat lower than experimental K from calorimetry of concentrated solutions of Cyt-c.77 The glass transition of the hydration shell prevents elastic motions of the protein, making a hydrated protein harder at low temperatures than the dry one.18 One wonders if rotations and translations of water molecules in the shell terminate at the same temperature. Figure 11 shows that this is not the case (see ESI† for the details of calculations). The glass transition for coincides with freezing of water rotations. The onset temperature depends on the observation window (cf. filled to open squares in Fig. 11), consistent with ergodicity breaking at the transition. On the contrary, the onset of water translations occurs at a higher temperature, K. A similar phenomenology was recently reported from neutron scattering of protein’s hydration shell,78 where the onset of water’s translations also followed the onset of rotations. The temperature of translational onset is close to , as was noted in the past.79
A crude estimate of the “dielectric constant” of the shell might be relevant here. If, for the sake of an estimate, one adopts the connection between the dielectric constant and the susceptibility of bulk dielectrics, , then the inspection of Fig. 10 suggests at K and Å. This very high dielectric constant is consistent with recent dielectric spectroscopy of protein powders,80, 31 reporting high dielectric increments for the relaxation process reaching 1-10 s at the room temperature. Given the temperature dependence of this relaxation process, it appears likely that it is responsible for glass transition of hydrated protein samples.29 The drop of at seen in Fig. 10, and a similar behavior observed previously in simulations of lysozyme,69 suggests a possible connection between high and polarized domains formed in the hydration shell.
6 Onset of protein functionality
Equation (1) offers a natural explanation of the extended flexibility of proteins at high temperatures in terms of the force constant assigned to a cofactor or residue in the folded protein.18 According to Eq. (1), softening of the protein matrix due to collective agitation of the protein-water thermal bath reduces the vibrational force constant by the magnitude
| (23) |
which reduces the total force constant
| (24) |
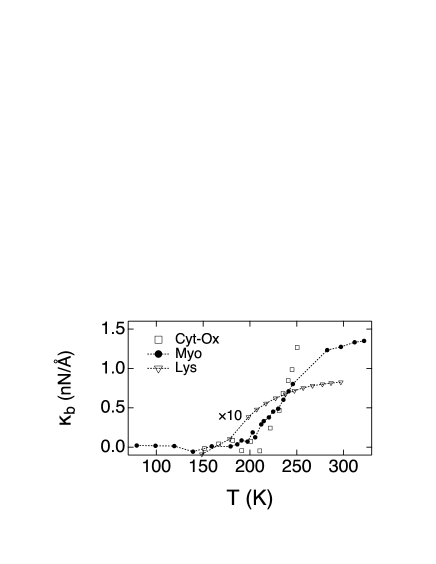
Using Eq. (24), Fig. 12 shows for Cyt-c (Ox) and myoglobin (Figs. 3 and 9). We have additionally included the results from neutron scattering of lysozyme (Lys) in 50:50 glycerol-D2O solution ( g D2O/g Lys),81 which display a crossover temperature at K. All these data point to a rise of at to a nearly constant value charactering the protein flexibility at GHz frequencies. The Young’s moduli of the hydrated protein fall with increasing temperature82, 18 in a fashion consistent with in Fig. 12.
The notion of protein dynamics as proxy for enzymatic activity has been actively discussed in the recent literature.83 One has to clearly distinguish flexibility,42 i.e. the ability to sample a large number of conformations, from the actual dynamics, i.e. the time-scales involved in usually dissipative decay of correlation functions. Whether flexibility and activity must accompany each other for slow (in milliseconds) enzymetic reactions remains to be seen,84 but there is one class of enzyme reactions where protein configurational space has to be dynamically restricted for the reaction to occur.22 This is the process of protein electron transport essential to production of all energy in biology, either through photosynthesis or through mitochondrial respiration.85
The fluctuation-dissipation theorem connects fluctuations to response to an external perturbation.8 In this framework, high flexibility implies high solvation,86 or trapping, energy. Electrons in biological energy chains have to perform many tunneling steps within a narrow energy window consistent with the energy input from food or light. In order to accomplish vectorial electron transport, energy chains have to avoid deep energy traps. Therefore, large conformational motions producing asymmetries in solvation energies between the initial and final tunneling states have to be dynamically frozen on the reaction time.22
This phenomenology is consistent with what we have found here for the dynamical transition of atomic displacements. The role of the force constant in Eq. (23) is played by the reorganization energy determined through the variance of the donor-acceptor energy gap used to gauge the progress of the reaction. The reorganization energy is determined through the variance of by the equation inspired by the fluctuation-dissipation theorem (cf. to Eq. (23))
| (25) |
Here, depends on the observation window through the nonergodicity factor (Eq. (17)) multiplying the thermodynamic () variance . The only difference of this problem from our discussion of iron’s MSF is that one has to replace the relaxation time of the force with the relaxation time of the Stokes-shift correlation function . The role of the observation window is now played by the reaction time given in terms of the reaction rate constant .
The reorganization energy quantifies the depth of the trap created for a charge by the protein-water thermal bath. The amount of energy to de-trap the electron and bring it back to the tunneling configuration specifies the activation barrier . It is given in terms of two energy parameters:22 the difference of first moments of in the initial and final states, known as the Stokes-shift reorganization energy , and the second moment of specified by
| (26) |
The parameter specifies the energy difference between two states of the protein (Red and Ox in the case of Cyt-c). It does not reach its thermodynamic value because of the inability of the protein to sample its entire phase space on the reaction time.22 Instead of reaching, through a conformational change, two thermodynamic minima of stability (for Red and Ox states), the protein gets trapped in intermediate local minima. The time separation between the reaction time and the time of the conformational transition constrains the availvble configuration space allowing a relatively small value of such that the condition keeps the reaction barrier in Eq. (26) relatively low. The reorganization energy in the denominator in Eq. (26) is, however, directly affected by nonergodic freezing of a subset of degrees of freedom, which can lead to a significant increase of the reaction barrier at low temperatures and to the termination of the protein function.
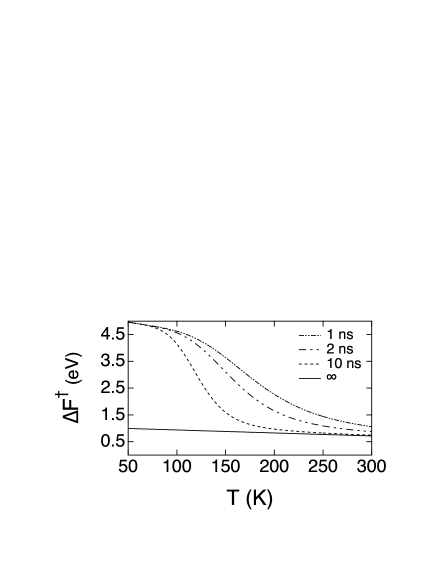
This perspective is illustrated in Fig. 13 showing the effect of the observation window on . The input parameters to the results shown in Fig. 13 are and taken from long trajectories () and the Stokes-shift relaxation time calculated for Cyt-c.44 As the temperature decreases, the relaxation time leaves the observation window, , and drops. The activation barrier grows at low temperatures (see Eq. (26)) and the reaction slows down due to ergodicity breaking qualitatively consistent with the dynamical transition for the atomic MSF (at faster rates, such as those involved in primary events of photosynthesis, becomes affected by and the picture changes again87). The overlap of the time-scales probed by the neutron scattering and Mössbauer spectroscopy with the typical reaction times of protein electron transfer suggests that the fluctuations of the protein-water thermal bath responsible for the high-temperature part of the displacement curve are the same as those involved in activating redox activity of proteins.
7 Conclusions
The present model assigns atomic displacements in the protein to two factors: (i) high-frequency vibrations within the subunit (residue, cofactor, etc.) and (ii) fluctuations in the position of the subunit caused by thermal fluctuations of the entire protein and its hydration shell. The second component enters the observable MSF in terms of the variance of the force applied to the center of mass of the subunit (denominator in Eq. (1)). This equation can be alternatively viewed as softening of a stiff vibrational force constant by the protein-water thermal bath (Eq. (24)). Since the variance of the force depends on the observation window, softening of vibrations is achieved at the temperature above allowing the long-time relaxation of the force autocorrelation function to remain within the observation window. An experimental link to this picture is provided by inelastic x-ray scattering88, 89, 90 recording softening of the protein phonon-like modes representing global vibrations. In line with the common observations of the dynamical transition, softening of the protein phonon modes is strongly suppressed in dry samples.89 Similar phenomenology is provided by the temperature dependence of the protein boson peak82, 91 reflecting the density of protein collective vibrations on the length-scale of a few nanometers and THz frequency.92, 93, 94 For instance, the frequency of the boson peak for myoglobin falls from cm-1 to cm-1 when the temperature is raised from 170 to 295 K.82
The forces produced by the protein-water thermal bath at internal sites inside the protein are strongly affected by the structure and dynamics of the hydration shell.23, 20, 21 Shell dipoles cluster in nanodomains pinned by charged surface residues. Dynamical freezing of these nanodomains occurs at the glass transition of the hydration shell corresponding to the lower crossover temperature (Fig. 1). Rotations of water molecules in the shell dynamically freeze at this temperature. Translations dynamically freeze at a higher temperature close to . Therefore, the existence of two crossover temperatures in the dynamical transition of proteins reflects two separate ergodicity breaking crossovers for rotations and translations of hydration water (Fig. 11).
The entrance of the relaxation time into the resolution window, resulting in the dynamical transition of a specific relaxation mode, is often considered to be a “trivial” effect, in contrast to an anticipated true structural transition.7, 95 However, this ergodicity breaking allows protein-driven reactions to proceed without being trapped into deep solvation wells. The link between flexibility and solvation, and thus the ability to produce traps, has been under-appreciated in the literature on enzymatic activity. As an illuminating example, protein electron transfer occurs in dynamically quenched proteins where ergodicity breaking prevents from developing deep solvation traps along the electron-transport chain.
Conflict of Interests. There are no conflicts of interest to declare
Acknowledgement. This research was supported by the NSF (CHE-1464810) and through XSEDE (TG-MCB080116N). We are grateful to Antonio Benedetto for useful discussions and the preprint (Ref. 52) made available to us. We acknowledge help by Daniel Martin with the analysis of the simulation trajectories.
References
- 1 Lovesey, S. W. Theory of neutron scattering from condensed matter, vol. 1 (Clarendon Press, Oxford, 1984).
- 2 Gabel, F. et al. Protein dynamics studied by neutron scattering. Quat. Rev. Biophys. 35, 327–367 (2002).
- 3 Smith, J. C. Protein dynamics: comparison of simulations with inelastic neutron scattering experiments. Quat. Rev. Biophys. 24, 227 (1991).
- 4 Frauenfelder, H., Parak, F. & Young, R. D. Conformational substates in proteins. Ann. Rev. Biophys. Biophys. Chem. 17, 451 (1998).
- 5 Parak, F. G. Physical aspects of protein dynamics. Rep. Prog. Phys. 66, 103–129 (2003).
- 6 Parak, F. & Formanek, H. Untersuchung des schwingungsanteils und des kristallgitterfehleranteils des temperaturfaktors in myoglobin durch vergleich von miissbauerabsorptionsmessungen mit riintgenstrukturdaten. Acta Crystallogr. A 27, 573 (1971).
- 7 Doster, W., Cusack, S. & Petry, W. Dynamic transition of myoglobin revealed by inelastic neutron scattering. Nature 337, 754 (1989).
- 8 Kubo, R. The fluctuation-dissipation theorem. Rep. Prog. Phys. 29, 255–284 (1966).
- 9 Achterhold, K. et al. Vibrational dynamics of myoglobin determined by the phonon-assisted Mössbauer effect. Phys. Rev. E 65, 051916 (2002).
- 10 Frauenfelder, H. et al. A unified model of protein dynamics. Proc. Natl. Acad. Sci. USA 106, 5129–5134 (2009).
- 11 Doster, W. The protein-solvent glass transition. Biochim. Biophys. Acta 1804, 3–14 (2010).
- 12 Ngai, K. L., Capaccioli, S. & Paciaroni, A. Dynamics of hydrated proteins and bio-protectants: Caged dynamics, -relaxation, and -relaxation. Biochimica et Biophysica Acta (BBA) - General Subjects 1861, 3553–3563 (2017).
- 13 Schirò, G. & Cupane, A. Anharmonic activations in proteins and peptide model systems and their connection with supercooled water thermodynamics. Il Nuovo Cimento C 39, 305 (2016).
- 14 Magazù, S., Migliardo, F. & Benedetto, A. Puzzle of Protein Dynamical Transition. J. Phys. Chem. B 115, 7736–7743 (2011).
- 15 Capaccioli, S., Ngai, K. L., Ancherbak, S. & Paciaroni, A. Evidence of Coexistence of Change of Caged Dynamics at Tgand the Dynamic Transition at Tdin Solvated Proteins. J. Phys. Chem. B 116, 1745–1757 (2012).
- 16 Ngai, K. L., Capaccioli, S. & Paciaroni, A. Change of caged dynamics at Tgin hydrated proteins: Trend of mean squared displacements after correcting for the methyl-group rotation contribution. J. Chem. Phys. 138, 235102–15 (2013).
- 17 Magazu, S. et al. Protein dynamics as seen by (quasi) elastic neutron scattering. Biochim. Biophys. Acta (BBA) - General Subjects 1861, 3504–3512 (2017).
- 18 Hong, L. et al. Elastic and Conformational Softness of a Globular Protein. Phys. Rev. Lett. 110, 028104–5 (2013).
- 19 Hong, L., Smolin, N., Lindner, B., Sokolov, A. P. & Smith, J. C. Three classes of motion in the dynamic neutron-scattering susceptibility of a globular protein. Phys. Rev. Lett. 107, 148102– (2011).
- 20 Hong, L., Cheng, X., Glass, D. C. & Smith, J. C. Surface Hydration Amplifies Single-Well Protein Atom Diffusion Propagating into the Macromolecular Core. Phys. Rev. Lett. 108, 238102–4 (2012).
- 21 Wood, K. et al. Protein Surface and Core Dynamics Show Concerted Hydration-Dependent Activation. Angew. Chem. Int. Ed. 52, 665–668 (2012).
- 22 Matyushov, D. V. Protein electron transfer: is biology (thermo)dynamic? J. Phys.: Condens. Matter 27, 473001 (2015).
- 23 Matyushov, D. V. & Morozov, A. Y. Electrostatics of the protein-water interface and the dynamical transition in proteins. Phys. Rev. E 84, 011908 (2011).
- 24 Martin, D. R. & Matyushov, D. V. Solvent-renormalized dissipative electro-elastic network model of hydrated proteins. J. Chem. Phys. 137, 165101 (2012).
- 25 Ngai, K. L., Capaccioli, S., Ancherbak, S. & Shinyashiki, N. Resolving the ambiguity of the dynamics of water and clarifying its role in hydrated proteins. Philosophical Magazine 91, 1809–1835 (2011).
- 26 Matyushov, D. V. Nanosecond Stokes shift dynamics, dynamical transition, and gigantic reorganization energy of hydrated heme proteins. J. Phys. Chem. B 115, 10715–10724 (2011).
- 27 Ediger, M. D., Angell, C. A. & Nagel, S. R. Supercooled liquids and glasses. J. Phys. Chem. 100, 13200 (1996).
- 28 Fenimore, P. W. et al. Concepts and problems in protein dynamics. Chem. Phys. 424, 2–6 (2013).
- 29 Khodadadi, S. & Sokolov, A. P. Protein dynamics: from rattling in a cage to structural relaxation. Soft Matter 11, 4984–4998 (2015).
- 30 Parak, F. G. & Achterhold, K. Protein dynamics on different timescales. J. Phys. Chem. Solids 66, 2257–2262 (2005).
- 31 Nakanishi, M. & Sokolov, A. P. Protein dynamics in a broad frequency range: Dielectric spectroscopy studies. J. Non-Cryst. Solids 407, 478–485 (2014).
- 32 Landau, L. D. & Lifshits, E. M. Statistical Physics (Pergamon Press, New York, 1980).
- 33 Palmer, R. G. Broken ergodicity. Adv. Phys. 31, 669–735 (1982).
- 34 Crisanti, A. & Ritort, F. Violation of the fluctuation–dissipation theorem in glassy systems: basic notions and the numerical evidence. J. Phys. A: Math. Gen. 36, R181–290 (2003).
- 35 Springer, T. Dynamics of solids and liquids by neutron scattering, vol. 3 (Spriner, Berlin, 1977).
- 36 Frolov, E. N., Gvosdev, R., Goldanskii, V. I. & Parak, F. G. Difference in the dynamics of oxidized and reduced cytochrome c measured by mössbauer spectroscopy. J. Biol. Inorg. Chem. 2, 710–713 (1997).
- 37 Sage, J. T. et al. Nuclear resonance vibrational spectroscopy of a protein active-site mimic. J. Phys.: Cond. Matter 13, 7707–7722 (2001).
- 38 Leu, B. M. et al. Resilience of the iron environment in heme proteins. Biophys. J. 95, 5874–5889 (2008).
- 39 Leu, B. M. & Sage, J. T. Stiffness, resilience, compressibility. Hyperfine Interactions 237, 87 (2016).
- 40 Fenimore, P. W., Frauenfelder, H., McMahon, B. H. & Parak, F. G. Slaving: Solvent fluctuations dominate protein dynamics and functions. Proc. Natl. Acad. Sci. 99, 16047–16051 (2002).
- 41 Fenimore, P. W., Frauenfelder, H., McMahon, B. H. & Young, R. D. Bulk-solvent and hydration-shell fluctuations, similar to and -fluctuations in glasses, control protein motion and functions. Proc. Natl. Acad. Sci. USA 101, 14408–14413 (2004).
- 42 Cooper, A. Protein fluctuations and the thermodynamic uncertainty principle. Prog. Biophys. Molec. Biol. 44, 181–214 (1984).
- 43 Khodadadi, S. & Sokolov, A. P. Atomistic details of protein dynamics and the role of hydration water. Biochim. Biophys. Acta (BBA) - General Subjects 1861, 3546–3552 (2017).
- 44 Seyedi, S., Waskasi, M. M. M. & Matyushov, D. V. Theory and electrochemistry of cytochrome c. J. Phys. Chem. B 121, 4958–4967 (2017).
- 45 Dehaoui, A., Issenmann, B. & Caupin, F. Viscosity of deeply supercooled water and its coupling to molecular diffusion. Proc. Natl. Acad. Sci. U.S.A. 112, 12020–12025 (2015).
- 46 Khodadadi, S. et al. Dynamics of biological macromolecules: Not a simple slaving by hydration water. Biophys. J. 98, 1321–1326 (2010).
- 47 Li, T., Hassanali, A., Kao, Y.-T., Zhong, D. & Singer, S. Hydration dynamics and time scales of coupled water-protein fluctuations. J. Am. Chem. Soc. 129, 3376–3382 (2007).
- 48 Halle, B. & Nilsson, L. Does the dynamic stokes shift report on slow protein dynamics? J. Phys. Chem. B 113, 8210–8213 (2009).
- 49 Furse, K. E. & Corcelli, S. A. Molecular Dynamics Simulations of DNA Solvation Dynamics. J. Phys. Chem. Lett. 1, 1813–1820 (2010).
- 50 Martin, D. R. & Matyushov, D. V. Non-Gaussian statistics and nanosecond dynamics of electrostatic fluctuations affecting optical transitions in a green fluorescent protein. J. Phys. Chem. B 116, 10294–10300 (2012).
- 51 Conti Nibali, V., D’Angelo, G., Paciaroni, A., Tobias, D. J. & Tarek, M. On the Coupling between the Collective Dynamics of Proteins and Their Hydration Water. J. Phys. Chem. Lett. 5, 1181–1186 (2014).
- 52 Benedetto, A. Protein and hydration-water dynamics are decoupled: A new model connecting dynamics and biochemical function is required. arXiv.org arXiv:1705.03128 (2017). 1705.03128.
- 53 Nickels, J. D., Garcia-Sakai, V. & Sokolov, A. P. Dynamics in Protein Powders on the Nanosecond–Picosecond Time Scale Are Dominated by Localized Motions. J. Phys. Chem. B 117, 11548–11555 (2013).
- 54 Zanotti, J.-M., Bellissent-Funel, M.-C. & Parello, J. Hydration-Coupled Dynamics in Proteins Studied by Neutron Scattering and NMR: The Case of the Typical EF-Hand Calcium-Binding Parvalbumin. Biophys. J. 76, 2390–2411 (1999).
- 55 Matyushov, D. V. Configurational entropy of polar glass formers and the effect of electric field on glass transition. J. Chem. Phys. 145, 034504 (2016).
- 56 Kabtoul, B., Jiménez-Riobóo, R. J. & Ramos, M. A. Thermal and acoustic experiments on polymorphic ethanol. Phil. Mag. 88, 4197–4203 (2008).
- 57 Richert, R. & Angell, A. C. Dynamics of glass-forming liquids. V. on the link between molecular dynamics and configuration entropy. J. Chem. Phys. 108, 9016 (1998).
- 58 Gerstein, M. & Chothia, C. Packing at the protein-water interface. Proc. Natl. Acad. Sci. USA 93, 10167–10172 (1996).
- 59 Svergun, D. I. et al. Protein hydration in solution: Experimental observation by x-ray and neutron scattering. Proc. Nat. Acad. Sci. USA 95, 2267–2272 (1998).
- 60 Lerbret, A., Hédoux, A., Annighöfer, B. & Bellissent-Funel, M.-C. Influence of pressure on the low-frequency vibrational modes of lysozyme and water: A complementary inelastic neutron scattering and molecular dynamics simulation study. Proteins: Structure, Function, and Bioinformatics 81, 326–340 (2012).
- 61 Paciaroni, A. et al. Fingerprints of Amorphous Icelike Behavior in the Vibrational Density of States of Protein Hydration Water. Phys. Rev. Lett. 101, 148104 (2008).
- 62 Yoshida, K., Tashiro, A. & Yamaguchi, T. Thermal properties and hydration structure of poly-l-lysine, polyglycine, and lysozyme. J. Mol. Liq. 217, 57–61 (2016).
- 63 Makarov, V. A., Andrews, B. K., Smith, P. E. & Pettitt, B. M. Residence times of water molecules in the hydration sites of myoglobin. Biophys. J. 79, 2966–2974 (2000).
- 64 Halle, B. Protein hydration dynamics in solution: a critical survey. Phil. Trans. R. Soc. Lond. 359, 1207 (2004).
- 65 Laage, D., Elsaesser, T. & Hynes, J. T. Perspective: Structure and ultrafast dynamics of biomolecular hydration shells. Structural Dynamics 4, 044018–15 (2017).
- 66 Jordanides, X. J., Lang, M. J., Song, X. & Fleming, G. R. Solvation dynamics in protein environments studied by photon echo spectroscopy. J. Phys. Chem. B 103, 7995–8005 (1999).
- 67 Pal, S. K. & Zewail, A. H. Dynamics of water in biological recognition. Chem. Rev. 104, 2099–2123 (2004).
- 68 Abbyad, P. et al. Measurement of solvation responses at multiple sites in a globular protein. J. Phys. Chem. B 111, 8269–8276 (2007).
- 69 Martin, D. R. & Matyushov, D. V. Dipolar nanodomains in protein hydration shells. J. Phys. Chem. Lett. 6, 407–412 (2015).
- 70 Schmid, R. & Matyushov, D. V. Entropy of attractive forces and molecular nonsphericity in real liquids: A measure of structural ordering. J. Phys. Chem. 99, 2393 (1995).
- 71 Matyushov, D. V. & Richert, R. Communication: Temperature derivative of the dielectric constant gives access to multipoint correlations in polar liquids. J. Chem. Phys. 144, 041102 (2016).
- 72 Richert, R. Supercooled liquids and glasses by dielectric relaxation spectroscopy. Adv. Chem. Phys. 156, 101–195 (2015).
- 73 Friesen, A. D. & Matyushov, D. V. Surface polarity and nanoscale solvation. J. Phys. Chem. Lett. 3, 3685–3689 (2012).
- 74 Samara, G. A. The relaxational properties of compositionally disordered abo3 porovsketes. J. Phys.: Condens. Matter 15, R367–R411 (2003).
- 75 Madden, P. & Kivelson, D. A consistent molecular treatment of dielectric phenomena. Adv. Chem. Phys. 56, 467–566 (1984).
- 76 Hospital, A., Candotti, M., Gelpí, J. L. & Orozco, M. The Multiple Roles of Waters in Protein Solvation. J. Phys. Chem. B 121, 3636–3643 (2017).
- 77 Green, J. L., Fan, J. & Angell, C. A. The protein-glass analogy: Some insights from homopeptide comparison. J. Phys. Chem. 98, 13780 (1994).
- 78 Schirò, G. et al. Translational diffusion of hydration water correlates with functional motions in folded and intrinsically disordered proteins. Nat. Comm. 6, 6490 (2015).
- 79 Tarek, M. & Tobias, D. J. Role of protein-water hydrogen bond dynamics in the protein dynamical transition. Phys. Rev. Lett. 88, 138101 (2002).
- 80 Shinyashiki, N. et al. Glass Transitions in Aqueous Solutions of Protein (Bovine Serum Albumin). J. Phys. Chem. B 113, 14448–14456 (2009).
- 81 Paciaroni, A., Cinelli, S. & Onori, G. Effect of environment on the protein dynamical transition: A neutron scattering study. Biophys. J. 83, 1157–1164 (2002).
- 82 Perticaroli, S. et al. Secondary structure and rigidity in model proteins. Soft Matter 9, 9548–9556 (2013).
- 83 Henzler-Wildman, K. A. et al. Intrinsic motions along an enzymatic reaction trajectory. Nature 450, 838–844 (2007).
- 84 Kamerlin, S. C. L. & Warshel, A. At the dawn of the 21st century: Is dynamics the missing link for understanding enzyme catalysis? Proteins 78, 1339—1375 (2010).
- 85 Nicholls, D. G. & Ferguson, S. J. Bioenergetics 3 (Academic Press, London, 2002).
- 86 Hummer, G., Pratt, L. R. & Garcia, A. E. Molecular theories and simulation of ions and polar molecules in water 102, 7885 (1998).
- 87 LeBard, D. N. & Matyushov, D. V. Protein-water electrostatics and principles of bioenergetics. Phys. Chem. Chem. Phys. 12, 15335–15348 (2010).
- 88 Liu, D. et al. Studies of Phononlike Low-Energy Excitations of Protein Molecules by Inelastic X-Ray Scattering. Phys. Rev. Lett. 101, 135501–4 (2008).
- 89 Wang, Z. et al. One role of hydration water in proteins: key to the “softening” of short time intraprotein collective vibrations of a specific length scale. Soft Matter 10, 4298–4303 (2014).
- 90 Shrestha, U. R. et al. Collective Excitations in Protein as a Measure of Balance Between its Softness and Rigidity. J. Phys. Chem. B 121, 923–930 (2017).
- 91 Frontzek, A. V., Strokov, S. V., Embs, J. P. & Lushnikov, S. G. Does a Dry Protein Undergo a Glass Transition? J. Phys. Chem. B 118, 2796–2802 (2014).
- 92 Duval, E., Boukenter, A. & Achibat, T. Vibrational dynamics and the structure of glasses. J. Phys.: Cond. Matter 2, 10227–10234 (1990).
- 93 Tarek, M. & Tobias, D. J. Effects of solvent damping on side chain and backbone contributions to the protein boson peak. J. Chem. Phys. 115, 1607–1612 (2001).
- 94 Schirò, G., Caronna, C., Natali, F., Koza, M. M. & Cupane, A. The “protein dynamical transition”does not require the protein polypeptide chain. J. Phys. Chem. Lett. 2, 2275–2279 (2011).
- 95 Cupane, A., Fomina, M., Piazza, I., Peters, J. & Schirò, G. Experimental Evidence for a Liquid-Liquid Crossover in Deeply Cooled Confined Water. Phys. Rev. Lett. 113, 215701–5 (2014).