Rapidity correlations in the RHIC Beam Energy Scan Data
Abstract
A pair-normalized two-particle covariance versus the rapidity of the two particles, called R2, was originally studied in ISR and FNAL data in the 1970’s. This variable has recently seen renewed interest for the study of the dynamics of heavy-ion collisions in the longitudinal direction. These rapidity correlations can be decomposed into a basis set of Legendre polynomials with prefactors , which can be considered the rapidity analog of the decomposition of azimuthal anisotropies into a set of cosine functions with prefactors vn. The values have been suggested to be sensitive to the number of particle emitting sources, baryon stopping, viscosities, and critical behavior. The rapidity correlations have been measured by the STAR collaboration as a function of the beam energy for 0-5% central AuAu collisions with beam energies ranging from 7.7 to 200 . The experimental results and comparisons to the UrQMD model are presented.
keywords:
rapidity correlations , forward-backward asymmetry , heavy-ion collisions1 Introduction
Initial state density fluctuations and the pressure gradient of the strongly interacting medium in transverse plane result in azimuthal anisotropies of the emitted particles in the final state. These can be characterized by a Fourier expansion with magnitudes given by prefactors vn [1, 2]. The longitudinal structure of the initial state, particularly at RHIC energies, remains largely unexplored. The density fluctuations can be studied in terms of correlations of particles in the longitudinal direction, i.e. in (pseudo)rapidity [3, 4].
Long-range rapidity correlations, and other “short range” mechanisms such as resonance decays, jet fragmentation, and quantum statistical effects, appear in specific ways in the correlation functions [4]. The shape of the longitudinal correlations can be characterized by Chebyshev [3] or Legendre polynomials [4] with magnitudes given by prefactors . Recently, the ATLAS collaboration has studied [5] the longitudinal fluctuations in terms of and provided information on the early time dynamics in different collision systems. A relativistic hydrodynamical calculation [6] has also been used to show that the rapidity correlations are sensitive to the number of particle-producing sources and the transport properties of the medium. The importance of doing this analysis at RHIC was also emphasized in Ref[6].
In this work, rapidity correlations were studied with STAR for AuAu collisions at eight different beam energies from 7.7 to 200 for the BES-I program at RHIC. The calculated Legendre coefficients from experimental data are also compared with the results from the UrQMD model [7].
2 Analysis Method
Two-particle rapidity correlation function is defined as [8]:
| (1) |
where and are two particle, and single particle, multiplicity density distributions in rapidity, respectively; averaged over events within a narrow centrality class. In order to study the purely dynamical fluctuations, a normalization is used to decouple the residual centrality dependence from the rapidity correlation function, =+1 [4, 5]. This normalized correlation function is given by:
| (2) |
where is the projection of the correlation function along the rapidity axis of each particle. The correlation function can be decomposed onto a basis set of normalized Legendre polynomials in the (pseudo)rapidity range of as [4, 5]:
| (3) |
The first diagonal coefficient represents the contribution from the forward-backward asymmetry of the participating nucleons, reflects the fluctuations in the width of the single particle density distribution, and coefficients with mn+2 and larger quantify the strength of shorter range correlations [4].
Two-particle correlation functions for the most central (0-5%) AuAu events were calculated as the ratio of the same-event and mixed-event pairs, where the mixed event pairs were formed by sampling from the single particle distributions in (y, , pT). Charged pions, kaons (0.2pT2 GeV/c) and protons (0.4pT2 GeV/c) were studied in this analysis. The reconstructed tracks with y0.5 (0.7 for protons), and 1.0 (1.4 for protons) were used. Every track used in the analysis was directly identified as either , K, or p by requiring correct values of both the ionization energy loss and time of flight in the STAR TPC and TOF, respectively. Thus, “charged hadrons” in this analysis, labelled h±, are not simply all reconstructed TPC tracks but are doubly directly-identified , K, or p particles. Pseudo-correlations caused by the experimental effects of z-vertex smearing were corrected. The systematic uncertainties were estimated by varying the track selection cuts. In addition, track crossing effects [9] were corrected by pT-ordering the particles in each pair and then removing the pairs with 0.05 and 60∘0∘ from both the same-event and mixed-event pairs.
In this analysis, the three-dimensional correlation function was formed to allow the study of both R2(y1,y2), (i.e. Eq. 1) and R2(y,) correlations. The averaged one-dimensional correlation function was obtained by projecting the two or three-dimensional correlation function. The same analysis was also done for events from the UrQMD model [7], version 3.4.
3 Results
Figure 1 shows the most significant diagonal Legendre coefficients for charged hadrons, pions, kaons and protons for 0-5% centrality and for each of eight beam energies from 7.7 to 200 GeV.
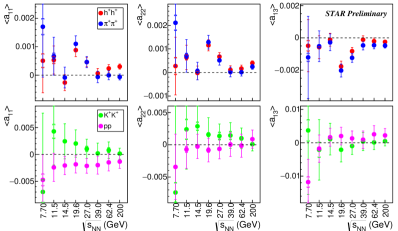
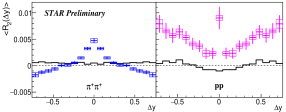
The magnitude of the coefficients decreases with increasing beam energy, indicating decreased two-particle correlations per pair as increases. The first diagonal coefficient is positive for charged hadrons, pions, and kaons. This is expected from wounded nucleon model arguments [3]. However, the coefficient is negative for protons at all eight energies. This results from the relative anti-correlation of at y0 that is seen in Figure 2. Such an anti-correlation for protons has also been observed in pp collisions at 7 TeV by ALICE [10] and in collisions at 29 GeV by the TPC/Two-Gamma collaboration [11].
A significant increase in the magnitude of the coefficients for pions at 19.6 and 27.0 was observed and shown in Figure 1. A further investigation shows that there is a strong correlation structure in pions around y0 that is elongated in the direction. This structure only appears for pions and is similar in shape to those observed in cluster emission models applied to pp collisions at RHIC and the LHC [12, 13].
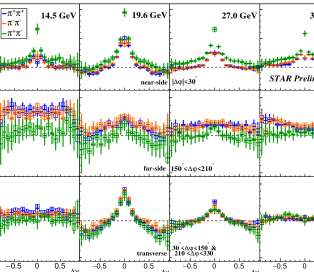
In order to further understand the observed structure, the averaged correlation functions for pions versus were calculated in three different ranges of the azimuthal angle : near-side (-30∘30∘), far-side (150∘210∘) and transverse (30∘150∘ & 210∘330∘) for 19.6 and 27 GeV and their neighboring energies (14.5 and 39 GeV) as shown in Figure 3. In the near-side projection there is a peak around y0 which is stronger in unlike-sign pions than like-sign pions. This is an expected feature of the short-range correlation mechanisms [5] that are dominant in this range. There is no significant structure in the far-side projection of both like-sign and unlike-sign pions at these energies. However, the transverse projection shows a significant peak around y0 at 19.6 and 27 GeV. This structure has the same magnitude for both like-sign and unlike-sign pions. The UrQMD model does not reproduce this observation (see Figure 2).
4 Conclusions
Two-particle rapidity correlations have been studied for like-sign and unlike-sign charged hadrons and directly-identified particles (, and ) in 0-5% central AuAu collisions at 7.7-200 GeV. The shape of the rapidity correlations has been quantified by decomposing the correlation functions onto a basis set of Legendre polynomials. The coefficients have been observed to be positive for pions and kaons, and they are negative for protons at all eight beam energies. The positive or negative values of are indicative of correlations or anti-correlations, respectively. A charge-independent structure has been observed in the correlation function for pions. This structure is very localized in beam-energy (19.6 and 27 GeV) and at y0 and extends as a ridge in the direction. Further studies are needed to understand the underlying physical mechanisms for this structure.
References
- [1] S. A. Voloshin and Y. Zhang, Z. Phys. C 70, 665 (1996)
- [2] B. Alver and G. Roland, Phys. Rev. C 81, 054905 (2010)
- [3] A. Bzdak and D. Teaney, Phys. Rev. C 87, 024906 (2013)
- [4] J. Jia, S. Radhakrishnan, and M. Zhou, Phys. Rev. C 93, 044905 (2016)
- [5] ATLAS Collaboration, arXiv:1606.08170
- [6] A. Monnai and B. Schenke, arXiv:1509.04103
- [7] S. A. Bass et al., Prog. Part. Nucl. Phys. 41, 225 (1998)
- [8] L. Foà, Phys. Lett. C 22, 1 (1975)
- [9] L. Tarini, Ph.D. thesis, Wayne State University (2011)
- [10] ALICE Collaboration, arXiv:1612.08975v1
- [11] H. Aihara et al. Phys. Rev. Lett. 57, 3140 (1986)
- [12] B. Alver et al., Phys. Rev. C 75, 054913 (2007)
- [13] CMS Collaboration, JHEP 1009, 091 (2010)