Aging near rough and smooth boundaries in colloidal glasses
Abstract
We use confocal microscopy to study the aging of a bidisperse colloidal glass near rough and smooth boundaries. Near smooth boundaries, the particles form layers, and particle motion is dramatically slower near the boundary as compared to the bulk. Near rough boundaries, the layers nearly vanish, and particle motion is nearly identical to that of the bulk. The gradient in dynamics near the boundaries is demonstrated to be a function of the gradient in structure for both types of boundaries. Our observations show that wall-induced layer structures strongly influence aging.
I Introduction
Glasses are solids with disordered structures and slow internal dynamics. Efforts to understand the influence of boundaries on glassy dynamics has been an active area of research for more than two decades.alcoutlabi05 ; forrest01 ; richert11 ; roth05 ; baschnagel05 ; ediger14 ; napolitano17 ; hunter12rpp Initial efforts on confined systems were thought to provide a route to accessing postulated growing length scales associated with cooperative motion.baschnagel05 ; binder03 ; kob00 ; scheidler02 ; pye10 ; hanakata14 ; lang13 ; sarangapani11 ; sarangapani12 However, the study of such small system sizes necessitates the presence of boundaries and it has turned out that the specific details of such interfaces have a great deal of influence on the local dynamics near the boundary.he07 In experimental material systems, the type of interface often plays a dominant role over finite size effects where interfacial energy, specific chemical interactions, and substrate compliance are all factors that have shown to have some influence on the dynamics.fryer01 ; tsui01 ; paeng12 ; priestley05 ; roth07 ; evans12 ; baglay15 ; wang13 ; christie16 ; edmond12 ; hunter14 ; baglay17 In computer molecular dynamics (MD) simulations where the specific details of the boundary need to be constructed at its most basic level, it is unclear a priori how best to accomplish this.
Early MD efforts started with smooth, structureless walls where the boundary was treated as a continuum and details of the wall potential were integrated over in the lateral (,) direction leaving only a -dependence perpendicular to the boundary.baschnagel05 Alternatively, molecularly structured walls assembled from Lenard-Jones (LJ) particles into either crystalline arrays or frozen amorphous structures were also investigated.kob00 ; scheidler02 ; scheidler04 ; hanakata15 ; davris15 ; varnik02 In these simulations, local dynamic near the boundary were usually different than bulk, but the underlying cause why was frequently unclear. Smooth walls typically exhibit faster dynamics than bulk in part because there is no penalty for the particles to slide laterally along the wall,binder03 ; varnik02e ; baschnagel02 ; peter06 ; hanakata12 a type of motion only considered to be experimentally relevant for a free surface.peter06 Systems with molecularly structured walls, where lateral sliding is inhibited, typically exhibited slower dynamics in comparison.kob00 ; scheidler02 ; hanakata14 ; scheidler04 ; hanakata15 ; smith03
One of the major challenges with such boundaries is that for mixtures of LJ particles or polymeric bead-spring models (the most commonly modeled systems), the presence of the wall creates layering of the particle density as a function of distance from the wall.baschnagel05 Intuitively, the particles pack easily in a layer against the wall, and then the particles in the second layer pack against that first layer, etc., with the influence of the wall diminishing farther away. Thus, a major effort in these studies is the need to determine the extent to which the observed differences in local dynamics a distance to the boundary are influenced by the local structure in density. In some cases slower dynamics near the boundary has been associated with a significantly increased local density,baschnagel05 ; fehr95 while other studies have demonstrated that the change in dynamics near the boundary is unrelated to the density profile.kob00 ; scheidler02 ; hanakata15 ; hanakata12 For example, even efforts to construct a ‘neutral’ boundary that avoids local perturbations to the particle density by freezing in an amorphous, liquid-like structure still leads to perturbations in the local dynamics.kob00 ; scheidler02 ; scheidler04 ; biroli08 ; li14 ; hocky14 ; himanagamanasa15 It is important to note that local perturbations to the structure are not limited to only coarse-grained simulations, they are also observed in nearly-atomistic, united-atom models.hudzinskyy11 In addition, experimental studies on glassy thin film systems are also trying to uncover the extent to which molecular ordering occurs near a boundary and its possible influence on the local density and dynamics.gin12 ; sen16 ; napolitano13 ; gautam00 ; huang16
Here we present a direct experimental comparison of local glassy dynamics next to rough and smooth boundaries using colloidal glasses, which have been previously suggested as a means of experimentally verifying these observations from coarse-grained MD simulations of boundaries.hunter12rpp ; fehr95 ; nemeth99 Colloids are small solid particles in a liquid, where Brownian motion allows particles to diffuse and rearrange.hunter12rpp We use confocal microscopy to study the aging of a bidisperse colloidal glass where layer-resolved dynamics as a function of distance from a rough or smooth wall are compared with the measured density profile. Smooth boundaries are simply a normal untreated glass coverslip, while rough boundaries are constructed by melting a small amount of the colloidal sample to the coverslip. These stuck particles cover approximately 30-50% of the surface and provide a roughness scale comparable to the particle size. The particle-glass and particle-particle interactions are purely repulsive and so the main difference in the boundary conditions is the topography. We observe distinctly different results between smooth and rough boundary conditions: near smooth boundaries motion is dramatically slower, whereas near rough boundaries the aging process is nearly independent of the distance from the boundary. We ascribe this to the strong influence of layer-like structures formed near the smooth boundary.
Our samples are aging: unlike many phases of matter, glasses are out of equilibrium, and so their properties slowly evolve, perhaps toward a steady state.struik77 ; vanmegen98 ; priestley09 ; ramirez10aging These properties can include the density, enthalpy, and diffusive motion of the molecules comprising the glass. This has implications for the usage of glassy materials which have properties that depend on age perhaps in an undesirable way.tant81 ; huang04polymer ; priestley09 Aging has been observed in polymer glasses,priestley09 ; tant81 granular systems,knight95 ; richard05 and soft materials such as colloids and foams.vanmegen98 ; elmasri05 ; martinez08 ; cipelletti02 ; courtland03 ; lynch08 ; bandyopadhyay04 ; mckenna09 ; di11 While for polymer glasses and granular materials aging is often measured as slight decreases in volume, colloidal glasses are typically studied at constant volume. The main signature of aging of colloidal glasses is the dramatic slowing of particle motion as the sample ages,vanmegen98 ; elmasri05 ; martinez08 often characterized by the slowing down of the mean square particle displacement for time windows at increasing aging times.courtland03 Previous work suggests that aging in colloidal systems may relate to the local structure around rearranging particles lynch08 or domains of more mobile particles.courtland03 ; yunker09 In general, it is not surprising that confined glasses age in different ways from their bulk counterparts.priestley09 In this manuscript we show that aging of colloidal particles is tied to layering structure imposed by the nearby sample boundaries.
II Experimental Details
In our experiment we use sterically stabilized poly(methyl methacrylate) (PMMA) particles antl86 ; pusey86 to prevent aggregation. Two different sizes of particles are mixed in order to prevent crystallization, with m and m. The particles have a polydispersity of 7%. The number ratio is approximately . To match the particles’ density and refraction, we use a mixture of decalin and cyclohexylbromide as the solvent.dinsmore01 We view our samples with a fast confocal microscope (VT-Eye from Visitech, International). The large particles are dyed with rhodamine dye and thus are visible, while the small particles are undyed and thus unseen. Based on prior work, we expect that both small and large particles have similar behavior lynch08 ; narumi11 . Visual inspection using differential interference contrast microscopy, which can see both particle types, confirms that the particles are well-mixed even at the boundary. The imaged volume is m3. These images are taken once per minute for 2 hours. Our scanning volume starts about 5 m outside the boundary to ensure we have clear images of the particles at the boundary. The microscope pixel size is m in and (parallel to the boundary) and m in (perpendicular to the boundary). We use standard software to track the motion of the particles in 3D.crocker96 ; dinsmore01 Our particle locations are accurate to 0.10 m initially and to 0.15 m by the end of the experiment after some photobleaching occurs.
We construct two types of sample chambers. The first uses a normal untreated coverslip as a smooth boundary. The second is prepared by taking a small amount of colloidal sample and melting this on to the coverslip, using an oven at 180∘ C for 20 min. After this process, the PMMA particles are irreversibly attached to the coverslip. This sample is the same bidisperse mixture of PMMA particles as the main sample with the exception that both particle sizes are undyed. By image analysis we determine that the stuck particles cover approximately 30-50% of the surface. The specific fraction is difficult to measure as we only image the large fluorescently dyed particles, so we cannot see either the smaller mobile particles of our bidisperse sample or the stuck particles of either size. After adding the samples, we never observe any of our sample particles stuck to the boundaries for either smooth or rough boundary conditions.
We add a stir bar inside each sample chamber so that we can shear rejuvenate the samples courtland03 and thus initiate the aging process and set (when we stop stirring). Note that is set by the laboratory clock and thus is identical throughout our sample; we are not considering the idea of a spatially varying time scale. We find the stirring method gives reproducible results similar to prior work,courtland03 ; lynch08 although this is probably different from a temperature or density quench as is usually done for polymer and small molecule glasses.mckenna03 Given the flows caused by the stirring take 20-30 s to appreciably decay after stirring is stopped, there is some uncertainty in our , but we examine the data on time scales at least ten times larger than any uncertainty of this initial time.
Confocal microscopy allows us to measure the bulk number density for large particles, which we find to be m. The uncertainty represents the variability that we see from location to location. Given that we cannot directly observe the small particles, the observed number density in any given location is not a useful measure of the local volume fraction. Thus, we do not have a direct measure of the volume fraction. Given that the samples behave as glasses (to be shown below) and particles are still able to move, we conclude , with (for bidisperse colloidal glassesnarumi11 ) and (the value for random close packing for our bidisperse sampledesmond14 ). Prior studies of aging colloidal glasses found little martinez10 or no courtland03 dependence of the behavior on . It is important to note that we cannot definitely establish if our two samples are at the same or, if not, which one would be higher.
III Results
Figure 1 shows reconstructed 3D images for smooth (a) and rough (b) boundaries. To show the influence of the boundaries, the particles closest to the boundary are on the top of these pictures (colored dark purple). The color changes continuously as a function of the distance away from the boundary. However, the particles shown in Fig. 1(a) appear to have discrete colors as they form layers with distinct values. This phenomena is induced by the flat wall and is well known.landry03 ; edmond12
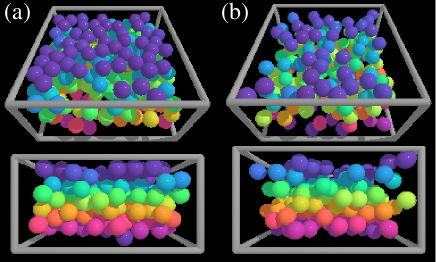
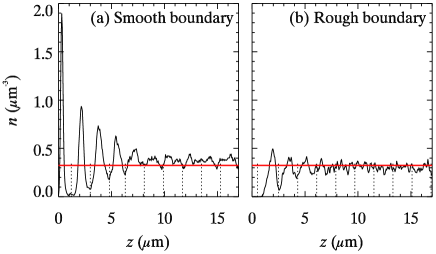
To quantify the layered structure we measure the time-averaged number density for the large particles . This is shown in Fig. 2 for smooth (a) and rough (b) boundaries. We set at the center of the particle whose center is closest to the boundary. The vertical dotted lines indicate the separate layers. As the sample is composed of two sizes of particles, the layer structure decreases rapidly away from the wall, consistent with simulations kjellander91 ; mittal08 and experiments.edmond12 The first peak in Fig. 2(a) has the maximum value and minimum width, indicating particles are in a well-defined layer, consistent with Fig. 1(a). By the sixth layer, it is unclear if there is still a layer or if we are seeing random number density fluctuations. For the rough wall in panel (b), the layers become poorly defined by the fourth layer. For later analysis, we continue counting the layers by defining them in the bulk region to be every 1.8 m based on the typical spacing of the well-defined layers. Note that for the rough boundary condition, the wall texture occupies some of the space of the first layer, thus decreasing the number of dark purple particles in Fig. 1(b) and reducing the area under the first peak in Fig. 2(b).
Aging manifests as a slow change of sample behavior with increasing , where the rate of change slows at longer times.struik77 The easiest quantity to see this with our data is the mean square displacement (MSD) of particle motion.lynch08 ; yunker09 Fig. 3 shows the motion parallel to the boundaries for (a,b) rough and (c,d) smooth boundaries, with panels (b) and (d) corresponding to the bulk MSD curves. The different colors indicate different ages. The mean square displacement is computed as where the angle brackets indicate an average over all large particles and over all starting times within the window of . For our shortest time scale ( min) the MSD curves have a shallow slope indicating particles are trapped by the local configuration, with the exception of the black curves ( min) when the aging has just started. At long time scales, the MSDs show an upturn, which is related to the samples’ age.courtland03 ; lynch08 ; yunker09 For larger the lag time particles need to reach the same MSD increases, indicating the slowing particle motion. Note that as we take data, the fluorescent dye in the particles begins to photobleach and our particle tracking resolution worsens, slightly increasing the measured MSD values at small .poon12 Slight differences in image quality may also be affecting the overall height of the MSD curves between the smooth and rough boundary conditions for the data at min.poon12 Accordingly, for subsequent analysis below, we will focus on large values for which the signal is greater than the photobleaching noise. The main points to learn from Fig. 3 are that the overall behavior of the curves shows the expected aging trend with larger , and panels (b,d) show the aging curves are similar for both boundary conditions far from the boundary.
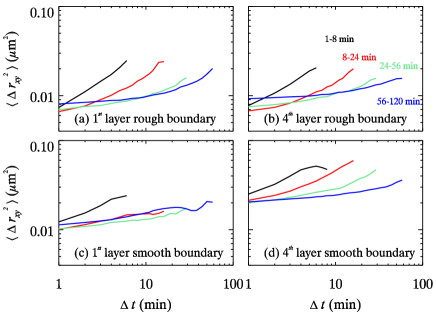
Figure 3(a) shows the MSD curves for motion for the first layer with rough boundary conditions. Surprisingly, there barely exists any differences comparing to Fig. 3(b), which depicts the MSDs of the fourth layer. The particles overall show aging behavior with slower dynamics for larger . In contrast to the rough boundary, the MSD curves for the first layer next to the smooth boundary look strikingly different from the bulk case, as seen by comparing Fig. 3(c) and (d). In all four time groups the MSD curves in the first layer are slightly smaller than those in the fourth layer. The smooth wall greatly restricts particle mobility, similar to what has been seen for dense colloidal liquids near smooth walls.edmond12 Moreover, unlike the fourth layer, where the MSD curves strictly follow the aging order, the aging process seems to reach a -independent state by min. This is likely because the dynamics in this layer are extremely slow, including the aging dynamics. This explanation is also consistent with the pronounced first layer density peak seen in Fig. 2(a).
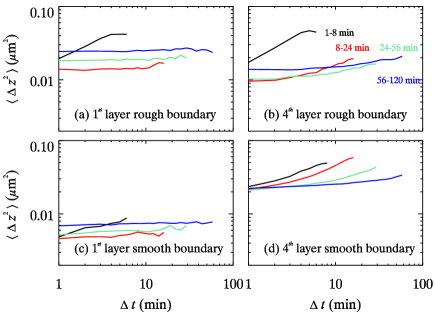
Figure 4 shows the MSD data for the component of motion, perpendicular to the boundary. The results are similar to the MSD data of Fig. 3, with the exception that the layers closest to the boundaries show less motion [panels (a,c)] for both rough and smooth boundary conditions. The increase in the height of the MSD curves with age in Fig. 4(a,c) is due to photobleaching, but otherwise those MSD curves are fairly flat. Here the first layer for the rough boundary shows some differences with the bulk behavior [compare panels (a) and (b)]. The contrast between first layer and bulk is stronger for the smooth boundary condition [compare panels (c) and (d)].
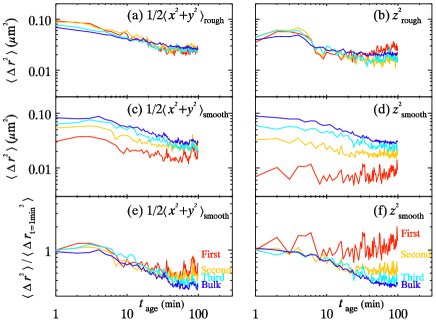
To better understand the influence of the boundaries, we consider a complementary analysis, examining at a fixed and varying . We choose min, where Figs. 3,4 show that the particles’ average movement decreases with increasing in both smooth and rough boundaries. Figure 5 shows the data divided by rough boundary condition (panels a,b) and smooth boundary condition (panels c,d), for motion parallel and perpendicular to the boundaries (left and right panels respectively). The colors indicate different layers, as labeled in panels (e,f). The overall decreasing trend of all the curves with larger is the signature of aging, with the logarithmic axis making apparent that the rate of decrease itself is slower in older samples. The data suggest the sample is still aging at the longest times observed in our experiment, although even reaching a state-steady for min does not preclude the sample from still having an aging signal at longer .
For the rough boundaries [Fig. 5(a,b)], the data collapse for all layers confirming that the boundary appears to have a negligible influence on the dynamics. However, for the smooth boundary condition, the wall-induced structures bring significant differences for motion parallel to the boundary [Fig. 5(c)] and even larger differences in the perpendicular direction [Fig. 5(d)]. Both types of motion are slower closer to the wall. For the motion perpendicular to the boundary (panel d), the motion in the first layer is around ten times smaller than the bulk. Moreover, unlike other layers, we do not observe an aging signal in the first layer – the curve is essentially flat. The lack of observed aging behavior of suggests that this first layer has very slow dynamics. Of course, the perpendicular motion in the first layer is bounded at , but the displacements we observe are much smaller than for the first layer next to the rough wall, which has a similar constraint on perpendicular motion. Our observations of nearly immobile particles with no aging signature in this first layer matches results from thin polymer films near attractive silica substrates.priestley05
As a different way of understanding how the aging process changes near the smooth boundary, we normalize by min as shown in Fig 5(e,f). For both motion parallel and perpendicular to the boundary, the data collapse moderately well for min, indicating an initial aging trend. For min, the first and second layers nearly stop evolving while the other layers are still aging. This is especially true for the motion (panel f).
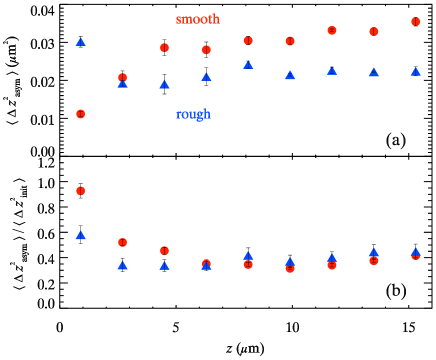
To further explore the relation between the layering structures and motion perpendicular to the boundary we define . This is the average of the data of Fig. 5(b,d) in the asymptotic regime, that is, for min. The results are plotted as a function of the distance from the wall in Fig. 6(a). The smooth data (red circles) smoothly increases as increases. The rough data (blue triangles) are fairly constant, with the exception of the first layer ( m) which is larger. As argued above based on the flatness of the data in Fig. 4(a), this increase in the first layer is likely due to photobleaching than true motion. For m the differences between smooth and rough data are likely due to image quality which artificially increases the MSD.poon12 To account for this, in Fig. 6(b) are normalized by the value of averaged over min. This collapses the data for m. These data are related to the amount the dynamics slow as the sample ages, with 1 corresponding to no slowing and smaller values indicating slowing with age. The value close to 1 for the smooth boundary condition indicates that the first layer barely ages, consistent with the similarity of the MSD data of Fig. 4(c) and the horizontal red line in Fig. 5(d). The decrease in the data of Fig. 6(b) as increases shows a return to the normal aging seen in the bulk.
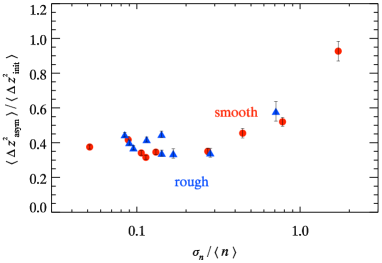
The qualitative similarity of the rough and smooth data in Fig. 6(b) motivate an attempt to collapse the data by a horizontal shift. Noting that the number density data of Fig. 2(b) look like a horizontally shifted portion of the data of Fig. 2(a), we use the local layer structure as a possible way to explain the dynamical data. We quantify the structure using the standard deviation of within a layer divided by its mean. This nearly collapses the data (to within fluctuations of ) accounting for most of the effect. The data for are essentially the bulk region. Thus the difference in dynamics between the smooth and rough boundaries we observe can be explained by the difference in particle layering that occurs next to these two interfaces.
IV Conclusions
In our experiment we study aging by observing particle motion in a colloidal glass near smooth and rough boundaries. Both samples exhibit aging in their bulk. Near a smooth boundary, the particles form layers against the boundary such that in the two layers closest to the wall, motion is greatly diminished. For a smooth wall, we observe the influence of the boundary extends up to layers ( large particle diameters) into the sample. The observations of a gradient in dynamics near the smooth wall are qualitatively similar to prior observations of gradients near interfaces in glassy materials. Direct evidence for gradients in dynamics has been seen in molecular dynamics simulations kob00 ; scheidler02 ; scheidler04 and colloidal experiments.sarangapani11 ; hunter14 In other experiments the influences of the boundaries are inferred from local probes near the boundary (e.g., Ref. priestley05 ) or fitting the data to models assuming boundary effects (e.g., Ref. pye10 ).
Here we not only see the gradient in dynamics, but observe that this gradient in dynamics is directly related to a gradient in the structural properties. For a rough boundary, the wall-induced structure is greatly reduced and the dynamics appear more bulk-like near the boundary, being similar to that far into the bulk. By comparing the local dynamics near the rough and smooth boundaries, our results suggest that the dominant factor modifying aging dynamics near a boundary is the structure caused by the presence of the boundary. By presenting a rough amorphous boundary, the structure is more bulk-like and thus the dynamics are more bulk-like. A fruitful area for future work would be to explore boundary textures that have intermediate influences on layering structure.
These experimental results on colloidal glasses suggest a viable means by which neutral rough amorphous boundaries may be implemented in computer simulations. This is an issue that computational studies on the influence of interfacial effects on local dynamics have been struggling with for more than two decades,baschnagel05 ; kob00 ; scheidler02 ; scheidler04 ; hanakata15 ; davris15 ; fehr95 and has relevance for the implementation of theoretical point-to-set studies.biroli08 ; li14 ; hocky14 ; himanagamanasa15 The method employed in the present study creates a rough amorphous boundary by randomly sticking particles to a smooth wall at approximately 30-50% surface coverage. The local aging dynamics we observe near such a rough boundary appear nearly bulk-like with little deviation from bulk particle densities.
This work was supported by the National Science Foundation (DMR-1609763).
References
- (1) M. Alcoutlabi and G. B. McKenna, Effects of confinement on material behaviour at the nanometre size scale, J. Phys.: Condens. Matter, 17, R461–R524 (2005).
- (2) J. Forrest and K. Dalnoki-Veress, The glass transition in thin polymer films, Adv. Coll. Int. Sci., 94, 167–195 (2001).
- (3) R. Richert, Dynamics of nanoconfined supercooled liquids, Ann. Rev. Phys. Chem., 62, 65–84 (2011).
- (4) C. B. Roth and J. R. Dutcher, Glass transition and chain mobility in thin polymer films, J. Electroanalytical Chem., 584, 13–22 (2005).
- (5) J. Baschnagel and F. Varnik, Computer simulations of supercooled polymer melts in the bulk and in confined geometry, J. Phys.: Condens. Matter, 17, R851–R953 (2005).
- (6) M. D. Ediger and J. A. Forrest, Dynamics near free surfaces and the glass transition in thin polymer films: A view to the future, Macromolecules, 47, 471–478 (2014).
- (7) S. Napolitano, E. Glynos, and N. B. Tito, Glass transition of polymers in bulk, confined geometries, and near interfaces, Rep. Prog. Phys., 80, 036602 (2017).
- (8) G. L. Hunter and E. R. Weeks, The physics of the colloidal glass transition, Rep. Prog. Phys., 75, 066501 (2012).
- (9) K. Binder, J. Baschnagel, and W. Paul, Glass transition of polymer melts: Test of theoretical concepts by computer simulation, Prog. Poly. Sci., 28, 115–172 (2003).
- (10) W. Kob, P. Scheidler, and K. Binder, The relaxation dynamics of a simple glass former confined in a pore, Europhys. Lett., 52, 277–283 (2000).
- (11) P. Scheidler, W. Kob, and K. Binder, Cooperative motion and growing length scales in supercooled confined liquids, Europhys. Lett., 59, 701–707 (2002).
- (12) J. E. Pye, K. A. Rohald, E. A. Baker, and C. B. Roth, Physical aging in ultrathin polystyrene films: Evidence of a gradient in dynamics at the free surface and its connection to the glass transition temperature reductions, Macromolecules, 43, 8296–8303 (2010).
- (13) P. Z. Hanakata, J. F. Douglas, and F. W. Starr, Interfacial mobility scale determines the scale of collective motion and relaxation rate in polymer films, Nature Comm., 5, 4163 (2014).
- (14) R. J. Lang and D. S. Simmons, Interfacial dynamic length scales in the glass transition of a model freestanding polymer film and their connection to cooperative motion, Macromolecules, 46, 9818–9825 (2013).
- (15) P. S. Sarangapani, A. B. Schofield, and Y. Zhu, Direct experimental evidence of growing dynamic length scales in confined colloidal liquids, Phys. Rev. E, 83, 030502 (2011).
- (16) P. S. Sarangapani, A. B. Schofield, and Y. Zhu, Relationship between cooperative motion and the confinement length scale in confined colloidal liquids, Soft Matter, 8, 814–818 (2012).
- (17) F. He, L. M. Wang, and R. Richert, Confined viscous liquids: Interfacial versus finite size effects, Euro. Phys. J. - Special Topics, 141, 3–9 (2007).
- (18) D. S. Fryer, R. D. Peters, E. J. Kim, J. E. Tomaszewski, J. J. de Pablo, P. F. Nealey, C. C. White, and W.-l. Wu, Dependence of the glass transition temperature of polymer films on interfacial energy and thickness, Macromolecules, 34, 5627–5634 (2001).
- (19) O. K. C. Tsui, T. P. Russell, and C. J. Hawker, Effect of interfacial interactions on the glass transition of polymer thin films, Macromolecules, 34, 5535–5539 (2001).
- (20) K. Paeng, R. Richert, and M. D. Ediger, Molecular mobility in supported thin films of polystyrene, poly(methyl methacrylate), and poly(2-vinyl pyridine) probed by dye reorientation, Soft Matter, 8, 819–826 (2012).
- (21) R. D. Priestley, C. J. Ellison, L. J. Broadbelt, and J. M. Torkelson, Structural relaxation of polymer glasses at surfaces, interfaces, and in between, Science, 309, 456–459 (2005).
- (22) C. B. Roth, K. L. McNerny, W. F. Jager, and J. M. Torkelson, Eliminating the enhanced mobility at the free surface of polystyrene: fluorescence studies of the glass transition temperature in thin bilayer films of immiscible polymers, Macromolecules, 40, 2568–2574 (2007).
- (23) C. M. Evans, S. Narayanan, Z. Jiang, and J. M. Torkelson, Modulus, confinement, and temperature effects on surface capillary wave dynamics in bilayer polymer films near the glass transition, Phys. Rev. Lett., 109, 038302 (2012).
- (24) R. R. Baglay and C. B. Roth, Communication: Experimentally determined profile of local glass transition temperature across a glassy-rubbery polymer interface with a difference of 80 K, J. Chem. Phys., 143, 111101 (2015).
- (25) J. Wang and G. B. McKenna, Viscoelastic and glass transition properties of ultrathin polystyrene films by dewetting from liquid glycerol, Macromolecules, 46, 2485–2495 (2013).
- (26) D. Christie, C. Zhang, J. Fu, B. Koel, and R. D. Priestley, Glass transition temperature of colloidal polystyrene dispersed in various liquids, J. Poly. Sci. B, 54, 1776–1783 (2016).
- (27) K. V. Edmond, C. R. Nugent, and E. R. Weeks, Influence of confinement on dynamical heterogeneities in dense colloidal samples, Phys. Rev. E, 85, 041401 (2012).
- (28) G. L. Hunter, K. V. Edmond, and E. R. Weeks, Boundary mobility controls glassiness in confined colloidal liquids, Phys. Rev. Lett., 112, 218302 (2014).
- (29) R. R. Baglay and C. B. Roth, Local glass transition temperature of polystyrene next to different polymers: Hard vs. soft confinement, J. Chem. Phys., 146, 203307 (2017).
- (30) P. Scheidler, W. Kob, and K. Binder, The relaxation dynamics of a supercooled liquid confined by rough walls, J. Phys. Chem. B, 108, 6673–6686 (2004).
- (31) P. Z. Hanakata, B. A. Pazmiño Betancourt, J. F. Douglas, and F. W. Starr, A unifying framework to quantify the effects of substrate interactions, stiffness, and roughness on the dynamics of thin supported polymer films, J. Chem. Phys., 142, 234907 (2015).
- (32) T. Davris and A. V. Lyulin, A coarse-grained molecular dynamics study of segmental structure and mobility in capped crosslinked copolymer films, J. Chem. Phys., 143, 074906 (2015).
- (33) F. Varnik and K. Binder, Shear viscosity of a supercooled polymer melt via nonequilibrium molecular dynamics simulations, J. Chem. Phys., 117, 6336–6349 (2002).
- (34) F. Varnik, J. Baschnagel, and K. Binder, Static and dynamic properties of supercooled thin polymer films, Euro. Phys. J. E, 8, 175–192 (2002).
- (35) F. Varnik, J. Baschnagel, and K. Binder, Reduction of the glass transition temperature in polymer films: A molecular-dynamics study, Phys. Rev. E, 65, 021507 (2002).
- (36) S. Peter, H. Meyer, and J. Baschnagel, Thickness-dependent reduction of the glass-transition temperature in thin polymer films with a free surface, J. Poly. Sci. B: Polymer Physics, 44, 2951–2967 (2006).
- (37) P. Z. Hanakata, J. F. Douglas, and F. W. Starr, Local variation of fragility and glass transition temperature of ultra-thin supported polymer films, J. Chem. Phys., 137, 244901 (2012).
- (38) G. D. Smith, D. Bedrov, and O. Borodin, Structural relaxation and dynamic heterogeneity in a polymer melt at attractive surfaces, Phys. Rev. Lett., 90, 226103 (2003).
- (39) T. Fehr and H. Löwen, Glass transition in confined geometry, Phys. Rev. E, 52, 4016–4025 (1995).
- (40) G. Biroli, J. P. Bouchaud, A. Cavagna, T. S. Grigera, and P. Verrocchio, Thermodynamic signature of growing amorphous order in glass-forming liquids, Nat. Phys., 4, 771–775 (2008).
- (41) Y.-W. Li, W.-S. Xu, and Z.-Y. Sun, Growing point-to-set length scales in Lennard-Jones glass-forming liquids, J. Chem. Phys., 140, 124502 (2014).
- (42) G. M. Hocky, L. Berthier, W. Kob, and D. R. Reichman, Crossovers in the dynamics of supercooled liquids probed by an amorphous wall, Phys. Rev. E, 89, 052311 (2014).
- (43) K. Hima Nagamanasa, S. Gokhale, A. K. Sood, and R. Ganapathy, Direct measurements of growing amorphous order and non-monotonic dynamic correlations in a colloidal glass-former, Nature Phys., 11, 403–408 (2015).
- (44) D. Hudzinskyy, A. V. Lyulin, A. R. C. Baljon, N. K. Balabaev, and M. A. J. Michels, Effects of strong confinement on the glass-transition temperature in simulated atactic polystyrene films, Macromolecules, 44, 2299–2310 (2011).
- (45) P. Gin, N. Jiang, C. Liang, T. Taniguchi, B. Akgun, S. K. Satija, M. K. Endoh, and T. Koga, Revealed architectures of adsorbed polymer chains at solid-polymer melt interfaces, Phys. Rev. Lett., 109, 265501 (2012).
- (46) M. Sen, N. Jiang, J. Cheung, M. K. Endoh, T. Koga, D. Kawaguchi, and K. Tanaka, Flattening process of polymer chains irreversibly adsorbed on a solid, ACS Macro Lett., 5, 504–508 (2016).
- (47) S. Napolitano, S. Capponi, and B. Vanroy, Glassy dynamics of soft matter under 1D confinement: How irreversible adsorption affects molecular packing, mobility gradients and orientational polarization in thin films, Euro. Phys. J. E, 36, 1–37 (2013).
- (48) K. S. Gautam, A. D. Schwab, A. Dhinojwala, D. Zhang, S. M. Dougal, and M. S. Yeganeh, Molecular structure of polystyrene at air/polymer and solid/polymer interfaces, Phys. Rev. Lett., 85, 3854–3857 (2000).
- (49) X. Huang and C. B. Roth, Changes in the temperature-dependent specific volume of supported polystyrene films with film thickness, J. Chem. Phys., 144, 234903 (2016).
- (50) Z. T. Németh and H. Löwen, Freezing and glass transition of hard spheres in cavities, Phys. Rev. E, 59, 6824–6829 (1999).
- (51) L. C. E. Struik, Physical aging in plastics and other glassy materials, Polym. Eng. Sci., 17, 165–173 (1977).
- (52) W. van Megen, T. C. Mortensen, S. R. Williams, and J. Müller, Measurement of the self-intermediate scattering function of suspensions of hard spherical particles near the glass transition, Phys. Rev. E, 58, 6073–6085 (1998).
- (53) R. D. Priestley, Physical aging of confined glasses, Soft Matter, 5, 919–926 (2009).
- (54) P. Ramírez-González and M. Medina-Noyola, Aging of a homogeneously quenched colloidal glass-forming liquid, Phys. Rev. E, 82, 061504 (2010).
- (55) M. R. Tant and G. L. Wilkes, An overview of the nonequilibrium behavior of polymer glasses, Polym. Eng. Sci., 21, 874–895 (1981).
- (56) Y. Huang and D. R. Paul, Physical aging of thin glassy polymer films monitored by gas permeability, Polymer, 45, 8377–8393 (2004).
- (57) J. B. Knight, C. G. Fandrich, C. N. Lau, H. M. Jaeger, and S. R. Nagel, Density relaxation in a vibrated granular material, Phys. Rev. E, 51, 3957–3963 (1995).
- (58) P. Richard, M. Nicodemi, R. Delannay, P. Ribiere, and D. Bideau, Slow relaxation and compaction of granular systems, Nat. Mater., 4, 121–128 (2005).
- (59) D. El Masri, M. Pierno, L. Berthier, and L. Cipelletti, Ageing and ultra-slow equilibration in concentrated colloidal hard spheres, J. Phys.: Condens. Matter, 17, S3543–S3549 (2005).
- (60) V. A. Martinez, G. Bryant, and W. van Megen, Slow dynamics and aging of a colloidal hard sphere glass, Phys. Rev. Lett., 101, 135702 (2008).
- (61) L. Cipelletti and L. Ramos, Slow dynamics in glasses, gels and foams, Curr. Op. Coll. Int. Sci., 7, 228–234 (2002).
- (62) R. E. Courtland and E. R. Weeks, Direct visualization of ageing in colloidal glasses, J. Phys.: Condens. Matter, 15, S359–S365 (2003).
- (63) J. M. Lynch, G. C. Cianci, and E. R. Weeks, Dynamics and structure of an aging binary colloidal glass, Phys. Rev. E, 78, 031410 (2008).
- (64) R. Bandyopadhyay, D. Liang, H. Yardimci, D. A. Sessoms, M. A. Borthwick, S. G. J. Mochrie, J. L. Harden, and R. L. Leheny, Evolution of particle-scale dynamics in an aging clay suspension, Phys. Rev. Lett., 93, 228302 (2004).
- (65) G. B. McKenna, T. Narita, and F. Lequeux, Soft colloidal matter: A phenomenological comparison of the aging and mechanical responses with those of molecular glasses, J. Rheo., 53, 489–516 (2009).
- (66) X. Di, K. Z. Win, G. B. McKenna, T. Narita, F. Lequeux, S. R. Pullela, and Z. Cheng, Signatures of structural recovery in colloidal glasses, Phys. Rev. Lett., 106, 095701 (2011).
- (67) P. Yunker, Z. Zhang, K. Aptowicz, and A. Yodh, Irreversible rearrangements, correlated domains, and local structure in aging glasses, Phys. Rev. Lett., 103, 115701 (2009).
- (68) L. Antl, J. W. Goodwin, R. D. Hill, R. H. Ottewill, S. M. Owens, S. Papworth, and J. A. Waters, The preparation of poly(methyl methacrylate) latices in non-aqueous media, Colloid Surf., 17, 67–78 (1986).
- (69) P. N. Pusey and W. van Megen, Phase behaviour of concentrated suspensions of nearly hard colloidal spheres, Nature, 320, 340–342 (1986).
- (70) A. D. Dinsmore, E. R. Weeks, V. Prasad, A. C. Levitt, and D. A. Weitz, Three-dimensional confocal microscopy of colloids, App. Optics, 40, 4152–4159 (2001).
- (71) T. Narumi, S. V. Franklin, K. W. Desmond, M. Tokuyama, and E. R. Weeks, Spatial and temporal dynamical heterogeneities approaching the binary colloidal glass transition, Soft Matter, 7, 1472–1482 (2011).
- (72) J. C. Crocker and D. G. Grier, Methods of digital video microscopy for colloidal studies, J. Colloid Interface Sci., 179, 298–310 (1996).
- (73) G. B. McKenna, Mechanical rejuvenation in polymer glasses: fact or fallacy?, J. Phys.: Condens. Matter, 15, S737–S763 (2003).
- (74) K. W. Desmond and E. R. Weeks, Influence of particle size distribution on random close packing of spheres, Phys. Rev. E, 90, 022204 (2014).
- (75) V. A. Martinez, G. Bryant, and W. van Megen, Aging dynamics of colloidal hard sphere glasses, J. Chem. Phys., 133, 114906 (2010).
- (76) J. W. Landry, G. S. Grest, L. E. Silbert, and S. J. Plimpton, Confined granular packings: Structure, stress, and forces, Phys. Rev. E, 67, 041303 (2003).
- (77) R. Kjellander and S. Sarman, Pair correlations of non-uniform hard-sphere fluids in narrow slits and the mechanism of oscillatory solvation forces, J. Chem. Soc. Faraday Trans., 87, 1869–1881 (1991).
- (78) J. Mittal, T. M. Truskett, J. R. Errington, and G. Hummer, Layering and position-dependent diffusive dynamics of confined fluids, Phys. Rev. Lett., 100, 145901 (2008).
- (79) W. C. K. Poon, E. R. Weeks, and C. P. Royall, On measuring colloidal volume fractions, Soft Matter, 8, 21–30 (2012).