Electrically-induced polarization selection rules of a graphene quantum dot
Abstract
We study theoretically the single-electron triangular zigzag graphene quantum dot in uniform in-plane electric fields. The far-infrared absorption spectra of the dot are calculated by the tight-binding method. The energy spectra and the distribution of wave functions are also presented to analyse the far-infrared spectra. The orthogonal zero-energy eigenstates are arranged along to the direction of the external field. The remarkable result is that all intraband transitions and some interband transitions are forbidden when the absorbed light is polarized along the direction of the electric field. With -direction electric field, all intraband absorption is polarized due to the electric-field-direction-polarization selection rule. Moreover, with -direction electric field, all absorption is either or polarized due to the parity selection rule as well as to the electric-field-direction-polarization selection rule. Our calculation shows that the formation of the FIR spectra is co-decided by the polarization selection rules and the overlap between the eigenstates of the transition.
I Introduction
Graphene, a single layer of carbon atoms arranged in a two-dimensional honeycomb lattice, was first successfully fabricated in 2004Novoselov et al. (2004). Due to the exceptional properties, graphene has attracted enormous research interest and exhibited great application potential in next-generation electronicsNovoselov et al. (2012) and optoelectronicsXia et al. (2014). Much of the current understanding of the electronic properties of graphene has been reviewed by Castro-NetoNeto et al. (2009), transport properties by Das SarmaSarma et al. (2011) and many-body effects by KotovKotov et al. (2012). However, a gap has to be induced in the gapless graphene for its real applications in electronic devices. For this purpose, graphene quantum dots (GQDs) have been proposed as one of the most promising kinds of graphene nanostructuresGüçlü et al. (2014). GQDs exhibit the unique electronic, spin and optical properties, which allow them hold great application potential in electronics and optoelectronics such as super capacitorLiu et al. (2013), flash memoryJoo et al. (2014), photodetectorKim et al. (2014) and phototransistorKonstantatos et al. (2012). On the other hand, with recent developments of fabrication techniques, it is possible to cut accurately the bulk graphene into different sizes and shapes, such as hexagonal zigzag quantum dots, hexagonal armchair quantum dots, triangular zigzag quantum dots and triangular armchair quantum dotsBacon et al. (2014).
Further applications of GQDs require a thorough knowledge of their electronic properties. The electronic and magnetic properties of GQDs depend strongly on their shapes and edgesGüclü et al. (2009); Abergel et al. (2010a); Potasz et al. (2012); Jiang et al. (2017a). Moreover, for zigzag GQDs, especially triangular GQDs (TGQDs), there appears a shell of degenerate states at the Dirac points and the degeneracy is proportional to the edge sizePotasz et al. (2010); Liang et al. (2014). The electronic states of TGQDs can be classified by the group theory according to irreducible representations of the symmetry groupGüçlü et al. (2014). As a result of the degenerate zero-energy band, magnetism arising in graphene nanostructures (nanoflakes, quantum dots and nanoribbons) has recently collected rich literatureSun et al. (2017); Basak and Shukla (2016); Hawrylak et al. (2016). The key feature for device application of GQDs is the ability to manipulate their electronic structures. Therefore, one of the flourishing fields of exploration is the influence of external fields on the degenerate zero-energy band. The electronic structure and magnetization relating to the zero-energy band can be manipulated electricallyChen et al. (2010); Ma and Li (2012a); Dong (2013); Farghadan and Saffarzadeh (2014); Dong (2014); Szałowski (2017), opticallyGüclü and Hawrylak (2013) and magneticallySzałowski (2015). Moreover, the effect of an external magnetic field on electron-hole interactions in GQDs has been explored.Li et al. (2017). In particular, the electrical manipulation of the zero-energy band of such GQDs is quite important for the operation of related devices, since it is easier to generate the potential field through local gate electrodes than the optical or magnetic field. The advantage of applying external electric fields is that these fields can adjust the splitting of the degenerate zero-energy band and then can adjust the optical transition wavelength. However, it is rather rare to study the influence of electric fields on the optical properties relating to the zero-energy bandAbdelsalam et al. (2016); Dong and Liu (2017).
In this paper, we concentrate on the effects of two uniform in-plane electric fields on the far-infrared (FIR) absorption spectra of a TGQD. The energy spectra and the distribution of wave functions are also presented to analyse the FIR spectra. The remarkable result is that all intraband transitions and some interband transitions are forbidden when the absorbed light is polarized along the direction of the electric field. Our calculations show that the formation of the FIR spectra is co-decided by the polarization selection rule and the overlap between the eigenstates of the transition.
II The electric fields and the energy spectra

In Fig. 1, two typical in-plane uniform electric fields are applied respectively to a TGQD with the size = 8, where is the number of carbon atoms in each side of the dot. Each electric field is generated by two parallel gate electrodes with opposite electrostatic potentials . In Fig. 1(a), the direction of the electric field is along the axis, and the electrostatic potentials of the left and right half of the dot have opposite signs. In Fig. 1(b), the direction of the electric field is along the axis, and the electrostatic potentials of the left and right half of the dot have same signs. From the point of view of symmetry, the electric field destroys the mirror symmetry of the system, where the plane of symmetry is the vertical plane containing the perpendicular bisector along the axis. Unlike , the electric field retains the mirror symmetry. Later it will be seen that this difference in symmetry has important consequences for the FIR spectra.
The low-energy electronic structure of a GQD subjected to an in-plane electric field can be calculated by means of the tight-binding methodChen et al. (2010); Liang et al. (2014). In the low-energy range, the tight-binding Hamiltonian with the nearest-neighbor approximation proves to give the same accuracy as first-principle calculationsAbergel et al. (2010b). The Hamiltonian equation of the system is and the tight-binding Hamiltonian with the nearest-neighbor approximation isMa and Li (2012b); Jiang et al. (2017b)
| (1) |
where , denote the sites of carbon atoms in graphene, is the on-site energy of the site , is the electrostatic potential of the site obtained by solving a Laplace equation, is the hopping energy and () is the creation (annihilation) operator of an electron at the site . The summation is taken over all nearest neighboring sites. Due to the homogeneous geometrical configuration, the on-site energy and the hopping energy may be taken as = 0 and = 2.7 eV.
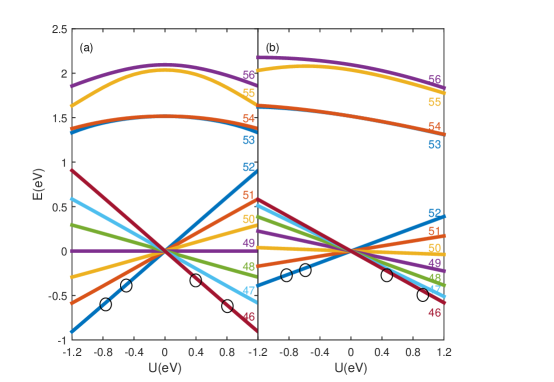
Fig. 2 shows the single-electron energy spectra of the TGQD ( = 8) with and . With , the energy spectrum for is bilaterally symmetrical because the TGQD is bilaterally symmetrical. With , the energy spectrum for is bilaterally asymmetrical because the TGQD is not up-down symmetrical. The TGQD contains atoms and thus there are eigenstates . For the study of the single-electron FIR spectra, it is enough that we consider only levels around the Fermi level. Seven of these eigenstates (eigenstate index: 46-52) are belong to the zero-energy band. The other four eigenstates (eigenstate index: 53-56) possess higher energy. In Fig. 2, the ground-state level of the transition is indicated. According to the ground-state level and the chemical potential of the leads, one can guarantee that there exists only one electron in the dot.Dong and Liu (2017)
We also give the distribution of wave functions, which is helpful to discuss the calculated FIR spectra later. A wave function is represented as
| (2) |
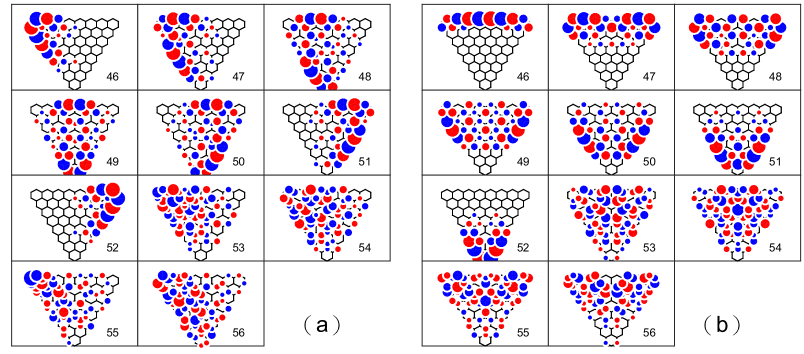
where is the Wannier function localized at the site and is the amplitude for . The operator in the Hamiltonian (1) annihilates an electron in the state described by the Wannier function . We are able to calculate the amplitude for and all of them are found to be real. Fig. 3 shows the distribution of the wave functions with and , respectively.
The eigenstates of the zero-energy band are almost constant with while the eigenstates of the nonzero-energy band are mixed continuously with Dong (2014). With , the orthogonal zero-energy states (46-52) are arranged from left to right in the dot. With , the orthogonal zero-energy states (46-52) are arranged from top to bottom in the dot and all eigenstates are symmetrical or antisymmetrical due to the mirror symmetry.
III The unpolarized FIR spectra
Using the Fermi golden rule with the electric-dipole approximation for the perturbing unpolarized light, the transition probability from the ground state to the th excited state can be calculated asDong et al. (2007); Abdelsalam et al. (2016)
| (3) |
is the ground state of the zero band and the corresponding level is indicated in Fig. 2.
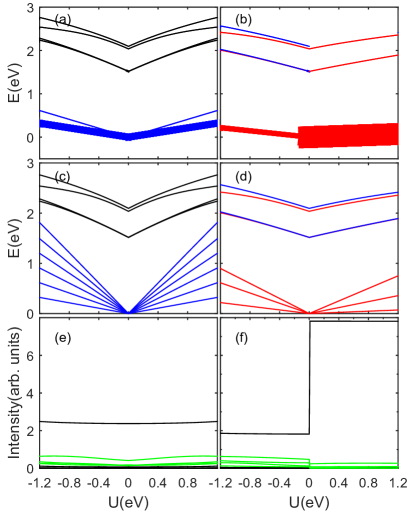
Fig. 4 shows the calculated FIR spectra of the single-electron TGQD ( = 8) with and respectively. In Fig. 4(a-b), we have included only the transitions which have a peak intensity of more than 1% of the maximum value. By excluding those absorption peaks with a relatively low intensity, the FIR spectra tend to simulate experimental observation and thus are more practical. In Fig. 4(c-d), we have included all peaks with a nonzero intensity, which helps to identify whether the selection rule exists. Thus, Fig. 4(c-d) can been regarded as the fine structure of the FIR spectra. To make a distinction, we call Fig. 4(a-b) as the practical FIR spectra and call Fig. 4(c-d) as the fine FIR spectra. To show exactly the difference among the peak intensities, we have plotted them with and in Fig. 4(e-f). As a general feature of the calculated spectra shown in Fig. 4(a-d), one can see that each spectrum has two branches as a major component, where the higher one comes from the interband transitions and the lower from the intraband transitions.
Now we discuss the effect of on the FIR spectra. In the Fig. 4(a), (c) and (e), the FIR spectra are bilaterally symmetrical because the energy spectrum with is bilaterally symmetrical, although the ground eigenstate of the transition on is different from that on . For example, the ground state is the eigenstate on and the eigenstate on . The practical FIR spectrum in Fig. 4(a) shows that two intraband peaks appear while the other intraband peaks disappear. However, the fine FIR spectrum in Fig. 4(c) shows that there are not real forbidden transitions. Fig. 4(e) shows that the intensity of the second intraband peak is about 5% of the intensity of the strongest intraband peak. Four interband peaks possess higher intensity than the second intraband peak. Both the evolution from Fig. 4(c) to Fig. 4(a) and the difference among the peak intensities can be explained by the overlap between the initial and final eigenstate of the transition [Fig. 3(a)]. For example, at eV, the initial eigenstate is located in the left-top part of the dot. Comparing with the initial eigenstate , the final eigenstate is moved slightly toward the right while the final eigenstate is moved further toward the right. As the final eigenstate changes from the eigenstate to the eigenstate , the overlap between the initial and final eigenstate becomes smaller and smaller. When the final eigenstate is the eigenstate , the absorption peak disappears in the practical FIR spectra.
In the following, we discuss the effect of on the FIR spectra. In Fig. 4(b), (d) and (f), the FIR spectra are not bilaterally symmetrical because the energy spectrum with is not bilaterally symmetrical. The fine FIR spectrum in Fig. 4(d) shows that there are only three intraband peaks, which implies that there exist real forbidden transitions. The selection rule will be detailedly discussed later. In the practical FIR spectra [Fig. 4(b)], there appears only one intraband peak and the peak intensity on is much higher than the peak intensity on . Moreover, there are two interband peaks on and four interband peaks on . Both the evolution from Fig. 4(d) to Fig. 4(b) and the difference among the peak intensities can be explained by the overlap between the initial and final eigenstate of the transition [Fig. 3(b)].
The formation of the practical FIR spectra is closely related to the overlap between the initial and final eigenstate. In the next section, it can be shown that polarization selective rules also affect the formation of the practical FIR spectra.
IV The polarized spectra with -direction electric field
The analysis of polarized spectra is helpful to understand the formation of the FIR spectra in more detail. One selected spectrum can be decomposed to and polarization,
| (4) |
According to the irreducible theory of the symmetry groupElliott and Dawber (1979), symmetry leads to selection rules or forbidden transitions. To a certain system, the transition probability for the polarized light or is a component of . Thus, the polarization may cause the decrease of the transition probabilities. Moreover, the and polarization may cause forbidden transitions due to the symmetry in or direction. In the section, we analyze the formation of the polarized practical FIR spectra with . With , the - and -polarized practical FIR spectrum are shown in Fig. 5(a) and (b), respectively. With , the - and -polarized fine FIR spectrum are shown in Fig. 5(e) and (f), respectively.
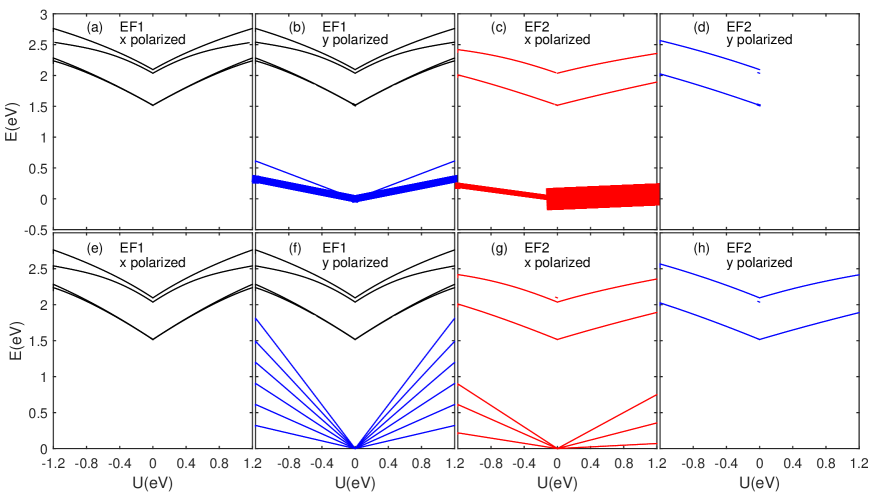
Although there are not forbidden transitions in the unpolarized spectrum [Fig. 4(c)], the intraband transitions are forbidden in the -polarized fine FIR spectrum [Fig. 5(e)]. Transition selection rules relating to electrical dipole radiation are usually classified into two categories: parity selection rules and angular momentum selection rules. Obviously, Fig. 3 suggests that the polarization selection rule shown by the -polarized fine FIR spectrum is not belong to the two categories. The direction of the electric field is along the axis. That is to say, all intraband transitions are forbidden when the absorbed light is polarized along the direction of the electric field. Thus, in the practical FIR spectrum [Fig. 5(a)], the intraband absorption peaks disappear due to the electric-field-direction-polarization selection rule.
Fig. 5(f) shows that there are not forbidden transitions in the -polarized fine FIR spectrum. Meanwhile, four intraband absorption peaks disappear in the -polarized practical FIR spectrum [Fig. 5(b)]. Thus, in the evolution from Fig. 5(f) to Fig. 5(b), the reason why four intraband absorption peaks disappear is too little overlap between the initial and final eigenstate of the transition.
V The polarized spectra with -direction electric field
In the section, we analyze the formation of the practical polarized FIR spectra with . With , the - and -polarized practical FIR spectrum are shown in Fig. 5(c) and (d), respectively. With , the - and -polarized fine FIR spectrum are shown in Fig. 5(g) and (h), respectively.
In the -polarized fine FIR spectrum [Fig. 5(g)], half of the transitions are forbidden due to a parity selection rule. For example, the transition from the eigenstate to the eigenstate is forbidden for they are all antisymmetrical in the direction. Thus, there are only three intraband peaks and two interband peaks in Fig. 5(g). Moreover, in the evolution from Fig. 5(g) to Fig. 5(c), two intraband peaks disappear due to too little overlap between the eigenstates [Fig. 3(b)].
In the -polarized fine FIR spectrum [Fig. 5(h)], the intraband transitions are forbidden. Moreover, Fig. 5(h) shows that two interband peaks in Fig. 5(g) are also forbidden. In other words, all intraband transitions and some interband transitions are forbidden when the absorbed light is polarized along the direction of the electric field, which is similar to the finding in the previous section. In the evolution from Fig. 5(h) to Fig. 5(d), interband absorption disappears on due to too little overlap between the eigenstates.
Fig. 4(d) can be regarded as the combination of Fig. 5(g) and (h). Fig. 4(b) can be regarded as the combination of Fig. 5(c) and (d). Thus, with , all intraband transitions are polarized and all interband transitions are either polarized or polarized in the unpolarized FIR [Fig. 4(b) and (d)]. These polarized transitions are related to the parity selection rule as well as to the electric-field-direction-polarization selection rule.
VI Summary
In this paper, we have investigated the effects of - and -direction in-plane uniform electric fields on the FIR spectra of a single-electron triangular zigzag graphene quantum dot. We have presented the energy spectra and the distribution of wave functions to analyse the FIR spectra. The orthogonal zero-energy eigenstates are arranged along to the direction of the external field. The remarkable result is that all intraband transitions and some interband transitions are forbidden when the absorbed light is polarized along the direction of the electric field. With -direction electric field, all intraband absorption is polarized due to the electric-field-direction-polarization selection rule. Moreover, with -direction electric field, all absorption is either or polarized due to the parity selection rule as well as to the electric-field-direction-polarization selection rule. Our calculation shows that the formation of the FIR spectra is co-decided by the polarization selection rule and the overlap between the eigenstates. These findings suggest that special attention should be paid to the property of polarization when designing TGQD optoelectronic devices. Our findings may be useful for the application of GQDs to electronic and optoelectronic devices.
Acknowledgements
This work is supported by the National Natural Science Foundation of China (Grant Nos. 11604183 and 11674197), and a Project of Shandong Province Higher Educational Science and Technology Program (Grant No. J16LJ09).
References
- Novoselov et al. (2004) K. S. Novoselov, A. K. Geim, S. V. Morozov, D. Jiang, Y. Zhang, S. V. Dubonos, I. V. Grigorieva, and A. A. Firsov, Science 306, 666 (2004).
- Novoselov et al. (2012) K. S. Novoselov, V. I. Fal’ko, L. Colombo, P. R. Gellert, M. G. Schwab, and K. Kim, Nature 490, 192 (2012).
- Xia et al. (2014) F. Xia, H. Wang, D. Xiao, M. Dubey, and A. Ramasubramaniam, Nat. Photonics 8, 899 (2014).
- Neto et al. (2009) A. C. Neto, F. Guinea, N. M. Peres, K. S. Novoselov, and A. K. Geim, Reviews of modern physics 81, 109 (2009).
- Sarma et al. (2011) S. D. Sarma, S. Adam, E. Hwang, and E. Rossi, Reviews of Modern Physics 83, 407 (2011).
- Kotov et al. (2012) V. N. Kotov, B. Uchoa, V. M. Pereira, F. Guinea, and A. C. Neto, Reviews of Modern Physics 84, 1067 (2012).
- Güçlü et al. (2014) A. D. Güçlü, P. Potasz, M. Korkusinski, and P. Hawrylak, Graphene quantum dots (Springer, 2014).
- Liu et al. (2013) W.-W. Liu, Y.-Q. Feng, X.-B. Yan, J.-T. Chen, and Q.-J. Xue, Advanced Functional Materials 23, 4111 (2013).
- Joo et al. (2014) S. S. Joo, J. Kim, S. S. Kang, S. Kim, S.-H. Choi, and S. W. Hwang, Nanotechnology 25, 255203 (2014).
- Kim et al. (2014) C. O. Kim, S. W. Hwang, S. Kim, D. H. Shin, S. S. Kang, J. M. Kim, C. W. Jang, J. H. Kim, K. W. Lee, S.-H. Choi, et al., Scientific reports 4, 5603 (2014).
- Konstantatos et al. (2012) G. Konstantatos, M. Badioli, L. Gaudreau, J. Osmond, M. Bernechea, F. P. G. De Arquer, F. Gatti, and F. H. Koppens, Nature nanotechnology 7, 363 (2012).
- Bacon et al. (2014) M. Bacon, S. J. Bradley, and T. Nann, Particle & Particle Systems Characterization 31, 415 (2014).
- Güclü et al. (2009) A. D. Güclü, P. Potasz, O. Voznyy, M. Korkusinski, and P. Hawrylak, Phys. Rev. Lett. 103, 246805 (2009).
- Abergel et al. (2010a) D. Abergel, V. Apalkov, J. Berashevich, K. Ziegler, and T. Chakraborty, Advances in Physics 59, 261 (2010a).
- Potasz et al. (2012) P. Potasz, A. D. Güclü, A.Wójs, and P. Hawrylak, Phys. Rev. B 85, 075431 (2012).
- Jiang et al. (2017a) Z. T. Jiang, S. Li, Z. T. Lv, and X. D. Zhang, AIP Advances 7, 045122 (2017a).
- Potasz et al. (2010) P. Potasz, A. D. Güçlü, and P. Hawrylak, Physical review. B 81, 033403 (2010).
- Liang et al. (2014) F. X. Liang, Z. T. Jiang, Z. T. Lv, H. Y. Zhang, and S. Li, Journal of Applied Physics 116, 123706 (2014).
- Sun et al. (2017) Y. Sun, Y. Zheng, H. Pan, J. Chen, W. Zhang, L. Fu, K. Zhang, N. Tang, and Y. Du, npj Quantum Materials 2, 5 (2017).
- Basak and Shukla (2016) T. Basak and A. Shukla, Physical Review B 93, 235432 (2016).
- Hawrylak et al. (2016) P. Hawrylak, F. Peeters, and K. Ensslin, physica status solidi (RRL)-Rapid Research Letters 10, 11 (2016).
- Chen et al. (2010) R. B. Chen, C. P. Chang, and M. F. Lin, Physica E 42, 2812 (2010).
- Ma and Li (2012a) W. L. Ma and S. S. Li, Phys. Rev. B 86, 045449 (2012a).
- Dong (2013) Q. R. Dong, J. Appl. Phys. 113, 234304 (2013).
- Farghadan and Saffarzadeh (2014) R. Farghadan and A. Saffarzadeh, Journal of Applied Physics 115, 174310 (2014).
- Dong (2014) Q.-R. Dong, RSC Advances 4, 12287 (2014).
- Szałowski (2017) K. Szałowski, Carbon 118, 78 (2017).
- Güclü and Hawrylak (2013) A. D. Güclü and P. Hawrylak, Phys. Rev. B 87, 035425 (2013).
- Szałowski (2015) K. Szałowski, Journal of Magnetism and Magnetic Materials 382, 318 (2015).
- Li et al. (2017) L. L. Li, M. Zarenia, W. Xu, H. M. Dong, and F. M. Peeters, Physical Review B 95, 045409 (2017).
- Abdelsalam et al. (2016) H. Abdelsalam, M. Talaat, I. Lukyanchuk, M. Portnoi, and V. Saroka, Journal of Applied Physics 120, 014304 (2016).
- Dong and Liu (2017) Q.-R. Dong and C.-X. Liu, RSC Advances 7, 22771 (2017).
- Abergel et al. (2010b) D. S. L. Abergel, V. Apalkov, J. Berashevich, K. Ziegler, and T. Chakraborty, Adv. Phys. 59, 261 (2010b).
- Ma and Li (2012b) W. L. Ma and S. S. Li, Appl. Phys. Lett. 100, 163109 (2012b).
- Jiang et al. (2017b) Z. T. Jiang, F. X. Liang, and X. D. Zhang, Physics Letters A 381, 373 (2017b).
- Dong et al. (2007) Q.-R. Dong, C.-X. Liu, S.-Y. Teng, N.-Y. Zhang, and C.-F. Cheng, Journal of Physics D: Applied Physics 40, 730 (2007).
- Elliott and Dawber (1979) J. Elliott and P. Dawber, Symmetry in Physics, Volume 1 and 2 (Macmillan, 1979).