Extreme THz fields from two-color filamentation of mid-infrared laser pulses
Abstract
Nonlinear THz photonics is probably the last frontier of nonlinear optics. The strength of both the electric and the magnetic fields of these ultrashort low frequency light bunches opens the way to exciting science and applications. Progress in the field though is slow because of the deficiency in suitable sources. Here we show that two-color filamentation of mid-infrared 3.9 m laser pulses allows one to generate single cycle THz pulses with multi-millijoule energies and extreme conversion efficiencies. Moreover, the focused THz peak electric and magnetic fields reach values of GV/cm and kT, respectively, exceeding by far any available quasi-DC field source today. These fields enable extreme field science, including into other, relativistic phenomena. Besides, we elucidate the origin of this high efficiency, which is made up of several factors, including a novel mechanism where the harmonics produced by the mid-infrared pulses strongly contribute to the field symmetry breaking and enhance the THz generation.
Introduction.—The terahertz (THz) frequency range (0.1-10 THz) is a part of the electromagnetic spectrum located at the junction between the microwave and optical frequencies. For many reasons THz frequencies attract a lot of interest in recent years Zhang et al. (2017); Tonouchi (2007). Since structural absorption resonances of many molecules belong to the THz frequency band, THz spectroscopy becomes a unique tool for matter studies. Moreover, THz frequencies lie at the boundary of frequency ranges that are characteristic for high-frequency electronics and photonics. Therefore, THz devices are expected to be a connecting link between these technologies. In addition, THz radiation penetrates through a variety of non-conducting materials like clothing, paper, wood, masonry, plastic and ceramics. But unlike X-rays, THz radiation is not an ionizing radiation and does not damage test materials, which opens great opportunities for its application in industrial quality control, homeland security, or medical diagnostics and treatment.
Although the THz frequency range has very rich scientific and technological potential, it remains underexplored due to lack of intense THz sources and sensitive THz detectors. The progressive appearance of suitable bright THz sources opens a new era for studies of extreme THz field-matter interactions, nonlinear THz spectroscopy and imaging. To date, there are two major techniques for the generation of intense THz pulses on tabletop setups Lewis (2014); Reimann (2007): optical rectification in nonlinear crystals Huang et al. (2014); Vicario et al. (2014); Shalaby and Hauri (2015) and two-color filamentation (photoionization of gases by dual-frequency laser fields) Kim et al. (2008); Oh et al. (2014); Kuk et al. (2016). Optical rectification has THz conversion efficiencies (ratio of generated THz energy to energy of input laser pulse) that can reach 3.7% Huang et al. (2014). Nevertheless, the spectral bandwidth of these sources is limited to frequencies below 5 THz and the generated THz pulses energies are also limited, because of the damage threshold of the crystals, with the highest energy reported to date reaching 0.9 mJ Vicario et al. (2014). In turn, two-color filamentation presents lower THz conversion efficiencies (0.01%) and produces less intense THz pulses with energies up to 30 J Kim et al. (2008); Oh et al. (2014); Kuk et al. (2016). However, THz pulses generated by two-color filamentation have much larger spectral bandwidths ( THz) and can be generated at remote distances Wang et al. (2010, 2011a); Daigle et al. (2012), which allows to overcome a number of THz propagation issues, such as high absorption in atmospheric water vapor and diffraction.
Up to date, most experiments on two-color filamentation were conducted using Titanium:Sapphire (Ti:Sa) laser sources with central wavelength around 0.8 m and their second harmonic. A study using longer wavelengths, in the near infrared, showed an enhancement of the THz conversion efficiency with increasing pump wavelength but only up to 1.8 m, while beyond this point the efficiency dropped again Clerici et al. (2013). Also, a theoretical study showed stronger THz generation compared to 0.8 m using single color mid-infrared pulses with Particle in Cell (PIC) simulations, not considering though nonlinear propagation effects Wang et al. (2011b). Recently though, filamentation of mid-infrared (mid-IR) laser pulses with 3.9 m central wavelength was for the first time demonstrated experimentally Mitrofanov et al. (2015). The subsequent experimental and theoretical studies revealed that compared to 0.8 m laser pulses, filaments produced by 3.9 m are longer with wider plasma channels and the generated supercontinuum is extremely broad ranging up to harmonics of 15th order Panagiotopoulos et al. (2015); Mitrofanov et al. (2015, 2016a, 2016b); Panagiotopoulos et al. (2016); Panov et al. (2016).
In this work we study numerically the generation of THz radiation by two-color filamentation of 3.9 m laser pulses. We show that compared to 0.8 m pulses, the THz conversion efficiency in mid-IR filaments is two orders of magnitude higher, the energy of the generated THz pulses reaches the multi-millijoule level, and the strength of the THz fields can reach the GV/cm range. Thus, two-color filamentation of mid-IR laser pulses emerges as the ultimate source for extreme THz science since it allows one to generate THz radiation with unprecedented efficiency and extremely high energy that largely overcomes all other approaches while energy scaling does not suffer from undesired effects like damage of crystals in the optical rectification.
Model.—To simulate the two-color filamentation of mid-IR laser pulses in air we use the Unidirectional Pulse Propagation Equation (UPPE) Kolesik et al. (2002); Kolesik and Moloney (2004) coupled with the kinetic equation for plasma concentration Couairon et al. (2011) (see the Supplemental Material Sup ). This model takes into account nonparaxial propagation of polychromatic fields without any kind of envelope approximations. It includes dispersion of all orders, cubic Kerr nonlinearity, defocusing in plasma, inverse Bremsstrahlung, photoionization with corresponding energy losses, and avalanche ionization. We use a realistic dispersion model of dry atmospheric air (zero relative humidity) that takes into account spectral lines of , , and gases from the HITRAN database HIT .
Our initial condition for the UPPE equation is the following two-color field :
where , mm is the beam size (4 mm FWHM), fs is the pulse duration (100 fs FWHM), is the central frequency, while and being the amplitudes of the fundamental and second harmonic pulses, respectively. The initial pulse is focused by a lens with a focal distance mm. To simulate the focusing we multiplied each Fourier harmonic of the field by a factor , where is the frequency of the corresponding harmonic and is the speed of light in vacuum. In our simulations the central wavelength of the fundamental pulse is equal to 3.9 m. Also, in order to have a reference for comparison we simulated two-color filamentation of the same laser pulse but with m. The energy of the initial two-color pulse is equal to 29 mJ for =3.9 m and 1.23 mJ for =0.8 m. For both cases the fundamental and second harmonic pulses hold, respectively, 95% and 5% of this energy. The energy for each wavelength was chosen in such a way that the power of the corresponding single-color pulse at wavelength is equal, in both cases, to 1.2, where is the critical power of self-focusing in air at this wavelength.
Results.—Using the above model we numerically simulated the two-color filamentation of 3.9 m and 0.8 m pulses in air. Figure 1 shows the dependence of several filamentation integral parameters on propagation distance for both wavelengths. One can see that the peak intensity, peak fluence, and peak plasma concentration in the case of 3.9 m pulse are several times lower than for the 0.8 m pulse. However, the filament produced by the 3.9 m pulse is about 3 times longer. Moreover, much higher integrated over radius plasma concentration shows that the plasma channel produced by the 3.9 m pulse is considerably wider compared to the 0.8 m pulse.
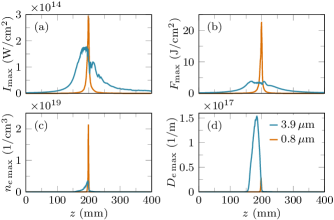
Figure 2 shows the dependence of the integrated power spectrum on propagation distance and frequency for the two wavelengths. One can see that filamentation of 3.9 m two-color pulse is accompanied by generation of extremely broad supercontinuum, which includes all even and odd harmonics up to at least the 15th order. Though the most intriguing result is the impressive energy transferred to the THz part of the spectrum with the 3.9 m pulses compared to the case of the 0.8 m ones. The THz conversion efficiency (for frequencies lying below 40 THz) for 0.8 m pulses is 0.06%, while the one for 3.9 m pulses is 6.7%, that is more than two orders of magnitude higher. Note that this conversion efficiency is the highest reported to date compared to any of the known approaches for THz generation.
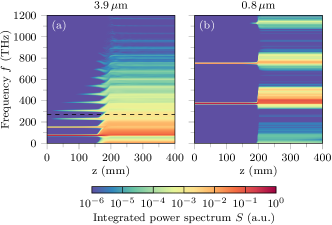
Figure 3a shows how the energy of the THz pulse generated during two-color filamentation of 3.9 m pulses depends on the propagation distance . One can see that close to the end of the filament ( mm) the energy of the THz pulse reaches almost 2 mJ. Note that the decrease of the THz energy at longer propagation distances is purely numerical and is due to losses of the diffracting THz beam in the absorbing boundary layers located at the end of the numerical grid. In turn, the peak THz energy generated by 0.8 m pulses is only about 0.8 J. In other words, the THz pulse generated by the 3.9 m pulse is 2500 times (three orders of magnitude!) more energetic than the one generated by 0.8 m pulses.
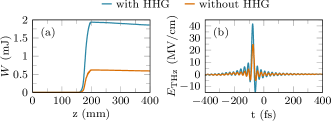
Figure 3b shows the on-axis THz electric field generated by 3.9 m pulses at a distance mm (in the middle of the filament). One can see that the field strength (the amplitude from minimum to maximum of the field) of the generated THz pulse reaches 56 MV/cm, which exceeds the field strengths obtained in the most efficient experiments with optical rectification Vicario et al. (2014).
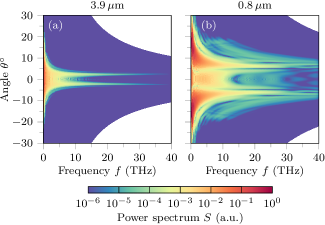
Figure 4 shows the angularly-resolved frequency spectrum of the THz pulse generated during two-color filamentation of 3.9 m and 0.8 m pulses. One can see that in both cases the THz radiation is emitted into a cone, where higher frequencies propagate at smaller angles. Also, we see that in average the angle of the THz emission cone is smaller in the case of m ( for 0.8 m and for 3.9 m pulses). Thus, an extra advantage of the THz radiation produced during two-color filamentation of 3.9 m is its better directionality compared to the case of 0.8 m pulses.
Discussion.—As we have already seen two-color filamentation of mid-IR laser pulses allows one to generate THz pulses of very high energy and field strength. High efficiency of THz generation by mid-IR two-color pulses is made up of several factors. Maybe the most intriguing of them is related to the highly efficient generation of high harmonics during mid-IR filamentation. In Fig. 2 we see that the spectrum produced by 3.9 m pulses consists of all harmonics, both even and odd, up to the 15th order. Thus, filamentation of two-color 3.9 m pulses is accompanied by generation of a multiple number of secondary dual frequency pulses (–, –, –, etc.). Each of these secondary pulses contribute to the field symmetry breaking and support further THz generation. In order to test this hypothesis, we repeated the simulations of two-color filamentation with 3.9 m pulses, but during these simulations at each propagation step we filtered out all harmonics of order 4 and higher (the black dashed line in Fig. 2 shows the boundary of the spectral filter). The energy and the electric field of the THz pulses obtained from these simulations are plotted in Fig. 3. One can see that without higher harmonics the energy of the generated THz pulse drops down by 3 times.
In addition, mid-IR laser pulses produce much stronger photocurrents compared to 0.8 m pulses. This can be seen from the following estimations. The velocity of a free electron under the action of the Lorentz force produced by a monochromatic field of amplitude and frequency is given by the equation , where and are the charge and mass of electron, respectively. After integration we find (the initial velocity of free electrons after ionization is assumed to be zero). Therefore the average electron velocity is proportional to the wavelength . Thus, the photocurrent produced by 3.9 m pulses and, as a consequence the generated THz field, is about five times stronger compared to 0.8 m pulses.
Another factor contributing to the highly efficient THz generation is a smaller walk-off between the fundamental and the second harmonic. According to our dispersion model (see the Supplemental Material Sup ) the walk-off between 0.4 m and 0.8 m pulses is fs/m. In turn the walk-off between m and m pulses is only fs/m for air with CO2 and fs/m for air without CO2. That is, the walk-off for m two-color pulses is at least 20 times less than for 0.8 m pulses. In turn, keeping in mind the Cherenkov mechanism of THz generation Johnson et al. (2013), smaller walk-off between the THz and fundamental pulses explains the better directionality of THz radiation in the case of mid-IR pulses (see Fig. 4).
Besides, the THz generation efficiency is higher for m two-color pulses because it produces times longer plasma channels that contain times more free electrons (see Fig. 1).
It is interesting that in our studies we did not reveal any effect of the CO2 gas on THz generation efficiency, as one could suggest because of the absorption line near the 3.9 m and the corresponding anomalous dispersion (see the Supplemental Material Sup ). For air with and without CO2 the results of our simulations are so close that it is very hard to see any difference on any of the above figures.
To sum up, the much higher efficiency of THz generation by 3.9 m two-color pulses compared to 0.8 m ones can be explained by the extra field symmetry breaking due to higher harmonics, the 5 times stronger photocurrents, the tens of times smaller walk-off between the fundamental and its second harmonic, the 3 times longer plasma channels, and the 45 times more total free electrons.
In addition, we studied how the parameters of generated THz radiation scale with the input energy of the 3.9 m two-color pulses. Figure 5a shows that the energy of the generated THz pulse growths almost linearly with energy , reaching 15 mJ at mJ. The THz conversion efficiency weakly depends on input energy and is about 7 % (see Fig. 5b). The peak THz electric field strengths obtained for =29, 58, 116, and 232 mJ are equal to 56, 65, 67, and 77 MV/cm, respectively. Considering the almost linear increase of the THz energy with increasing , and taking into account that the width of the THz spectrum remains the same, this rather small growth of THz field strength suggests that the spatial size of the generated THz pulses increases with . To verify this, we calculated the fluence distributions (intensities integrated over time) for all THz pulses and estimated their radii using a Gaussian fitting. As a result we obtained =0.5, 0.77, 1.72, and 2.2 mm for the corresponding input energies =29, 58, 116, and 232 mJ. Thus, the growth of THz energy with increase of the input laser energy happens mainly due to increase of the THz beam spatial size.
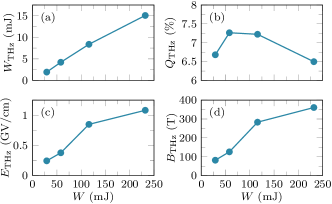
Although the obtained THz field strengths already exceed the highest values reported in the literature, one can reach even higher values when focusing the corresponding THz beams. As a simple estimate, we recall that for Gaussian beams the field at the focus of a lens with focal distance is times higher than the initial one. Here is the diffraction length, where is the central frequency and is the beam radius. We apply this estimate for our THz pulses using the previously calculated radii and =8 THz. This central frequency corresponds to the center of mass of the THz power spectrum (we found that does not change with ). Figure 5c shows that the estimated THz field strengths in the focus of a off-axis parabolic mirror (=25.4 mm) reach the level (1.1 GV/cm for =232 mJ). In turn, the corresponding magnetic fields reach several hundreds of tesla (see Fig. 5d).
Note that the above estimates are quite relaxed, for the =232 mJ case, for example, the above focusing conditions produce a THz focal waist that is about 2.8 times the central THz wavelength. This means that one could achieve even stronger focusing, like for instance in Shalaby and Hauri (2015). This in turn would result in magnetic fields that go beyond the kT regime, exceeding any laboratory produced quasi-DC magnetic field reported to date by any means.
Conclusions.—In conclusion, we numerically simulated two-color filamentation of 3.9 m laser pulses in realistic atmospheric pressure air. We have shown, that compared to the case of 0.8 m pulses, THz generation efficiency by 3.9 m two-color pulses is two orders of magnitude higher. The energy of THz radiation generated by 3.9 m two-color pulses reaches the multi-millijoule level, the THz electric field strengths can go beyond the GV/cm level and the magnetic fields can reach the kT. Such high THz efficiency and energy of THz pulses generated by mid-IR pulses is the result of several factors, including a novel mechanism where generated high harmonics contribute to the field symmetry breaking. The other factors are stronger photocurrents, negligible walk-offs between harmonics, longer and wider plasma channels. As a result, we have shown that two-color filamentation of mid-IR laser pulses, being a source of extremely bright THz radiation, can open the way for future studies of extreme THz field-matter interactions, nonlinear THz spectroscopy and imaging.
Acknowledgements.
This work was supported by the National Priorities Research Program grant No. NPRP9-383-1-083 from the Qatar National Research Fund (member of The Qatar Foundation) and the European Union’s Horizon 2020 Laserlab Europe (EC-GA 654148).References
- Zhang et al. (2017) X. C. Zhang, A. Shkurinov, and Y. Zhang, Nature Photonics 11, 16 (2017).
- Tonouchi (2007) M. Tonouchi, Nature Photonics 1, 97 (2007).
- Lewis (2014) R. A. Lewis, Journal of Physics D: Applied Physics 47, 374001 (2014).
- Reimann (2007) K. Reimann, Reports on Progress in Physics 70, 1597 (2007).
- Huang et al. (2014) W. R. Huang, S.-W. Huang, E. Granados, K. Ravi, K.-H. Hong, L. E. Zapata, and F. X. Kärtner, Journal of Modern Optics 62, 1 (2014).
- Vicario et al. (2014) C. Vicario, A. V. Ovchinnikov, S. I. Ashitkov, M. B. Agranat, V. E. Fortov, and C. P. Hauri, Optics Letters 39, 6632 (2014).
- Shalaby and Hauri (2015) M. Shalaby and C. P. Hauri, Nature Communications 6, 1 (2015).
- Kim et al. (2008) K. Y. Kim, A. J. Taylor, J. H. Glownia, and G. Rodriguez, Nature Photonics 2, 605 (2008).
- Oh et al. (2014) T. I. Oh, Y. J. Yoo, Y. S. You, and K. Y. Kim, Applied Physics Letters 105, 041103 (2014).
- Kuk et al. (2016) D. Kuk, Y. J. Yoo, E. W. Rosenthal, N. Jhajj, H. M. Milchberg, and K. Y. Kim, Applied Physics Letters 108, 121106 (2016).
- Wang et al. (2010) T. J. Wang, S. Yuan, Y. Chen, J. F. Daigle, C. Marceau, F. Théberge, M. Châteauneuf, J. Dubois, and S. L. Chin, Applied Physics Letters 97, 111108 (2010).
- Wang et al. (2011a) T. J. Wang, J. F. Daigle, S. Yuan, F. Théberge, M. Châteauneuf, J. Dubois, G. Roy, H. Zeng, and S. L. Chin, Physical Review A 83, 053801 (2011a).
- Daigle et al. (2012) J.-F. Daigle, F. Théberge, M. Henriksson, T.-J. J. Wang, S. Yuan, M. Châteauneuf, J. Dubois, M. Piché, and S. L. Chin, Optics Express 20, 6825 (2012).
- Clerici et al. (2013) M. Clerici, M. Peccianti, B. E. Schmidt, L. Caspani, M. Shalaby, M. Giguère, A. Lotti, A. Couairon, F. Légaré, T. Ozaki, D. Faccio, and R. Morandotti, Physical Review Letters 110, 253901 (2013).
- Wang et al. (2011b) W.-M. Wang, S. Kawata, Z.-M. Sheng, Y.-T. Li, L.-M. Chen, L.-J. Qian, and J. Zhang, Optics Letters 36, 2608 (2011b).
- Mitrofanov et al. (2015) A. V. Mitrofanov, A. A. Voronin, D. A. Sidorov-Biryukov, A. Pugžlys, E. A. Stepanov, G. Andriukaitis, T. Flöry, S. Ališauskas, a. B. Fedotov, A. Baltuška, and A. M. Zheltikov, Scientific Reports 5, 8368 (2015).
- Panagiotopoulos et al. (2015) P. Panagiotopoulos, P. Whalen, M. Kolesik, and J. V. Moloney, Nature Photonics 9, 543 (2015).
- Mitrofanov et al. (2016a) A. V. Mitrofanov, A. A. Voronin, D. A. Sidorov-Biryukov, S. I. Mitryukovsky, A. B. Fedotov, E. E. Serebryannikov, D. V. Meshchankin, V. Shumakova, S. Alisauskas, A. Pugžlys, V. Y. Panchenko, A. Baltuška, and A. M. Zheltikov, Optica 3, 299 (2016a).
- Mitrofanov et al. (2016b) A. V. Mitrofanov, A. A. Voronin, D. A. Sidorov-Biryukov, S. I. Mitryukovsky, M. V. Rozhko, A. Pugzlys, A. B. Fedotov, V. Y. Panchenko, A. Baltuska, and A. M. Zheltikov, Optics Letters 41, 3479 (2016b).
- Panagiotopoulos et al. (2016) P. Panagiotopoulos, M. Kolesik, and J. V. Moloney, Physical Review A 94, 033852 (2016).
- Panov et al. (2016) N. A. Panov, D. E. Shipilo, V. A. Andreeva, O. G. Kosareva, A. M. Saletsky, H. Xu, and P. Polynkin, Physical Review A 94, 041801 (2016).
- Kolesik et al. (2002) M. Kolesik, J. V. Moloney, and M. Mlejnek, Physical Review Letters 89, 283902 (2002).
- Kolesik and Moloney (2004) M. Kolesik and J. V. Moloney, Physical Review E 70, 036604 (2004).
- Couairon et al. (2011) A. Couairon, E. Brambilla, T. Corti, D. Majus, O. Ramírez-Góngora, and M. Kolesik, The European Physical Journal Special Topics 199, 5 (2011).
- (25) “See Supplemental Material at XXX for the details on model used in our simulations.” .
- (26) “HITRAN on the Web,” http://hitran.iao.ru/, accessed: 2017-07-05.
- Johnson et al. (2013) L. A. Johnson, J. P. Palastro, T. M. Antonsen, and K. Y. Kim, Physical Review A 88, 063804 (2013).
- Perelomov et al. (1967) A. M. Perelomov, V. S. Popov, and M. V. Terent’ev, Soviet Physics JETP 24, 207 (1967).
- Peck and Reeder (1972) E. R. Peck and K. Reeder, Journal of the Optical Society of America 62, 958 (1972).
I Supplemental Material
In our simulations we use the Unidirectional Pulse Propagation Equation (UPPE) Kolesik et al. (2002); Kolesik and Moloney (2004); Couairon et al. (2011), given by:
| (1) |
where is the spatio-temporal spectrum of the laser pulse, represents the nonlinear response of the medium, is the propagation constant, , , and are the spatial and temporal angular frequencies, and are the vacuum and medium permeabilities, respectively. The nonlinear response takes into account the third order nonlinear polarization, , the current of free electrons and the current that is responsible for ionization losses, :
| (2) |
with
| (3) | ||||
| (4) | ||||
| (5) |
where denotes the spatio-temporal spectrum, is the vacuum permittivity, is the cubic susceptibility with being the nonlinear index, is the medium refractive index at the pulse central frequency , is the speed of light in vacuum, and are the charge and mass of the electron, is the collisions frequency, is the concentration of free electrons (in 1/m3), and is the order of the multiphoton ionization. The real part of describes inverse Bremsstrahlung, and the imaginary part is responsible for plasma defocusing.
Together with the UPPE we solve the kinetic equation for plasma concentration Couairon et al. (2011):
| (6) |
where is the concentration of neutral molecules, with and being the optical field and avalanche ionization rates. To calculate we use the Perelomov-Popov-Terentiev (PPT) formula Perelomov et al. (1967), while is given by
| (7) |
with
being the inverse Bremsstrahlung cross-section at the pulse central frequency , and is the ionization potential. For the calculation of in Eq. (5) we use only the first term on the right-hand side of Eq. (6).
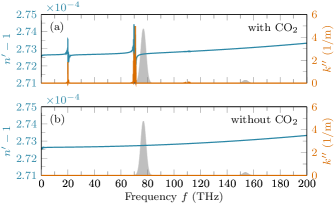
Real atmospheric air is a mixture of several gases, including CO2. One of the CO2 absorption bands is located at 4.3 m, that is, in close proximity to the central wavelength of our 3.9 m pulse. In order to take into account the influence of CO2 gas we use the following model for complex frequency-dependent refractive index of air Panov et al. (2016):
| (8) |
The real valued refractive index is given in Peck and Reeder (1972), while to calculate the complex refractive index we use the data on spectral lines of atmospheric gases from the HITRAN database HIT . The imaginary part is recalculated from the absorption coefficient given in the database, then the real part is restored using the Kramers-Kronig relations. To study the influence of CO2 resonances we calculated for two gas mixtures that represent dry air (i.e., air with zero relative humidity): the first one with CO2 (0.04% of CO2, 79.06% of N2, 20.9% of O2) and the second one without CO2 (79.1% of N2 and 20.9% of O2). The spectral lines for both mixtures are calculated for a temperature of 296 K and pressure of 1 atm. In Fig. 6 we plot the real part of the refractive index and absorption coefficient as functions of frequency for both gas mixtures. One can see that the presence of CO2 gas in air gives rise to two absorption bands centered at 70 and 20 THz (4.3 m and 15 m, respectively). However, at this concentration of CO2, the highest values of the absorption coefficient do not exceed several inverse meters. Therefore for our pulses focused by 200 mm lens we do not expect such strong influence of the linear absorption like in Panov et al. (2016). Nevertheless, the presence of CO2 affects the sign of the second order dispersion coefficient at =3.9 m: for the gas mixture with CO2 the s2/m is negative and the dispersion is anomalous, while for the gas mixture without CO2 the s2/m is positive and the dispersion in normal.
In our simulations we assume that the nonlinear index m2/W is the same for and 3.9 m (the corresponding values of critical power are 9.65 and 230 GW); the concentration of neutral molecules 1/m3, and collision frequency 1/s. To calculate the concentration of free electrons, , we assumed that air consists by 79.1% of N2 and 20.9% of O2 molecules with ionization potentials equal to 15.576 and 12.063 eV, respectively. For each molecule we solved a separate kinetic equation.
We solved Eq. (1) on an axially symmetric grid with the following parameters: the grid size and number of points in spatial domain are 10 mm and 1000, respectively (spatial resolution is 10 m); the grid size and number of points in time domain are 10 ps and 65536, respectively (temporal and spectral resolutions are 0.15 fs and 0.1 THz).