Improved modeling of photon observables with
Abstract
The event-by-event fission model has been improved, in particular to address deficiencies in the calculation of photon observables. We discuss the improvements that have been made and introduce several new variables, some detector dependent, that affect the photon observables. We show the sensitivity of to these variables. We then compare the results to the available photon data from spontaneous and thermal neutron-induced fission.
I Introduction
The computational model generates complete fission events, i. e. it provides the full kinematic information on the two product nuclei as well as all the emitted neutrons and photons. In its development, an emphasis had been put on speed, so large event samples can be generated quickly. therefore relies on experimental data supplemented by simple physics-based modeling.
In its standard version, to treat a given fission case, needs the fission fragment mass distribution, , and the average total kinetic energy for each mass split, TKE(), for the particular excitation energy considered. is taken either directly as the measured yields or as a five-Gaussian fit to the data which makes it possible to parameterize its energy dependence, see Ref. VRBDO for details on how the energy dependence of neutron-induced fission is handled in .
In order to generate an event, selects the mass split based on the provided . The fragment charges are then sampled from the normal distributions suggested by experiment VRBDO . The linear and angular momenta of the two fragments and their internal excitations are subsequently sampled. After their formation, the fully accelerated fragments de-excite first by neutron evaporation and then by photon emission. In addition to spontaneous fission, treats neutron-induced fission up to . The possibility of pre-fission evaporation is considered as well as pre-equilibrium neutron emission. Both play an increasing role at the higher energies.
This paper is a follow up to our previous paper on prompt photon emission from fission RVJR_gamma , describing several improvements to the modeling of photon emission. For detailed information on how to download and run , the first published fission event generator, see Ref. CPC and the subsequent new version announcement that includes the new work described here CPC_NVA .
This paper is organized as follows. We first discuss the improvements made to the photon model in . We then describe the model parameters of and which observables they affect most strongly. We then show how the improvements affect prompt photon observables. Next, we demonstrate the effect of modifying the parameters on the photon results, in particular for 252Cf(sf) because a first attempt at fitting the parameters to data with this version of was made for this case Andrew .
We then compare our results to photon data from 252Cf(sf) as well as from neutron-induced fission when appropriate. Because no detailed fits have been made for those cases, the parameter that governs photon emission has the value determined in a global fit to available 252Cf(sf) data Andrew , as explained further in the text. The calculations for those cases then yield reasonable preliminary result. Finally we conclude.
II
General descriptions of the physics of have been published elsewhere VRBDO ; RVJR_gamma ; RVJR_spont ; JRRV_ang ; RVJR_corr . Therefore, in this paper we describe only the improvements made for photon emission.
In our previous paper on photon emission RVJR_gamma , we included statistical emission of photons with no form factor modulation, corresponding to black-body radiation. The resulting photon spectrum was too soft, with too few high energy photons. In addition, although rotational energy was included, the total angular momentum was not conserved. Furthermore, the earlier treatment did not include any discrete low-energy photon transitions, but carried the statistical de-excitation through until the yrast line was reached and then disposed of the remaining rotational energy by schematic E2 transitions RVJR_gamma .
For each fragment, the magnitude of its angular momentum was governed by a “spin temperature” , , where is the fragment moment of inertia. The parameter was varied from 0.35 MeV to 2.75 MeV for a fixed value of , the energy above the neutron separation energy at which the fragment de-excitation cascade switches from neutron to photon emission. The value of was set to 0.01 MeV in Ref. RVJR_gamma and this remains the default value in . However, it was shown that using a large value of (1 MeV) in conjunction with a small (0.2 MeV) was equivalent to using a small (0.01 MeV) with a large (2.75 MeV).
Since then, several improvements have been made. While some have been reported in preliminary form elsewhere Andrew ; CPC_NVA , others are described here for the first time.
In Ref. JRRV_ang , we modified to conserve total angular momentum, including fluctuations of the dinuclear wriggling and bending modes, where the two fragments rotate in the same or opposite sense around an axis perpendicular to the dinuclear axis. The tilting and twisting modes, where the rotations are around the dinuclear axis, were neglected. These modes each contribute to fluctuations in the rotational energy, where wriggling is denoted by and bending by . The moments of inertia for these modes (each of which is doubly degenerate), and , are given in terms of the moments of inertia of the individual light and heavy fragments, and , respectively, as well as moment of inertia for their relative motion, ,
| (1) | |||||
| (2) |
where is the total moment of inertia. The angular momenta of these rotational modes are sampled from thermal distributions characterized by the spin temperature , . The individual fragment angular momenta then follow. Any overall angular momentum, (resulting from the absorption of an incoming neutron or the recoil from any pre-fission neutron emission) is also taken into account but the effect tends to be very small.
We express the spin temperature as , where the “scission temperature” is the temperature of the system at scission, and adopt as a convenient parameter for controlling the overall magnitudes of the fragment angular momenta in . The general effect of changing is similar to that of changing in Ref. RVJR_gamma and we shall discuss how the results depend on . We note that if is taken to be zero, the fragments emerge with only their share of the overall rotation, , which is usually very small (and is zero for spontaneous fission).
In the refined treatment of the statistical photon emission stage, we modulate the black-body spectrum by a giant dipole resonance (GDR) form factor, so that the prompt fission photon spectrum is
| (3) |
from which the photon energy can readily be sampled. (Its direction is chosen isotropically, in the frame of the emitting fragment, as earlier.) The position of the GDR is BermanRMP47 , while its width is . Relative to the earlier treatment RVJR_gamma , which employed pure black-body radiation, the inclusion of the GDR hardens the spectrum
Furthermore, as a significant extension, we now include evaluated discrete transitions from the RIPL-3 database RIPL-3 , as in Refs. FIFRELIN ; CGMF . The RIPL-3 library tabulates a large number of discrete electromagnetic transitions for nuclei throughout the nuclear chart. Some of these lines may be exploited experimentally to identify the specific fragment species. Unfortunately, complete information is available for only relatively few of the identified transitions, so some modeling is required to complement the tabulations (see below). It is then possible to construct, for each product species, a table of the possible decays from the included discrete levels.
The RIPL-3 data files are organized by element, with one file for each value, and each such file contains similarly structured listings for those isotopes of that element for which data exist. For any tabulated nucleus, we seek to include all levels ‘in a complete level scheme, as indicated in the isotope header line on the data file. Each listed level may decay into a total of lower levels and the associated relative transition rate is indicated for each one, if available. Often the rate for a listed transition is not given and the corresponding transition is then ignored.
However, if all the decay rates from a given level are missing we assign decay rates from from that level to all of the lower levels based on a simple phase-space consideration,
| (4) |
Here is the energy of level , is its listed spin, and we take . It should be recognized that there are many more added transitions (201568) than tabulated transitions (75809). That is primarily because a level for which there are tabulated decay rates tends to decay to only some of the levels below it, whereas a level without tabulated decay rates is allowed to decay to any level below it and, furthermore, levels without tabulated decay rates tend to be high-lying and so have many lower levels.
In the previous de-excitation procedure, the product nucleus first made statistical emission until the yrast line was reached and then proceeded towards the ground state by collective emission. In order to better emulate the predominantly and character of the statistical transitions, it is assumed that the angular momentum of the fragment is reduced by for each emission. This is a somewhat idealized treatment which may need to be refined. In order to incorporate the subsequent discrete decays, we follow the earlier procedure until the total excitation has fallen below the highest discrete energy tabulated for that nucleus. The energy of the last statistical transition is then increased (slightly) to ensure that the last statistical decays leads to the closest lower-lying level and the further de-excitation is then carried out by means of the discrete rates described above. The emission of discrete photons is continued until the tabulated half-life of a level exceeds a specified value .
If there are no RIPL-3 transitions available for a given product nucleus, the final de-excitation occurs as in Ref. RVJR_gamma by emission of ‘collective photons along the yrast line, with each emitted photon reducing the angular momentum by .
We will show how the inclusion of the GDR modulation and the RIPL-3 transitions affect the photon observables. The maximum half-life of the discrete levels, , as well as the minimum recorded photon energy, , have an impact on the generated photon energy and multiplicity, and we will explore how changes in these quantities affect the photon observables obtained with . Because represents the energy threshold for photon detection and represents the time gate for the detectors, the comparison with a particular experiment depends on this information.
II.1 parameters
contains a number of physics-based parameters that affect various observables. They can be adjusted to available data. Here we give a brief description of their function and impact. The following six are code specific parameters:
-
is a common, mass-independent, shift of the total fragment kinetic energy relative to the input TKE(). This shift is tuned to give agreement with the average prompt neutron multiplicity , an adjustment that is typically of the order of one MeV or less.
-
is the relative advantage in excitation energy given to the light fragment over the heavy fragment. This parameter significantly affects the neutron multiplicity as a function of fragment mass, . As shown in Ref. RVJR_corr , it also affects the shape of the two-neutron angular correlation function. Other codes use systematics of excitation energy sharing GEF or tune the fragment temperature distribution to the available data FIFRELIN ; CGMF . We have so far kept this parameter single-valued since we wish to address cases where is not available for tuning the temperature distribution.
-
is the relative statistical fluctuation in the fragment thermal excitation. Prior to Ref. RVJR_corr , was assumed to be unity by default. In that work, however, it was shown that it had a significant effect on the width of the neutron multiplicity distribution and, in particular, on the moments of important for some applications. In addition, since the value of adjusts the intrinsic excitation energy, the extra excitation energy must be taken away from the total kinetic energy of the fragments. Thus effectively governs the width of the TKE distribution, , as well.
-
sets the overall scale of the Fermi-gas level density parameter. (The asymptotic level density parameter is .) It has only a negligible effect on the neutron multiplicity distribution, ; the neutron multiplicity as a function of fragment mass, ; the two-neutron angular correlation; and the photon observables. It does, however, affect the spectral shape of the prompt fission neutrons. We note that while the other parameters also affect the spectral shape and normalization to . the neutron spectrum is effectively the only observable dependent on .
-
was defined previously as the ratio of the spin temperature to the scission temperature . It governs the overall magnitude of the fragment angular momenta. It affects the photon observables significantly, as we show here, whereas it has only a small effect on the neutron observables. However, there is a strong correlation between TKE and which serves to balance the neutron and photon multiplicities. If is changed to match the photon multiplicity, TKE must also be adjusted to maintain agreement with . This balance is most important for the multiplicities of prompt emission.
-
is defined as the energy above the neutron separation threshold where photon emission takes over from neutron emission. Since we adjust to the photon multiplicity, this parameter is kept fixed at MeV in the present studies.
The following two parameters are detector specific and not internal parameters:
-
is the minimum energy of photons that are being recorded and it is usually set to the minimum photon energy measurable by the photon detector in the measurement under analysis. Photons softer than may still be emitted, they are just not being recorded in the particular event. This parameter is merely introduced for convenience and it does not affect the physical process.
-
is the maximum half-life of an energy level in the discrete part of the photon decay chain. If the photon cascade leads to a level that has a half-life exceeding , the fragment is effectively stuck at that level during the time interval of the measurement and the subsequent history is immaterial. The effect of changing is somewhat subtle and affects primarily photons emitted from low-energy levels having relatively low spin which are reached in the later part of the decay cascade.
II.2 252Cf(sf) analysis
In Ref. Andrew , we adjusted TKE, , , and to several sets of data. These included the Mannhart spectral evaluation Mannhart , the distribution by Boldeman et al. Boldeman , the distribution determined by Dushin et al. Vorobiev , the neutron multiplicity as a function of TKE measured by Budtz-Jørgensen and Knitter Budtz-Jorgensen , and the average total photon energy and the average total photon multiplicity measured by Billnert et al. BillnertCfgamma . While we later compared to the photon multiplicity distribution measured by DANCE Czyzhgamma , we did not include that distribution in the fits. Indeed, none of the current parameters affect the width of the photon multiplicity distribution .
A wide range of possible parameter values were considered, with some physics bias to guide the fits. TKE was varied from -5.0 to 5.0 MeV although large excursions from the measured mean would be in strong disagreement with data. The value of was assumed to be larger than unity, limiting us to for the study. We choose because the light fragment emits more neutrons on average than the heavy fragment in spontaneous and neutron-induced fission, see Ref. RVJR_spont for details. Also, given the limitations of the single-valued parameter in describing the shape of in the low and high fragment mass range, only the mass region was used in the fit. The parameter governing thermal fluctuations, , was also assumed to be larger than unity, between 1 and 2. The value of the asymptotic level density parameter, , was taken to be in the range MeV. Finally, was allowed to vary around unity, . We will study larger excursions of in Sec. IV to illustrate the magnitude of the effect. The comparison to data is made by calculating for each data set individually and summing them to obtain the total .
In Ref. Andrew , the global was minimized using a particle swarm algorithm. The best fit value using this method was found to give TKE = 0.5 MeV, , , MeV, and . We note that some of these values are not far from those suggested in Ref. RVJR_spont , where photon observables were not yet included and by default: and . We are currently working on an approach that will give a better global , with well defined uncertainties for 252Cf(sf), and will apply the same method to other spontaneously fissioning nuclei as well as neutron-induced fission. We note that this must be an ongoing process as new data are taken and become available.
For the results presented here, we use the best fit values of and found in Ref. Andrew for 252Cf(sf) and keep these same values for our calculations of other cases. One might expect to be universal since it is independent of the fissioning nucleus. We have chosen to leave fixed because it is strongly correlated with TKE and its optimal value for a particular nucleus is therefore best determined on the basis of a global analysis of each isotope. To calculate results for neutron-induced fission, we adjust based on measurements, based on data, and fix TKE to the measured . These parameter values, while still preliminary to some degree, provide benchmarks as to how well we can expect to describe the prompt fission photon data.
III Effects of the model refinements
We begin by showing how the photon emission results have evolved since the publication of Ref. RVJR_gamma . That work considered unmodulated (black-body) statistical photon radiation,
| (5) |
until the yrast line was reached and the rotational energy was then dissipated by schematic photon emission along the yrast line. Thus no specific transitions were considered. In this section we compare three different model scenarios: 1) no GDR and no RIPL corresponding to the earlier treatment RVJR_gamma ; 2) GDR without RIPL, showing the effect of the modulation of the statistical decays without including the specific tabulated transitions; and 3) GDR with RIPL, corresponding to the improved treatment presented here.
All the calculations shown in this section are for 252Cf(sf). The three different model scenarios all use the same parameter values, given in Sec. II.2 above with MeV and ns. Each calculation is based on one million events which suffices to ensure negligible statistical uncertainties aside from regions near the edges of phase space, either in the low and high tails of the yields or close to symmetry for observables given as a function of fragment mass or at extreme values of total fragment kinetic energy where there are few events for observables given as functions of TKE.
Figure 1(a) shows the prompt photon energy spectrum over the full energy range. The calculation without the GDR modulation, from Eq. (5), drops exponentially and has a negligible yield already for photons of a few MeV. When the GDR modulation is included, the spectrum broadens significantly above 2 MeV and is about an order of magnitude larger in the tail region. The addition of the RIPL tables does not change the shape of the high-energy tail of the photon spectrum further. Instead, adding the tabulated RIPL transitions primarily affects the low-energy end of the spectrum, as shown for the distributions at energies less than 1 MeV in Fig. 1(b). In this region, the two calculations without the RIPL contributions are qualitatively similar, both being smooth and monotonically decreasing. The effect of including the RIPL tables can be clearly seen: the emission of low-energy photons is strongly reduced and a considerable degree of spectral structure appears in reflection of specific transitions in fragments with large yields.
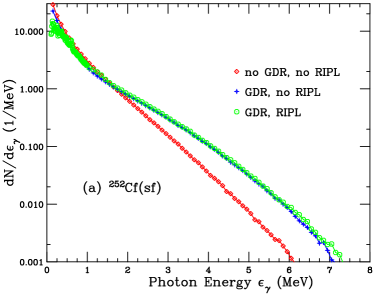
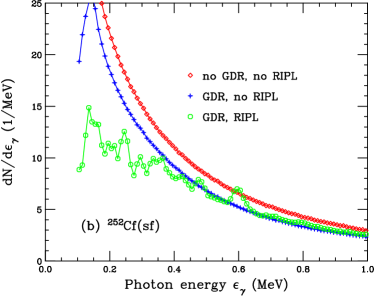
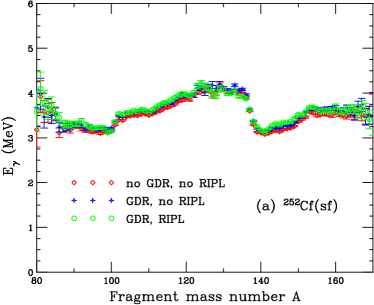
Figure 2 shows the total photon energy and the photon multiplicity as functions of , the mass number of the original (i. e. pre-evaporation) fragment nucleus, for the three different scenarios. The total energy carried off by photons amounts to the excitation energy left over after neutron evaporation has ceased (apart from the small dependence on ). Consequently, the total photon energy is practically unaffected by either the GDR modulation or the inclusion of discrete transitions, as seen in Fig. 2(a). Reflecting the dependence of the neutron separation energy , the total photon energy is relatively constant for and while, in the intermediate region, it increases slowly to a maximum near the doubly-closed shell at before dropping and then gradually rising again. It varies by around 1 MeV over the full range. The shape of is similar to that of Ref. RVJR_gamma .
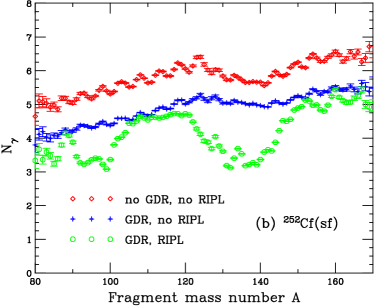
On the other hand, the photon multiplicity is affected more strongly by the inclusion of the GDR and the RIPL transitions, as seen in Fig. 2(b). Relative to the earlier treatment RVJR_gamma , the GDR modulation reduces the multiplicity by about one photon while still yielding a fairly smooth increase with the fragment mass . In both scenarios, increases linearly (with a possible odd-even modulation) until symmetry, , where the multiplicity decreases and then begins to rise again at . By contrast, the inclusion of discrete transitions has a large effect on the dependence of . The transitions introduce more structure, including a more pronounced dip near the doubly-closed shell at , similar to the ‘sawtooth’ pattern in . However, contrary to that behavior, does not exhibit a pronounced sharp ‘tooth’ in the light fragment mass region.
The energy per photon, shown in Fig. 3, is the ratio between the mean total photon energy per fragment pair , shown in Fig. 2(a), and the mean photon multiplicity , shown in Fig. 2(b). Because is unaffected by the GDR modulation and the inclusion of discrete transitions, the shape of the ratio is determined by the effect on . All three scenarios show a change in the ratio at . Without the RIPL lines, there is simply a shift from a higher plateau for the lighter fragments to a lower plateau for the heavier fragments. But when the RIPL lines are included the pronounced dip in near results in a peak in quite different from the other two cases.
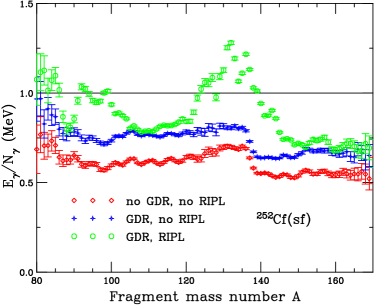
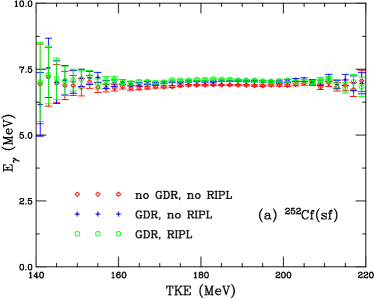
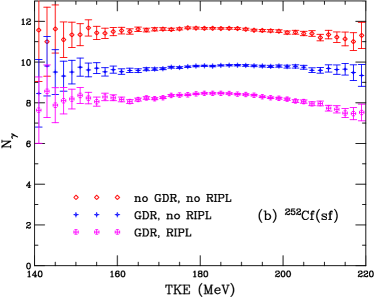
Figure 4 shows the total photon energy (emitted from both fragments) (a) and the total photon multiplicity (b) as functions of the total fragment kinetic energy TKE. The dependence here mirrors the fragment mass dependence shown in Fig. 2: is insensitive to the spectral modulation and the RIPL lines, while decreases with both the modulation and the RIPL lines. Each model refinement reduces the multiplicity by nearly one photon. However, because the total kinetic energy is averaged over mass, there is no significant effect on the shape of .
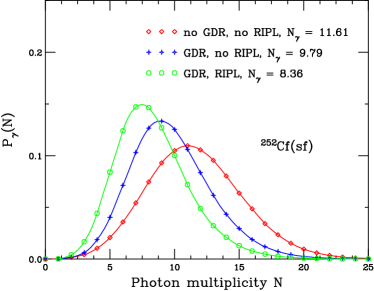
Finally, Fig. 5 shows the total photon multiplicity distribution in the three model scenarios. Unlike the neutron multiplicity distribution, , which does not have a Poisson form (primarily because of the dominant role played by the separation energy ), is more Poisson-like. The earlier treatment RVJR_gamma yields the largest average photon multiplicity, , while the GDR spectral modulation reduces the mean multiplicity to , consistent with the fact that it tends to harden the spectrum (see Fig. 1). The inclusion of the discrete transitions reduces the multiplicity even further, to .
After the above illustration of how the two main model refinements affect various photon observables, we now move on to discuss how the photon results of the improved depend on the various model parameters.
IV Dependence on
In this section we discuss the effect on photon observables caused by changing the parameter which controls the rotational motion of the fragments. Recall that the rotational energy is subtracted from the total excitation energy, leaving the remainder of the energy available for neutron evaporation.
The other parameters are kept fixed while is varied. We show results for , 0.8, 1.4 and 2.0. The value of 0.8 is rather close to the best fit value of 0.87. The value 0.2 is taken as a lower bound, significantly reducing the degree of rotation removing it altogether. The two larger values serve to illustrate the range of the effect.
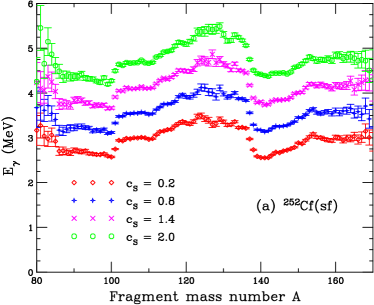
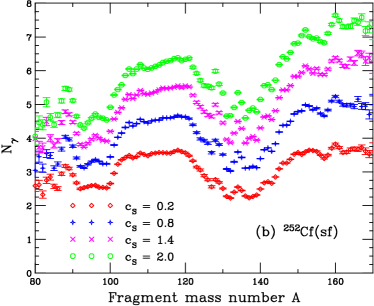
Figure 6 presents and for the four illustrative values of . As is increased and the fragments are endowed with ever more rotation, there is less energy available for the neutrons. In Fig. 6(a), it can be seen that the photon energy simply seems to increment by approximately 0.5 MeV when increases by 0.6. There is no visible mass dependence on changing . However, the photon multiplicity does seem to show some modification of the fragment mass dependence with increasing , see Fig. 6(b). While the general trend is the same for all values of , there seems to be a larger increase in the multiplicity for the heavy fragment while the dip at deepens with increasing . In addition, there appears to be a rather flat plateau for the light fragment masses for that acquires a positive slope as increases.
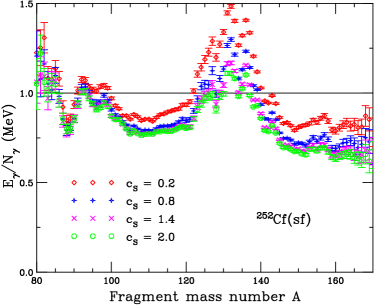
The changes in the photon multiplicity with fragment mass result in the observed differences in the energy per photon ratio shown in Fig. 7. The lowest value of actually produces the most pronounced peak in for . As is increased, the energy per photon is reduced, particularly for the heavy fragment.
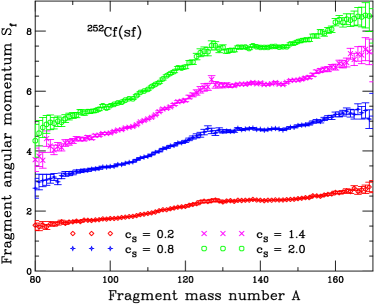
Figure 8 shows how the average magnitude of the fragment angular momentum, , grows with the parameter . The value of is almost independent of fragment mass for , remaining near . As is increased, and, thus, the portion of the excitation energy captured in rotational energy increase as well. grows nearly linearly in the light mass region and then remains relatively constant in the heavy region. The increase in the light fragment spin grows more pronounced for larger values of .
We recall, however, that these results are calculated assuming that no other parameter value changes. Thus, if the total excitation energy is held fixed, increasing the rotational energy, as is the case for increased , then less energy is available for neutron emission. Thus increasing while keeping the other parameters fixed will decrease the average neutron multiplicity. For example, if all other parameters remain unchanged, the average neutron multiplicity can decrease by as much as 12% when is increased from 0.2 to 2.0. Although this could be compensated for by changing the value of TKE, one has to be careful to adjust it within reasonable physics limits. Furthermore, when adjusting variables it is important to check the effect on other observables to ensure that overall description remains good. The results here are thus for illustrative purposes only.
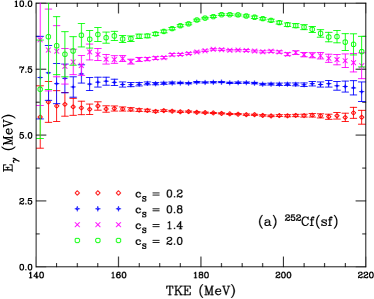
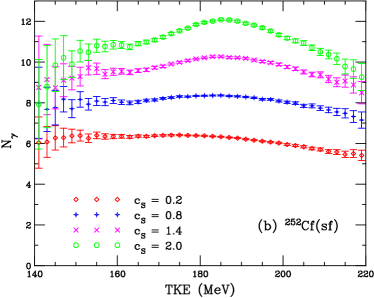
Figure 9 shows the variation of and with respect to . As is increased, the these functions develop some curvature with an enhancement appearing around MeV.
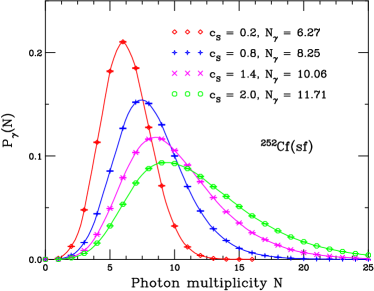
Finally, the dependence of the photon multiplicity distribution is shown in Fig. 10. As is increased, the fission fragments are formed with ever larger angular momenta and because these remain largely unchanged during the neutron evaporation chain, the resulting post-evaporation fragments tend to have correspondingly higher excitations. Consequently, a larger number of photons may be emitted, increasing both the mean multiplicity and the width of .
V Dependence on and
Here we discuss the dependence of the results on the detector-related parameters and . In our discussion of the dependence on , we show results similar to those in Sec. IV. We refer to photons above as detected fission photons since photons with energies below , while emitted, will not be detected. The effect of the detection time window, , is more subtle, however, so we present the dependence relative to an infinitely wide detection window, . While most of the results in this section are shown only for 252Cf(sf), some results for 235U(,f) and 239Pu(,f) are included as well. It should be recognized that neither of these quantities affects the physical photon emission, only the recording of the emission.
V.1 Dependence on
We begin by considering values of that are in the range of typical photon detectors, MeV. We show the dependence of the total photon multiplicity on the total fragment kinetic energy TKE. We then illustrate the effect of increasing up to 2 MeV which puts the focus ever more on the high-energy (and, hence, mostly statistical) photons.
The effect on is very small, with a change in between 0.05 and 0.20 MeV producing a reduction of only %, and it is therefore not shown in a separate figure, whereas the dependence of and are shown in Fig. 11 (a) and (b), respectively.
The effect on the photon multiplicity is significant (albeit not as large as changing by a factor of 10, between 0.2 and 2, as shown in Fig. 10). If , ever more soft photons could be emitted, increasing the total multiplicity. The photon multiplicity from the heavy fragment is affected the most by a change in , with a % change in near relative to a % change near . Because the discrete transitions tend to be relatively soft, their significance will diminish rapidly as is increased. There are also soft statistical photons at small that will be removed from the multiplicity count. As a result, the dependence of on will grow ever weaker until it is effectively constant.
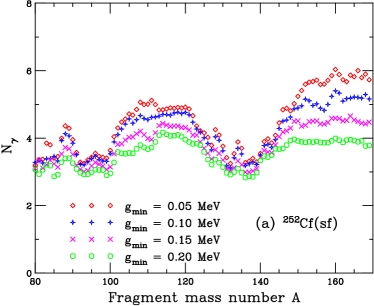
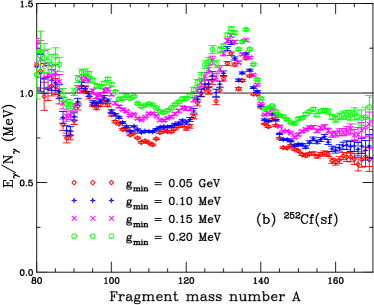
Figure 11(b) shows the dependence of on . Also here the -dependence weakens as is increased. However, the characteristic shape shown in the previous sections remains relatively unchanged.
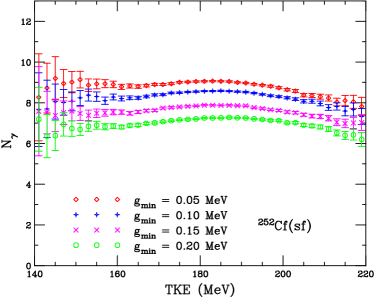
For the same values of , Fig. 12 displays the multiplicity as a function of the total kinetic energy TKE. While the total photon energy is generally independent of TKE for 252Cf, there is a mild TKE dependence of the total photon multiplicity. The main effect of increasing the detection threshold is an overall reduction in .
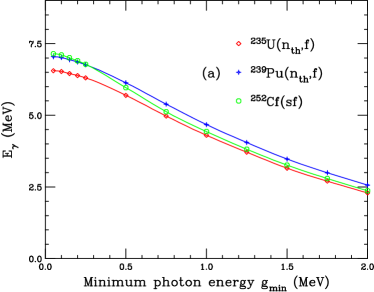
We now show the dependence of and on over a significantly broader range of values, up to 2 MeV. These results are shown in Fig. 13 for 252Cf(sf), 235U(,f) and 239Pu(,f). Figure 13(a) shows that the slow decrease, noted above for MeV, grows stronger for larger values of . The dependence is approximately linear for all three systems. The drop-off of is somewhat steeper for 252Cf(sf) than for 235U(,f) and 239Pu(,f) whose slopes are very similar.
When is small, the detected total fission photon energy approaches its maximum possible value, namely the total radiated photon energy. For each product nucleus, the radiated photon energy is given by its total excitation energy after neutron evaporation has ceased which is typically MeV below the threshold at MeV. As is increased from 0.05 to 2 MeV, decreases by a factor of , corresponding to a couple of MeV for each product nucleus.
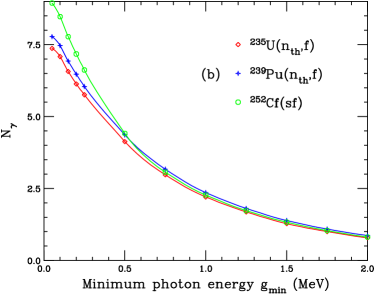
Because most of the radiated photons are relatively soft, the detected fission photon multiplicity drops off significantly more rapidly as the threshold is increased, as seen in Fig. 13(b). Again, the dependence on is stronger for 252Cf(sf) which also starts out from a somewhat higher value at than the other two cases displayed. By MeV, all three cases show essentially the same which decreases to slightly less than one by MeV.
The similarity in photon multiplicity is likely due to the fact that (in the current version of ), no photons are emitted until the excitation energy of the fragment has fallen below the neutron separation energy. As already mentioned in the introduction, this has the consequence that neutron observables are insensitive to the choice of and . Due to this, one may also expect that the residual excitation energy left for photon emission has a weak dependence on incident neutron energy, as already mentioned in previous work RVJR_gamma ; RVJR_spont .
We also note that the similarities between the three cases shown may be due in part to the use of the same values of , namely the one determined by the preliminary fit to 252Cf(sf) data. A fit of to the data available for additional cases may result in a greater range of and at .
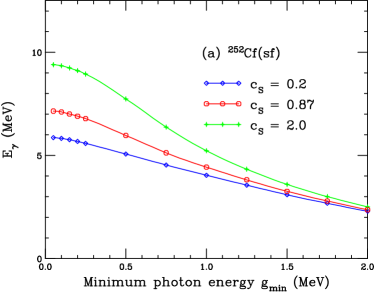
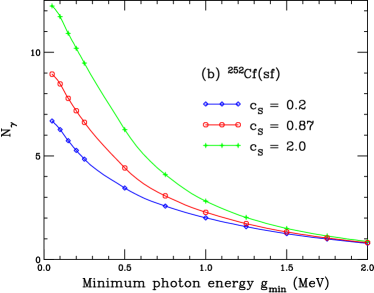
The total detected fission photon energy is shown in Fig. 14(a). For , decreases approximately linearly with increasing . As is increased, the fission fragments are created with ever larger angular momenta and the associated rotational energy is eventually disposed of by radiation of relatively soft photons. Consequently, goes up as well. The effect is about 50% in the ideal case when the detection threshold vanishes. When is increased, an ever larger proportion of these soft photons are not seen. Thus the sensitivity to diminishes.
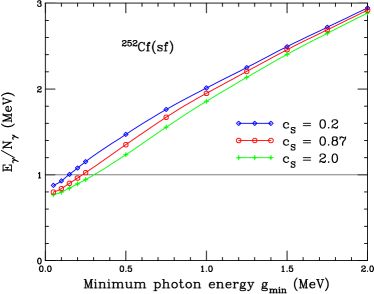
Figure 14(b) shows the corresponding results for the detected total fission photon multiplicity, which has a stronger dependence on , as noted already in the discussion of Fig. 14(a). The dependence is particularly strong for the lowest values of where, for , increasing from 0.1 to 0.2 MeV reduces by %, while increasing from 0.2 to 2 decreases by nearly a factor of two in the same region of . Thus the dependence of on is more power-law like. As was the case for , when is increased, becomes independent of because, as approaches 2 MeV, effectively only a single (likely statistical) photon has sufficient energy to be detected.
Lastly, we show the dependence of the energy per photon, , on the detection threshold for the same values of . The energy per photon is almost independent of , as shown in Fig. 15. It exhibits an almost linear increase with . Starting out from slightly below 1 MeV for low , becomes greater than 1 MeV at MeV for and at MeV for . Thus already for thresholds far below 1 MeV, each detected fission photon carries over 1 MeV of energy on average.
V.2 Dependence on
With the inclusion of the discrete transitions from the RIPL-3 library in , it has become possible to study the effect of the time window in which the detector operates on the measured photon spectrum which is expected to be particularly significant at low energies. For example, if the photon cascade from a fission product arrives at a long-lived isomeric state, the decay chain may not proceed further during the measurement time and no more prompt photon emission can be detected from that nucleus.
Because the fission fragment distributions differ for 252Cf(sf), 235U(,f) and 239Pu(,f), it is instructive to look at how and change as the detection time window is varied. The effect for 252Cf(sf) should be notably different from the effects for 235U(nth,f) and 239Pu(nth,f) because the light fragments are shifted upwards in mass for the former case relative to the latter ones. In addition, the wings of the fragment mass distribution are broader for 252Cf and the dip in the symmetric region is less pronounced. All these differences could lead to a significantly different population of the relevant isomeric states. Furthermore, should be more affected than because the isomeric states are encountered relatively far down the cascade so the photons affected are rather soft and will not strongly affect .
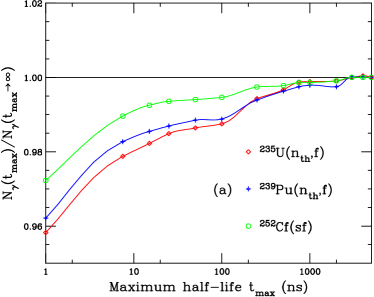
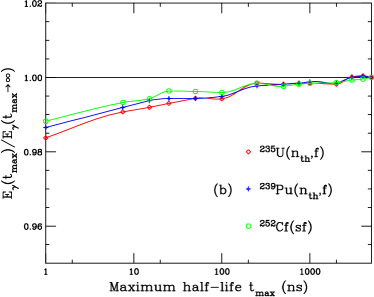
Figure 16 shows the dependence of and on the effective detector time window, , for all three cases, employing a detection threshold of MeV. The extracted value for a given is shown relative to the corresponding value obtained with an effectively infinite time window, s. Thus the ratio represents a cumulative value of the multiplicity or energy as a function of the duration of the detector time window. As expected, there is a noticeable difference between the three cases for the multiplicity ratios, see Fig. 16(a). The differences are largest for the shortest time windows, with the ratio being largest for 252Cf. All are very close to unity for ns. On the other hand, as also expected, the dependence of the ratios for the total photon energy are very similar for the three cases, see Fig. 16(b).
Our results differ somewhat from those obtained with the code Talou_late . There are a number of ways these differences could arise. First, while both treatments start from the same fission fragment yields and the same average total kinetic energies Hambsch_Cf , assumes that the charge distribution has a normal form (with the experimentally measured charge variance), whereas invokes Wahl systematics which takes account of odd-even effects. Second, does not use the measured width of the TKE distribution but generates it from the thermal fluctuations in the excitation energy (controlled by the parameter). Third, employs the single-valued parameter for the sharing of excitation energy between the fragments, while adjusts the fragment temperature point-by-point to better reproduce TalouPRC83 .
Fourth, uses the Hauser-Feshbach treatment for the fragment decays, while uses a Weisskopf-Ewing spectrum for neutron emission followed by the photon cascade as described in Sect. II. Finally, and perhaps most important, the resulting ratio depends on how the RIPL-3 lines are implemented: because the tables are rather incomplete a significant degree of modeling is required to complement the measured information, especially on branching ratios, and the two codes employ different methods for that (For the CGMF treatment, see Refs. BeckerPRC87 ; StetcuPRC90 .) Of course, the results also depend on the specific value of employed.
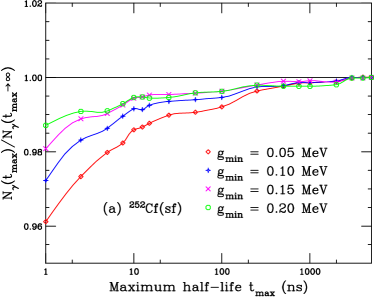
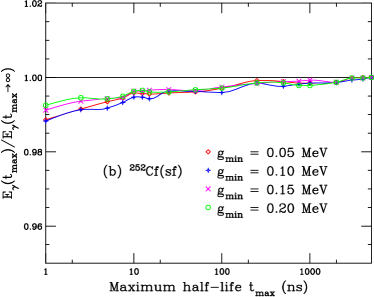
To show how these ratios could change with inputs, we look first at and for different values of , as shown in Fig. 17. We focus on 252Cf(sf) and choose relatively low values of , from 0.05 to 0.20 MeV. Again the largest effect is on the multiplicity, shown in Fig. 17(a), and for ns. The greatest difference is between MeV and 0.10 MeV. Higher values of have a smaller effect because the discrete levels tend to emit rather soft photons. This is evident from the cumulative total photon energy shown in Fig. 17(b) which is almost independent of .
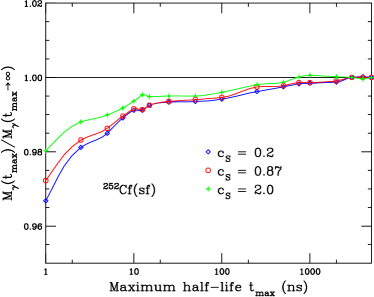
Figure 18 shows the cumulative multiplicity for several values of . The value is the best fit value from the 252Cf(sf) fit Andrew , and is the same as the results shown in Figs. 16(a) for 252Cf and in Fig. 17(a) for MeV. The other two values, and are the upper and lower limits used in the calculations shown in the previous section. The dependence on is weaker than that on . Indeed, it is sufficiently weak to make it unnecessary to show the dependence of the cumulative total photon energy .
Interestingly, the change in the cumulative multiplicity ratio is largest for the lowest value which represents the lowest rotational energy, while the effect is reduced for . Perhaps it is less likely that the long-lived isomeric states are being populated when the initial angular momentum is higher (see Fig. 8).
VI Comparison to data
We now turn to a comparison of the default results which use as determined from the fit to 252Cf(sf) data Andrew . We use MeV and ns unless otherwise specified.
VI.1 252Cf(sf)
We will compare the calculations to several previous experiments. Those by Nifenecker et al. Nifeneckergamma and Nardi et al. Nardigamma took data on photon energy as a function of fragment mass and total kinetic energy. Photon multiplicities as functions of fragment mass were measured by Pleasonton et al. PleasontonCfgamma and Johansson et al. Johansson . All these experiments were completed before the mid 1970s.
More recent experiments have not yet correlated photon production with fragment mass or kinetic energy. Billnert et al. BillnertCfgamma measured the prompt fission photon spectrum at IRMM in Belgium. The DANCE experiment at the Los Alamos Neutron Science Center reported the photon multiplicity distribution Czyzhgamma while the LiBerACE experiment at LBNL studied neutron-photon correlations by measuring the photon multiplicity distribution for two or four neutrons emitted LiBerACE .
Nifenecker et al. Nifeneckergamma placed the 252Cf source and the fragment detectors in the center of a spherical gadolinium-loaded liquid scintillator tank one meter in diameter. The neutrons were distinguished from photons by timing: the photon pulse came first, followed several microseconds later by neutrons. The pre-evaporation mass and kinetic energy of each fragment was deduced from the number of neutrons emitted. Since they could not determine which fragment emitted the photons, they reported the average photon energy from both fragments as a function of the light fragment mass and total fragment kinetic energy.
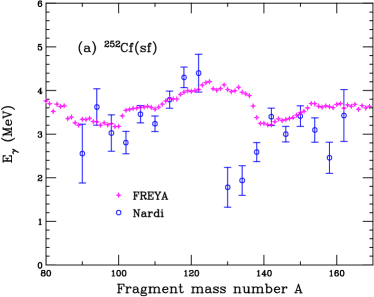
Nardi et al. Nardigamma used a thin 252Cf source placed inside a vacuum chamber with fragment detectors on both sides, also in the chamber. The photons were detected with plastic scintillators that were placed 60 cm from the source, behind the fragment detectors and outside the chamber. They separated photons from neutrons using time-of-flight techniques. Because their geometric acceptance was small, they were able to measure the total energy release due to photon emission from individual fragments, which was not possible in Nifenecker’s geometry. Thus Nardi et al. could report for each individual fragment mass, while Nifenecker et al. could report only the total emitted from both fragments combined.
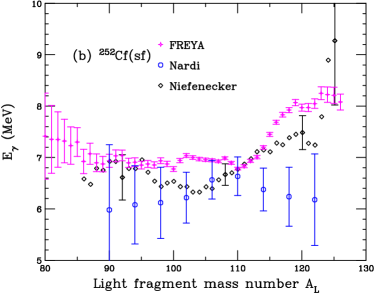
These results are shown in Fig. 19. The data as a function of from Nardi et al. Nardigamma are shown in Fig. 19(a). The agreement of the calculations with the data is generally very good, especially given the uncertainties on the data. The exceptions are the two heavy fragments closest to a symmetric mass split. In Fig. 19(b), we show the combined total photon energy from the two fragments as a function of the light fragment mass, . The only uncertainties on the Nifenecker points are those representing a typical full-width half-maximum of each , shown at , 108, 120, and 125. If these representative uncertainties are considered at all , the Nifenecker data is in relatively good agreement with both the calculations and the Nardi data. The large uncertainties on the Nardi data come from summing the uncertainties on and when folding the data from panel (a) over to obtain the total mean per fission event rather than per fragment.
As is also apparent from Fig. 19(b), the uncertainties in the calculation are the largest where the yields are the lowest, namely near symmetry () and, particularly, in the tails of the distributions (). Increasing the number of events above one million would of course reduce the uncertainties correspondingly, but the trend will remain unchanged. We note that the rise in in the calculation for corresponds to the rather abrupt decrease in between and shown in Fig. 19(a). Given the relatively large uncertainties on the Nardi data and the implied uncertainties on the Nifenecker data (where shown), it would be useful to repeat these measurements with more modern detectors.
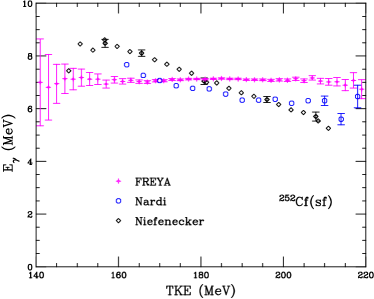
Figure 20 compares the TKE dependencies obtained by Nifenecker Nifeneckergamma and Nardi Nardigamma to the results. Again, representative uncertainties are shown for the Nifenecker data at several values of TKE (157, 166, 181, 196 and 208 MeV). Aside from the smallest values of TKE, MeV, these data decrease linearly with TKE. This behavior is similar to the decrease seen for neutrons, (TKE), in other experiments. The Nardi data, on the other hand, exhibit a slower decrease that plateaus for MeV. The overall average photon energy seems to be smaller for the Nardi measurement, as can also be observed through the comparison as a function of light fragment mass in Fig. 19(b). Note that the width of the TKE distribution is rather broad, allowing for significant photon emission up to MeV.
The calculations suggest that, at least for 252Cf(sf), is effectively independent of TKE. We have used MeV and ns in the calculations. As shown in the previous section, depends only weakly on , especially relative to the total multiplicity, . It also shows a weaker dependence on than , see Fig. 17.
Pleasonton et al. performed several experiments studying photon emission in thermal neutron-induced fission on 233,235U and 239Pu PleasontonUgamma ; Pleasonton3UPugamma as well as 252Cf(sf) PleasontonCfgamma . All four experiments were performed at Oak Ridge in the early 1970s. The setup included two surface barrier detectors to measure fragments and a sodium iodide detector to measure prompt fission photons ( ns) with energies greater than 0.122 MeV. Data were taken in two different modes, a two-parameter mode to record only fragment masses and energies and a four-parameter mode in which time of flight was used to record the difference in arrival times between photons from the two fragments. A combined analysis of the data from the two- and four-parameter mode runs allowed separation of the photon yields into those from light and heavy fragments, yielding the photon energy and multiplicity as a function of fragment mass. The neutron-induced fission data used neutrons from the ORNL reactor while, for the Cf measurements, the apparatus remained in position but the neutron beam was turned off. The Pleasonton Cf data, shown in Fig. 21, is digitized from Ref. PleasontonCfgamma where it was presented as a curve without uncertainties.
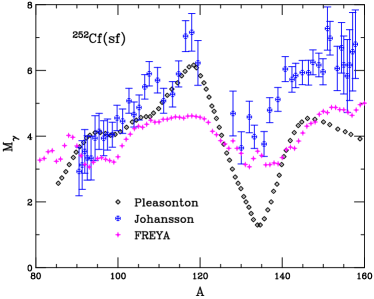
The data taken by Johansson in 1964 Johansson used a 252Cf source with two fragment detectors placed inside a thin walled, evacuated aluminum chamber. Photons were detected within 1 ns of emission using a sodium-iodide crystal. Photons from individual fragments were separated using a lead collimator: by alternating the position of the collimator results were taken for each fragment and the results from the two collimator positions summed. From spectral data for different fragment masses, Fig. 8 of Ref. Johansson , it would appear that MeV for the measurement but no explicit photon energy cutoff is given. While the photon multiplicity from the light fragment reported in this experiment is compatible with that of Pleasonton, the Pleasonton multiplicity is considerably lower for the heavy fragment. However, it is difficult to say how much the results differ without knowing the uncertainties on the Pleasonton data. If the energy cutoff is higher for Johansson than for Pleasonton, one might expect that the overall photon multiplicity would be lowered, similar to the results shown in Fig. 11.
We note that Johansson published a similar result a year later that was focused on delayed photons with emission times of ns JohanssonII . The delayed emission is more sensitive to long-lived isomers and thus to the transition lines in the RIPL database. There are prominent contributions to the delayed photon multiplicity at , 95, 110, 130, 134, and 148 which would fill in some of the dips in the prompt photon multiplicity, making the total multiplicity from the combined Johansson data sets closer to a sawtooth, as observed by John et al. John .
The results are similar to but somewhat below the multiplicity of the light fragment as given by the two data sets. Also, while the calculations underestimate the Johansson data, they are in agreement with the Pleasonton results for . The results are furthest off from the Pleasonton data close to symmetry, , where the uncertainties are likely large. While our results are not a fit to the average photon energy and multiplicity, our averages, , MeV, and MeV, are compatible with those of Pleasonton PleasontonCfgamma : , MeV, and MeV. We use the same values of and as Pleasonton, MeV and ns. Since we do not have the exact for Johansson, we use that of Pleasonton for the comparison.
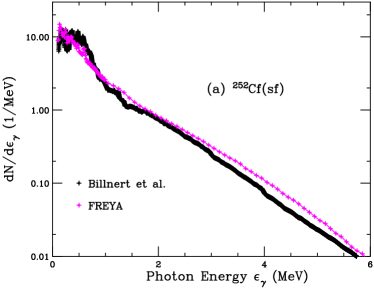
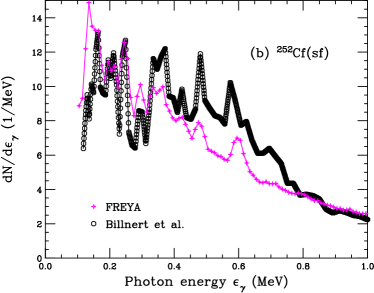
Figure 22 shows the prompt fission photon spectrum for 252Cf(sf) measured by Billnert et al. BillnertCfgamma . They have embarked on a campaign to make modern measurements of photon decay heat generated during fission, in particular for isotopes relevant for reactors. To do this, they first made measurements of the 252Cf(sf) photon spectrum. They used two different detectors: lanthanum bromide, for timing and energy resolution, and cesium bromide, because of the absence of intrinsic photon activity in this material. The energy and timing resolution for these detector materials is better than that of the sodium iodide-based detectors used in previous measurements. They were able to reduce the uncertainties of their measurement considerably relative to previous results BillnertCfgamma : ; MeV; and MeV, including relative to that of Pleasonton, mentioned above. The results for the two different detector materials agree. In this case, we use the same energy cutoff, MeV, and time window, ns, in the calculations as in the measurement.
The calculated photon spectrum is normalized to the total calculated multiplicity, , obtained for the and used by Billnert et al.. The overall agreement, shown in Fig. 22(a) is very good. (Note that the uncertainties on the measurement, shown for the lanthanum bromide detectors, are not included in the plot. With these included, the apparent agreement would improve. Incorporating the GDR into provides the harder spectrum for high energy continuum emission, as exhibited in the data.
Note that our average calculated photon energy, MeV, is higher that that measured by Billnert et al.. Thus even though our photon multiplicity is within the uncertainties of the data, the higher photon energy from results in a higher average energy per photon MeV.
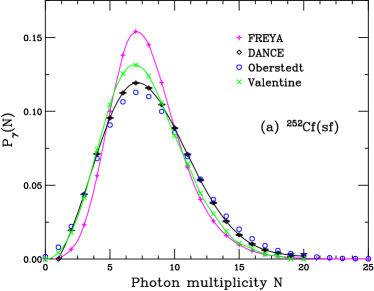
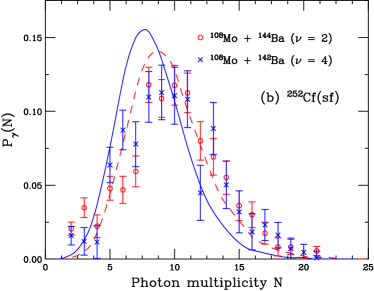
Figure 22(b) focuses on the low-energy part of the photon spectrum, MeV, where the RIPL-3 transitions play the most important role. While the magnitudes of the peaks from the data and from do not precisely match, the locations match quite well. The differences in the strength of the peaks are likely due to the rather rough manner of substituting branching ratios that are not included in the RIPL-3 tabulation. We note that without our model refinements, the calculations would underestimate the photon spectrum at high energy and would not exhibit any structure at low photon energies.
Finally, in Fig. 23, we compare to measured photon multiplicity distributions.
The prompt photon energy and the prompt photon multiplicity distribution were measured Czyzhgamma with the highly-segmented photon calorimeter of the Detector for Advanced Neutron Capture Experiments (DANCE) DANCE combined with a compact gas-filled parallel-plate avalanche counter Wuinpress . The energy and multiplicity distributions were unfolded to produce the first experimental measurement of in spontaneous fission Czyzhgamma . The unfolded multiplicity distribution makes it possible to study the moments of the photon multiplicity distribution, similar to studies making use of factorial moments of the neutron multiplicity distribution.
The distribution from DANCE, shown in Fig. 23(a), has for MeV. While the average multiplicity calculated with for this same is 7.94, within the uncertainty of the data, the distribution is significantly narrower than the data (the dispersion of the calculated distribution is 2.81, while that of the data is 3.35). The more recent results of Oberstedt et al. OberstedtPRC92 is in rather good agreement with the DANCE data. The earlier evaluation by Valentine Valentine is somewhat narrower than the more recent measurement, in better agreement with .
We note that although the introduction of thermal fluctuations in the excitation energy (through the parameter ) may affect the moments of the neutron multiplicity distribution, these fluctuations do not affect the width of the photon multiplicity distribution because a significant fraction of the excitation energy has already been carried away through neutron evaporation before photon emission begins. However, the photon multiplicity distribution is affected somewhat by the degree of angular momentum carried away during the statistical part of the photon emission cascade.
The Livermore-Berkeley Array for Collaborative Experiments (LiBerACE) used 252Cf(sf) to study photon multiplicity relative to neutron emission LiBerACE . They surrounded the 252Cf source with high-purity germanium detectors enclosed in bismuth-germanate detectors. The geometry of the detector array provided good solid angle coverage. Room background, as well as photons from cosmic rays, were subtracted by counting photons with no source present.
The LiBerACE Collaboration exploited the observation of discrete energy photons coming from known transitions in identified fission products, after neutron emission, to study neutron-photon correlations. They hoped to determine whether neutron and photon emission was positively or negative correlated. Energy and momentum-conserving calculations of neutron and photon emission in fission RVJR_spont ; LemaireGamma , such as , predicts an anti-correlation between photons and neutrons, i. e. the average photon multiplicity would decrease with increasing neutron multiplicity. On the other hand, Nifenecker et al. Nifeneckergamma suggested that there was a positive correlation between neutron multiplicity and photon energy.
They focused on two pairs of deformed even-even product nuclei, 106Mo/144Ba and 106Mo/142Ba, which are associated with the emission of two or four neutrons, respectively. They compared the photon multiplicity distributions from these product pairs. If the emission is anti-correlated, a backward shift in the centroid of the photon multiplicity distribution should be observed when comparing the first pair with the second pair, i. e. comparing two-neutron emission with four-neutron emission, and vice versa if there is a positive correlation. As seen in Fig. 23(b), there is no observable difference in the location of the centroid for the selected Mo/Ba ratios within their significant statistical uncertainties, suggesting the absence of a correlation between neutron and photon emission.
results for the photon multiplicity distribution with two and four neutrons emitted from all fragment pairs are also shown in Fig. 23(b). The calculations use the experimental value of 0.1 MeV and the time window with s. There is a clear shift in the calculations to lower photon multiplicity for the emission of four neutrons. We note, however, that the results shown here are based on all fragment pairs, not just the two Mo/Ba pairs employed in the measurement.
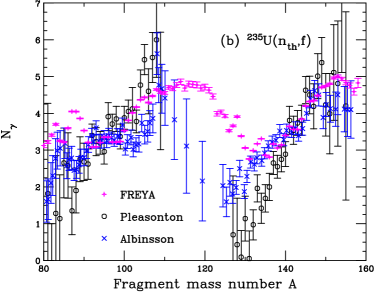
VI.2 235U(,f)
Here we compare the results to the Pleasonton measurements of photon energy and multiplicity as a function of fragment mass and total kinetic energy PleasontonUgamma as well as the multiplicity measurement as a function of fragment mass by Albinsson Albinsson . The recent spectral measurement by Oberstedt et al. BillnertUgamma is also included. We have not modified for neutron-induced fission but use the value determined from the preliminary fit to the 252Cf(sf) data, . The parameters , and TKE are tuned to 235U(,f) neutron data employing while the value of is assumed to be the same for all fissioning nuclei, both spontaneous and neutron-indiced.
The detector setup for the Pleasonton experiment was the same as for the 252Cf(sf) measurement described in the previous section except that, for this measurement, as well as for other measurements, shown in the appendix for 233U(,f) and 239Pu(,f) Pleasonton3UPugamma , the data were taken with thermal neutrons from the Oak Ridge National Laboratory research reactor. The target, in this case a 99.44% pure thin deposit of 235U3O8 on a backing, was placed at a 45∘ angle to the neutrons from the reactor. The fragment detectors were placed at 45∘ angles on either side of the target, 90∘ away from the neutron direction and in line with the sodium iodide crystal to measure photons from fission events. As described previously, the experiment was run in two different modes, the two parameter mode to study fragment masses and kinetic energies and the four parameter mode for timing to separate the photons from the light and heavy fragments. They collected 306K events in the four-parameter mode and 852K events in the two-parameter mode. In such cases, the statistics from the four-parameter mode sets the level of statistics for the data.
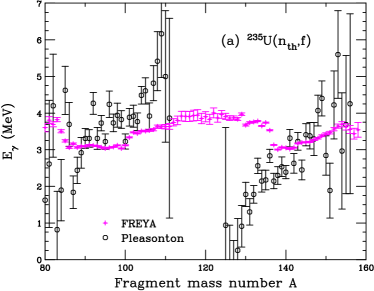
The results are compared to the Pleasonton data on photon energy as a function of fragment mass in Fig. 24(a). The uncertainties in the data are rather large and there is considerable point-to-point scatter. The trend of the data appears to be an approximately linear increase in with in both the light and heavy fragment regions. The region near symmetry, , is effectively devoid of data due to the small fragment yields in this region. The tails of the fragment distributions, and , also having small fragment yields, exhibit large uncertainties in as well. Thus the data are also effectively consistent with being independent of within one standard deviation. The calculations are nearly independent of and are also within one standard deviation of the data for and . The dependence of on in has not changed significantly with the model improvements.
Note that the statistical uncertainties on the calculation are shown as well. Since our results are based on 1M events with several photons emitted per event, the results have significantly higher statistics than the four-parameter mode of the experiment that recorded the photon data. The largest statistical uncertainties in the calculation are in the symmetric fission region.
In addition to the Pleasonton data on photon multiplicity, results from Albinsson and Lindow Albinsson are also shown in Fig. 24(b). The measurement by Albinsson and Lindow used an experimental set-up similar to Pleasonton, with a collimated neutron beam from the Studsvik R2 reactor. However, similar to the Johansson measurement Johansson , they used a movable lead collimator to track fragments from individual fragments and for timing purposes. Their results are similar to those from Pleasonton although the multiplicity trends lower for Albinsson for and higher for . We note that the calculation shown is done using the values of and suitable for the Pleasonton experiment. These values are, however, compatible with those used in the measurement by Albinsson and Lindow. Given the large uncertainties in the two data sets, the agreement with the calculation is good. Comparison with Fig. 2(b) shows that the model refinements makes the shape of more compatible with the data.
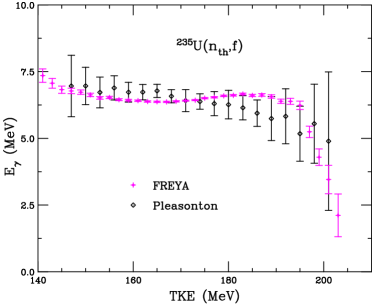
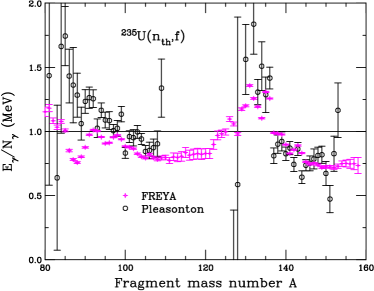
Figure 25 compares the energy per photon from Pleasonton with . Overall, the agreement is quite good. The calculation reproduces the peak in near . We note that only including the model improvements produces the peak in at , see Fig. 3. While there are some differences for , due to a small enhancement in the photon multiplicity for , producing a dip in at this value of , the uncertainties are large enough for the two to still be reasonably compatible. The results for the mean photon multiplicity, total photon energy, and energy per photon, ; MeV; and MeV, agree well with those of Pleasonton PleasontonUgamma , ; MeV; and MeV, and are also compatible with the earlier measurement of Verbinski et al. Verbinski .
Our results are also compared to the photon energy as a function of total kinetic energy in Fig. 26. Contrary to the 252Cf(sf) calculation shown in Fig. 20, the calculation for 235U(,f) is not independent of TKE. Although the curvature appears to be somewhat different than that of the data, the results agree within the uncertainties. Note also the falloff of the calculation for MeV, due to the narrower TKE distribution for 235U(,f) relative to 252Cf(sf). In this case the upper bound of TKE is 205 MeV.
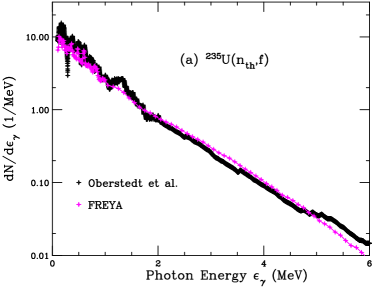
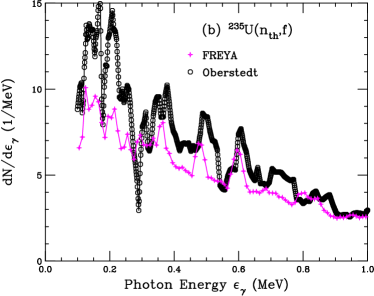
Finally, we compare our calculated prompt fission photon spectrum to the results of Oberstedt et al. BillnertUgamma . This measurement is a continuation of the work of Billnert et al. BillnertCfgamma for 252Cf(sf) shown in Fig. 22 with the same detectors and values of and as in that work. In this case the measured high-energy slope of the photon energy spectrum is in good agreement with the calculation, even without including the experimental uncertainties. Without our model refinements, the calculations would underestimate the photon spectrum at high energy and would not exhibit any structure at low photon energies. The peaks observed in the low-energy part of the photon spectrum, shown in Fig. 27(b), also agree well with the calculation. Oberstedt et al. measured , MeV, and MeV, while, for the same cutoffs, we find , MeV, and MeV. The somewhat lower values of and for this experiment results in the slightly higher calculated here than the calculation for the Pleasonton data.
We note that, overall, we have achieved rather good agreement with the photon data, despite not having made any global parameter analyses to extract specifically for 235U(,f).
VII Conclusions
We have shown that the inclusion of the GDR form factor and the RIPL-3 transitions into has improved the photon emission process, resulting in better agreement with photon observables as compared to our previous work RVJR_gamma . In particular, there is significant improvement for the photon energy spectrum and the dependence of the energy per photon. However, there is still room for further improvements, particularly with regard to the shape of the photon multiplicity distribution. We will return to this in future work.
We have also studied the sensitivity of our results to the degree of rotation imparted to the fragments during scission by means of the scale factor controlling the ratio between the fragment spin temperature and the scission temperature. Furthermore, we have illustrated how the photon energy and the photon multiplicity measured by different experiments depend on detector characteristics such as the minimum energy of the detected photons, , and the time window over which the measurement is made, .
The calculations were made with a value of optimized for 252Cf(sf). (Note that, as mentioned in Sec. VI.2, the parameters , , and TKE were tuned to the neutron observables for the fixed value .) Even so, the agreement of our results with photon measurements in neutron-induced fission is also quite good. Further improvement can likely be obtained by performing a global parameter optimization including , a subject of future work.
We expect that the quality of the agreement of the calculations with experimental data will continue to improve as further model refinements are made and more measurements become available for both optimization and predictive capability, for example, fission induced by (d,) scattering, see Ref. Oslo .
Acknowledgments
We thank P. Talou for helpful discussions. This work was supported by the Office of Nuclear Physics in the U.S. Department of Energy’s Office of Science under Contracts No. DE-AC52-07NA27344 (RV) and DE-AC02-05CH11231 (JR), as well as by the U.S. Department of Energy’s National Nuclear Security Administration
Appendix A 233U(,f) and 239Pu(,f)
In this appendix we compare our results with those measured by Pleasonton for 233U(,f) and 239Pu(f,) Pleasonton3UPugamma . The experimental setup is the same as for the previously described Pleasonton measurements of 235U(,f). The values of and were the same as those for the measurement. In both cases, , obtained for 252Cf(sf), is used in the calculations. The values of , and TKE were fixed to neutron observables. We are working toward global analyses, including fitting to the data, in the future. Nonetheless, we can already check whether or not the calculated trends are reasonable.
A.1 233U(,f)
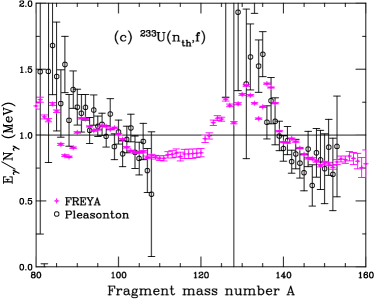
For 233U(,f), a 99.9% pure 233U3O8 target was placed on a carbon film; 920K events were collected in the two-parameter mode and 350K events in the four-parameter mode.
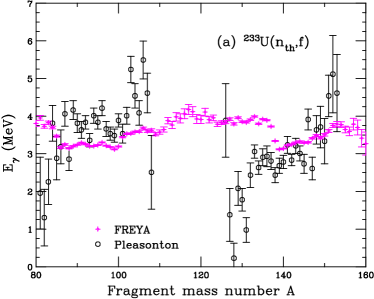
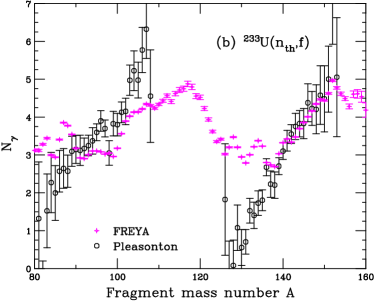
The results for the total photon energy, photon multiplicity, and energy per photon are shown in Fig. 28. The trends of the calculations and the data are similar. Here the total photon energy appears to have a somewhat weaker dependence on fragment mass than did the 235U measurement in Fig. 24(a).
The measured average multiplicities and energies are ; MeV; and MeV. Our calculations give ; MeV; and MeV, in very good overall agreement with the data.
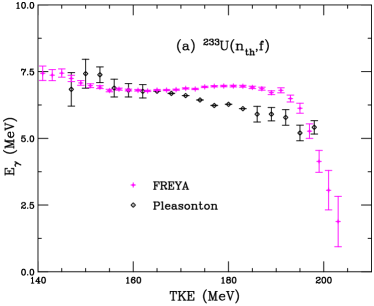
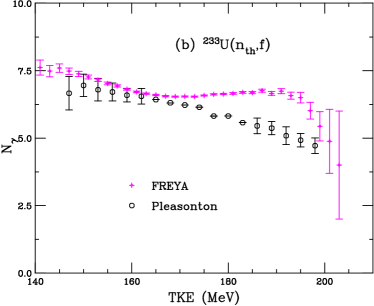
The total photon energy and multiplicity are shown as functions of the total fragment kinetic energy in Fig. 29. The calculated shape is similar to that obtained for 235U. Here, however, the measured uncertainties shown are smaller than those for 235U, giving a clearer suggestion of small decrease in both and with TKE. The calculations agree with the data for MeV.
A.2 239Pu(,f)
For 239Pu(,f), a 99.11% pure 239PuO2 target was deposited on a carbon film; 641K events were collected in the two-parameter mode and 209K events in the four-parameter mode.
The results for the total photon energy, photon multiplicity, and energy per photon are shown in Fig. 30. The trends of the calculations and the data are similar and the agreement is generally good. However, the low statistics of this data set make it difficult to conclude anything substantial.
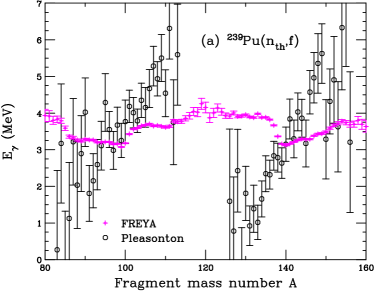
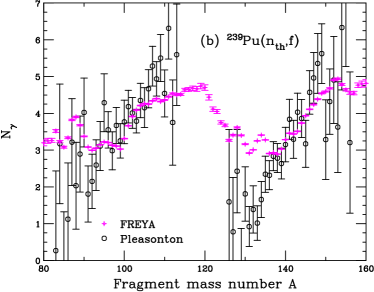
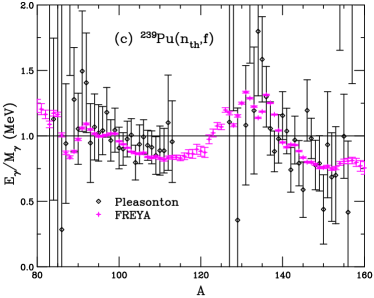
The measured average multiplicities and energies are ; MeV; and MeV. Our calculations give ; MeV; and MeV. While our calculated averages are somewhat higher than the data, they are still within the uncertainties.
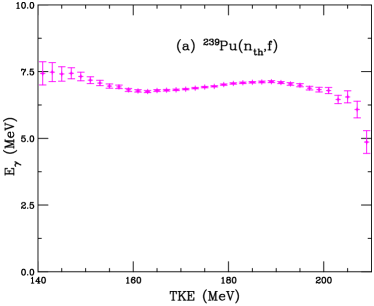
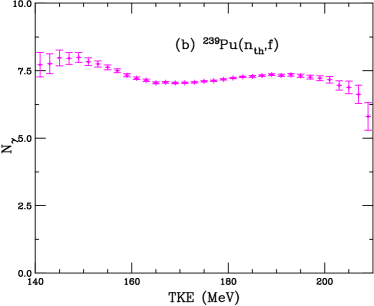
For completeness, the photon energy and multiplicity are shown as functions of TKE in Fig. 31. The results are similar to those for the other neutron-induced fission calculations shown above. No data were available for comparison for this case. Note that the calculations extend to higher values of TKE than for 233U(,f) and 235U(,f) because the tail of the TKE distribution extends to higher TKE for 239Pu(,f), up to 215 MeV.
References
- (1) R. Vogt, J. Randrup, D. A. Brown, M. A. Descalle, and W. E. Ormand, Event-by-event evaluation of the prompt fission neutron spectrum from 239Pu(,f), Phys. Rev. C 85, 024608 (2012).
- (2) R. Vogt and J. Randrup, Event-by-event study of photon observables in spontaneous and thermal fission, Phys. Rev. C 87, 044602 (2013).
- (3) J. Verbeke, R. Vogt, and J. Randrup, Fission Reaction Event Yield Algorithm, – For event-by-event simulation of fission, Comp. Phys. Comm. 191, 178 (2015).
- (4) J. Verbeke, R. Vogt, and J. Randrup, Comp. Phys. Comm. 222, 263 (2018).
- (5) R. Vogt, A. Nicholson, J. Randrup, I. Gauld, and S. Croft, Uncertainty Quantification with the Event-by-Event Fission Model FREYA, Proc. 1st ANS Advances in Nuc. Nonpro. Tech. and Policy, Santa Fe, NM, 2016, LLNL-CONF-690741.
- (6) R. Vogt and J. Randrup, Event-by-event study of neutron observables in spontaneous and thermal fission, Phys. Rev. C 84, 044621 (2011).
- (7) J. Randrup and R. Vogt, Refined treatment of angular momentum in the event-by-event fission model , Phys. Rev. C 89, 044601 (2014).
- (8) R. Vogt and J. Randrup, Neutron angular correlations in spontaneous and neutron-induced fission, Phys. Rev. C 90, 064623 (2014).
- (9) B. L. Berman and S. C. Fultz, Measurements of the giant dipole resonance with monoenergetic photons, Rev. Mod. Phys. 47, 713 (1975).
- (10) R. Capote et al., RIPL – Reference Input Parameter Library for Calculations of Nuclear Reactions and Nuclear Data Evaluations, Nucl. Data Sheets 110, 3107 (2009).
- (11) K. H. Schmidt, B. Jurado, C. Amouroux, and C. Schmitt, General Description of Fission Observables: GEF Model Code, Nucl. Data Sheets 131, 115 (2016).
- (12) O. Litaize, O. Serot and L. Bergé, Fission modeling with FIFRELIN, Eur. Phys. J. A 51, 177 (2015).
- (13) P. Talou, T. Kawano, and I. Stetcu, CGMF, Version 1.0, Tech. Rep. LA-CC-13-063, Los Alamos National Laboratory (2013).
- (14) W. Mannhart, The high energy portion of the Cf-252 neutron spectrum deduced from integral experiments, in Proceedings of an Advisory Group Meeting on Properties of Neutron Sources, (IAEA-TECDOC-410), Vienna (1987) pp. 194-201.
- (15) J. W. Boldeman and M. G. Hines, Prompt Neutron Emission Probabilities Following Spontaneous and Thermal Neutron Fission, Nucl. Sci. Eng. 91, 114 (1985).
- (16) V. N. Dushin et al., Facility for neutron multiplicity measurements in fission, Nucl. Instrum. Meth. A 516, 539 (2004).
- (17) C. Budtz-Jørgensen and H.-H. Knitter, Simultaneous investigation of fission fragments and neutrons in 252Cf(sf), Nucl. Phys. A 490, 307 (1988).
- (18) R. Billnert, F.-J. Hambsch, A. Oberstedt, and S. Oberstedt, New prompt spectral -ray data from the reaction 252Cf(sf) and its implication on present evaluated nuclear data files, Phys. Rev. C 87, 024601 (2013).
- (19) A. Chyzh et al., Systematics of prompt -ray emission in fission, Phys. Rev. C 85, 02160(R) (2012).
- (20) P. Talou, T. Kawano, I. Stetcu, J. P. Lestone, E. McKigney, and M. B. Chadwick, Late Time Emission of Prompt Fission Gamma Rays, Phys. Rev. C 94, 064613 (2016).
- (21) A. Göök, F.-J. Hambsch, and M. Vidali, Prompt neutron multiplicity in correlation with fragments from spontaneous fission, Phys. Rev. C 90, 064611 (2014).
- (22) P. Talou, B. Becker, T. Kawano, M. B. Chadwick, and Y. Danon, Advanced Monte Carlo modeling of prompt fission neutrons for thermal and fast neutron-induced fission reactions on 239Pu, Phys. Rev. C 83, 064612 (2011).
- (23) B. Becker, P. Talou, T. Kawano, Y. Danon, and I. Stetcu, Monte Carlo Hauser-Feshbach predictions of prompt fission -rays: Application to U, Pu, and 252Cf(sf), Phys. Rev. C 87, 014617 (2013).
- (24) I. Stetcu, P. Talou, T. Kawano, and M. Jandel, Properties of prompt-fission -rays, Phys. Rev. C 90, 024617 (2014).
- (25) H. Nifenecker, C. Signarbieux, M. Ribrag, J. Poitou, and J. Matuszek, Gamma-neutron competition in the de-excitation mechanism of the fission fragments of 252Cf, Nucl. Phys. A 189, 285 (1972).
- (26) E. Nardi, A. Gavron, and Z. Fraenkel, Total Energy Associated with Prompt gamma-Ray Emission in the Spontaneous Fission of Cf-252, Phys. Rev. C 8, 2293 (1973).
- (27) F. Pleasonton, R. L. Ferguson, and H. W. Schmitt, Prompt Gamma Rays Emitted in the Thermal Neutron-Induced Fission of 233U, 235U, and 239Pu and the Spontaneous Fission of 252Cf, ORNL report 4844 (1972) pp. 109-112.
- (28) S. A. E. Johansson, Gamma de-excitation of fission fragments: (1) Prompt radiation, Nucl. Phys. 60, 378 (1964).
- (29) F. Pleasonton, R. L. Ferguson, and H. W. Schmitt, Prompt Gamma Rays Emitted in the Thermal-Neutron-Induced Fission of 235U, Phys. Rev. C 6, 1023 (1972).
- (30) F. Pleasonton, Prompt -rays emitted in the thermal-neutron induced fissio of 233U and 239Pu, Nucl. Phys. A 213, 413 (1973).
- (31) S. A. E. Johansson, Gamma de-excitation of fission fragments: (2) Delayed radiation, Nucl. Phys. 64, 147 (1965).
- (32) W. John, J. J. Wesolowski, and F. Guy, Mass dependent structure in the fission -ray yields from 252Cf, Phys. Lett. B 30, 340 (1969).
- (33) D. L. Bleuel et al., Gamma-ray multiplicity measurement of the spontaneous fission of 252Cf in a segmented HPGe/BGO detector array, Nucl. Instr. Meth. A 624, 691 (2010).
- (34) A. Oberstedt, R. Billnert, F.-J. Hambsch, and S. Oberstedt, Impact of low-energy photons on the characteristics of prompt fission -ray spectra, Phys. Rev. C 92, 014618 (2015).
- (35) T. E. Valentine, Evaluation of prompt fission gamma rays for use in simulating nuclear safeguard measurements, Annals Nucl. Energy 28, 191 (2001).
- (36) M. Heil et al., A 4 BaF2 detector for (n,g) cross section measurements at a spallation neutron source, Nucl. Instr. Meth. A 459, 229 (2001).
- (37) C. Y. Wu et al., A compact gass-filled avalanche counter for DANCE, Nucl. Instr. Meth. A 694, 78 (2012).
- (38) S. Lemaire, P. Talou, T. Kawano, M. B. Chadwick, and D. G. Madland, Monte Carlo approach to sequential -ray emission from fission fragments, Phys. Rev. C 73, 014602 (2005).
- (39) H. Albinsson and L. Lindow, Prompt Gamma Radiation from Fragments in the Thermal Fission of 235U, Atomenergie Studavik, Sweden, Report AE-398 (1970), unpublished.
- (40) A. Oberstedt et al., Improved values for the characteristics of prompt-fission -ray spectra from the reaction 235U(,f), Phys. Rev. C 87, 051602(R) (2013).
- (41) V. V. Verbinski, H. Weber, and R. E. Sund, Prompt Gamma Rays from 235U(,f), 239Pu(,f), and Spontaneous Fission of 252Cf, Phys. Rev. C 7, 1173 (1973).
- (42) S. J. Rose et al., Energy dependence of the prompt -ray emission from the (d,)-induced fission of 234U∗ and 240Pu∗, Phys. Rev. C 96 014601 (2017).