Dwarf Galaxy Discoveries from the KMTNet Supernova Program* I. The NGC 2784 Galaxy Group
Abstract
We present surface photometry of 31 dwarf galaxy candidates discovered in a deep image stack from the KMTNet Supernova Program of 30 square degrees centered on the nearby NGC 2784 galaxy group. Our final images have a 3 surface brightness detection limit of mag arcsec-2. The faintest central surface brightness that we measure is mag arcsec-2. If these candidates are at the distance of NGC 2784, then they have absolute magnitudes greater than mag and effective radii larger than 170 pc. Their radial number density decreases exponentially with distance from the center of NGC 2784 until it flattens beyond a radius of 0.5 Mpc. We interpret the baseline density level to represent the background contamination and so estimate that 22 of the 31 new candidates are dwarf members of the group. The candidate’s average color, , and Sérsic structural parameters are consistent with those parameters for the dwarf populations of other groups. We find that the central population of dwarfs is redder and brighter than the rest of the population. The measured faint end slope of the luminosity function, , is steeper than that of the Local Group but consistent with published results for other groups. Such comparisons are complicated by systematic differences among different studies, but will be simpler when the KMTNet survey, which will provide homogenous data for 15 to 20 groups, is completed.
1 Introduction
Dwarf galaxies in nearby ( 10 Mpc) galaxy groups are probes of the evolution of low mass galaxies in low density environments. Their properties, such as the luminosity function or radial distribution within a group, are often used as tests of conventional hierarchical cosmology models. For example, one challenge to the simple standard paradigm is that the number of dwarf galaxies predicted in a CDM model is much larger than that observed near the Milky Way (Klypin et al., 1999; Moore et al., 1999). Various solutions to this problem have been suggested, such as suppression of galaxy formation by photoionization (Benson et al., 2002; Cooper et al., 2010) and a steeply declining relation between stellar mass and halo mass (Behroozi et al., 2010), and the problem has lessened with the subsequent discovery of numerous faint Milky Way dwarf galaxies in surveys like the Sloan Digital Sky Survey (McConnachie, 2012) and the Dark Energy Survey (Bechtol et al., 2015; Drlica-Wagner et al., 2015). Nevertheless, the apparent conflict helped focus theoretical work on aspects of the quenching of star formation in low-mass group galaxies (Wetzel et al., 2012; Presotto et al., 2012) and observational work on addressing deficits in the original data.
Several recent searches for new dwarf galaxies in nearby groups have exploited CCD cameras with wide fields of view ( 1 ). Chiboucas et al. (2009) reported 22 new dwarf galaxies found in an area of 65 around the M81 group using CFHT/MegaCam. Müller et al. (2015) found 16 new dwarf galaxies in an area of 60 around M83 using Dark Energy Camera (DECam) at the CTIO 4-m telescope. The same group also reported 40 new dwarf galaxy candidates in the Centaurus group region (Müller et al., 2017). Other studies have explored the NGC 5128 group (Crnojević et al., 2016), the M 106 group (Kim et al., 2011), the NGC 1023 group (Trentham & Tully, 2009), and the M 101 group (Merritt et al., 2014). These studies all discovered new dwarf galaxies, reaching as faint as mag. An aim of these studies is to establish the general properties of dwarf galaxies in groups and identify any variations that depend on group properties. However, despite all of this recent progress it is difficult to construct a coherent picture because comparing among different studies is undermined by systematic differences in data quality, selection criteria, and methodology. So motivated, we are carrying out a search for dwarf galaxies around other nearby galaxy groups using a single, large survey. We present our first results here.
The NGC 2784 group contains the lenticular-type NGC 2784 galaxy and at least ten other galaxies (Fouque et al., 1992; Garcia, 1993; Karachentsev et al., 2013). The distance measurement, 9.8 Mpc, comes from applying the surface brightness fluctuation method (Tonry et al., 2001). This galaxy group is among the fields targeted by the KMTNet (Korean Microlensing Telescope Network) Supernova Program (KSP; Moon et al., 2016), which is an international supernovae search with associated follow-up photometry using three 1.6-m telescopes. The field of view of these telescopes is extremely wide (4 per exposure) and we utilize the total exposure obtained over several hundreds of individual images obtained for the supernova and optical transient (He et al., 2016) search.
This paper is organized as follows. In Section 2 we describe the observations and data reduction. In Section 3, we discuss the search technique and the surface photometry of the dwarf galaxy candidates. In Section 4, we present the properties of the NGC 2784 group and discuss our results in comparison to those published for other galaxy groups.
2 Observations and Data Reduction
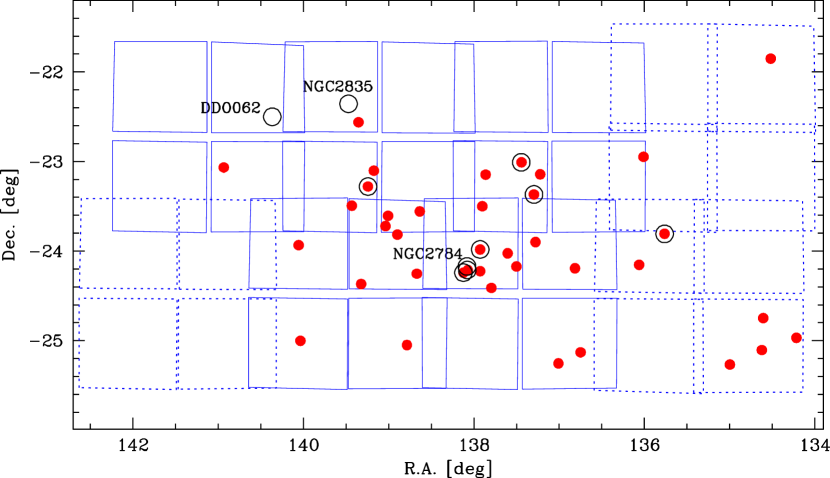
We carried out observations of eight fields around NGC 2784 using the KMTNet facility (Kim et al., 2016) between February and July of 2015. KMTNet is a network of three new wide-field 1.6-m telescopes, located at the Cerro Tololo Inter-American Observatory (CTIO, Chile), the South African Astronomical Observatory (SAAO, South Africa), and Siding Spring Observatory (SSO, Australia). Each telescope is equipped with a wide-field CCD camera covering 4 (2) with 0.4 pixel-1 sampling. The detector is a mosaic of four 9K 9K E2V chips with a small gap between chips, and each chip corresponds to field. We used filters and the exposure time for an individual frame was fixed to be 60 sec for any of the filters. In Figure 1 we overlay the positions of the dwarf galaxy candidates discovered in this work (see Section 3) on top of the eight observed fields. We observed five of the eight fields several hundred times through each filter and the remaining three fields only tens of times.
After pre-processing the raw images, which includes crosstalk correction, overscan subtraction, and flat fielding, we do the astrometric calibration using the routine (Bertin et al., 2006) with the GSC-2.3 reference catalog for each of the four 1 chips. We then apply the routine (Bertin et al., 2002) to create deep, stacked images. At that time, to subtract the sky, we use ’s background subtraction and a mesh size with 512 pixels. We only use images with seeing better than 2 arcsec, resulting in an average seeing for our final stacked images that is better than 1.5 arcsec in all filters. Tables 1 and 2 list the details of the fields and observations.
We derive transformation equations between instrumental magnitudes () and standard Johnson-Cousins magnitudes () using the APASS (AAVSO Photometric All-Sky Survey) catalog (APASS, 2015). We use the equations as follows:
| (1) |
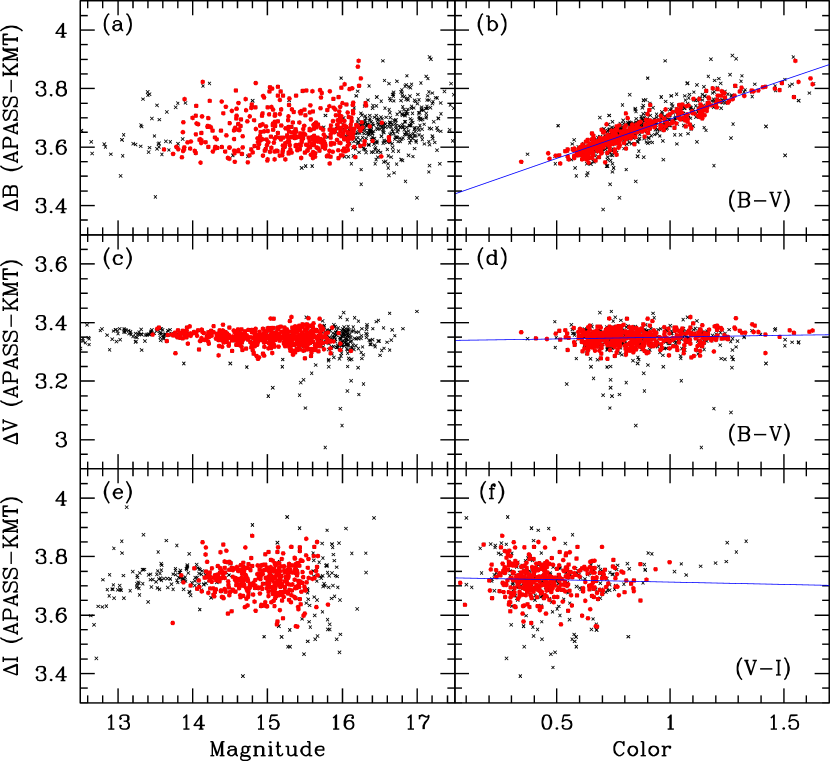
Here, is the color coefficient and is the zero point magnitude for each filter. The -band magnitude is referenced to the Sloan -band magnitude because the APASS catalog includes only Sloan -band magnitudes. We derive transformation equations for each chip by matching the magnitudes of bright point sources measured using (Bertin & Arnouts, 1996) to the APASS catalog. In the case of the deep image stacks, values are approximately 3.4, 3.4, and 3.7 magnitudes and values are about 0.02, 0.02, and 0.04 magnitudes for the -bands, respectively. In the case of the shallow image stacks, values are approximately 4.0, 3.9, and 4.2 magnitudes and values are about 0.03, 0.03, and 0.07 magnitudes for the -bands, respectively. The color coefficient for both the deep or shallow image stacks is 0.27. The number of point sources used in the calibration is about 300 per chip. Figure 2 is an example (N2784-4-Q0 field including the NGC 2784 galaxy) of how differences in the pass bands between APASS and KMT propagate to color dependencies. The -band only shows significant color dependency. We note that the relatively larger scatter at the -band is caused by the different filter system between KMTNet and APASS. We correct the measured magnitudes for foreground Galactic extinction of , , and (Schlafly & Finkbeiner, 2011)111We pause here to clarify a variety of potentially confusing notation. First, we only apply extinction corrections to total magnitudes and colors. If such corrections have been applied, then we signify that with a subscript 0, as in . If no subscript is included, then the corrections have not been applied. Second, for historical consistency we also use the subscript 0 to refer to central values, as in the central surface brightness, . The subscript here does not imply that an extinction correction was applied. Third, we also use the subscript zero on a scaling radius, , that is different from the effective radius, . The relationship between the scaling radius and depends on the Sérsic index, ..
3 Results
3.1 Searching for Dwarf Galaxy Candidates
Three of us (H. S. Park, M. Pak, and S. C. Kim) visually select dwarf galaxy candidates. We contend that visual identification is more complete and less contaminated than current automatic detection methods (Kim et al., 2011; Müller et al., 2015). Our selection criteria, applied to images displayed using the option in , are that (1) there must be a diffuse stellar component that extends at least arcsec, (2) the object must not exhibit any distinct structure (e.g. such as spiral structure) except for a possible nuclear point source, and (3) the object must not have a steep surface brightness gradient between the center and the edge, such as that expected for luminous background galaxies. Our selection is mainly based on the -band images, but we use the and -band images as well as the RGB color images made from the three bands to rule out artifacts. HSP, MP, and SCK searched the images independently and then compared results. For the targets selected by only one or two classifiers, all three classifiers reviewed the object and reached a consensus on whether to retain or reject the candidate.
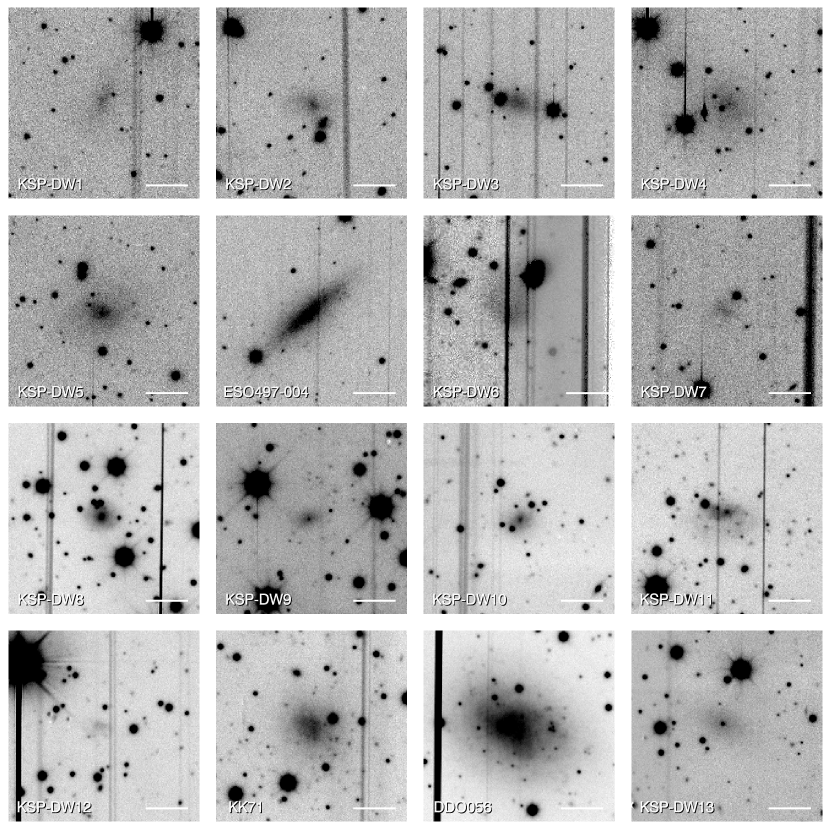
We visually inspect each chip in each of the eight NGC 2784 fields, including both the shallow and deep image stacks. We detect 38 objects that we classify as dwarf galaxy candidates and plot their positions in Figure 1. There are 7 previously identified dwarf candidates in the NGC 2784 fields (Karachentsev et al., 2013). We recover all of them. Three (ESO497-004, DDO 056, HIPASS J0916-23b) of these have been spectroscopically confirmed to be members (Doyle et al., 2005; Fisher & Tully, 1981; Karachentsev et al., 2008), while the other four (KK71, KK72, NGC2784 dw01, KK73) await spectroscopic confirmation. In addition, the group also contains three brighter galaxies (NGC 2784, NGC 2835, DDO 062) that have been spectroscopically confirmed as members. We present band greyscale images of all the dwarf galaxy candidates in Figures 3. Many of the images have evident vertical lines, which are due to charge bleeds or blooming caused by saturation of the bright foreground stars on the CCD images. These artifacts do not affect our candidate detection because the sources are more extended nor do they affect our surface photometry because we mask the artifacts (see Section 3.2). The candidates exhibit a range of morphologies and sizes, and sometimes have an evident unresolved nuclear source.
We test our completeness and limiting brightness by inserting artificial sources in the images. We adopt exponential surface brightness () profiles and central brightness and effective radii distributions that reproduce the effective radius – magnitude trend of our NGC 2784 dwarf candidates (Figure 7 and Section 3.5). We insert several hundred artificial galaxies in the -band image that includes NGC 2784 using the mkobjects task in the IRAF/artdata package. We then reapply our visual inspection technique. We find that for ( at the distance of NGC 2784) we are 90% complete. The last thumbnail image in Figure 3 contains an artificial dwarf galaxy at this magnitude limit ( mag and pixel). Several studies have shown that the surface brightness of dwarf galaxies can be described by a Sérsic profile and their Sérsic index distribution is peaked around (Ferrarese et al., 2006; Muñoz et al., 2015). Thus, we also carry out the completeness test with . We find that for () we are 90% complete. We present detections down to , so we expect to be significantly incomplete at our limiting magnitude. In addition, our completeness simulations do not account for other possible populations. For example, we do not include ultra compact dwarf galaxies that we might have considered to be stars or background galaxies. Therefore, the number 38 is a lower limit on the number of the dwarf candidates in these fields.
3.2 Surface Photometry
We measure the surface brightness profiles of the 38 dwarf candidates in using the IRAF/ELLIPSE task. We fix the center coordinates, ellipticities, and position angles, which we estimate near the effective radius of each candidate. We use linear semi-major axis steps of 1.0 arcsec for the smaller candidates and 1.5 arcsec for the larger ones. The brightness of each isophote is measured from mean isophotal flux, and its error is the root-mean-square scatter of the isophotal flux values. The instrumental brightnesses obtained from this surface photometry are transformed using the transformation equations (Equation 1 in Section 2).
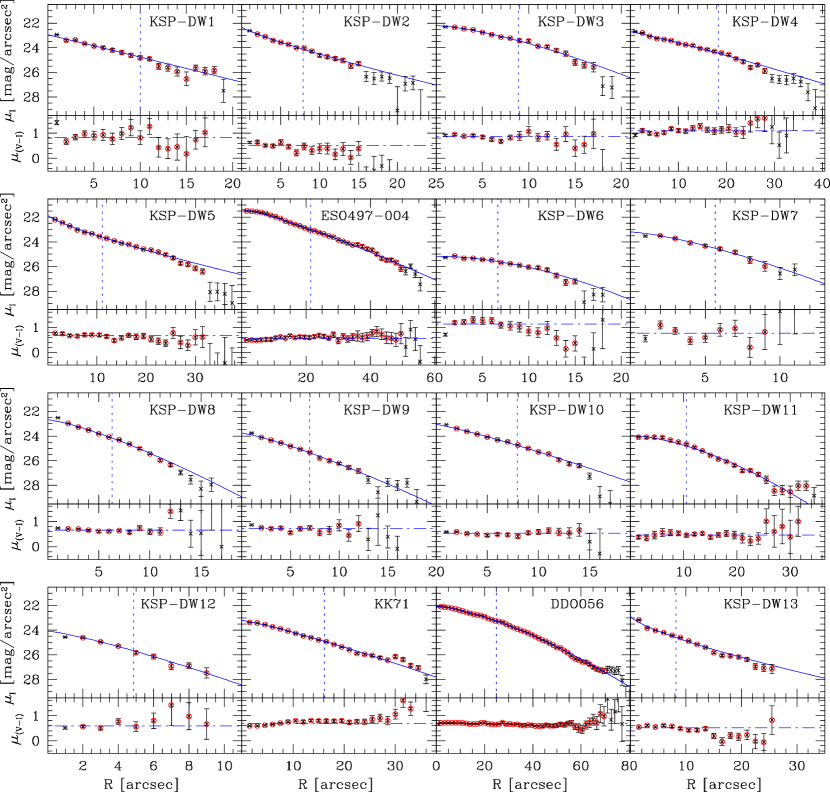
We present the surface brightness and color profiles in Figure 4. Most candidate have surface brightness profiles that are well described as exponential () and have constant color profiles. The 3 faintest surface brightnesses reached on our shallow and deep image stacks are () mag arcsec-2 and () mag arcsec-2, respectively. In the color profile panels, the dot-dashed line represents the weighted mean value. We adopt these mean values ( and ) as the colors ( and ) of the dwarf candidates. The total magnitudes are estimated from the extrapolation of a fitted brightness profile, and -band signal is relatively much shallower due to same exposure time in each band (). Thus, in this study the mean value from brightness profiles is more efficient for representing the color of each dwarf. The color ranges are and .
We fit Sérsic functions () to the surface brightness profiles, where , , and are the central surface brightness, scale length, and Sérsic curvature index, respectively. We adopt the 1-sigma statistical errors computed from the non-linear least squares fitting procedure (Markwardt, 2009) as the errors for the Sérsic parameters. We show these fits with solid curves in Figure 4. As a test, we compare the profiles of the dwarf candidates that were observed in overlapping images (Figure 1). The resulting profile parameters are statistically consistent. The faintest central surface brightnesses among the dwarf candidates are , , and mag arcsec-2. The Sérsic scale lengths range from 223 arcsec, and the curvature indices from , with median value of 0.8 . The total magnitudes of the dwarf candidates using these fits, following the method described in Section 3.1 of Chiboucas et al. (2009), result in the faintest , , and being 20.5, 20.6, and 21.7 mag, respectively. The smallest -band effective radius () is arcsec (corresponding to pc at the distance of NGC 2784).
3.3 The NGC 2784 Dwarf Galaxy Catalog
We present the photometric catalog for the 38 dwarf candidates in Table 3. The first column contains our identification or the previously established galaxy name if available (Karachentsev et al., 2013). The second and third columns have the central R.A. (J2000) and Dec. (J2000). The 4th column presents the -band total magnitude derived from the Sérsic fit result. The 5th and the 6th columns list the and colors, respectively. Because the Galactic extinction values toward NGC 2784 are depend on an adopted extinction map or calibration, we present the colors without the extinction correction. The 7th, 8th, and 9th columns contain the central surface brightness (), scale length (), and curvature index () derived for the Sérsic fit, respectively. The band as derived from our fits is in the 10th column. We could not reliably measure for KSP-DW6, and and for KSP-DW23 due to the low surface brightness of these galaxies.
3.4 Radial Number Density
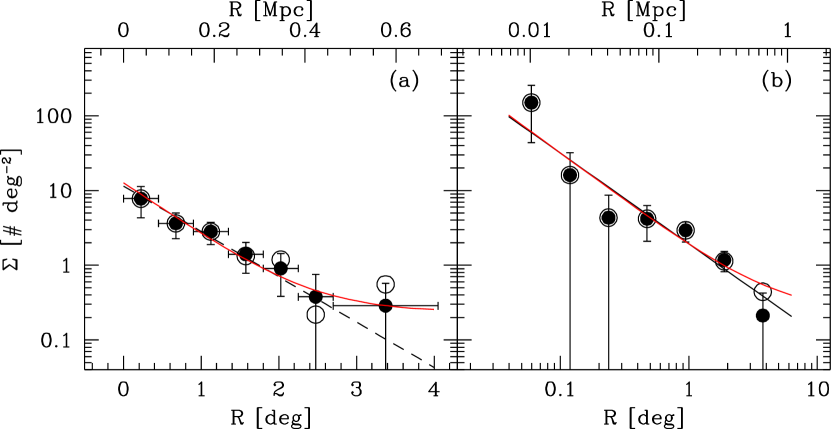
We present the number density of dwarf candidates in the NGC 2784 field as a function of the projected radius () from the center of the stellar light of NGC 2784 in Figure 5. Here, we carefully estimate the unit ’projected area’ due to complex survey coverage (e.g. overlapped area, rectangular coverage on the whole) as seen in Figure 1, and we adopt density errors assuming a Poisson distribution. The number density, obtained from the visually identified dwarfs only in the region covered by deep stack images, decreases outwardly until the last bin ( degree) where it flattens. We interpret the baseline flat level as indicating that we have reached the background density of objects that satisfy our selection criteria. It is possible that the profile of true dwarfs flattens somewhat at large radii, but conservatively we interpret this as the contamination level. In contrast, when we examine the density profile using the region covered by shallow and deep stacks, it rises at the outermost bin even though we expect the shallow stacks to be more incomplete. However, most objects in this bin are concentrated in the south-west region and located at degree from the NGC 2784. We suspect that these candidates are contaminants.
When we fit the density distribution from only the deep stack results with an exponential profile plus a constant value, we find that the surface density () is described by . The constant value (0.24 deg-2) is the contamination level. The density profile is also well described by a power-law with equal logarithmic interval (Figure 5b). That fit has . This power index () is consistent with the power index () obtained from an equal linear interval. Integrating this exponential fit and comparing the number of dwarf candidates that are radially clustered about NGC 2784 to those that are not suggests that 15% (5) of the 32 candidates within degree are not dwarfs associated with NGC 2784. Additionally, 6 ( degree) out of the 38 dwarf candidates may also be not associated with NGC 2784.
3.5 Comparison to Dwarf Galaxies in Other Systems
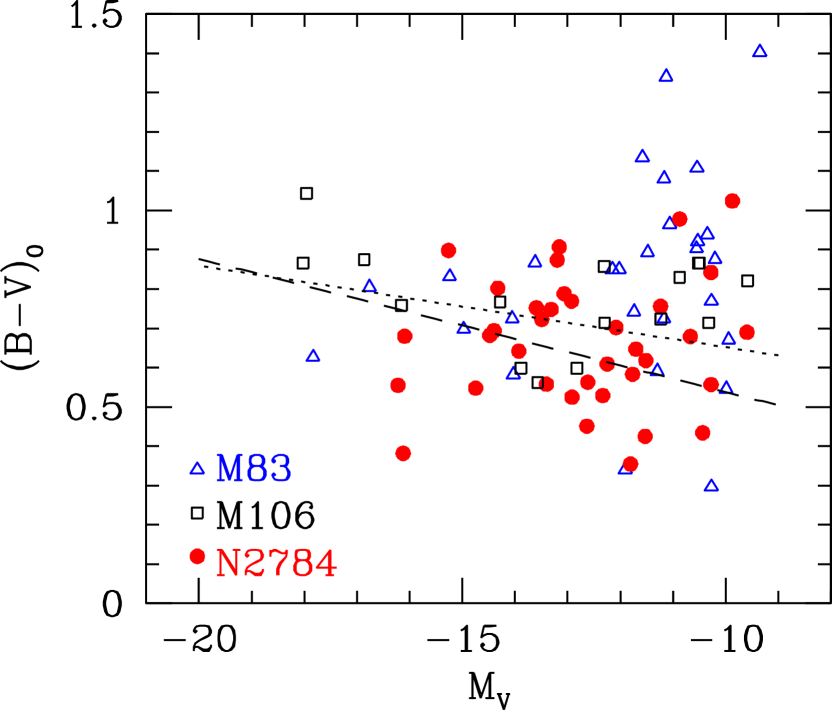
In Figure 6 we present the color-magnitude diagram for the candidate dwarf population of NGC 2784. The mean values of and , which are corrected the Galactic extinction, are and , respectively. The mean color is similar to those for the M106 (; Kim et al., 2011) and the M83 groups (; Müller et al., 2015). For comparison, we overlay the values of dwarf galaxies in other groups (M83 from Müller et al. (2015), M106 from Kim et al. (2011)) and the color-magnitude relations of the early-type galaxies in clusters (Virgo from Lisker et al. (2008), and Ursa Major from Pak et al. (2014)). We conclude that the color distributions are consistent and that the NGC 2784 dwarfs are mostly early-type galaxies.
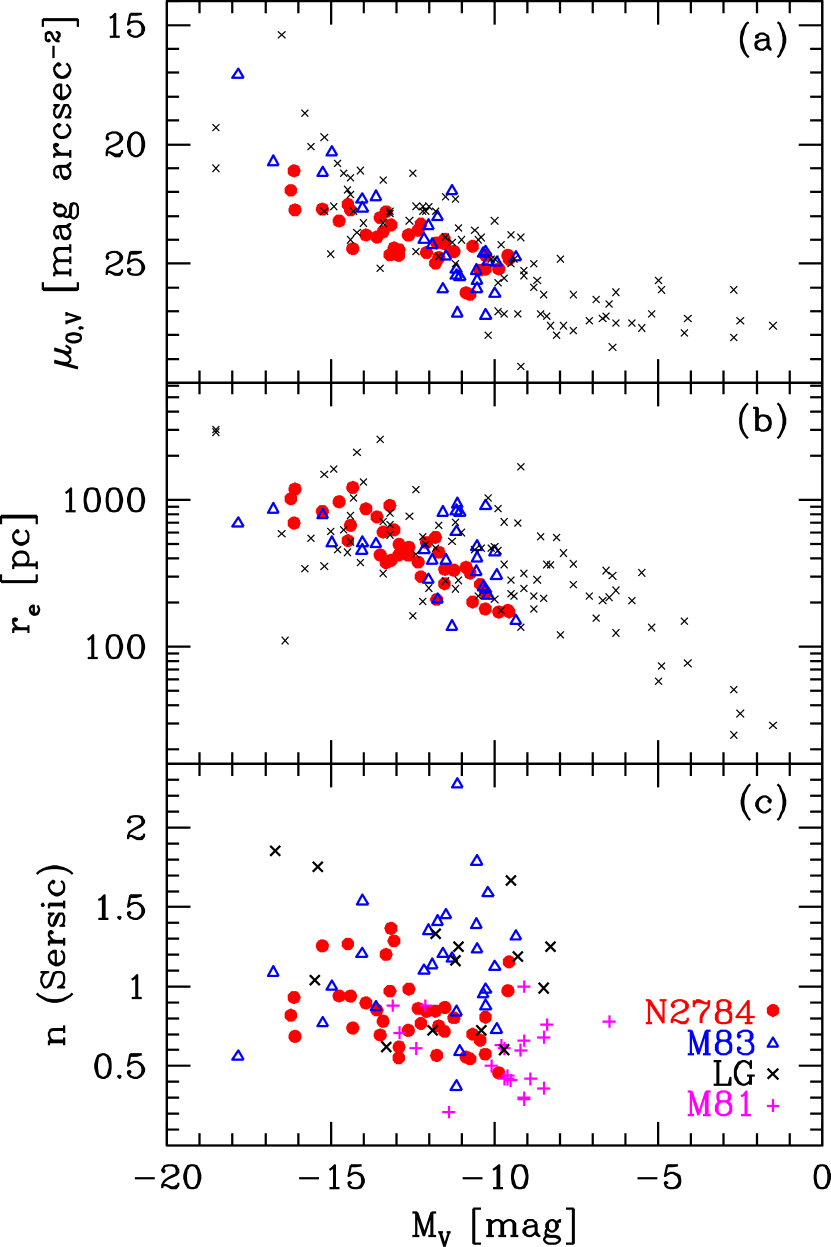
We now compare the central surface brightnesses (), effective radii (), and Sérsic indices of the NGC 2784 dwarf candidates to those of dwarf galaxies in other groups. For the central surface brightnesses and effective radii we use values from Müller et al. (2015) for the M83 group and from McConnachie (2012) for the Local Group. For , we use values from Chiboucas et al. (2009) for the M81 group, from Müller et al. (2015) for the M83 group, and from Jerjen et al. (2000) for the Local Group. For our values, we calculate and using and in combination with the color. We adopt for KSP-DW23. The values for and are the values obtained from the -band images. We assume all of the candidates are at the distance of NGC 2784. In Figure 7 we compare , , and as a function . The properties of the NGC 2784 dwarf candidates, with central surface brightness and effective radius increasing as the total brightness increases, agree well with the trends of the dwarfs in the M83 group and the Local Group. These results support the contention that the candidates are mostly member galaxies of the NGC 2784 group rather than background galaxies. Additionally, the median value of the Sérsic curvature index for the NGC 2784 dwarf candidates () is similar to that of the dwarfs in the M83 group (), the M81 group (), and the Local Group (). Again, the properties of the NGC 2784 candidates are entirely consistent with those of dwarfs in other groups.
4 Discussion
4.1 The NGC 2784 Galaxy Group
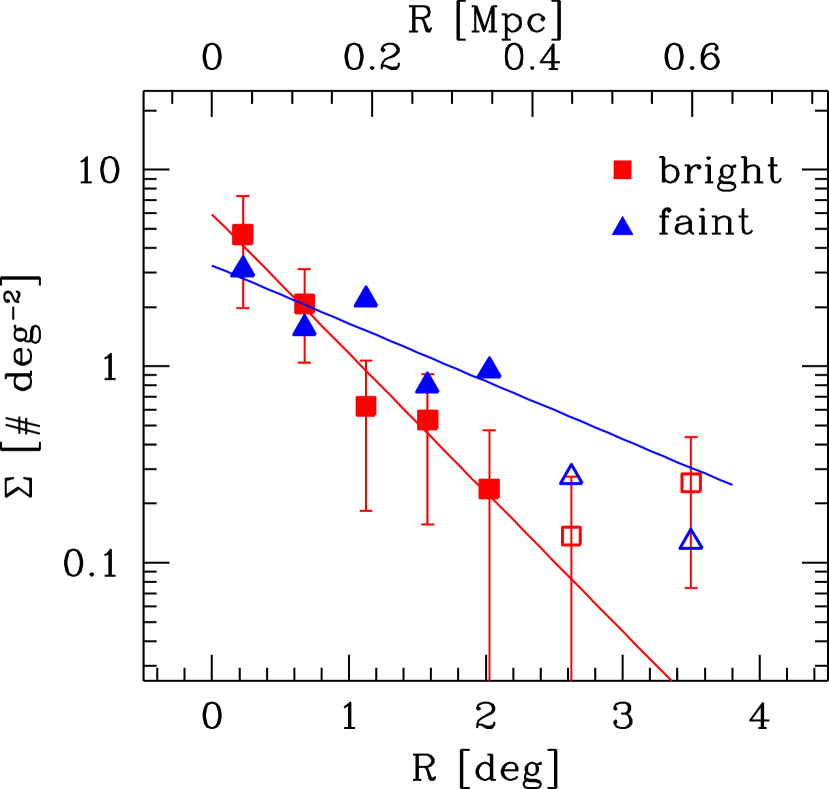
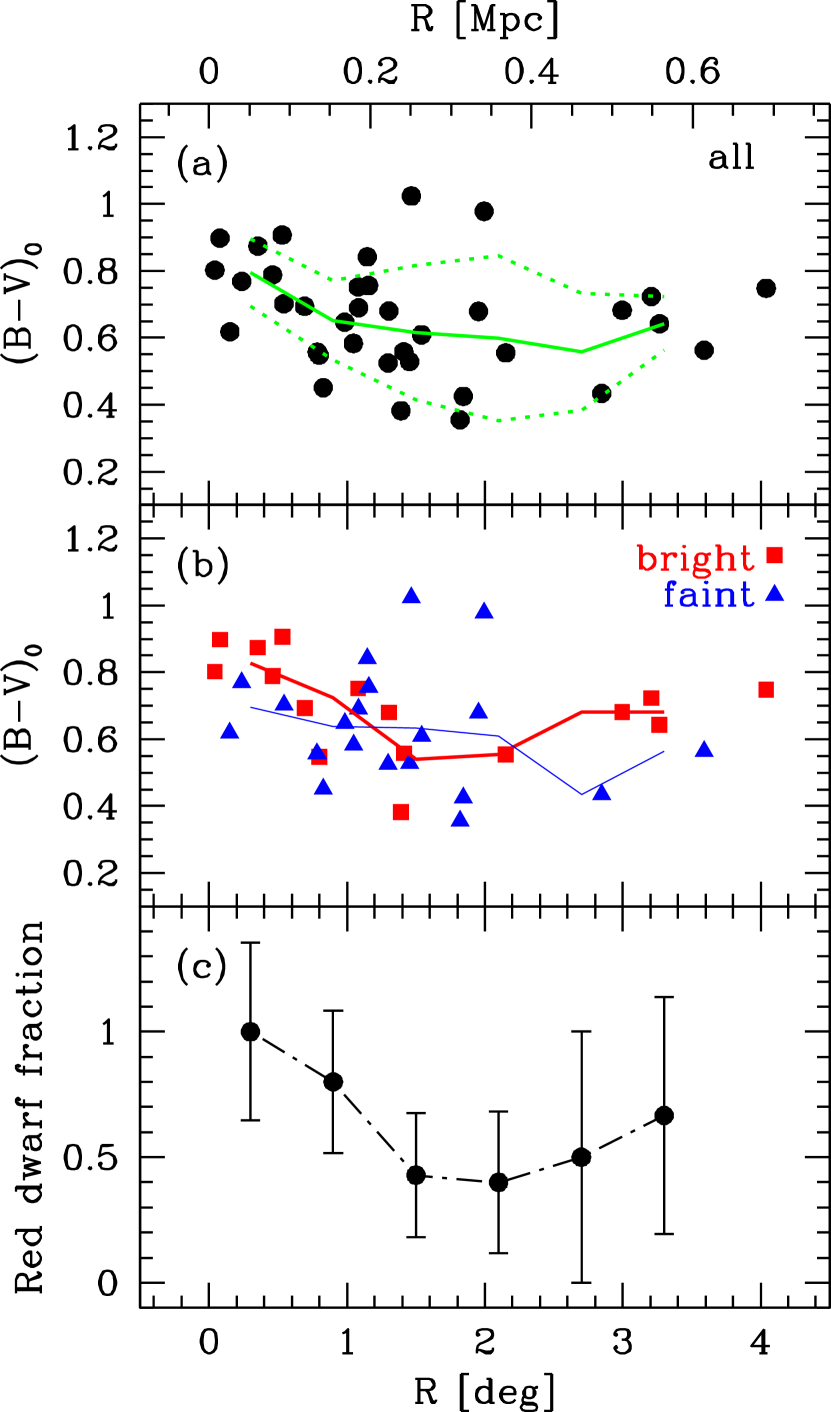
In Figure 8 we show the radial number density profiles of the bright () and faint () dwarf galaxy candidates in the NGC 2784 field. We fit each profile with an exponential function for . We find that the density profile of the brighter dwarfs ( ) is steeper than that of the fainter dwarfs ( ). A complication in interpreting this result is that background contamination may be distorting the fits. Although a magnitude dependent contamination is expected, our sample is too small for us to determine whether the background contamination is more significant for fainter candidates. If it is, however, it could be making the fainter population appear more extended. To test for such an effect, we added the entire fitted background level (0.24 deg-2, see Section 3.4) to the density profile of the brighter galaxies. The new slope for this population is now , which is still steeper than that of the faint galaxies. We conclude, with some caution, that the brighter set of dwarf galaxies is more centrally concentrated. This conclusion is further supported by the results of a -test comparison of the radial distance distributions of the dwarf candidates within . -test is a statistical test to examine whether or not two samples are different population under assuming a normal distribution (Sprinthall, 2011). We find with 99.1% confidence that the samples do not have the same radial distribution. The difference in central concentration may reflect mass segregation, with more massive galaxies in a cluster or group being more centrally concentrated (Presotto et al., 2012; Roberts et al., 2015). Plausible physical reasons for that apparent concentration range from environmentally dependent formation histories, differences in dynamical friction, or mass-dependent tidal stripping.
Next, we check whether there are radial variations in the mean colors of the dwarf candidates. In Figure 9 we show that the dwarfs are redder when closer to the center. The trend is also visible for bright and faint dwarfs independently. The radial fraction of red dwarf galaxies is higher in the center than in the outskirts when we estimate the red dwarf fraction using the color-magnitude relation (equation (1)) by Weinmann et al. (2011). This observation is consistent with the results of simulations (Wetzel et al., 2012, 2013) and other observations (Popesso et al., 2006; Presotto et al., 2012; Lee et al., 2016). The standard interpretation of this effect is that the central galaxies have lower star formation rates.
This result has also been reported in galaxy clusters such as Virgo and Coma (Weinmann et al., 2011; Smith et al., 2012; Lisker et al., 2013). It is suggested that the galaxies in the central regions of massive clusters experienced earlier, more efficient star formation quenching due to stronger tidal forces and interactions with the intracluster medium, so the red galaxies are more centrally concentrated. The same environmental effect could be the reason for color distribution in the NGC 2784 group. On the other hand, this reddening of galaxies toward the center might also be a metallicity effect. If, as discussed above, the central galaxies are more massive then they are likely to also be more metal rich and therefore redder. However, again this result might be influenced by differential background contamination. In general, background contaminants tend to be blue galaxies, which are more common than red galaxies, and tend to be found at larger separations due to the greater amount of sky at larger separations. This effect could result in creating a color gradient in the sense of that observed. To test for such an effect, we assume that the 5 dwarf candidates (this number is based on the 15% contamination rate with degree (see Section 3.4)) are all contaminants with bluish color and we remove them from our sample. The color trend remains.
4.2 Cumulative Luminosity Functions of Galaxy Groups
To investigate the luminosity function (LF) of galaxies in the NGC 2784 group and compare it to that of galaxies in other groups, we construct the cumulative LF of the NGC 2784 group. We focus on the cumulative LF, instead of the differential LF, because the number of galaxies in each group is small (Trentham & Tully, 2009). For the fainter galaxies () in the NGC 2784 group, we use the results from the surface photometry in Table 3. For the three bright group galaxies, we also use the photometry obtained from our deep stack images: NGC 2784 (), NGC 2835 (), and DDO 062 (). These values are consistent to within 0.4 mag with the published total absolute magnitudes (Karachentsev et al., 2013). Because of increased contamination at larger projected radii, we use only the dwarf candidates within Mpc.
To obtain the comparison LF’s, we use photometry from the literature (for the NGC 5128 group from Tully et al. (2015) and Crnojević et al. (2016); the M81 group from Chiboucas et al. (2009); for the M83 group from Müller et al. (2015); for the M106 group from Kim et al. (2011), and for the Local Group from McConnachie (2012) and Martin et al. (2013a, b)). Where necessary, we transform magnitudes using , (Müller et al., 2015), and (Lupton, 2009).
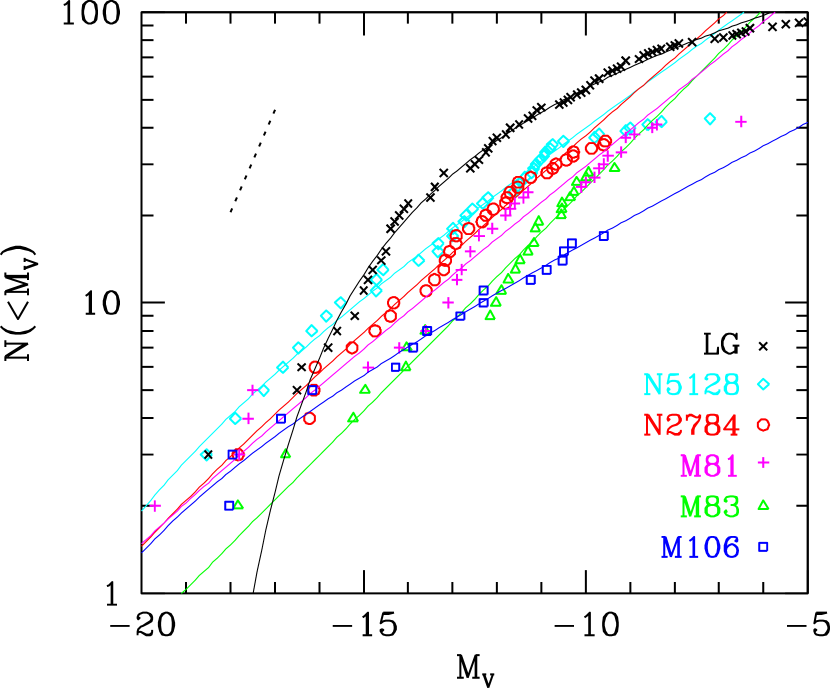
In Figure 10 we compare the cumulative LFs of six galaxy groups, including the NGC 2784 group. We fit cumulative Schechter functions (Schechter, 1976) to the observed cumulative LFs according to the method described in Section 3.2 of Chiboucas et al. (2009). The faint-end slopes () of the fitted cumulative LFs have values ranging from to (Table 4). The slope () for the NGC 2784 group is similar to those of the M81, M83, M106, and NGC 5218 groups, while the slope is steeper than that of the Local Group (, which is consistent with the values from other studies (Chiboucas et al., 2009; McConnachie et al., 2009; Kim et al., 2011)). The slopes for the NGC 2784 group and the other five groups are much flatter than the slope () of the subhalo mass function in the CDM model (Trentham & Tully, 2002), shown as the dotted line in Figure 10. We also check any dependency between the faint-end slope () and the characteristic absolute magnitude () of the LF in each group. The values of six groups including the NGC 2784 group change slightly (%) within their uncertainties (e.g. as shown in Figure 30 by Chiboucas et al. (2009), Figure 16 by Trentham & Tully (2009), and Figure 13 by Ferrarese et al. (2016)). Thus the is unlikely to affect significantly the values estimated in this study.
We fit only over the magnitude range mag. We set the faint limit at a magnitude where we are still highly incomplete. The number of member galaxies used for the fits vary from 16 (for the M 106 group) to 55 (for the Local Group). The variation in number is in large part due to the more or less complete surveys of the relevant volumes, for example the survey area for M106 group extends only over Mpc (Kim et al., 2011), and to the different detection limits for dwarf galaxies with very low surface brightness or compact size. Although the shape of the LF is not a function of the number of galaxies, many of the potential reasons for incompleteness in the surveys could translate differentially at different magnitudes. For example, in NGC 2784 we found that brighter dwarfs are more centrally concentrated, meaning that a survey that does not include the entire volume will be biased toward brighter dwarfs (see Figure 8). Likewise, incompleteness due to surface brightness effects will disfavor fainter galaxies. As such, it is extremely difficult to compare results from different surveys, which will have different explicit and implicit selection criteria. A major strength of our eventually larger KMTNet survey of dwarf galaxies will be the homogeneity of the data and selection techniques. However, at the moment we can only compare results from various different surveys.
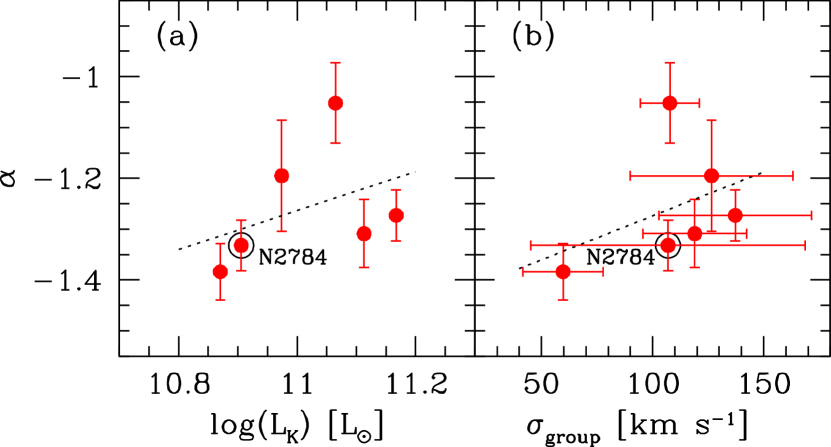
To search for a possible dependency of dwarf galaxy population with group properties, we investigate whether the faint-end slopes () of LFs of the six groups vary as a function of the group mass. We adopt two mass indicators (see Table 4): the total -band luminosity of the group galaxies (), which correlates with the group mass (Makarov & Karachentsev, 2011), and the velocity dispersion derived from the radial velocities of the member galaxies in each group (). The galaxy luminosities and velocities are drawn from Karachentsev et al. (2013). We consider all galaxies associated with the same main disturber (MD) and (tidal index) as members of each group (see Karachentsev et al. (2013)). In Figure 11 we show the relationships between and total luminosity or velocity dispersion. There is a mild suggestion in both plots that decreases (shallower slope) as the mass of the galaxy group ( and ) increases. When we simply fit the data with a linear function, we obtain and . However, the correlation coefficient values (e.g. Pearson’s correlation, Spearman’s rank correlation) estimated from the fits have approximately 1 sigma significance, and with this sample size statistical tests do not confirm this impression. In addition to the difficulty posed by the small statistical sample, we are concerned about systematic effects resulting from the comparison of results from diverse surveys. While intriguing, this test needs to be revisited once a large and uniform survey is competed. Our KMTNet survey of groups should be well positioned to address this topic.
5 Summary
Using deep, wide field images obtained from the KMTNet Supernova Program, we identified 38 dwarf galaxy candidates, 31 previously unknown, in the nearby NGC 2784 galaxy group and measured their photometric properties. KMTNet survey data produce competitive dwarf galaxy surveys to the current state-of-the-art. Our primary results are summarized as follows.
-
1.
We discovered 31 dwarf galaxy candidates around NGC 2784 galaxy over 30 . Based on their cluster around NGC 2784, we estimate that at least 85% of these are physically associated with the NGC 2784 group. Beyond a projected separation of 0.5 Mpc the number density profile flattens and we may be detecting only field contaminants.
-
2.
We present surface photometry for 38 dwarfs, our new discoveries plus the previously known 7 dwarf galaxies (Karachentsev et al., 2013). Our surface brightnesses limit is approximately mag arcsec-2. The central surface brightness and total absolute magnitude of the faintest dwarf galaxies we detect are mag arcsec-2 and mag, respectively. The effective radii of the dwarfs are all larger than arcsec ( pc at the distance of NGC 2784).
-
3.
The radial number density of the dwarf candidates decreases exponentially (or with power index, ) with distance from the center of NGC 2784. The background contamination is about 15% and so estimate that about 27 of the 32 candidates within 2.7 degree are dwarf members of the group.
-
4.
The color and Sérsic structural parameters for the dwarf candidates are consistent with those of dwarfs in other galaxy groups (M81, M83, M106, and the Local Group). The dwarf galaxy candidates have a color-magnitude relation similar to that of early-type galaxies.
-
5.
The color and number density radial profiles for the candidate dwarf population in the NGC 2784 group galaxies, shows that the central dwarfs are both brighter and redder than the rest of the population. We caution that contamination is likely to produce relations of the same sense, but argue that the results are not dominated by the contamination.
-
6.
The faint-end slope of the luminosity function (LF) of the NGC 2784 group galaxies is , which is consistent with that seen in some other groups, but apparently steeper than that of the Local Group galaxies. Eventually, the KMTNet survey will provide homogeneous catalogs of dwarf galaxies in 15 to 20 groups.
References
- APASS (2015) APASS, 2015. The AAVSO Photometric All-Sky Survey: Data Release 9 https://www.aavso.org/apass/
- Bechtol et al. (2015) Bechtol, K., Drlica-Wagner, A., Balbinot, E., et al. 2015, ApJ, 807, 50
- Behroozi et al. (2010) Behroozi, P. S., Conroy, C., & Wechsler, R. H. 2010, ApJ, 717, 379
- Benson et al. (2002) Benson, A. J., Lacey, C. G., Baugh, C. M., Cole, S., & Frenk, C. S. 2002, MNRAS, 333, 156
- Bertin & Arnouts (1996) Bertin, E. & Arnouts, S. 1996: SExtractor: Software for source extraction, Astronomy & Astrophysics Supplement 317, 393
- Bertin et al. (2002) Bertin, E. et al. 2002, The TERAPIX Pipeline, ASP Conference Series, Vol. 281, 2002 D.A. Bohlender, D. Durand, and T.H. Handley, eds., p. 228
- Bertin et al. (2006) Bertin, E. 2006: Automatic Astrometric and Photometric Calibration with SCAMP, ASP Conference Series, Vol. 351, 2006, C. Gabriel, C. Arviset, D. Ponz, and E. Solano, eds., p. 112
- Binggeli & Jerjen (1998) Binggeli, B., & Jerjen, H. 1998, A&A, 333, 17
- Blanton et al. (2005) Blanton, M. R., Lupton, R. H., Schlegel, D. J., et al. 2005, ApJ, 631, 208
- Chiboucas et al. (2009) Chiboucas, K., Karachentsev, I. D., & Tully, R. B. 2009, AJ, 137, 3009
- Cooper et al. (2010) Cooper, A. P., Cole, S., Frenk, C. S., et al. 2010, MNRAS, 406, 744
- Crnojević et al. (2016) Crnojević, D., Sand, D. J., Spekkens, K., et al. 2016, arXiv:1512.05366
- Doyle et al. (2005) Doyle, M. T., Drinkwater, M. J., Rohde, D. J., et al. 2005, MNRAS, 361, 34
- Drlica-Wagner et al. (2015) Drlica-Wagner, A., Bechtol, K., Rykoff, E. S., et al. 2015, ApJ, 813, 109
- Ferguson & Sandage (1988) Ferguson, H. C., & Sandage, A. 1988, AJ, 96, 1520
- Ferrarese et al. (2006) Ferrarese, L., Côté, P., Jordán, A., et al. 2006, ApJS, 164, 334
- Ferrarese et al. (2016) Ferrarese, L., Côté, P., Sánchez-Janssen, R., et al. 2016, ApJ, 824, 10
- Fisher & Tully (1981) Fisher, J. R., & Tully, R. B. 1981, ApJS, 47, 139
- Fouque et al. (1992) Fouque, P., Gourgoulhon, E., Chamaraux, P., & Paturel, G. 1992, A&AS, 93, 211
- Garcia (1993) Garcia, A. M. 1993, A&AS, 100, 47
- He et al. (2016) He, M. Y., Moon, D.-S., Neilson, H., et al. 2016, Journal of Korean Astronomical Society, 49, 209
- Jerjen et al. (2000) Jerjen, H., Binggeli, B., & Freeman, K. C. 2000, AJ, 119, 593
- Lee et al. (2016) Lee, Y., Rey, S.-C., Hilker, M., Sheen, Y.-K., & Yi, S. K. 2016, ApJ, 822, 92
- Lisker et al. (2008) Lisker, T., Grebel, E. K., & Binggeli, B. 2008, AJ, 135, 380
- Lisker et al. (2013) Lisker, T., Weinmann, S. M., Janz, J., & Meyer, H. T. 2013, MNRAS, 432, 1162
- Lupton (2009) Lupton, R. 2005, Transformations between SDSS magnitudes and other systems https://www.sdss3.org/dr10/algorithms/sdssUBVRITransform.php/
- Karachentsev et al. (2008) Karachentsev, I. D., Makarov, D. I., Karachentseva, V. E., & Melnik, O. V. 2008, Astronomy Letters, 34, 832
- Karachentsev et al. (2013) Karachentsev, I. D., Makarov, D. I., & Kaisina, E. I. 2013, AJ, 145, 101
- Kim et al. (2011) Kim, E., Kim, M., Hwang, N., et al. 2011, MNRAS, 412, 1881
- Kim et al. (2016) Kim, S.-L., et al. 2016, JKAS, 49, 37
- Klypin et al. (1999) Klypin, A., Kravtsov, A. V., Valenzuela, O., & Prada, F. 1999, ApJ, 522, 82
- Koposov et al. (2008) Koposov, S., Belokurov, V., Evans, N. W., et al. 2008, ApJ, 686, 279-291
- Makarov & Karachentsev (2011) Makarov, D., & Karachentsev, I. 2011, MNRAS, 412, 2498
- Markwardt (2009) Markwardt, C. B. 2009, ASPC, Astronomical Data Analysis Software and Systems XVIII, 411, 251
- Martin et al. (2013a) Martin, N. F., Schlafly, E. F., Slater, C. T., et al. 2013a, ApJ, 779, L10
- Martin et al. (2013b) Martin, N. F., Slater, C. T., Schlafly, E. F., et al. 2013b, ApJ, 772, 15
- McConnachie (2012) McConnachie, A. W. 2012, AJ, 144, 4
- McConnachie et al. (2009) McConnachie, A. W., Irwin, M. J., Ibata, R. A., et al. 2009, Nature, 461, 66
- Merritt et al. (2014) Merritt, A., van Dokkum, P., & Abraham, R. 2014, ApJ, 787, L37
- Moon et al. (2016) Moon, D.-S., Kim, S. C., Lee, J.-J., et al. 2016, Proc. SPIE, 9906, 99064I
- Moore et al. (1999) Moore, B., Ghigna, S., Governato, F., et al. 1999, ApJ, 524, L19
- Müller et al. (2015) Müller, O., Jerjen, H., & Binggeli, B. 2015, A&A, 583, A79
- Müller et al. (2017) Müller, O., Jerjen, H., & Binggeli, B. 2017, A&A, 597, A7
- Muñoz et al. (2015) Muñoz, R. P., Eigenthaler, P., Puzia, T. H., et al. 2015, ApJ, 813, L15
- Pak et al. (2014) Pak, M., Rey, S.-C., Lisker, T., et al. 2014, MNRAS, 445, 630
- Popesso et al. (2006) Popesso, P., Biviano, A., Böhringer, H., & Romaniello, M. 2006, A&A, 445, 29
- Presotto et al. (2012) Presotto, V., Iovino, A., Scodeggio, M., et al. 2012, A&A, 539, A55
- Roberts et al. (2015) Roberts, I. D., Parker, L. C., Joshi, G. D., & Evans, F. A. 2015, MNRAS, 448, L1
- Schechter (1976) Schechter, P. 1976, ApJ, 203, 297
- Schlafly & Finkbeiner (2011) Schlafly, E. F., & Finkbeiner, D. P. 2011, ApJ, 737, 103
- Smith et al. (2012) Smith, R. J., Lucey, J. R., Price, J., Hudson, M. J., & Phillipps, S. 2012, MNRAS, 419, 3167
- Sprinthall (2011) Sprinthall, R. C. 2011, Basic Statistical Analysis (9th Edition), Pearson Education
- Tolstoy et al. (2009) Tolstoy, E., Hill, V., & Tosi, M. 2009, ARA&A, 47, 371
- Tonry et al. (2001) Tonry, J. L., Dressler, A., Blakeslee, J. P., et al. 2001, ApJ, 546, 681
- Trentham & Tully (2002) Trentham, N., & Tully, R. B. 2002, MNRAS, 335, 712
- Trentham et al. (2005) Trentham, N., Sampson, L., & Banerji, M. 2005, MNRAS, 357, 783
- Trentham & Tully (2009) Trentham, N., & Tully, R. B. 2009, MNRAS, 398, 722
- Tully et al. (2015) Tully, R. B., Libeskind, N. I., Karachentsev, I. D., et al. 2015, ApJ, 802, L25
- Weinmann et al. (2011) Weinmann, S. M., Lisker, T., Guo, Q., Meyer, H. T., & Janz, J. 2011, MNRAS, 416, 1197
- Wetzel et al. (2012) Wetzel, A. R., Tinker, J. L., & Conroy, C. 2012, MNRAS, 424, 232
- Wetzel et al. (2013) Wetzel, A. R., Tinker, J. L., Conroy, C., & van den Bosch, F. C. 2013, MNRAS, 432, 336
| Field | Filter | R.A.(J2000) | Decl.(J2000) | T(exp) | Date(UT) | Seeing |
|---|---|---|---|---|---|---|
| (hh:mm:ss) | (dd:mm) | (Nsec) | (2015.mm.dd.) | (arcsec) | ||
| N2784-3-Q0 | 09:10:43 | -22:08 | 397 60 s | 03.01. – 06.30. | 1.4 | |
| N2784-3-Q0 | 09:10:43 | -22:08 | 383 60 s | 03.01. – 06.30. | 1.5 | |
| N2784-3-Q0 | 09:10:43 | -22:08 | 349 60 s | 03.01. – 06.30. | 1.6 | |
| N2784-3-Q1 | 09:06:05 | -22:08 | 397 60 s | 03.01. – 06.27. | 1.3 | |
| N2784-3-Q1 | 09:06:05 | -22:08 | 372 60 s | 03.01. – 06.30. | 1.4 | |
| N2784-3-Q1 | 09:06:05 | -22:08 | 345 60 s | 03.01. – 06.29. | 1.5 | |
| N2784-3-Q2 | 09:10:44 | -23:15 | 405 60 s | 03.01. – 06.30. | 1.3 | |
| N2784-3-Q2 | 09:10:44 | -23:15 | 395 60 s | 03.01. – 07.01. | 1.4 | |
| N2784-3-Q2 | 09:10:45 | -23:15 | 375 60 s | 03.01. – 06.30. | 1.5 | |
| N2784-3-Q3 | 09:06:03 | -23:15 | 390 60 s | 03.01. – 06.30. | 1.3 | |
| N2784-3-Q3 | 09:06:03 | -23:15 | 368 60 s | 03.01. – 06.30. | 1.4 | |
| N2784-3-Q3 | 09:06:03 | -23:15 | 346 60 s | 03.01. – 06.30. | 1.5 | |
| N2784-4-Q0 | 09:12:09 | -23:53 | 400 60 s | 03.01. – 07.03. | 1.4 | |
| N2784-4-Q0 | 09:12:09 | -23:53 | 375 60 s | 03.01. – 07.03. | 1.5 | |
| N2784-4-Q0 | 09:12:09 | -23:53 | 353 60 s | 03.01. – 07.01. | 1.7 | |
| N2784-4-Q1 | 09:07:27 | -23:53 | 400 60 s | 03.01. – 07.03. | 1.3 | |
| N2784-4-Q1 | 09:07:27 | -23:53 | 365 60 s | 03.01. – 07.03. | 1.4 | |
| N2784-4-Q1 | 09:07:27 | -23:53 | 350 60 s | 03.01. – 06.29. | 1.5 | |
| N2784-4-Q2 | 09:12:10 | -25:00 | 409 60 s | 03.01. – 07.03. | 1.3 | |
| N2784-4-Q2 | 09:12:10 | -25:00 | 385 60 s | 03.01. – 07.03. | 1.4 | |
| N2784-4-Q2 | 09:12:10 | -25:00 | 376 60 s | 03.01. – 07.03. | 1.5 | |
| N2784-4-Q3 | 09:07:25 | -25:00 | 394 60 s | 03.01. – 07.03. | 1.3 | |
| N2784-4-Q3 | 09:07:25 | -25:00 | 366 60 s | 03.01. – 07.03. | 1.4 | |
| N2784-4-Q3 | 09:07:26 | -25:00 | 350 60 s | 03.01. – 07.03. | 1.5 | |
| N2784-5-Q0 | 09:18:43 | -22:08 | 391 60 s | 03.01. – 07.01. | 1.4 | |
| N2784-5-Q0 | 09:18:43 | -22:08 | 361 60 s | 03.01. – 07.01. | 1.5 | |
| N2784-5-Q0 | 09:18:43 | -22:08 | 341 60 s | 03.01. – 07.01. | 1.7 | |
| N2784-5-Q1 | 09:14:04 | -22:08 | 386 60 s | 03.01. – 07.01. | 1.3 | |
| N2784-5-Q1 | 09:14:05 | -22:08 | 353 60 s | 03.01. – 07.01. | 1.4 | |
| N2784-5-Q1 | 09:14:05 | -22:08 | 331 60 s | 03.01. – 06.29. | 1.5 | |
| N2784-5-Q2 | 09:18:44 | -23:15 | 396 60 s | 03.01. – 07.01. | 1.3 | |
| N2784-5-Q2 | 09:18:45 | -23:15 | 375 60 s | 03.01. – 07.01. | 1.4 | |
| N2784-5-Q2 | 09:18:45 | -23:15 | 361 60 s | 03.01. – 07.01. | 1.5 | |
| N2784-5-Q3 | 09:14:03 | -23:15 | 383 60 s | 03.01. – 07.01. | 1.3 | |
| N2784-5-Q3 | 09:14:03 | -23:15 | 353 60 s | 03.01. – 07.01. | 1.4 | |
| N2784-5-Q3 | 09:14:03 | -23:15 | 337 60 s | 03.01. – 06.30. | 1.5 | |
| N2784-6-Q0 | 09:20:09 | -23:53 | 389 60 s | 03.01. – 06.30. | 1.4 | |
| N2784-6-Q0 | 09:20:09 | -23:53 | 361 60 s | 03.01. – 06.30. | 1.5 | |
| N2784-6-Q0 | 09:20:09 | -23:53 | 331 60 s | 03.01. – 06.30. | 1.6 | |
| N2784-6-Q1 | 09:15:27 | -23:53 | 383 60 s | 03.01. – 06.30. | 1.3 | |
| N2784-6-Q1 | 09:15:27 | -23:53 | 349 60 s | 03.01. – 06.30. | 1.4 | |
| N2784-6-Q1 | 09:15:27 | -23:53 | 328 60 s | 03.01. – 06.29. | 1.5 | |
| N2784-6-Q2 | 09:20:10 | -25:00 | 391 60 s | 03.01. – 06.30. | 1.3 | |
| N2784-6-Q2 | 09:20:10 | -25:00 | 366 60 s | 03.01. – 06.30. | 1.4 | |
| N2784-6-Q2 | 09:20:10 | -25:00 | 352 60 s | 03.01. – 06.30. | 1.5 | |
| N2784-6-Q3 | 09:15:26 | -25:00 | 377 60 s | 03.01. – 06.30. | 1.3 | |
| N2784-6-Q3 | 09:15:25 | -25:00 | 340 60 s | 03.01. – 06.30. | 1.4 | |
| N2784-6-Q3 | 09:15:26 | -25:00 | 324 60 s | 03.01. – 06.30. | 1.5 | |
| N2784-7-Q0 | 09:26:43 | -22:08 | 371 60 s | 03.01. – 06.29. | 1.4 | |
| N2784-7-Q0 | 09:26:43 | -22:08 | 346 60 s | 03.01. – 06.29. | 1.5 | |
| N2784-7-Q0 | 09:26:43 | -22:08 | 324 60 s | 03.01. – 06.29. | 1.7 | |
| N2784-7-Q1 | 09:22:05 | -22:08 | 371 60 s | 03.01. – 06.29. | 1.3 | |
| N2784-7-Q1 | 09:22:05 | -22:08 | 334 60 s | 03.01. – 06.29. | 1.4 | |
| N2784-7-Q1 | 09:22:05 | -22:08 | 317 60 s | 03.01. – 06.26. | 1.6 | |
| N2784-7-Q2 | 09:26:45 | -23:15 | 372 60 s | 03.01. – 06.29. | 1.3 | |
| N2784-7-Q2 | 09:26:45 | -23:15 | 352 60 s | 03.01. – 06.29. | 1.4 | |
| N2784-7-Q2 | 09:26:45 | -23:15 | 344 60 s | 03.01. – 06.29. | 1.5 | |
| N2784-7-Q3 | 09:22:03 | -23:15 | 363 60 s | 03.01. – 06.29. | 1.3 | |
| N2784-7-Q3 | 09:22:03 | -23:15 | 330 60 s | 03.01. – 06.29. | 1.4 | |
| N2784-7-Q3 | 09:22:03 | -23:15 | 316 60 s | 03.01. – 06.29. | 1.5 |
| Field | Filter | R.A.(J2000) | Decl.(J2000) | T(exp) | Date(UT) | Seeing |
|---|---|---|---|---|---|---|
| (hh:mm:ss) | (dd:mm) | (Nsec) | (2015.mm.dd.) | (arcsec) | ||
| N2784-1-Q0 | 09:03:22 | -21:56 | 8 100 s | 02.09. – 02.27. | 1.3 | |
| N2784-1-Q0 | 09:03:22 | -21:56 | 7 100 s | 02.09. – 02.27. | 1.2 | |
| N2784-1-Q0 | 09:03:22 | -21:56 | 6 100 s | 02.09. – 02.27. | 1.4 | |
| N2784-1-Q1 | 08:58:44 | -21:56 | 8 100 s | 02.09. – 02.27. | 1.3 | |
| N2784-1-Q1 | 08:58:44 | -21:56 | 7 100 s | 02.09. – 02.27. | 1.2 | |
| N2784-1-Q1 | 08:58:44 | -21:56 | 8 100 s | 02.09. – 02.27. | 1.5 | |
| N2784-1-Q2 | 09:03:23 | -23:03 | 8 100 s | 02.09. – 02.27. | 1.2 | |
| N2784-1-Q2 | 09:03:23 | -23:03 | 7 100 s | 02.09. – 02.27. | 1.2 | |
| N2784-1-Q2 | 09:03:23 | -23:03 | 6 100 s | 02.09. – 02.27. | 1.2 | |
| N2784-1-Q3 | 08:58:42 | -23:03 | 8 100 s | 02.09. – 02.27. | 1.2 | |
| N2784-1-Q3 | 08:58:43 | -23:03 | 7 100 s | 02.09. – 02.27. | 1.2 | |
| N2784-1-Q3 | 08:58:43 | -23:03 | 6 100 s | 02.09. – 02.27. | 1.3 | |
| N2784-2-Q0 | 09:03:24 | -23:56 | 5 100 s | 02.09. – 02.27. | 1.0 | |
| N2784-2-Q0 | 09:03:24 | -23:56 | 5 100 s | 02.09. – 02.27. | 1.2 | |
| N2784-2-Q0 | 09:03:24 | -23:56 | 5 100 s | 02.09. – 02.27. | 1.2 | |
| N2784-2-Q1 | 08:58:42 | -23:56 | 5 100 s | 02.09. – 02.27. | 1.1 | |
| N2784-2-Q1 | 08:58:42 | -23:56 | 5 100 s | 02.09. – 02.27. | 1.2 | |
| N2784-2-Q1 | 08:58:42 | -23:56 | 4 100 s | 02.09. – 02.27. | 1.3 | |
| N2784-2-Q2 | 09:03:25 | -25:03 | 5 100 s | 02.09. – 02.27. | 1.0 | |
| N2784-2-Q2 | 09:03:25 | -25:03 | 5 100 s | 02.09. – 02.27. | 1.2 | |
| N2784-2-Q2 | 09:03:26 | -25:03 | 5 100 s | 02.09. – 02.27. | 1.2 | |
| N2784-2-Q3 | 08:58:40 | -25:03 | 5 100 s | 02.09. – 02.27. | 1.1 | |
| N2784-2-Q3 | 08:58:40 | -25:03 | 5 100 s | 02.09. – 02.27. | 1.2 | |
| N2784-2-Q3 | 08:58:40 | -25:03 | 5 100 s | 02.09. – 02.27. | 1.3 | |
| N2784-8-Q0 | 09:28:09 | -23:53 | 4 100 s | 02.11. – 02.15. | 1.1 | |
| N2784-8-Q0 | 09:28:09 | -23:53 | 3 100 s | 02.11. – 02.15. | 1.1 | |
| N2784-8-Q0 | 09:28:09 | -23:53 | 4 100 s | 02.11. – 02.15. | 1.3 | |
| N2784-8-Q1 | 09:23:27 | -23:53 | 4 100 s | 02.11. – 02.15. | 1.1 | |
| N2784-8-Q1 | 09:23:27 | -23:53 | 3 100 s | 02.11. – 02.15. | 1.1 | |
| N2784-8-Q1 | 09:23:27 | -23:53 | 4 100 s | 02.11. – 02.15. | 1.3 | |
| N2784-8-Q2 | 09:28:10 | -25:00 | 4 100 s | 02.11. – 02.15. | 1.3 | |
| N2784-8-Q2 | 09:28:10 | -25:00 | 3 100 s | 02.11. – 02.15. | 1.1 | |
| N2784-8-Q2 | 09:28:10 | -25:00 | 4 100 s | 02.11. – 02.15. | 1.3 | |
| N2784-8-Q3 | 09:23:25 | -25:00 | 4 100 s | 02.11. – 02.15. | 1.2 | |
| N2784-8-Q3 | 09:23:25 | -25:00 | 3 100 s | 02.11. – 02.15. | 1.1 | |
| N2784-8-Q3 | 09:23:26 | -25:00 | 4 100 s | 02.11. – 02.15. | 1.3 |
| ID | R.A.(J2000) | Dec.(J2000) | |||||||
|---|---|---|---|---|---|---|---|---|---|
| (hh:mm:ss) | (dd:mm:ss) | (mag) | (mag) | (mag) | (mag arcsec-2) | (arcsec) | (arcsec) | ||
| KSP-DW1 | 08:56:52.2 | -24:58:05 | 17.07 | 0.84 | 0.75 | 22.95 0.16 | 6.05 1.01 | 0.98 0.14 | 10.00 |
| KSP-DW2 | 08:58:04.3 | -21:51:02 | 16.72 | 0.50 | 0.93 | 22.32 0.15 | 4.29 0.79 | 1.20 0.15 | 7.87 |
| KSP-DW3 | 08:58:25.5 | -24:44:55 | 16.17 | 0.87 | 0.91 | 22.20 0.03 | 8.14 0.24 | 0.69 0.04 | 8.88 |
| KSP-DW4 | 08:58:29.5 | -25:06:18 | 15.52 | 1.09 | 0.83 | 22.71 0.06 | 11.98 0.68 | 0.90 0.06 | 18.32 |
| KSP-DW5 | 08:59:59.3 | -25:16:02 | 15.38 | 0.68 | 0.87 | 21.84 0.04 | 5.95 0.35 | 1.27 0.05 | 11.11 |
| ESO497-004 | 09:03:03.1 | -23:48:24 | 13.75 | 0.56 | 0.74 | 21.36 0.01 | 15.44 0.23 | 0.82 0.01 | 21.47 |
| KSP-DW6 | 09:04:02.4 | -22:56:52 | 18.66 | 1.13 | … | 25.16 0.04 | 11.04 0.32 | 0.54 0.06 | 6.69 |
| KSP-DW7 | 09:04:14.7 | -24:09:11 | 18.23 | 0.78 | 0.61 | 23.19 0.21 | 4.92 0.82 | 0.72 0.19 | 5.66 |
| KSP-DW8 | 09:06:59.6 | -25:07:50 | 17.62 | 0.66 | 0.79 | 22.68 0.04 | 4.94 0.17 | 0.77 0.03 | 6.32 |
| KSP-DW9 | 09:07:15.3 | -24:11:30 | 18.58 | 0.72 | 0.94 | 23.77 0.05 | 5.14 0.26 | 0.80 0.05 | 6.98 |
| KSP-DW10 | 09:08:01.9 | -25:15:18 | 17.66 | 0.53 | 0.71 | 23.06 0.05 | 5.39 0.26 | 0.86 0.04 | 7.93 |
| KSP-DW11 | 09:08:53.3 | -23:08:33 | 17.15 | 0.46 | 0.71 | 23.96 0.04 | 12.18 0.34 | 0.62 0.02 | 10.49 |
| KSP-DW12 | 09:09:06.4 | -23:53:58 | 19.67 | 0.58 | 0.74 | 24.07 0.21 | 3.56 0.65 | 0.81 0.15 | 4.87 |
| KK71 | 09:09:10.9 | -23:22:01 | 16.26 | 0.68 | 0.94 | 23.22 0.02 | 11.12 0.18 | 0.85 0.02 | 16.15 |
| DDO056 | 09:09:45.9 | -23:00:30 | 13.76 | 0.68 | 0.87 | 22.07 0.01 | 23.43 0.12 | 0.69 0.00 | 24.96 |
| KSP-DW13 | 09:10:00.0 | -24:10:19 | 16.85 | 0.52 | 1.09 | 22.86 0.07 | 4.30 0.39 | 1.37 0.07 | 8.17 |
| KSP-DW14 | 09:10:25.0 | -24:01:30 | 16.69 | 0.78 | 0.97 | 23.56 0.07 | 7.03 0.58 | 1.29 0.06 | 13.19 |
| KSP-DW15 | 09:11:10.7 | -24:24:41 | 16.56 | 0.77 | 1.06 | 23.86 0.09 | 11.78 1.02 | 0.97 0.08 | 19.28 |
| KSP-DW16 | 09:11:26.9 | -23:08:44 | 18.20 | 0.56 | 0.77 | 23.57 0.02 | 6.48 0.12 | 0.57 0.02 | 4.41 |
| KSP-DW17 | 09:11:36.2 | -23:30:00 | 15.52 | 0.61 | 0.88 | 22.14 0.02 | 8.86 0.19 | 0.94 0.02 | 14.14 |
| KSP-DW18 | 09:11:42.2 | -24:13:29 | 18.59 | 0.42 | 0.80 | 23.75 0.10 | 4.79 0.48 | 0.87 0.11 | 7.10 |
| KK72 | 09:11:42.4 | -23:58:56 | 16.88 | 0.73 | 0.96 | 23.93 0.02 | 14.17 0.20 | 0.55 0.02 | 8.89 |
| NGC2784 dw01 | 09:12:17.0 | -24:12:47 | 15.38 | 0.83 | 0.99 | 23.54 0.02 | 21.17 0.31 | 0.74 0.02 | 25.58 |
| KK73 | 09:12:29.2 | -24:14:28 | 14.45 | 0.82 | 1.08 | 21.90 0.03 | 9.46 0.30 | 1.26 0.02 | 17.62 |
| KSP-DW19 | 09:14:32.4 | -23:33:26 | 15.26 | 0.53 | 0.73 | 22.68 0.04 | 12.81 0.39 | 0.94 0.02 | 20.45 |
| KSP-DW20 | 09:14:40.5 | -24:15:10 | 17.74 | 0.71 | 0.89 | 23.82 0.03 | 7.50 0.26 | 0.84 0.03 | 10.80 |
| KSP-DW21 | 09:15:08.4 | -25:02:58 | 20.15 | 0.79 | 0.88 | 23.87 0.40 | 2.26 0.81 | 0.97 0.25 | 3.71 |
| KSP-DW22 | 09:15:35.3 | -23:48:57 | 17.57 | 0.33 | 0.64 | 23.47 0.03 | 7.54 0.23 | 0.72 0.03 | 8.81 |
| KSP-DW23 | 09:16:01.6 | -23:36:23 | 20.47 | … | … | 24.33 0.59 | 2.02 1.24 | 1.15 0.46 | 3.64 |
| KSP-DW24 | 09:16:08.5 | -23:43:17 | 18.11 | 0.72 | 0.83 | 24.04 0.04 | 7.47 0.30 | 0.75 0.05 | 9.27 |
| KSP-DW25 | 09:16:41.5 | -23:06:08 | 20.19 | 0.47 | 1.21 | 24.75 0.08 | 4.68 0.24 | 0.46 0.06 | 3.63 |
| HIPASS J0916-23b | 09:16:58.3 | -23:16:45 | 14.08 | 0.33 | 0.57 | 20.78 0.01 | 9.25 0.18 | 0.93 0.01 | 14.65 |
| KSP-DW26 | 09:17:17.3 | -24:22:05 | 19.83 | 0.42 | 1.03 | 24.80 0.08 | 5.37 0.32 | 0.57 0.07 | 3.81 |
| KSP-DW27 | 09:17:24.8 | -22:33:42 | 18.48 | 1.18 | 1.16 | 25.04 0.06 | 11.27 0.44 | 0.56 0.09 | 7.30 |
| KSP-DW28 | 09:17:43.4 | -23:29:37 | 16.64 | 0.49 | 0.74 | 23.18 0.02 | 9.71 0.19 | 0.78 0.02 | 12.72 |
| KSP-DW29 | 09:20:08.2 | -25:00:06 | 19.19 | 0.67 | 0.87 | 23.61 0.06 | 3.85 0.20 | 0.70 0.05 | 4.25 |
| KSP-DW30 | 09:20:13.2 | -23:56:02 | 18.11 | 0.61 | 0.54 | 24.37 0.04 | 8.12 0.33 | 0.85 0.07 | 11.72 |
| KSP-DW31 | 09:23:44.0 | -23:03:57 | 19.39 | 0.71 | 0.62 | 24.57 0.07 | 5.62 0.34 | 0.66 0.09 | 5.60 |
| Group | log | ||
|---|---|---|---|
| () | (km s-1) | ||
| M83 | 0.05 | 10.87 | 60 18 |
| NGC 2784 | 0.05 | 10.91 | 107 61 |
| M106 | 0.10 | 10.97 | 127 36 |
| Local Group | 0.08 | 11.07 | 108 13 |
| M81 | 0.06 | 11.11 | 119 23 |
| NGC 5128 | 0.05 | 11.17 | 137 34 |
![[Uncaptioned image]](/html/1708.07326/assets/x4.png)
Fig. 2. — Continued
![[Uncaptioned image]](/html/1708.07326/assets/x5.png)
Fig. 2. — Continued
![[Uncaptioned image]](/html/1708.07326/assets/x7.png)
Fig. 3. — Continued
![[Uncaptioned image]](/html/1708.07326/assets/x8.png)
Fig. 3. — Continued