Properties of the redback millisecond pulsar binary 3FGL J0212.1+5320
Abstract
Linares et al. (2016) obtained quasi-simultaneous , and -band light curves and an absorption line radial velocity curve of the secondary star in the redback system 3FGL J0212.1+5320. The light curves showed two maxima and minima primarily due to the secondary star’s ellipsoidal modulation, but with unequal maxima and minima. We fit these light curves and radial velocities with our X-ray binary model including either a dark solar-type star spot or a hot spot due to off-centre heating from an intrabinary shock, to account for the unequal maxima. Both models give a radial velocity semi-ampltiude and rotational broadening that agree with the observations. The observed secondary star’s effective temperature is best matched with the value obtained using the hot spot model, which gives a neutron star and secondary star mass of =1.85 and =0.50 , respectively.
keywords:
binaries: close – stars: fundamental parameters – stars: individual: 3FGL J0212.1+5320 – stars: neutron – X-rays: binaries1 Introduction
Progenitors of binary millisecond pulsars (MSPs) are believed to be recycled dead pulsars in low-mass X-ray binaries (LMXBs). According to this scenario the neutron star in the LMXB accretes material and angular momentum from its late-type companion star and is thereby spun up for billions of years to ultimately evolve into a MSP (Alpar et al., 1982; Bhattacharya & van den Heuvel, 1991). Compact binary MSPs with orbital periods less than 1 d are commonly classified as either ”black widows” or ”redbacks” depending on the mass of the companion star, . Black widows have relatively low-mass degenerate companion stars , whereas redbacks have relatively more massive non-degenerate companions (see Roberts, 2013, and references therein). The evolutionary link between redback and black widow MSPs is still uncertain. According to Chen et al. (2013), black widows and redbacks are two distinct populations of MSPs with different evaporation efficiencies. On the other hand, Benvenuto et al. (2014) argue that redbacks with compact orbits evolve to black widows, while the ones with longer orbital periods evolve to MSP-He white dwarf systems, and that black widows descend from redbacks but not all redbacks become black widows.
The Large Area Telescope (LAT) on the Fermi Gamma-Ray Space Telescope has been successful in uncovering binary MSPs because they are -ray emitters similar to young pulsars (Abdo, 2009). Subsequently, thanks to targeted radio and X-ray surveys where Fermi-LAT has localized sources, more than 30 black widow and 14 redback systems have been discovered (Hessels et al., 2011; Roberts, 2013; Crawford et al., 2013; Linares et al., 2016). To date there are three (PSR J1023+0038, IGR J18245-2452 and XSS J12270-4859) redback systems that transition between accretion-powered LMXB states and rotation-powered radio pulsar states clearly indicates the close relationship between LMXBs and radio MSPs and has provided further support for the recycling scenario (Archibald et al., 2009; Papitto et al., 2013; Bassa et al., 2014).
The optical light curves of black widow and redback binaries show large-amplitude variability due to irradiated ellipsoidal modulation of the near-Roche filling secondary star. Compared to the black widows, the redbacks, with their larger secondary stars and closer distance are relatively bright in the optical, allowing for detailed photometric and spectroscopic observations (Breton et al., 2013; Li et al., 2014; Schroeder & Halpern, 2014; Linares et al., 2016). In the last few years, dynamical photometric and spectroscopic studies of binary MSPs have largely proven the neutron star masses in these systems are generally heavier than the 1.4 canonical value, as expected theoretically for the binary evolution of MSPs (Chen et al., 2013; Benvenuto et al., 2014).
In this paper we present the results of modelling the optical light and radial velocity curves of the redback candidate 3FGL J0212.1+5320 discovered by Linares et al. (2016) and Li et al. (2016). First we briefly describe the X-ray binary model used, the fitting procedure and the results where we determine the binary system masses. Finally we discuss the impact of these results.
2 3FGL J0212.1+5320
Recently, both Linares et al. (2016) and Li et al. (2016) presented the discovery of a variable optical counterpart to the unidentified -ray source 3FGL J0212.1+5320, and argued that it is a binary ”redback” MSP candidate. Linares et al. (2016) obtained quasi-simultaneous , and -band light curves as well a low- and high resolution spectroscopy. The optical light curves obtained by Linares et al. (2016) and Li et al. (2016) both show two maxima and minima, primarily due to the secondary star’s ellipsoidal modulation. However, the light curve obtained by Linares et al. (2016) shows unequal maxima, which is not seen in the light curve obtained by (Li et al., 2016) due to very poor orbital phase coverage. From the combined photometry and radial velocities Linares et al. (2016) determined an orbital period of 0.86955(15) d, the same orbital period was obtained by Li et al. (2016) from their and -band light curves.
From high resolution spectra taken between orbital phases 0.17 and 0.22, Linares et al. (2016) found the secondary star to have a spectral type of F62. They also found no notable changes in spectral type or colour across the binary orbit, not surprising given the long orbital period and hence weak X-ray heating effects. They determined a radial velocity curve using the H absorption line and from a sinusoidal fit to the curve obtained a radial velocity semi-amplitude of =214.15.0 km s-1. Finally using high resolution spectroscopy they estimate the projected rotational velocity of the secondary star to be =73.21.6 km s-1.
3 The X-ray binary model
We use the X-ray binary light curve model xrbcurve described in (Shahbaz et al., 2003), which has successfully been used to model the light curves and radial velocity curves of neutron star and black hole X-ray binaries (e.g. see Shahbaz et al., 2003, 2004). to fit and interpret the photometric light curves and the H absorption-line radial velocity curve of 3FGL J0212.1+5320 presented in Linares et al. (2016). Briefly, the model consists of a binary system in which the primary point-like compact object with mass and the secondary is a Roche lobe filling star with mass . which is assumed to be in a circular orbit and in synchronous rotation. The binary mass ratio is defined as the ratio /. The binary geometry is determined by the binary masses, the orbital inclination , and the Roche lobe filling factor of the secondary star, defined as the ratio of the radius of the star from its centre of mass to the inner Lagrangian point to the distance towards the inner Lagrangian point.
3.1 The equivalent volume radius
When the secondary stars in interacting binaries such as cataclysmic variables or X-ray binaries are tidally locked and in synchronous rotation, for a given orbital period the width of the rotationally-broadened absorption line profile arising from the star scales with the size of its Roche lobe. One can show that the star’s rotational broadening and equivalent volume radius (Eggleton, 1983) ( is the binary separation), defined as the radius of a sphere whose volume is the same as the volume of the secondary star, are related through the expression
| (1) |
For a star that fully fills its Roche lobe, Eggleton (1983) numerically calculated the Roche lobe volume for different mass ratios and determined an analytical expression for as a function of (normally referred to as Eggleton’s formula). However, for stars that do not fill their Roche lobe, one cannot use Eggleton’s formula to determine , instead one has to calculate numerically for a given binary and configuration. The star’s rotational broadening is then given by
| (2) |
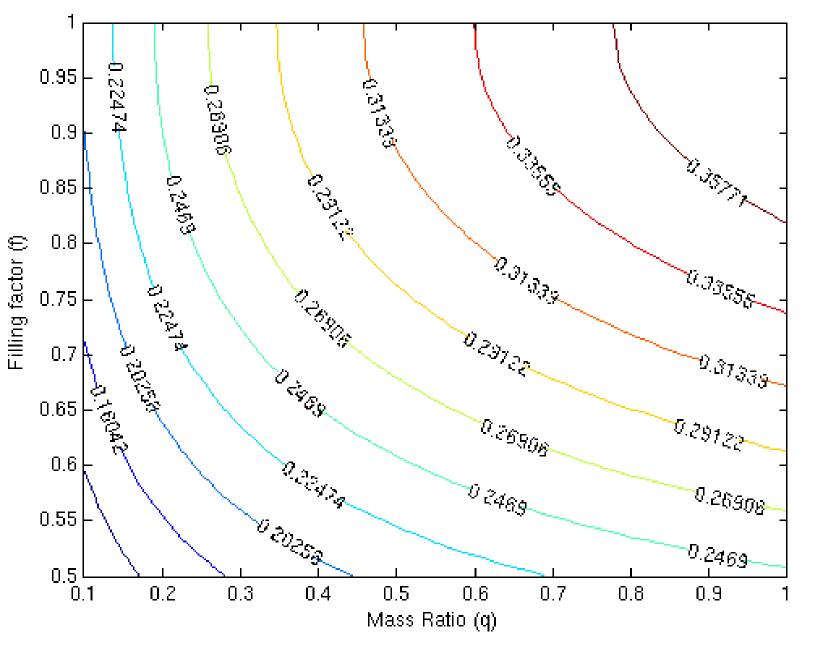
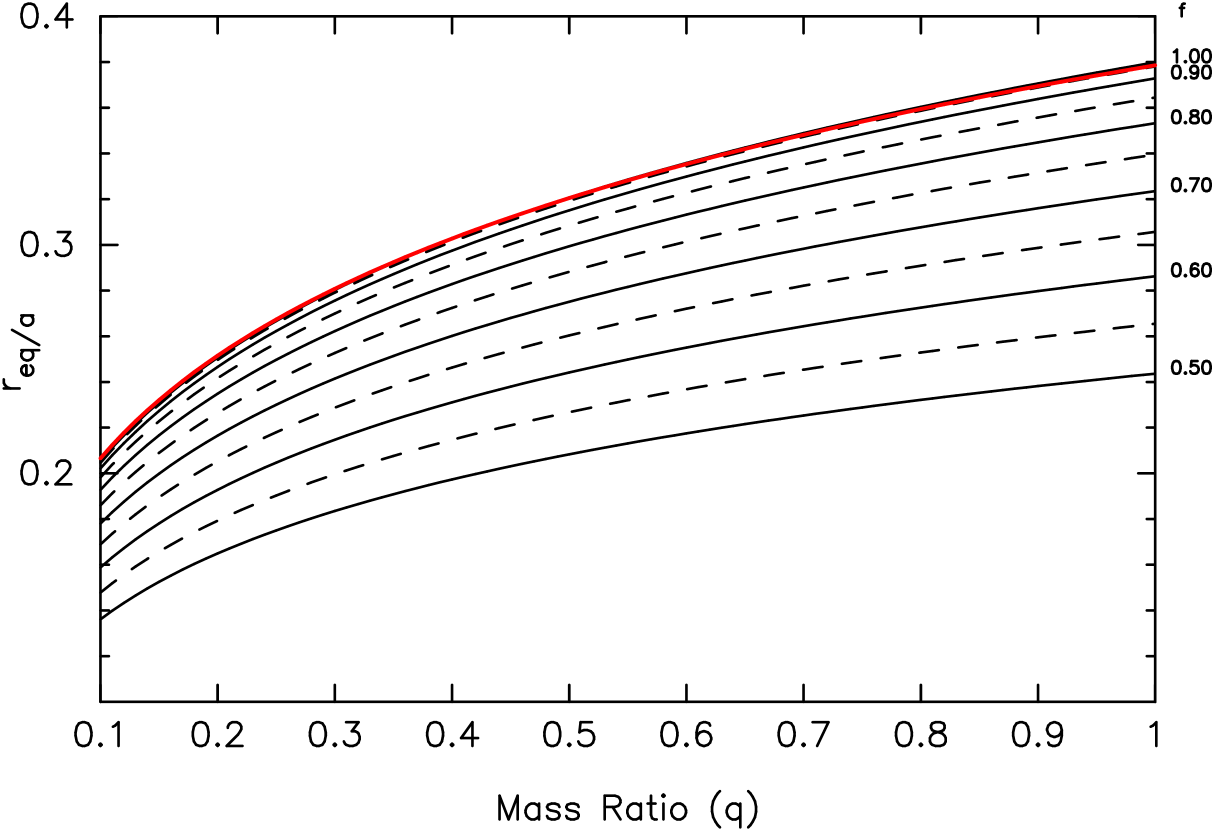
Using our X-ray binary model we numerically determine as a function of and , assuming synchronous rotation. For a given and configuration we determine the binary Roche potential and thus the star’s Roche lobe. We sample the star’s surface with 18340 quadrilaterals of approximately equal area and then perform a numerical integration to calculate its volume and hence equivalent radius. Fig. 1 shows a contour plot of the values for different and values. In Fig. 2 we show the results for in the range 0.5 to 1.0 and in the range 0.1 to 1.0. The model =1.0 is equivalent to Eggleton’s relation and we find our model and Eggleton’s relation are consistent to within 0.1 per cent.
3.2 Light curve
The secondary star’s effective temperature the gravity-darkening exponent and reddening given by , and , respectively determines the observed light arising from the secondary star. The model includes the effects of heating of the secondary star by a point source from the compact object. The irradiating flux is thermalised in the secondary star’s photosphere and is re-radiated locally at a higher effective temperature. For each point on the star’s surface, the effective temperature is calculated by combining the intrinsic and incident fluxes. We assume the ”deep heating” approximation where the irradiation does not affect the temperature structure of the atmosphere. This means that each element radiates as predicted by a model atmosphere for a single star. The scale of the system is set by the distance to the source in parsecs, the orbital period and the radial velocity amplitude of the secondary star (, and , respectively). We use NextGen model-atmosphere fluxes (Hauschildt et al., 1999) to determine the intensity distribution on the secondary star and a quadratic limb-darkening law with coefficients taken from Claret & Bloemen (2011), to correct the intensity for limb-darkening.
3.3 Radial velocity curve
The optical light curves of binary MSPs show the secondary star’s ellipsoidal modulation combined with the effects of heating. The spectrum shows intrinsic absorption lines arising from the secondary star as well as irradiation-induced absorption Balmer lines. Both radial velocity curves are distorted because of shift on the centre of mass of the lines that are used to determine the radial velocities.
The model light curve is determined by integrating the observed flux from each element of area on the star in the observers line-of-sight. For the radial velocity curves we specify the strength of the absorption or emission lines over the secondary star’s surface, and integrate to obtain the corresponding line-of-sight radial velocity. We set the absorption line strength given by its equivalent width (EW) according to the effective temperature for each element on the star. However, as mentioned in Phillips et al. (1999); Shahbaz et al. (2000) we must also consider the consequences of external heating. The vertical temperature gradient in an internally and externally heated atmosphere produces weaker absorption lines than expected from the effective temperature. Since there is no decent models to treat the effects of external heating in atmospheres, we introduce the factor , which represent the fraction of the external radiation flux that exceeds the unperturbed flux. A value of =1.10 means that if the external radiation flux is greater than 10 per cent of the unperturbed flux, then we set the EW for that element to zero, otherwise, the absorption line strength takes the EW corresponding to the effective temperature of the element.
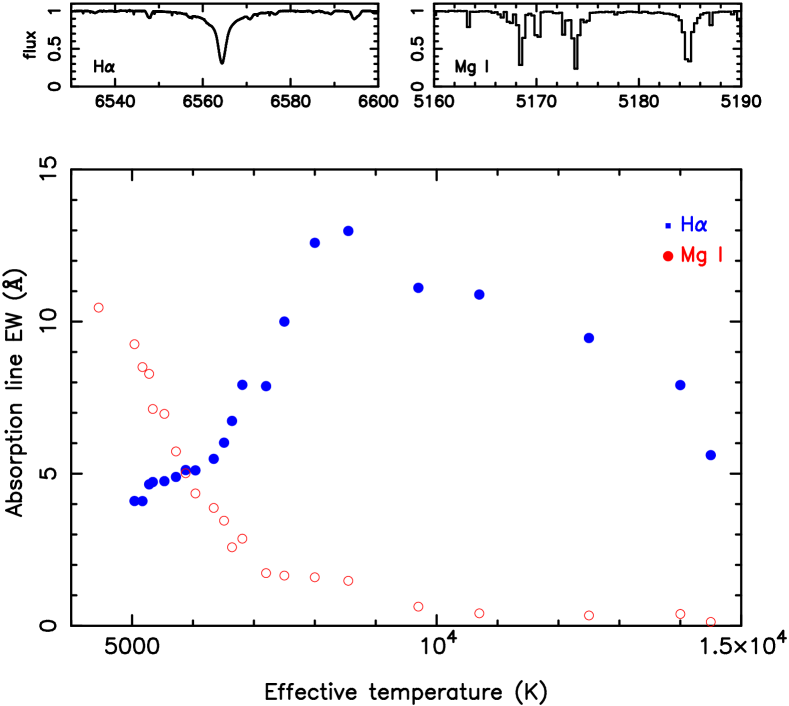
The secondary stars in binary MSPs and X-ray binaries are typically late-type stars, later than F, which contain metals absorption lines such as magnesium, calcium and iron as well as neutral hydrogen. The strongest absorption metal lines in the blue part of the optical spectrum are the Ca I 4226Å, Fe I 4383Å and Mg I b triplet 5167,5172,5183Å. The EW versus temperature relation we use in our model is determined from observed stars in the 04 to K2 spectral type range, obtained from the VLT-UVES Paranal Observatory Project database (Bagnulo et al., 2003). In Fig.3 we show the EW versus relation for the H absorption line as also for comparison the Mg I triplet. Given that we do not really understand irradiation, the EW relation combined with allows the model to fit the observed line strength distribution (Phillips et al., 1999).
3.4 Additional sources of light
Some of the optical light curves of binary MSPs are asymmetric with unequal maxima (Stappers et al., 2001; Schroeder & Halpern, 2014). Various models have been proposed to explain this, such as off-centre heating from an intrabinary shock (Romani & Sanchez, 2016), a hot spot (Tang et al., 2014) or solar-type star spots (van Staden & Antoniadis, 2016).
The collision between the pulsar wind and the mass outflow from the secondary star can produce an intrabinary shock. Therefore the high energy radiation can be mediated by the intrabinary shock producing off-centre heating (Li et al., 2014; Deneva et al., 2016). Indeed the changes in colour and spectral type across the face of the secondary star in 3FGL J0212.1+5320 does not match heating patterns, suggesting that the heating is not direct. X-ray observations of PSR J2215+5135 show an X-ray minimum near orbital phase zero (inferior conjunction of the secondary star) which has been interpreted as due to variable obscuration from an intrabinary shock around the secondary star (Gentile et al., 2014; Romani et al., 2015). In PSR J2215+5135, an intrabinary shock is suggested to explain the significant phase shift of the optical maximum with respect to the radio-pulse ephemeris, as well as the asymmetric optical light curves (Romani & Sanchez, 2016).
In some MSPs, the transition from an accretion-powered to a rotation-powered pulsar has been observed, with the disappearance of features associated with an accretion disk, for example PSR J1023+0038 (Wang et al., 2009). However, as accretion onto the pulsar ceases, it is possible that a quiescent disk could remain between the companion and the light cylinder of the pulsar (Ekşİ & Alpar, 2005), which would contribute to the overall spectral energy distribution. In PSR J2215+5135, the difference between the observed colour temperature and the model temperature has been interpreted as an additional source of light from a hot accretion disk (Schroeder & Halpern, 2014). A large hot star spot could also produce an asymmetric temperature distribution. It is also possible that the intrinsic magnetic field associated with the secondary star could channel the pulsar wind and cause enhanced local heating and an apparent hot spot on the star (Tang et al., 2014). Dark star spots due to strong magnetic activity on the secondary stars could also be present on the surface of the star (van Staden & Antoniadis, 2016). Indeed Roche tomography has revealed observational evidence of star spots in binaries (Shahbaz et al., 2014). Therefore, to account for the possible sources of extra light we include an additional flux components in each wave-band and to simulate the effects of a dark star spot or off-centre heating (hot spot) which produces an asymmetric temperature distribution on the star, we add a Gaussian temperature function to the elements of area on the star. The normalization is positive or negative for a hot or dark sport, respectively. The Gaussian position and width is constrained in latitude and is extended uniformly in longitude across the star, roughly simulating a spot.
| Fitted Parameters | Dark spot | Hot spot |
|---|---|---|
| 0.80 | 0.76 | |
| 0.18 | 0.28 | |
| (∘) | 0.43 | 0.36 |
| ( km s-1) | 217.7 | 216.5 |
| ( erg s-1 cm-2) | -10.06 | – |
| (pc) | 810 | 919 |
| (K) | 6902 | 6416 |
| (K) | 332 | 537 |
| (%) | 2 | 3 |
| , and (%) | 13, 11, 8 | 31, 25, 23 |
| /DOF | 183/122 | 193/123 |
| Derived Parameters | ||
| () | 1.72 | 1.85 |
| () | 0.31 | 0.50 |
| () | 1.18 | 1.16 |
| ( km s-1) | 62.5 | 63.1 |
| ( erg s-1) | 33.8 | - |
| ; | 1.1 | 0.8 |
4 xrbcurve fitting
Here we simultaneously fit the -band light curves and the absorption line radial velocity curve of 3FGL J0212.1+5320 presented in Linares et al. (2016) with xrbcurve to determine the binary masses. The individual (380 data points), (629 data points), (382 data points) band data points, were phase folded according to the orbital ephemeris and averaged into 39, 32 and 39 orbital phase bins, respectively. Similarly, the 131 radial velocity points were averaged into 30 phase bins.
The optical light curves of 3FGL J0212.1+5320 clearly show unequal maxima. The fact that one sees a increase or decrease in light at phase 0.25 or 0.75, respectively, suggests that the extra source of light arises from the surface of the secondary star in terms of a dark star spot or a hot spot. To model these light curves with xrbcurve we assume either a hot or dark spot model. To reduce the number of free parameters in the model, we fix various model parameters. The value of the gravity-darkening exponent depends on the mean temperature and gravity of the secondary star (Claret & Bloemen, 2011). The observed F6 late-type spectral type for the secondary star allows us to fix the gravity-darkening exponent to 0.072 (Lucy, 1967; Claret & Bloemen, 2011). From the observed hydrogen column density we find the reddening to be =0.2510.054 (Linares et al., 2016).
The binary model parameters are , , , , , , , and . There is also the additional source of light in each filter , and , the light curve phase shift , and , the radial velocity phase shift and systemic velocity , , and finally the Gaussian spot parameters, position , width , normalization and extent .
Given , and we calculate and . Given and we determine and which when combined with and gives (see Section 3.1). However, note that the observed value for depends on orbital phase, because it reflects the size of the tidally distorted star. The value for we determine represents the mean radius of the star observed and so the predicted value for is a mean value.
To optimize the fitting procedure to first fit photometric light curve and the absorption-line radial velocity curve with xrbcurve assuming a dark spot on the secondary star. We use the differential evolution algorithm described in Shahbaz et al. (2003) with a crossover probability of 0.9, a mutation scaling factor of 0.9, and a maximum number of generations of 2000, which corresponds to 100,000 calculations of the model. Given that there are a number of different types of data with different number of data points, to optimize the fitting procedure we assigned relative weights to the different data sets, determined after an initial fit. We rescaled the error bars on each data set so that the total reduced of the fit was for each data set separately.
The simultaneous light and radial velocity curve fitting is a multi-dimensional nonlinear optimization problem. In order to obtain a robust error analysis we used Markov chain Monte Carlo (MCMC) method convolved with a differential evolution fitting algorithm; differential evolution adaptive metropolis (dream) (see Vrugt, 2016, and references within), which works well in problems with a high number of dimensions. dream simultaneously runs multiple different chains uses differential evolution (Storn & Price, 1995) as the genetic algorithm for population evolution with a Metropolis selection rule to decide whether parents are replaced by candidate points not. In order to ensure that the MCMC has converged we also performed the Gelman-Ruben test, which analyzes the difference between multiple Markov chains and we also visually inspected the trace of the parameters. The convergence is assessed by comparing the estimated between-chains and within-chain variances for each model parameter (Gelman & Rubin, 1992). We use a Bayesian framework to make statistical inferences on our binary model parameters. Our fitting makes use of flat prior probability distributions for all the model parameters, except , where we use a Gaussian prior [see Gregory (2005) for an introduction to Bayesian analysis]. We use 20 individual chains to explore the parameter space and followed each for 40,000 iterations. We reject the first 500 iterations (”burn-in”) and only include every 10th point (”thinning”), based on the observed auto correlation lengths for the individual parameters.
5 Results
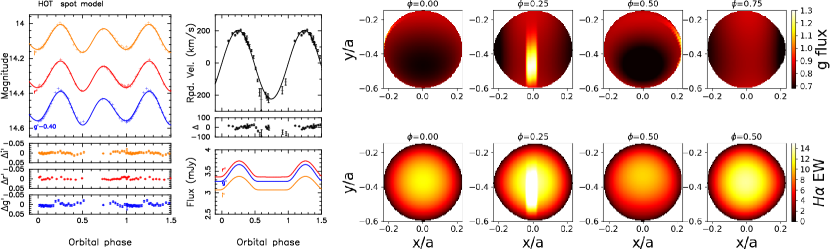
We simultaneously fit , and -band light curves and an absorption line radial velocity curve of 3FGL J0212.1+5320 with xrbcurve with a constant source of light in each band to account for a possible disk and/or intrabinary shock and two model scenarios (a) a dark star spot or (b) a hot spot due to off-centre heating to account for the unequal maxima. Our preliminary fits show that the dark or hot spot model is not constrained, which means that the model requires all the inner face of the star contributes to the radial velocity curve, so we fix it to a large value accordingly. Furthermore, we find that the phase shifts for each filter are the same, so in our final fits we set ==.
Also, for the hot spot model we find that no heating is required, so we fix to zero. The dark and hot spot model have 18 and 17 free model parameters, respectively. For our final fits, the dark and hot spot model best fits have a of 182 and 193, with 122 and 123 degrees of freedom, respectively. Using the F-test to test the null hypothesis that the of two models are the same, we find that we can reject the null hypothesis at the 1.1 per cent significance level, Hence, statistically the dark spot model is only better than the hot spot model at the 98.9 per cent () confidence level.
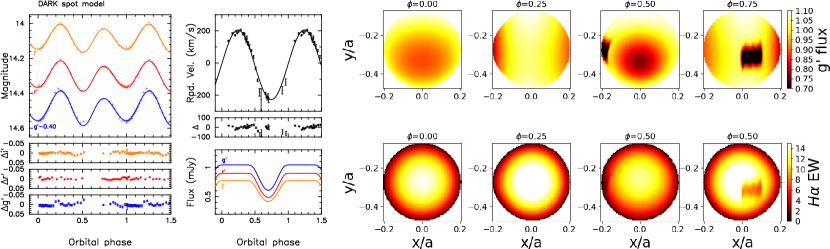
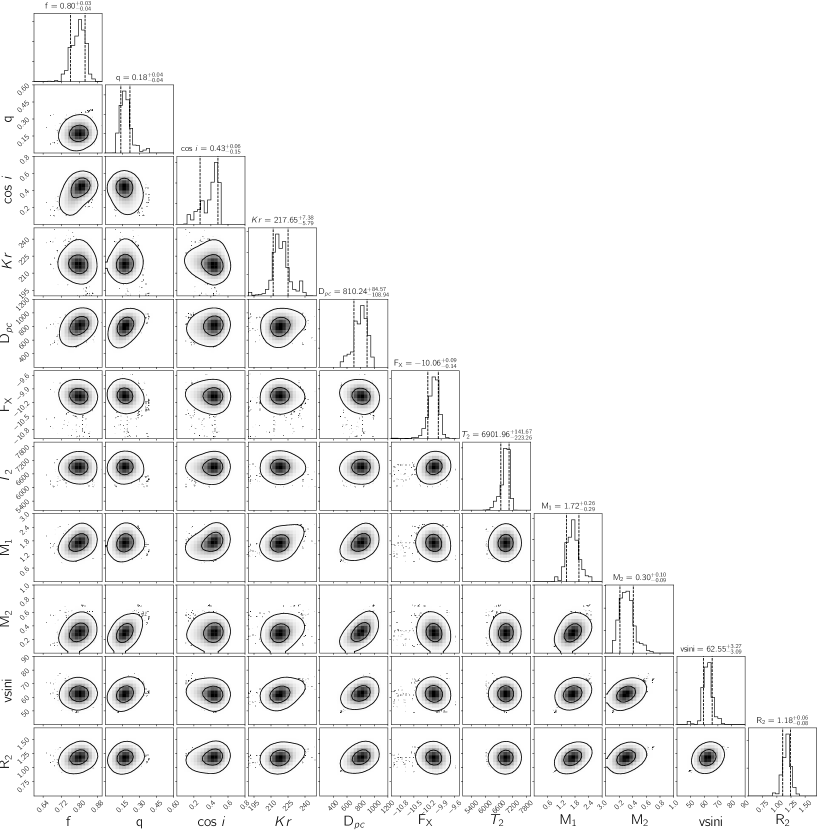
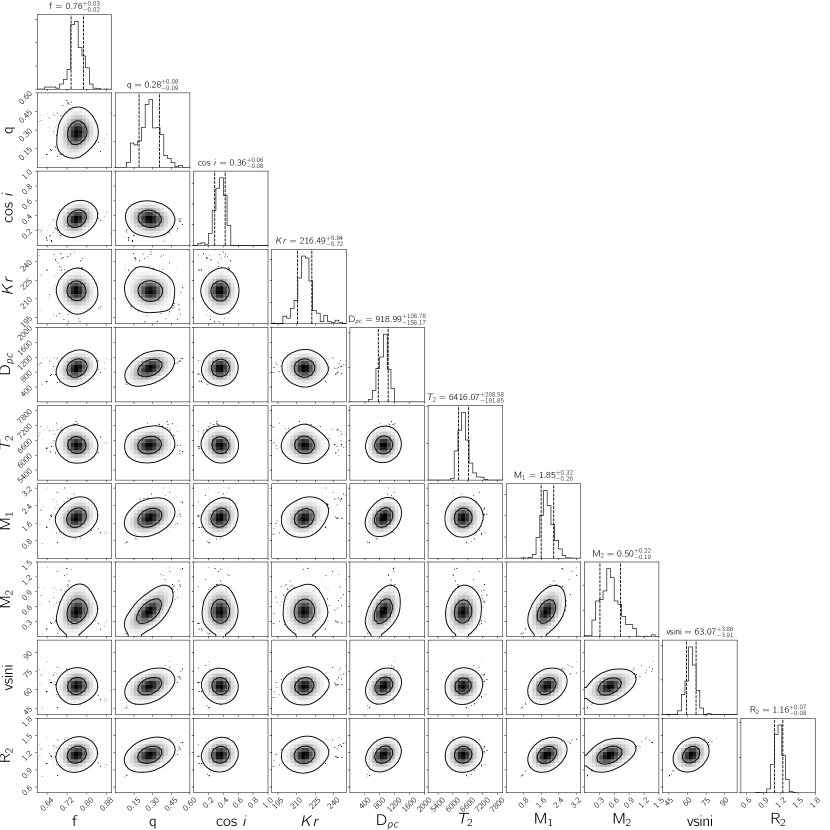
The best fit models for the hot and dark spot are shown in Figures 5 and 4, respectively. The plots shows the best fit to the light and radial velocity curves as well as the light curve of the extra source of light in each band. We also show the observed maps of the continuum flux and Habsorption line strength on the secondary star at different orbital phases. In Table 1 we give the mean and 1- limits of the posterior probability distribution functions on each parameter for both models. The result of the MCMC for the hot and dark spot model are shown in Figs. 7 and 6, respectively. As one can see, most of the two-dimensional probability distribution functions are relatively well determined. Changing the gravity darkening coefficient only changes the by 3, resulting in a change in of 10 per cent.
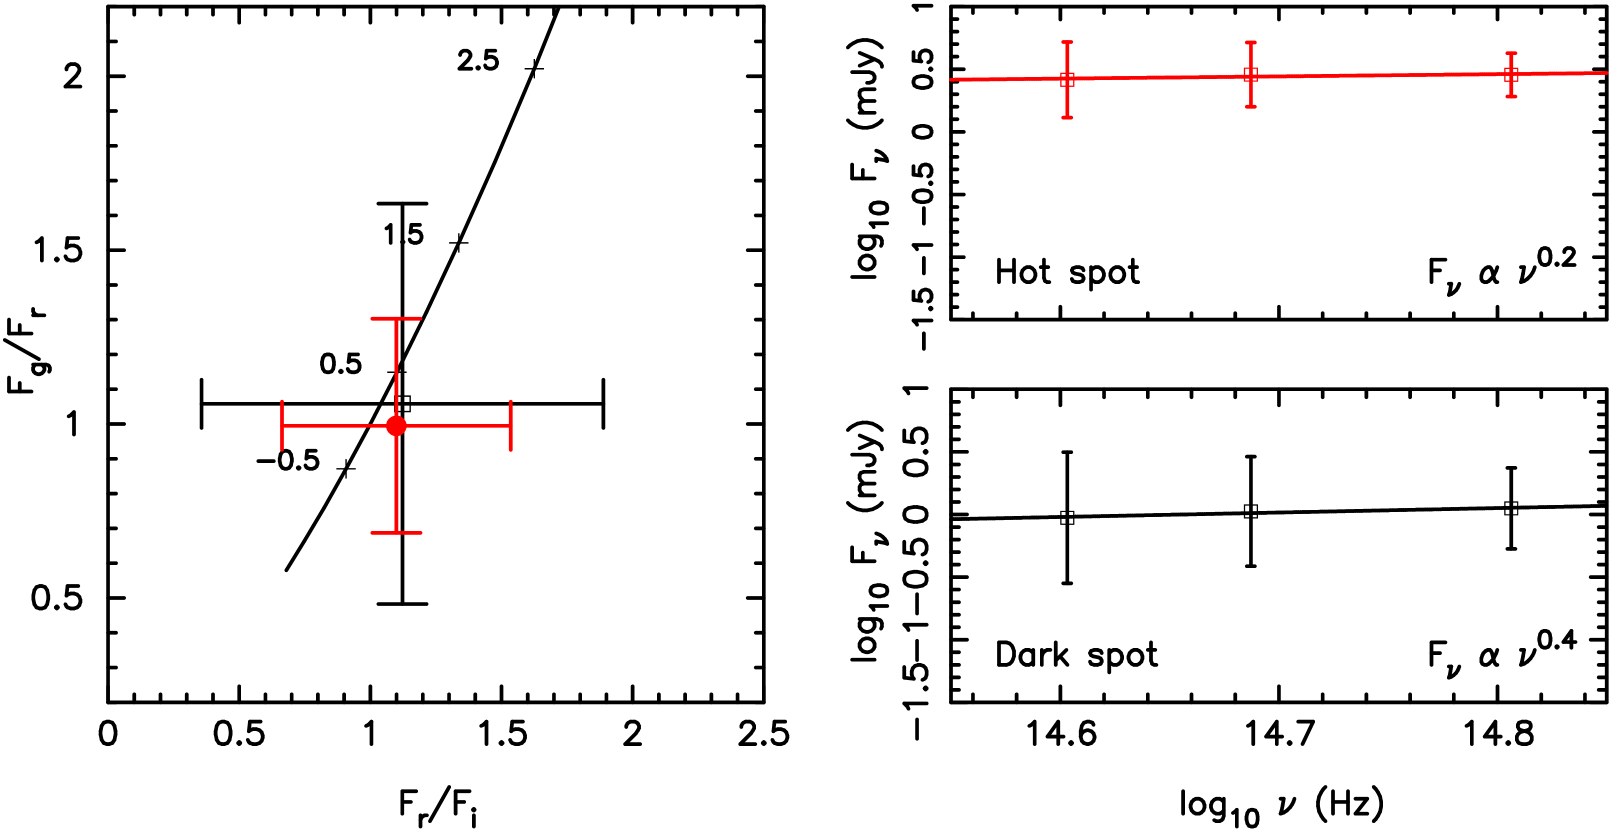
The fits with the dark and hot spot model give similar values for , and (see Table 1). However, the value for and are different. The dark spot model best fit suggests a system at an inclination angle of 65∘ and mass ratio =0.18 with some effects of X-ray heating; 24 percent of the secondary star has a change in temperature more than 10 degrees larger than the non-irradiated level. The dark spot has a minumum temperature of =332 K and covers 2 percent of the star; see Fig. 4). In contrast the best fit with a hot spot suggest a system at slightly higher inclination angle of 69∘ and a less extreme mass ratio =0.28 with no heating. The hot spot has a temperature of =538 K and covers 3 percent of the star. For the dark spot model we find that the extra source of light contributes 13, 11 and 8 per cent to the observed flux in the , and bands, respectively. Similarly for the hot spot model we find that the extra source of light contributes 31, 25 and 23 per cent to the observed flux in the , and bands, respectively. In Fig. 8 we show the spectrum of the extra flux component for the dark and hot spot model, which can be represented with a spectral index () of 1.1 and 0.8, respectively.
In principle the shape of the ellipsoidal light curve can provide important clues to the binary inclination angle, because the peak to peak amplitude and difference between the two minima depend primarily on the binary inclination angle and mass ratio. Irradiation not only fills the minimum at phase 0.5, but it also a produces a larger amplitude modulation. However, for a Roche lobe under-filling star, this dependence with mass ratio disappears, because the star is not as tidally distorted compared to a fully Roche lobe filling star. For our values of the dependence of the light curve amplitude with mass ratio still exists. (Shahbaz, 1998). For a similar inclination angle, a system with a less extreme mass ratio and no heating will produce a similar light curve to a system with a more extreme mass ratio and with heating. Our hot and dark spot model fits suggest either a non-irradiated system at an extreme mass ratio or weakly irradiated system at a less extreme mass ratio, respectively.
The lack of heating of the secondary star required by the hot spot model by the pulsar wind and/or radiation is not surprising, given the wide orbit. The only other MSP which also has a wide orbit with a similar lack of irradiation is PSR J1740–5340 (Orosz & van Kerkwijk, 2003). Both the hot and dark spot model give similar values for , , and , but different values for and . determined from the hot spot model is consistent with the observed spectral type F62 (Linares et al., 2016), corresponding to a temperature range of 6170–6640 K (Pecaut & Mamajek, 2013).
6 Discussion
6.1 The extra light source
Coti Zelati et al. (2014) determined the spectral energy distribution of PSR J1023+0038 from near-IR to X-rays, when the system was in an accretion-powered phase. They found that the spectral energy distribution is well modelled by contributions from the secondary star, the accretion disc and an intrabinary shock. The neutron star spin-down luminosity irradiates the accretion disc and the secondary star, accounting for the UV and optical emission. X-rays and gamma-rays are produced in an intrabinary shock and the shock emission is powered by the neutron star spin-down luminosity which extends to lower energies with a photon index of 1.5 which corresponds to a spectral index of 2.5 (; , where is the X-ray (0.5–10 keV) photon spectrum and is the source spectrum). Indeed, the photon index measured for redbacks in the accretion or pulsar state is in the range 0.9–1.8 (Linares, 2014) and 3FGL J0212.1+5320 is no exception with a photon index of , corresponding to a spectral index of .
When determining Linares et al. (2016) found that their best match template star required a non-stellar light veiling of 10–30 per cent in the -band. For the dark spot model we find that the extra source of light contributes 13, 11 and 8 per cent to the observed flux in the , and bands, respectively. Similarly for the hot spot model we find that the extra source of light contributes 31, 25 and 23 per cent to the observed flux in the , and bands, respectively. Both models agree well with the veiling measured from the spectra (Linares et al., 2016). The extra light source contribution required to fit our light curves can be represented with a spectral index; . We find a spectral index of 1.1 and 0.8, for the dark and hot spot model, respectively, which does not agree with the X-ray spectral index, suggesting that the extra optical emission may not be produced by an intrabinary shock.
6.2 Energy flux
Li et al. (2016) and Linares et al. (2016) have determined the spectral energy distribution of 3FGL J0212.1+5320 which shows the optical band dominated by the secondary star, the gamma-rays from the MSP and the shock between the MSP and secondary star’s wind (intrabinary shock), which most likely powers the X-ray emission. The unabsorbed 0.1–100 GeV energy flux is 1.7110-11 erg s-1 cm-2, whereas the unabsorbed 0.5–10 keV luminosity is 1.810-12 erg s-1 cm-2(Acero, 2015; Linares et al., 2016). We can compare these values with the bolometric flux determined from our dark spot model; no X-ray heating is required in the hot spot model. For the dark spot model we find a flux of 6.610-11 erg s-1 cm-2which is a factor of 4 more than what is observed in the -rays. The extra source of heating arise from the pulsar which emits prompt particles to heat the secondary star (Romani & Sanchez, 2016)
6.3 The secondary stars rotational broadening
Synchronization via tidal forces will suppress differential rotation and make the angular velocity of the secondary star constant. However, since the star is distorted, the linear rotational velocity will vary with longitude around the star and so will vary across the orbit. The variations show two maxima and two minima per orbital cycle and have an amplitude of 10 km s-1, which depends on and (Shahbaz, 1998). The procedure normally used to measure the secondary star’s rotational broadening is to compare it with the spectrum of a slowly rotating template star convolved with a limb-darkened standard rotation profile (see Gray, 2005; Collins & Truax, 1995, and references within). The width of the limb-darkened standard rotation profile (adopting the continuum value for the limb-darkening coefficient) is varied until it matches the width of the target spectrum (see, for example Marsh et al., 1994). However, because of the assumed spherical shape of the rotation profile. there are assumptions inherent in this method. The secondary stars in binary MSPs substantially fill their Roche lobes, and so they will have distorted line profiles which depend on the exact Roche binary geometry (Shahbaz, 1998). Also, because both temperature and gravity vary over the star’s photosphere due to the Roche lobe shape, the spectrum of the secondary cannot be described by a single-star spectrum. Finally, we use the continuum value for the limb-darkening coefficient. Firstly, because the line flux arises from higher regions in the atmosphere than the continuum flux, absorption lines have core limb-darkening coefficients much less than the continuum value (Collins & Truax, 1995). Hence using the standard rotation profile with zero and the continuum value for the line limb-darkening coefficient gives a value for that brackets the value found using the full geometrical treatment (Shahbaz, 2003). Using the extreme cases for the limb-darkening coefficient of zero or the continuum value introduces a systematic uncertainty of about 14 per cent in the determination (Welsh et al., 1995).
Linares et al. (2016) used the standard method described above to estimate the projected rotational velocity of the secondary star, which they find to be =73.21.6 km s-1from spectra around orbital phase 0.2. They then use this with their value for , determined from a sinusoidal fit to their radial velocity curve and obtain =0.26 (see equation 1), assuming a Roche lobe filling, tidally locked and spherically symmetric companion star (see Section 3.1). However, the variation of with orbital phase (10–15 per cent) introduces coupled with the uncertainties in the line limb-darkening coefficient (14 per cent) and the fact that the star does not fill its Roche lobe, contributes significantly to the accuracy to which one can determine using this method.
6.4 Favoured model
3FGL J0212.1+5320 is thought to be a redback based on its optical, X-ray and -ray properties, which are similar to other redbacks (see Table 1 in Li et al., 2016). Most redbacks have secondary stars with minimum secondary star masses of 0.8 (Roberts, 2013; Strader et al., 2014) and so the secondary star masses determined from the dark and hot spot model are consistent with the system being a redback. The reduced of the best-fit for the dark and hot spot models are significantly different, with the dark spot model being only statistically better at the 98.9 (=2.29) confidence level (see Section 5), The value determined for for both models agrees (within 3-) with the observations (73.21.6 km s-1 Linares et al. 2016), however, the hot spot model with =6416 K more constent with observations. (6170–6640 K Linares et al. (2016)). We therefore, favour the hot spot model which gives a neutron star mass of =1.85 and a secondary star mass of =0.50 .
6.5 Binary masses
Li et al. (2016) obtained and band light curves and two absorption line radial velocity points. They used the ELC code (Orosz & Hauschildt, 2000) to fit the data, assuming =5750 K, 0.4 with no irradiation effects. They performed a grid search in =60–90 degrees and found =0.70 to 0.64 (where is the ratio of the equivalent volume radius of the companion star to the Roche lobe radius) corresponding to =1.5 to 2.2 . Note that their definition for the Roche lobe filling factor is different to that in our model. Their estimated range for corresponds to =0.50 to 0.54 (determined using xrbcurve), which is very different to the value we obtain (see Table 1). However, as noted by the authors, given their poor fits and large systematics, the binary parameters they obtain are merely indicative. In contrast we simultaneously fit the absorption line radial velocity and , , light curve, which allow us to constrain various model parameters such as the filling factor of the companion and its surface temperature. It is evident that this redback companion does not fill its Roche lobe, thus confirming the previous finding by Breton et al. (2013) that redbacks and black widows may have smaller radii than originally expected (due to the presence of radio eclipses in some systems).
The presence of temperature asymmetry also indicates that a hot or cold spot is present on the companion’s surface. The physical reason for this remains unclear (see Section 3.4 for possible models), but long-term monitoring could provide further insights to shed light on this mystery. A cold or a hot spot due to an atmospheric phenomenon might move on a time scale related to the magnetic activity on the star for instance. Star spots are believed to be common features on many late-type stars and typically vary on timescales of months to a few years Bouvier & Bertout (1989). Star spots have been observed in the surface map of the secondary star in the LMXB Cen X–4 (Shahbaz et al., 2014). Indeed, in cataclysmic variables, studies of the surface maps of the secondary stars show star spots moving on timescale of few days (Hill et al., 2014).
There are about 32 reliable neutron star mass measurements in X-ray binaries, double neutron star systems and millisecond pulsars, most of which are are at least partly based on the radio timing techniques (Özel & Freire, 2016), Studies statistically distinguish between different types of neutron stars and between those believed to be close to their birth masses, with a mean mass of 1.350.05 which reflects a highly tuned formation channel (Özel et al., 2012; Kiziltan et al., 2013), and the ones that have undergone long-term accretion episodes. Most recycled pulsars are accompanied by mid-F to late-K type low-mass 0.5 companions but for these systems to form in the age of the Universe, the companion must originally have been a star of 1 . Thus, the companion star must have lost a large fraction of its mass, accreted onto the neutron star, leading to a increase in the neutron star’s mass. The most precise massive neutron star measurements have been obtained through the measurement of the Shapiro delay, 1.940.04 and 1.6670.021 in PSR J1614-2230 and PSR J1903+0327, respectively (Demorest et al., 2010; Freire et al., 2011). These masses has allowed us to place fundamental constraints on the equation of state of nuclear matter at high densities, excluding many of the soft equations of state (Lattimer & Prakash, 2004). Dynamical photometric and spectroscopic studies of binary MSPs have largely revealed that neutron star masses in these systems are generally heavier than the 1.4 canonical value, with some particularly heavy ones in PSR B1957+20 (=2.4 , van Kerkwijk et al. 2011) and PSR J1816+4510 (1.84 , Kaplan et al. 2013). Our mass measurement for the neutron star in 3FGL J0212.1+5320 using the hot spot model suggests a massive 1.85 neutron star.
ACKNOWLEDGEMENTS
This research has been supported by the Spanish Ministry of Economy and Competitiveness (MINECO) under the grant AYA2013-42627. M.L. is supported by EU’s Horizon 2020 programme through a Marie Sklodowska-Curie Fellowship (grant nr. 702638). R.P.B. received funding from the European Union Seventh Framework Programme under grant agreement PIIF-GA-2012-332393. This paper makes use of the IAC’s Supercomputing facility condor.
References
- Abdo (2009) Abdo A. A. e. a., 2009, Science, 325, 848
- Acero (2015) Acero F. e. a., 2015, ApJS, 218, 23
- Alpar et al. (1982) Alpar M. A., Cheng A. F., Ruderman M. A., Shaham J., 1982, Nature, 300, 728
- Archibald et al. (2009) Archibald A. M., et al., 2009, Science, 324, 1411
- Bagnulo et al. (2003) Bagnulo S., Jehin E., Ledoux C., Cabanac R., Melo C., Gilmozzi R., ESO Paranal Science Operations Team 2003, The Messenger, 114, 10
- Bassa et al. (2014) Bassa C. G., et al., 2014, MNRAS, 441, 1825
- Benvenuto et al. (2014) Benvenuto O. G., De Vito M. A., Horvath J. E., 2014, ApJ, 786, L7
- Bhattacharya & van den Heuvel (1991) Bhattacharya D., van den Heuvel E. P. J., 1991, Phys. Rep., 203, 1
- Bouvier & Bertout (1989) Bouvier J., Bertout C., 1989, A&A, 211, 99
- Breton et al. (2013) Breton R. P., et al., 2013, ApJ, 769, 108
- Chen et al. (2013) Chen H.-L., Chen X., Tauris T. M., Han Z., 2013, ApJ, 775, 27
- Claret & Bloemen (2011) Claret A., Bloemen S., 2011, A&A, 529, A75
- Collins & Truax (1995) Collins II G. W., Truax R. J., 1995, ApJ, 439, 860
- Coti Zelati et al. (2014) Coti Zelati F., et al., 2014, MNRAS, 444, 1783
- Crawford et al. (2013) Crawford F., et al., 2013, ApJ, 776, 20
- Demorest et al. (2010) Demorest P. B., Pennucci T., Ransom S. M., Roberts M. S. E., Hessels J. W. T., 2010, Nature, 467, 1081
- Deneva et al. (2016) Deneva J. S., et al., 2016, ApJ, 823, 105
- Eggleton (1983) Eggleton P. P., 1983, ApJ, 268, 368
- Ekşİ & Alpar (2005) Ekşİ K. Y., Alpar M. A., 2005, ApJ, 620, 390
- Freire et al. (2011) Freire P. C. C., et al., 2011, MNRAS, 412, 2763
- Gelman & Rubin (1992) Gelman A., Rubin D., 1992, Statistical Science, 7, 457
- Gentile et al. (2014) Gentile P. A., et al., 2014, ApJ, 783, 69
- Gray (2005) Gray D. F., 2005, The Observation and Analysis of Stellar Photospheres:, 3 edn. Cambridge University Press, Cambridge, doi:10.1017/CBO9781316036570
- Gregory (2005) Gregory P. C., 2005, Bayesian Logical Data Analysis for the Physical Sciences: A Comparative Approach with ‘Mathematica’ Support. Cambridge University Press
- Hauschildt et al. (1999) Hauschildt P. H., Allard F., Baron E., 1999, ApJ, 512, 377
- Hessels et al. (2011) Hessels J. W. T., et al., 2011, in Burgay M., D’Amico N., Esposito P., Pellizzoni A., Possenti A., eds, American Institute of Physics Conference Series Vol. 1357, American Institute of Physics Conference Series. pp 40–43 (arXiv:1101.1742), doi:10.1063/1.3615072
- Hill et al. (2014) Hill C. A., Watson C. A., Shahbaz T., Steeghs D., Dhillon V. S., 2014, MNRAS, 444, 192
- Kaplan et al. (2013) Kaplan D. L., Bhalerao V. B., van Kerkwijk M. H., Koester D., Kulkarni S. R., Stovall K., 2013, ApJ, 765, 158
- Kiziltan et al. (2013) Kiziltan B., Kottas A., De Yoreo M., Thorsett S. E., 2013, ApJ, 778, 66
- Lattimer & Prakash (2004) Lattimer J. M., Prakash M., 2004, Science, 304, 536
- Li et al. (2014) Li M., Halpern J. P., Thorstensen J. R., 2014, ApJ, 795, 115
- Li et al. (2016) Li K.-L., Kong A. K. H., Hou X., Mao J., Strader J., Chomiuk L., Tremou E., 2016, ApJ, 833, 143
- Linares (2014) Linares M., 2014, ApJ, 795, 72
- Linares et al. (2016) Linares M., Miles-Páez P., Rodríguez-Gil P., Shahbaz T., Casares J., Fariña C., Karjalainen R., 2016, preprint, (arXiv:1609.02232)
- Lucy (1967) Lucy L. B., 1967, Z. Astrophys., 65, 89
- Marsh et al. (1994) Marsh T. R., Robinson E. L., Wood J. H., 1994, MNRAS, 266, 137
- Orosz & Hauschildt (2000) Orosz J. A., Hauschildt P. H., 2000, A&A, 364, 265
- Orosz & van Kerkwijk (2003) Orosz J. A., van Kerkwijk M. H., 2003, A&A, 397, 237
- Özel & Freire (2016) Özel F., Freire P., 2016, ARA&A, 54, 401
- Özel et al. (2012) Özel F., Psaltis D., Narayan R., Santos Villarreal A., 2012, ApJ, 757, 55
- Papitto et al. (2013) Papitto A., et al., 2013, Nature, 501, 517
- Pecaut & Mamajek (2013) Pecaut M. J., Mamajek E. E., 2013, ApJS, 208, 9
- Phillips et al. (1999) Phillips S. N., Shahbaz T., Podsiadlowski P., 1999, MNRAS, 304, 839
- Roberts (2013) Roberts M. S. E., 2013, in van Leeuwen J., ed., IAU Symposium Vol. 291, Neutron Stars and Pulsars: Challenges and Opportunities after 80 years. pp 127–132 (arXiv:1210.6903), doi:10.1017/S174392131202337X
- Romani & Sanchez (2016) Romani R. W., Sanchez N., 2016, ApJ, 828, 7
- Romani et al. (2015) Romani R. W., Filippenko A. V., Cenko S. B., 2015, ApJ, 804, 115
- Schroeder & Halpern (2014) Schroeder J., Halpern J., 2014, ApJ, 793, 78
- Shahbaz (1998) Shahbaz T., 1998, MNRAS, 298, 153
- Shahbaz (2003) Shahbaz T., 2003, MNRAS, 339, 1031
- Shahbaz et al. (2000) Shahbaz T., Groot P., Phillips S. N., Casares J., Charles P. A., van Paradijs J., 2000, MNRAS, 314, 747
- Shahbaz et al. (2003) Shahbaz T., Zurita C., Casares J., Dubus G., Charles P. A., Wagner R. M., Ryan E., 2003, ApJ, 585, 443
- Shahbaz et al. (2004) Shahbaz T., Casares J., Watson C. A., Charles P. A., Hynes R. I., Shih S. C., Steeghs D., 2004, ApJ, 616, L123
- Shahbaz et al. (2014) Shahbaz T., Watson C. A., Dhillon V. S., 2014, MNRAS, 440, 504
- Stappers et al. (2001) Stappers B. W., van Kerkwijk M. H., Bell J. F., Kulkarni S. R., 2001, ApJ, 548, L183
- Storn & Price (1995) Storn R., Price K., 1995, Differential Evolution - A simple and efficient adaptive scheme for global optimization over continuous spaces
- Strader et al. (2014) Strader J., Chomiuk L., Sonbas E., Sokolovsky K., Sand D. J., Moskvitin A. S., Cheung C. C., 2014, ApJ, 788, L27
- Tang et al. (2014) Tang S., et al., 2014, ApJ, 791, L5
- Vrugt (2016) Vrugt J. A., 2016, Environmental Modelling & Software, 75, 273
- Wang et al. (2009) Wang Z., Archibald A. M., Thorstensen J. R., Kaspi V. M., Lorimer D. R., Stairs I., Ransom S. M., 2009, ApJ, 703, 2017
- Welsh et al. (1995) Welsh W. F., Horne K., Gomer R., 1995, MNRAS, 275, 649
- van Kerkwijk et al. (2011) van Kerkwijk M. H., Breton R. P., Kulkarni S. R., 2011, ApJ, 728, 95
- van Staden & Antoniadis (2016) van Staden A. D., Antoniadis J., 2016, ApJ, 833, L12