Where Is the Flux Going? The Long-Term Photometric Variability of Boyajian’s Star
Abstract
We present days of photometric monitoring of Boyajian’s Star (KIC 8462852) from the All-Sky Automated Survey for Supernovae (ASAS-SN) and days of monitoring from the All Sky Automated Survey (ASAS). We show that from 2015 to the present the brightness of Boyajian’s Star has steadily decreased at a rate of mmag yr-1, such that the star is now 1.5% fainter than it was in February 2015. Moreover, the longer time baseline afforded by ASAS suggests that Boyajian’s Star has also undergone two brightening episodes in the past 11 years, rather than only exhibiting a monotonic decline. We analyze a sample of comparison stars of similar brightness located in the same ASAS-SN field and demonstrate that the recent fading is significant at % confidence. The dimming rate is consistent with that measured with Kepler data for the time period from 2009 to 2013. This long-term variability is difficult to explain with any of the physical models for the star’s behavior proposed to date.
Subject headings:
stars: activity; stars: individual (Boyajian’s Star); stars: peculiar; stars: variables: general1. INTRODUCTION
Boyajian’s Star (KIC 8462852) has been a fascinating mystery since its discovery was made public in late 2015. Boyajian et al. (2016) showed that the star underwent a series of asymmetric, aperiodic, brief dips in brightness from 2009 to 2013 while it was being monitored by Kepler. These dips have typical timescales of a few days and range in depth from % to more than 20%. Boyajian et al. (2016) cataloged ten dip complexes detected during the Kepler mission.
Such irregular dimming events are not unusual for young stars (e.g., Alencar et al., 2010; Morales-Calderón et al., 2011; Cody et al., 2014), but Boyajian’s Star exhibits no obvious signs of youth (Boyajian et al., 2016). Instead, it appears to be an otherwise unremarkable main sequence F star (Lisse et al., 2015). The star also lacks an infrared excess that would be expected to accompany significant amounts of nearby warm dust (Marengo et al., 2015; Thompson et al., 2016).
Initial attempts to explain the dips focused on circumstellar material, perhaps in the form of debris from a collision of planetesimals (Boyajian et al., 2016) or a large family of comets (Bodman & Quillen, 2016). While these models can potentially account for the dipping activity without violating the infrared constraints, they were severely challenged by the finding by Schaefer (2016) that Boyajian’s Star appears to have been monotonically fading since the late 19th century, with a total change in its brightness of 0.16 mag from 1890 to 1989. The interpretation of the archival photographic measurements for the star has been controversial (Hippke et al., 2016, 2017), but Montet & Simon (2016) demonstrated using Kepler full-frame images that the star’s brightness did steadily decline by a total of % over the four years of Kepler’s main mission. Further complicating the situation, Makarov & Goldin (2016) used astrometry from Kepler to show that the variability detected by Boyajian et al. (2016) in the Kepler long-cadence light curve must originate from at least two distinct sources. While the strong dips can only occur on Boyajian’s Star given its brightness relative to the closest neighboring stars, the Makarov & Goldin results indicate that the longer-term, low-amplitude periodicities (ranging from 0.88 d to d) are most likely attributable to a nearby star or stars.
After the long-term variability of Boyajian’s Star became clear, Wright & Sigurðsson (2016) provided a comprehensive summary of all possible mechanisms to account for the observed brightness changes, and Metzger et al. (2017) and Foukal (2017) presented new models for possible intrinsic variability of the star. In particular, Metzger et al. (2017) show that the ingestion of a planet and the accompanying destruction of its satellite system could produce both brief dips and a long-term dimming with a rate comparable to that measured by Schaefer (2016) and Montet & Simon (2016), providing the first simultaneous explanation for all aspects of the star’s variability. Foukal (2017) argues instead that the convective structure of the star may be able to store enough energy to explain the dips and longer-term fading.
In this paper, we examine the long-term photometric behavior of Boyajian’s Star from the ground using data from the All-Sky Automated Survey for Supernovae (ASAS-SN; Shappee et al., 2014) and the All Sky Automated Survey (ASAS; Pojmański, 2002). In §2 we describe the ASAS-SN and ASAS imaging of the Kepler field. In §3 we analyze the ASAS-SN observations of Boyajian’s Star and our comparison sample. In §4 we analyze the ASAS observations. We discuss the interpretation of these results in light of ideas suggested to explain the behavior of Boyajian’s Star in §5 and we present our conclusions in §6.
2. OBSERVATIONS
2.1. ASAS-SN
ASAS-SN is an all-sky survey that monitors the entire sky for transients every days down to a -band magnitude of . The survey currently consists of two fully robotic units, one on Haleakala, Hawaii and one on Cerro Tololo, Chile, each with four 14 cm telescopes. The field containing Boyajian’s Star was observed a total of 377 times from 2015 February 24 (UT) to 2017 May 15 by the northern ASAS-SN unit, “Brutus”. This ASAS-SN field is labeled F2006+46_0982, which is centered on R.A.:06:46.5, Decl.:59:27.8 and is observed with the Brutus camera labeled “bd”. In order to provide a comparison sample of stars with similar brightness, we used the SIMBAD database (Wenger et al., 2000) to select stars located in the same ASAS-SN field and within mag of the brightness of Boyajian’s Star ().
We performed aperture photometry for each of these stars using automated measurements similar to those described by Kochanek et al. (2017) except that we align, interpolate, and stack the dithered images (usually 3) acquired during each epoch. Experimentation suggested that the most robust results for our purposes could be obtained using a larger photometric aperture of 3 pixels (″). The median photometric uncertainty for these choices is 0.010 mag. The photometric calibration for each star is determined from the magnitudes of stars in the AAVSO All-Sky Photometric Survey (APASS; Henden et al., 2012) catalog located within 075 that also have photometric uncertainties less than 0.1 mag. Using fainter or more distant APASS stars or larger photometric apertures tended to produce poorer results for this field and brightness range.
2.2. ASAS
ASAS is a long-term variability survey that scans a large fraction of the sky from two locations, Las Campanas, Chile (since 1997) and Haleakala, Hawaii (since 2006). From Hawaii, ASAS simultaneously monitors the sky in two filters ( and ) with two 10 cm telescopes. ASAS -band aperture photometry is calibrated to Tycho magnitudes by determining the median difference between ASAS instrumental magnitudes and Tycho in regions. The zero point for each ASAS field is then calculated by interpolating the results from the grid of regions with a spatially smooth function. ASAS has obtained a total of 564 -band images of Boyajian’s Star spanning from 2006 May 31 to the beginning of the 2017 May dipping activity. A large majority of these images (517) are in ASAS field 616, centered at R.A.:15:00, Decl.:00:00. As with the ASAS-SN data, we consider only observations in the same field in order to minimize systematics between Boyajian’s Star and comparison objects. Relative to ASAS-SN, ASAS has the advantage of a much longer time baseline, but the disadvantage of larger photometric uncertainties, with a median uncertainty of 0.028 mag per measurement.
3. ANALYSIS OF ASAS-SN DATA
3.1. Boyajian’s Star
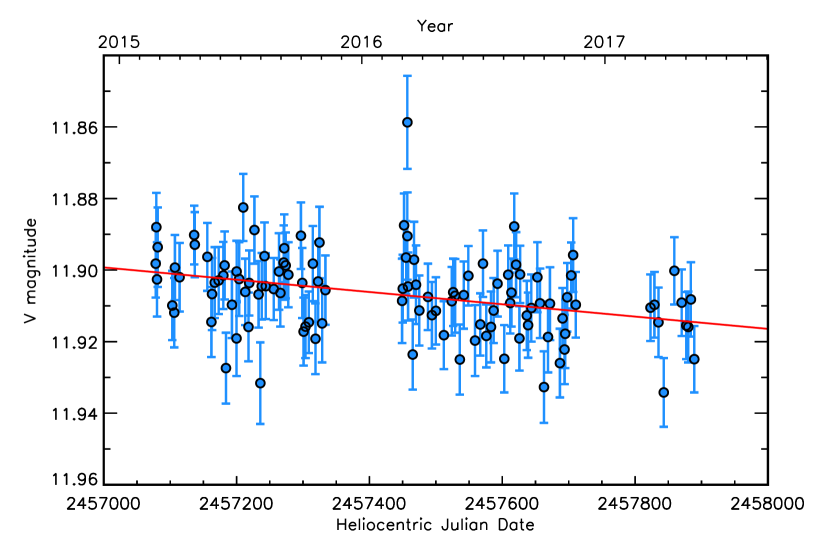
The ASAS-SN light curve of Boyajian’s Star is displayed in Figure 1, and the data are listed in Table 1. The measurements reveal a small but clear decline in brightness from in early 2015 to in 2017 May. While ASAS-SN observations of the star will continue with a few-day cadence until it goes into conjunction with the Sun in 2017 November, we exclude measurements after 2017 May 16 to ensure that our results are not affected by the “Elsie” dip beginning on that date (Boyajian et al., 2017). We also remove images that were acquired in adverse conditions such as bright sky, low transparency, or poor seeing by rejecting measurements when the photometric uncertainty was mag, the transparency was more than 0.5 mag worse than the median value, the image FWHM was more than above the median value, or the magnitude was mag away from the median magnitude. We perform an ordinary least squares (OLS) fit to the data assuming that the magnitude of the star varies linearly with time and find a best-fit slope of mmag yr-1. The change in brightness is detected at . The scatter of the data points around the fit is 0.011 mag and the per degree of freedom is 1.08. If we measure the flux of Boyajian’s Star in apertures with radii of 2, 4, or 5 ASAS-SN pixels, we find that the best-fit slope changes by less than its uncertainty, and the significance varies from at pixels to at pixels.
| HJD | FWHM | Zero pointaaThe ASAS-SN zero point (ZP) of each image is defined such that a source with a flux of one count has a magnitude of . | ||
|---|---|---|---|---|
| [mag] | [mag] | [pix] | [mag] | |
| 2457078.15792 | 11.898 | 0.009 | 1.56 | -2.26 |
| 2457079.15672 | 11.888 | 0.010 | 1.65 | -2.27 |
| 2457080.15999 | 11.903 | 0.010 | 1.50 | -2.24 |
| 2457081.16257 | 11.894 | 0.011 | 1.69 | -2.25 |
| 2457083.16491 | 11.882 | 0.012 | 1.73 | -2.25 |
| 2457084.16041 | 11.924 | 0.011 | 2.12 | -2.26 |
| 2457103.14733 | 11.910 | 0.010 | 1.51 | -2.20 |
| 2457106.11872 | 11.912 | 0.010 | 1.54 | -2.22 |
| 2457107.13016 | 11.899 | 0.009 | 1.47 | -2.26 |
| 2457114.09387 | 11.902 | 0.010 | 1.66 | -2.26 |
Note. — This table is available in its entirety in the electronic edition of the journal. A portion is reproduced here to provide guidance on form and content.
While the assumptions of the OLS method are violated by many astronomical data sets (e.g., Akritas & Bershady, 1996; Kelly, 2007; Hogg et al., 2010), this particular case is relatively well-suited for OLS: the times at which the magnitudes were measured are known essentially perfectly and the uncertainties on the magnitudes are small (and only mildly heteroscedastic). We do not know a priori whether a linear model is a good fit to the brightness of Boyajian’s Star over this time interval, but it is apparent from Fig. 1 that the model is able to describe the data and more complicated functional forms are not justified. That the per degree of freedom is somewhat larger than unity suggests that the photometric errors are slightly underestimated or that there is intrinsic scatter in the data. To explore this point, we fit the data with the linmix_err code from Kelly (2007). We find an intrinsic scatter of 0.0035 mag, which is significantly smaller than the measurement uncertainties. The resulting slope of mmag yr-1 is consistent with the OLS fit but has slightly larger uncertainties such that the trend of magnitude with time is non-zero at the level.
Over the four-year Kepler main mission Montet & Simon (2016) detected a decrease in the brightness of Boyajian’s Star of 8.4 mmag yr-1, in agreement with the rate of fading measured here given the uncertainties. In the Kepler data, though, the decline was not consistently linear with time; Montet & Simon observed fading of mmag yr-1 for the first 2.7 yr, followed by a rapid drop of nearly 2.5% over the next months. With the shorter time span of the ASAS-SN data a purely linear decrease is plausible, and modest departures from linearity would likely not be detectable given the photometric uncertainties. We also note that the Kepler bandpass (Koch et al., 2010) is broader and redder than the ASAS-SN filter. How this difference affects the relative decline rates depends on whether the fading of Boyajian’s Star is chromatic or achromatic.
3.2. Comparison Samples
Although the change in brightness of Boyajian’s Star in the ASAS-SN data is statistically significant given the assumed errors and the observed scatter, ASAS-SN has not previously been used to study very low amplitude variability over timescales of years. We therefore must consider the possibility of systematic uncertainties that could affect our results. We investigate the accuracy of the ASAS-SN photometry and derived brightness trends with various comparison samples.
3.2.1 Stars in the Same Field as Boyajian’s Star
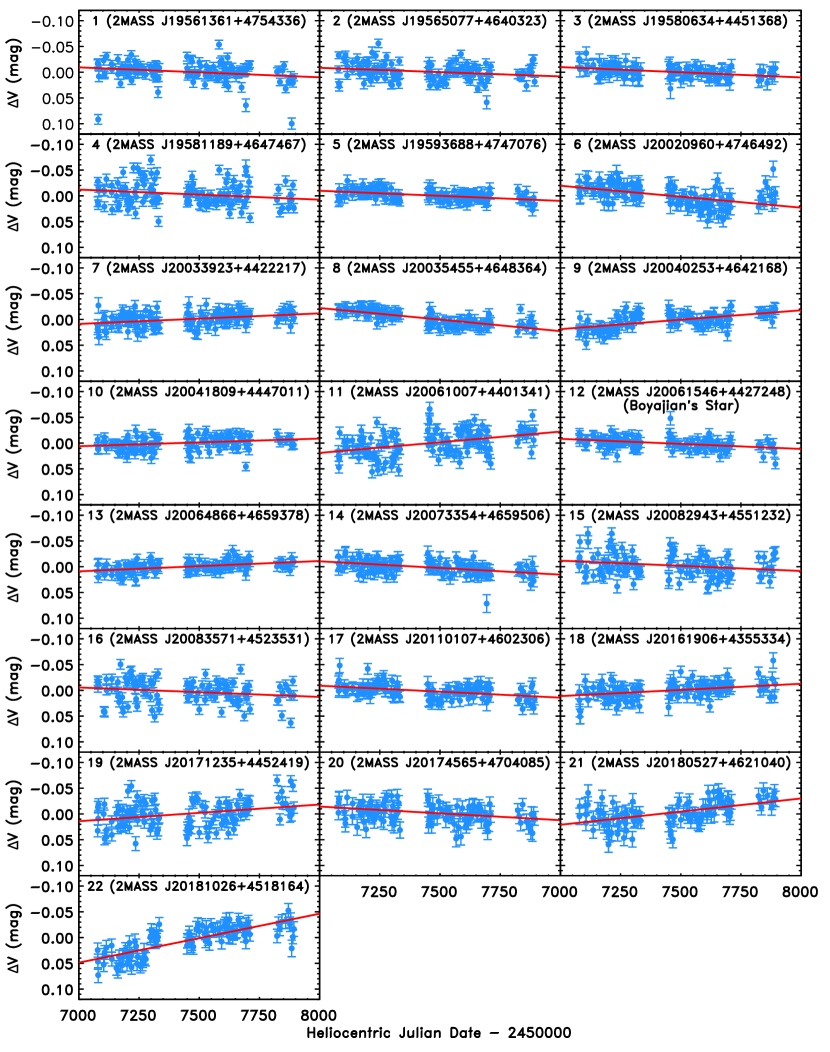
Our first comparison sample consists of 1124 stars in the SIMBAD database (Wenger et al., 2000) within mag of Boyajian’s Star () that fall in the same ASAS-SN field and camera as Boyajian’s Star. There are at least 30 ASAS-SN measurements passing our quality cuts (see §3.1) for 1078 of these stars. We carry out the same OLS fit described in §3.1 for these stars, finding a total of 21 (in addition to Boyajian’s Star) that have best-fit linear trends detected at greater than significance and a scatter around the trend of less than 0.03 mag. The latter cut removes stars with large amplitude variability, of which there are 45 examples identified by visual examination of the ASAS-SN light curves and Lomb-Scargle periodograms of the brightness measurements. These 21 stars (and Boyajian’s Star) are listed in Table 2 and their light curves are displayed in Figure 2. Unlike for Boyajian’s Star, a linear trend is clearly not a sufficient description for the behavior of several of these stars (e.g., stars 6, 9, and 22 in Table 2), but a simple linear fit to the available ASAS-SN photometry should still provide a reasonable criterion for selecting variable stars. Finding 21 stars with trends significantly exceeds the number expected from random errors if the ASAS-SN photometric noise is Gaussian. These stars could either be previously unknown variables or be pointing to low-level systematic uncertainties in the data. Only one of the stars (star 1, which is an Algol-type eclipsing binary; Devor et al. 2008) is listed as a known variable in the AAVSO (Watson et al., 2006) or SIMBAD (Wenger et al., 2000) databases. However, the lack of existing variable identifications should not be taken as evidence against variability; many public wide-field surveys either avoid regions of the sky so close to the Galactic plane (e.g., SDSS; York et al. 2000, Catalina Real-Time Transient Search; Drake et al. 2009) or are saturated for such bright stars (e.g., Pan-STARRS; Magnier et al. 2013).
| Star | ID | Brightness Change | Scatter | ||||
|---|---|---|---|---|---|---|---|
| mag | mag | mmag yr-1 | mag | ||||
| 1 | 2MASS J19561361+4754336 | 11.24 | 0.32 | 0.41 | 0.020 | 4.63 | |
| 2 | 2MASS J19565077+4640323 | 11.89 | 1.28 | 2.97 | 0.017 | 4.17 | |
| 3 | 2MASS J19580634+4451368 | 11.91 | 0.79 | 1.68 | 0.010 | 0.58 | |
| 4 | 2MASS J19581189+4647467 | 12.26 | 0.42 | 1.61 | 0.023 | 5.71 | |
| 5 | 2MASS J19593688+4747076 | 11.55 | 1.72 | 3.82 | 0.009 | 0.65 | |
| 6 | 2MASS J20020960+4746492 | 12.19 | 0.83 | 1.72 | 0.017 | 1.69 | |
| 7 | 2MASS J20033923+4422217 | 12.15 | 0.55 | 1.39 | 0.013 | 1.18 | |
| 8 | 2MASS J20035455+4648364 | 11.75 | 0.84 | 1.97 | 0.009 | 0.93 | |
| 9 | 2MASS J20040253+4642168 | 11.93 | 0.75 | 1.74 | 0.013 | 1.46 | |
| 10 | 2MASS J20041809+4447011 | 11.42 | 0.63 | 1.59 | 0.013 | 2.02 | |
| 11 | 2MASS J20061007+4401341 | 11.77 | 0.98 | 2.16 | 0.022 | 4.08 | |
| 12 | 2MASS J20061546+4427248 | 11.85 | 0.51 | 1.35 | 0.011 | 1.08 | |
| 13 | 2MASS J20064866+4659378 | 11.82 | 0.63 | 1.54 | 0.009 | 0.91 | |
| 14 | 2MASS J20073354+4659506 | 12.28 | 0.75 | 1.79 | 0.011 | 0.95 | |
| 15 | 2MASS J20082943+4551232 | 12.47 | 0.61 | 1.32 | 0.021 | 3.31 | |
| 16 | 2MASS J20083571+4523531 | 12.15 | 0.54 | 1.05 | 0.022 | 5.61 | |
| 17 | 2MASS J20110107+4602306 | 12.25 | 0.80 | 1.71 | 0.013 | 1.25 | |
| 18 | 2MASS J20161906+4355334 | 12.27 | 1.35 | 3.29 | 0.015 | 1.54 | |
| 19 | 2MASS J20171235+4452419 | 12.12 | 0.68 | 1.86 | 0.024 | 4.54 | |
| 20 | 2MASS J20174565+4704085 | 11.83 | 0.69 | 1.94 | 0.017 | 1.44 | |
| 21 | 2MASS J20180527+4621040 | 12.00 | 0.48 | 1.53 | 0.020 | 1.74 | |
| 22 | 2MASS J20181026+4518164 | 12.20 | 0.62 | 1.57 | 0.018 | 1.60 |
Note. — and magnitudes are taken from APASS (Henden & Munari, 2014), with the exception of star 4, which is not included in the APASS DR9 catalog (presumably because of a nearby brighter star). For that star we list Tycho-2 magnitudes (Høg et al., 2000). magnitudes are taken from the 2MASS point source catalog (Cutri et al., 2003).
Unfortunately, because Boyajian’s Star is located in the corner of the Kepler field of view there is very limited overlap between the ASAS-SN field containing the star and the Kepler field. Just five of the 21 candidate low-amplitude variables from ASAS-SN (stars 2, 3, 4, 7, and 10) have Kepler long cadence light curves, and only star 7 shows significant short-term variability. We use the methodology described by Montet et al. (2017) to search for longer-period variability of these stars in the Kepler full frame images (FFIs). All five stars display clear long-term trends (of smaller amplitude than seen in the ASAS-SN data), which we regard as possible stellar activity signals.
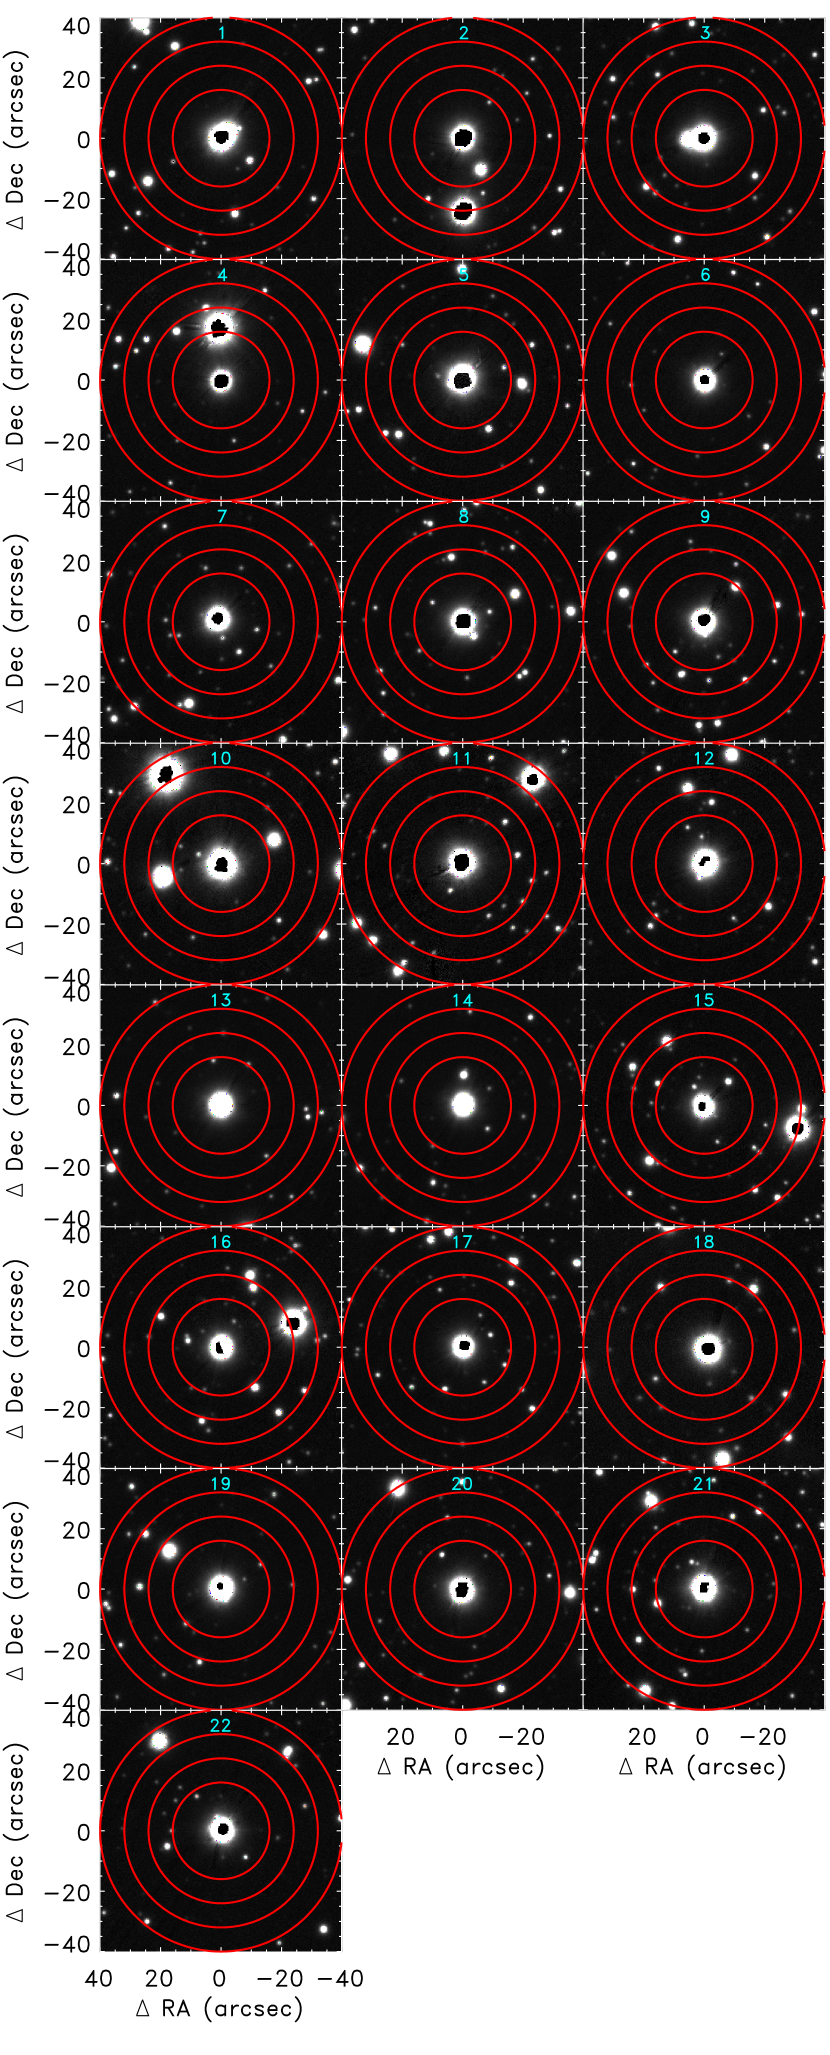
We also evaluate the variability of this sample of candidate variables by considering their behavior as a function of the aperture radius used for ASAS-SN photometry. We compare the results for our standard 3-pixel radius aperture with apertures of 2, 4, and 5 pixels (see Figure 3). For seven of the stars the ASAS-SN trend is only statistically significant for one or two choices of aperture. We conclude that blending with other stars located near the boundary of the photometric aperture is likely responsible for the apparent variability of these stars.111For stars 2, 4, 10, 15, and 16 the nearby bright stars causing variable blending in the different apertures are obvious in Fig. 3. For stars 1 and 18 the origin of the differing behavior as a function of aperture size is less evident, although star 1 has a close () blended companion visible to the northwest. Star 11 also has a similarly bright neighbor that affects the outermost aperture, but its variability is quite clear in the smaller apertures. We remove them from further consideration, leaving 14 possible variables. Five of the remaining stars show substantially decreasing significance as the aperture radius increases, which again indicates blending is occurring but is still consistent with the star at the center of the aperture being variable.
A powerful new resource for detecting photometric variability across the entire sky is Gaia (e.g., Eyer et al., 2017; Belokurov et al., 2017; Deason et al., 2017). While variability information is not included in the first Gaia data release (Gaia Collaboration et al., 2016a), Belokurov et al. (2017) showed that it is possible to identify variable stars by comparing the reported flux uncertainties in the Gaia DR1 catalog to the expected photon noise. We calculate the Amplitude metric defined by Belokurov et al. (2017) for the fourteen candidate variables in the same ASAS-SN field as Boyajian’s Star and find that eleven easily satisfy the conservative variability threshold of set by Belokurov et al. This result suggests that at least % of the stars with trends in ASAS-SN are actually variable. Two additional stars in this sample have photometric amplitudes above but very close to the threshold. Interestingly, Boyajian’s Star itself is not clearly variable in the Gaia data, with an amplitude slightly below the Belokurov et al. (2017) threshold. Gaia DR1 includes observations from 2014 July to 2015 September (Gaia Collaboration et al., 2016a), and it is possible that the star was relatively quiescent over this period.
3.2.2 Stars in the Kepler Field
In order to provide a larger sample of stars observed by both ASAS-SN and Kepler we use the bd camera data for a neighboring ASAS-SN field that falls entirely within the boundary of the Kepler field. There are 1166 SIMBAD stars in this field in the same magnitude range used above. Repeating the light curve fitting exercise for these stars yields 26 with brightness trends out of 944 with at least 30 good ASAS-SN measurements. Although the ASAS-SN observations of this field cover days instead of the days for the field containing Boyajian’s Star, we limit the light curve fits to the same time span for consistency. Thirteen of the stars with ASAS-SN trends have Kepler data (the others fall in gaps between Kepler CCDs). We detect variability in the Kepler FFI data for 8 of the 13 remaining stars. In combination with the five stars with FFI measurements in the Boyajian’s Star field (§3.2.1), Kepler observations indicate that at least % of stars with ASAS-SN trends are astrophysically variable. Many of the stars are strongly spotted, showing variability from spot modulation, and a number exhibit long-term trends that may be due to magnetic cycles. The character of the variability does not necessarily match between the two data sets, at least in part because of the limited temporal overlap. Nevertheless, we consider this result to be confirmation that most stars with brightness trends in the ASAS-SN photometry are genuinely variable, regardless of the nature of that variability.
3.3. Significance of ASAS-SN Variability
If we were to assume that all of the ASAS-SN trend stars except for Boyajian’s Star are false positives — i.e., that none of them are actually variable — then the false positive rate would be 1.9% in the Boyajian’s Star field and the detection of long-term variability in Boyajian’s Star would have a confidence level of 98.1%. Given the results above from comparisons with Gaia and Kepler (§§3.2.1 and 3.2.2) we conclude that the actual false positive rate is . We therefore estimate a confidence level for the ASAS-SN detection of variability in Boyajian’s Star of . This confidence level corresponds to significance, lower than determined using the statistical uncertainties in the data alone, but still providing strong support for continued long-term brightness changes of the star.
4. ANALYSIS OF ASAS DATA
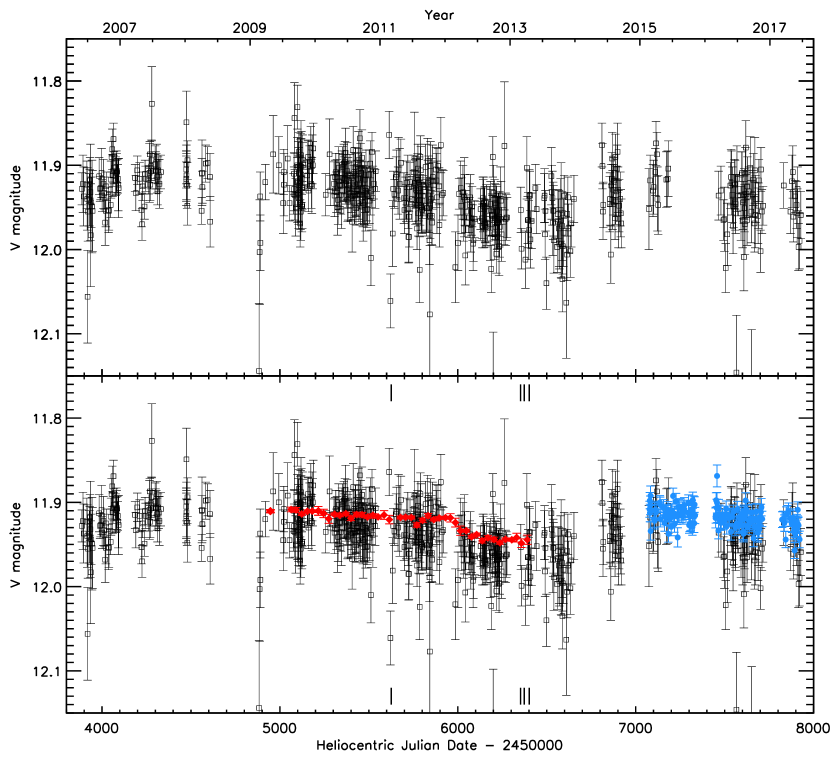
The ASAS -band light curve of Boyajian’s Star is displayed in Figure 4, and the measurements are listed in Table 3. The appearance of the light curve is dominated by a dimming of mag from to . We show in the bottom panel of Fig. 4 that this decrease in brightness aligns perfectly with the fading detected in the Kepler FFIs by Montet & Simon (2016). Strikingly, though, the star does not continue fading from there, but rather returns to its previous brightness level by . Unfortunately, there are few ASAS measurements available in the intervening 1.5 yr to reveal exactly when and how this brightening took place, but its duration is constrained to be d. From (early 2015) to the present we measure a dimming rate of mmag yr-1, consistent with the dimming seen in the ASAS-SN observations at the level. The significance of the ASAS fading over this time interval is lower than in ASAS-SN because of the larger photometric uncertainties and the slower observational cadence.
| HJD | ||
|---|---|---|
| [mag] | [mag] | |
| 2453887.00345 | 11.928 | 0.019 |
| 2453892.97057 | 11.922 | 0.034 |
| 2453897.03348 | 11.937 | 0.035 |
| 2453915.01509 | 11.923 | 0.028 |
| 2453916.95754 | 11.940 | 0.037 |
| 2453920.95091 | 11.955 | 0.035 |
| 2453928.97449 | 11.941 | 0.031 |
| 2453930.97710 | 11.922 | 0.017 |
| 2453932.97819 | 11.918 | 0.027 |
| 2453934.97840 | 11.932 | 0.057 |
Note. — This table is available in its entirety in the electronic edition of the journal. A portion is reproduced here to provide guidance on form and content.
At the beginning of the ASAS time series there is some evidence of another brightening event, with the star’s magnitude changing from at to by . In this case the brightening appears to extend over d. Thus, rather than monotonically fading as has been inferred from the photometry of Schaefer (2016) and Montet & Simon (2016), the star has likely both brightened and dimmed measurably over the last decade. This result does not necessarily contradict the century-long dimming seen by Schaefer (2016), which would only amount to 0.018 mag over the ASAS baseline. Variability at the level of a few percent on timescales of a few years such as we measure in ASAS-SN and ASAS would not be detectable in the DASCH photometry (Grindlay et al., 2009; Laycock et al., 2010) used by Schaefer (2016) given the much larger uncertainties in the photographic data.
If we fit the entire ASAS light curve with a simple linear model as in §3.1, we derive an overall dimming rate of mmag yr-1. This fading rate is nearly identical to that measured by Montet & Simon (2016) over the first d of the Kepler mission. As discussed above, it is apparent from Fig. 4 that a simple linear model is not a good description of the data for this longer time span. However, the fact that the slope of the fit is significantly different from zero provides further evidence for the long-term photometric variability of Boyajian’s Star.
The long-term dimming rate in ASAS over the duration of the Kepler observations is mmag yr-1, almost a factor of two larger than in the Montet & Simon (2016) Kepler measurements. Because the Kepler bandpass extends to significantly longer wavelengths than a standard filter, this difference could be a sign that the dimming is weaker in the red (also see the Appendix). Either dust or a change in stellar temperature could cause the star to get redder as it dims.
We also analyzed the same sample of 1124 stars of similar brightness described in §3.2.1 using ASAS data. Of these stars, 1117 have at least 30 good ASAS measurements, and we find 85 stars with best-fit linear trends detected at greater than significance with a scatter around the trend of less than 0.05 mag (to allow for the larger ASAS uncertainties for each measurement). Boyajian’s Star has the tenth most significant trend and the eleventh largest slope among this sample. Stars 2, 3, 5, 6, 7, 19, 21, and 22 from Table 2 also exhibit trends in both the ASAS-SN and ASAS data sets, supporting the identification of these stars as variable.
Given that the ASAS data set covers the full time span of the Kepler light curve of Boyajian’s Star, it is possible that there could be ground-based detections of some of the dips discovered by Boyajian et al. (2016). Figure 4 shows that there are more ASAS outliers to fainter magnitudes than brighter ones, consistent with the possibility of dipping activity. However, none of those data points match the times of the dips seen with Kepler. There is a near coincidence between the deep (16%) D800 dip and an ASAS measurement at that is more than below the mean magnitude, but the two are separated by more than 4 days and the Kepler dip was very short, so this ASAS measurement must not be accurate. Nevertheless, there may be genuine dips in the ASAS data at other times; most notably at (immediately before Kepler observations began) and in mid-2016 ().
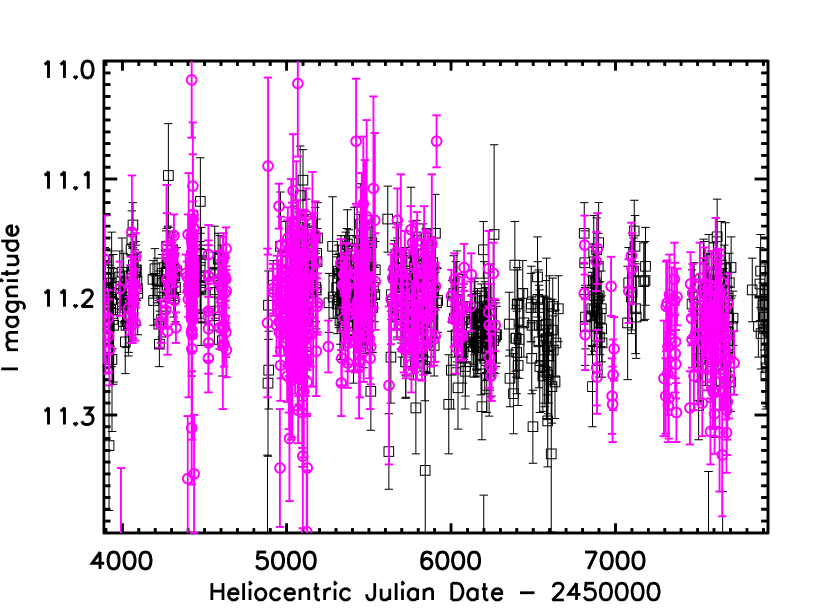
Boyajian’s Star is detected as variable in the ASAS -band photometry as well, with a dimming rate of mmag yr-1 from 2006 June to 2016 November. The sequential brightening and fading that is evident in the -band light curve is not obvious in ; in particular, there is no sign of the brightening between the Kepler observations and the ASAS-SN measurements that is seen in (see Figure 5).
5. DISCUSSION
The results of Schaefer (2016) and Montet & Simon (2016) have generally been assumed to indicate that the brightness of Boyajian’s Star is monotonically decreasing with time. While the ASAS-SN measurements are consistent with that picture, the longer time baseline afforded by the ASAS data demonstrates that in fact the star’s variability may be more complicated, with multiple slow dimming and brightening episodes over the past decade. This finding may have significant implications for models to explain the behavior of the star.
Published ideas to account for the unusual changes in the brightness of Boyajian’s Star generally suffer from one of two flaws: they are either statistically unlikely (e.g., Metzger et al., 2017) or they explain only one aspect of the observed flux variations (e.g., Bodman & Quillen, 2016; Makarov & Goldin, 2016; Sheikh et al., 2016; Neslušan & Budaj, 2017; Ballesteros et al., 2017; Katz, 2017). The hypotheses that can potentially account for both the brief dips and the long-term variability include the consumption of a planet (Metzger et al., 2017), an internal obstruction of heat flux in the star (Foukal, 2017), or an intervening disk-bearing object (Wright & Sigurðsson, 2016). In the first two cases, the proposed explanation relies on the star’s luminosity monotonically decreasing. If Boyajian’s Star also brightens at times then these models as presented may not be viable. For the planetary merger hypothesis, minor brightening events interrupting the long-term dimming could be the result of the star ingesting additional bodies. The collision of a moon-sized object with the star would cause brightening of approximately the correct magnitude (K. Shen & B. Metzger 2017, personal communication). However, the Metzger et al. (2017) models indicate that the brightening from such an event should occur very quickly, which appears to be in conflict with the observed duration of the brightening (§ 4).
The most obvious culprit for long-term dimming and brightening of Boyajian’s Star is a magnetic activity cycle. The two brightening episodes seen in the ASAS photometry occur around and , suggesting an yr cycle length. If this brightening is cyclical (whether from stellar activity or otherwise) then the star should brighten again near (2022 January), with an uncertainty of a few months.
The interpretation of the photometric variability as a stellar cycle must confront the question of whether the amplitude, time scale, and even presence of magnetic activity in such a star has any precedent. In the compilation of stars tracked in Ca H&K activity indicators, Egeland (2017) lists 28 stars with colors ; of these, only 9 show cycles, ranging from “good” to “poor” quality. The mean (median) cycle period in this hot-star sample is (10.0) years. Of the 19 stars without cycles, only 5 of them are “flat”, the rest showing variability or long-term trends. Mathur et al. (2014) noted a possible magnetic cycle with days and the signature of differentially rotating spots in the seismically well-studied KIC 3733735, which is also a hot ( K) rapidly rotating ( days) early F-type star. Boyajian’s Star shows similar photometric evolution over the course of the Kepler mission (see, e.g., Fig. 3 of Boyajian et al. 2016). Moreover, the increase in short-term photometric variability occurs simultaneously with the observed decrease in the star’s brightness, similar to the correlation observed in Kepler observations of rapidly rotating sun-like stars (Montet et al., 2017).222This simultaneity presumes that the 0.88 d rotation signature is from KIC 8462852, which the astrometric shifts detected by Makarov & Goldin (2016) suggest is not the case. Although Boyajian’s Star is close to the boundary where we expect deep surface convection zones (and thus magnetic activity) to disappear, stellar models for stars of K at solar metallicity still have convection zones of order a few to 10% of their radii (van Saders & Pinsonneault, 2013) and Rossby numbers (as calculated in van Saders et al., 2016) generally less than 2.0 assuming a 0.88 d rotation period. It is unknown exactly when dynamo action in such convection zones would cease (but see Metcalfe & van Saders, 2017).
Although the presence of magnetic activity and observed cycle lengths do have some precedent, the photometric amplitude of the cycle is more puzzling. The luminosity variations are much larger than seen for other similar stars (e.g., Montet & Simon, 2016). In the Lockwood et al. (2007) compilation of stars with both Ca H&K and photometric monitoring, stars with have long-term variability that is typically less than mag in the Strömgren b and y filters. Moreover, magnetic activity offers no explanation for the brief dips Boyajian’s Star undergoes.
Another plausible, although perhaps less natural, explanation for the ASAS variability is changing line-of-sight absorption by the interstellar medium (Wright & Sigurðsson, 2016). The overall reddening inferred for the star is mag (Boyajian et al., 2016), so variations in the V-band extinction of mag are not impossible. However, while measurable changes in the ISM absorbing column on timescales of years are known (e.g., Hobbs et al., 1982; Price et al., 2000; Welty & Fitzpatrick, 2001; Smith et al., 2013; Galazutdinov et al., 2013), detectable flux decrements from varying ISM absorption are not, and lines of sight with the necessary small-scale structure to cause such changes are rare. This idea certainly cannot be ruled out at present, but the more complicated the photometric behavior of Boyajian’s Star becomes, the more contrived the ISM structure must be in order to explain it. Requiring large ISM density contrasts on spatial scales sufficiently small to account for the dips may run afoul of the argument by Lacki (2016) that the cause of the photometric anomalies must be surprisingly common in order for Kepler to have been likely to detect such a star. High-resolution monitoring of the Na D and K I absorption lines in the spectrum of Boyajian’s Star over several years can provide a strong test of this hypothesis.
6. SUMMARY AND CONCLUSIONS
We have used long-term survey observations of the Kepler field by ASAS-SN and ASAS to investigate the brightness of Boyajian’s Star from 2006 to 2017. Over the past two years, we detect dimming in both surveys. With the higher-precision ASAS-SN photometry we measure a decline rate of mmag yr-1. Fading nearly identical to what we measure has been detected independently using observations from the Hereford Arizona Observatory (B. Gary 2017, personal communication), and similar results have also just been reported by Meng et al. (2017). Prior to the beginning of ASAS-SN coverage of this location, ASAS shows that the star brightened in 2014, faded as previously seen with Kepler from 2009-2013, and may have brightened in 2006. We therefore conclude that the variability of Boyajian’s Star is likely not monotonic as has been assumed until now.
The existence of periods in which Boyajian’s Star brightens noticeably and the possibility of cyclic variability significantly change the long-term photometric signature that models of the star’s behavior have sought to explain. Most published models aim to account for the brief dips discovered by Boyajian et al. (2016) without addressing the long-term dimming measured by Schaefer (2016) and Montet & Simon (2016). The Metzger et al. (2017) hypothesis that the star has recently consumed a planet predicts a strictly declining luminosity after yr past the merger, which does not appear to be consistent with the ASAS photometry, although more complicated versions of this idea may not be ruled out. We examine whether the detected brightness variations could be the result of stellar activity, but find that explanation to be unsatisfying because of the unusually large amplitude of the variability and the difficulty of accounting for the brief dips with the same mechanism. Interstellar absorption could conceivably be responsible for both the dips and long-term flux variations, but only with unprecedented levels of small-scale ISM structure.
Until the recent study by Meng et al. (2017), all detections of both the long-term dimming of Boyajian’s Star and the brief dips in brightness have relied on photometry in a single band (Schaefer, 2016; Montet & Simon, 2016). Although we find that the ASAS -band observations indicate fading as well, the larger uncertainties of those measurements prevent us from confidently detecting any color changes in the star over the past decade. The key question of how all of the brightness changes observed in Boyajian’s Star vary with wavelength therefore remains unanswered. We strongly encourage high-precision multi-year monitoring efforts in multiple photometric bands that will be sensitive enough to detect changes in the star’s brightness of %. Multi-color imaging obtained over the time interval when Boyajian’s Star will be observed by the TESS mission (Ricker et al., 2014) would be particularly valuable. The Zwicky Transient Facility (Bellm & Kulkarni, 2017) and the Gaia satellite (Gaia Collaboration et al., 2016b) offer two possible avenues for pursuing a long-term, well-calibrated monitoring program covering a range of wavelengths, but the results presented here demonstrate that smaller-scale surveys are capable of achieving the required accuracy as well.
Appendix A EXISTING MULTICOLOR PHOTOMETRY OF BOYAJIAN’S STAR
The color dependence of the variability of Boyajian’s Star would provide a critical clue to the origin of the dimming on both short and long timescales. If light from the star is being obscured by dust, it would get redder as it dims, while if the light is being blocked by macroscopic objects such as rocky collisional debris (e.g., Boyajian et al., 2016) or artificial structures (Wright et al., 2016) then the dimming would be independent of wavelength. In order to explore whether any changes in the color of the star can be detected in existing data, we collect all available optical photometry from the literature and public catalogs in Table 4. Unfortunately, there are significant disagreements between different references, especially in and , where the total range of the reported magnitudes is more than 0.25 mag. The colors, though, are generally consistent. The largest outliers in these bands are the Kepler INT Survey (Greiss et al., 2012a, b) and Boyajian et al. (2016). Since the magnitude discrepancies are much larger than the amplitude of the -band variability presented in §§ 3 and 4, we suspect that they result from inconsistent calibrations or magnitude systems rather than astrophysical changes.
| Source | Observation | |||||||
|---|---|---|---|---|---|---|---|---|
| Date | ||||||||
| Tycho-2aaHøg et al. (2000). | … | bbConverted from BT and VT magnitudes using the transformation equations given at https://heasarc.nasa.gov/W3Browse/all/tycho2.html. | bbConverted from BT and VT magnitudes using the transformation equations given at https://heasarc.nasa.gov/W3Browse/all/tycho2.html. | … | … | … | … | 1989-1993 |
| APASSccHenden & Munari (2014). | … | \phantom{0}\phantom{0}footnotemark: | \phantom{0}\phantom{0}footnotemark: | … | \phantom{0}\phantom{0}footnotemark: | \phantom{0}\phantom{0}footnotemark: | \phantom{0}\phantom{0}footnotemark: | 2010-2012 |
| Kepler UBV SurveyddEverett et al. (2012). | \phantom{0}\phantom{0}footnotemark: | \phantom{0}\phantom{0}footnotemark: | \phantom{0}\phantom{0}footnotemark: | … | … | … | … | 2011 |
| Kepler INT Survey | eeConverted from the SDSS magnitudes in this row using the equations derived by Jordi et al. (2006). For and Jordi et al. provide two equations, and we take the average result of the two. | eeConverted from the SDSS magnitudes in this row using the equations derived by Jordi et al. (2006). For and Jordi et al. provide two equations, and we take the average result of the two. | eeConverted from the SDSS magnitudes in this row using the equations derived by Jordi et al. (2006). For and Jordi et al. provide two equations, and we take the average result of the two. | eeConverted from the SDSS magnitudes in this row using the equations derived by Jordi et al. (2006). For and Jordi et al. provide two equations, and we take the average result of the two. | ffConverted from the INT/WFC Vega magnitudes reported by Greiss et al. (2012a, b) to SDSS AB magnitudes by inverting the transformation equations given by González-Solares et al. (2011). The uncertainties reported by Greiss et al. (2012b) appear to be unrealistically small (0.001 mag), so we adopt the rms of each magnitude as its uncertainty. | ffConverted from the INT/WFC Vega magnitudes reported by Greiss et al. (2012a, b) to SDSS AB magnitudes by inverting the transformation equations given by González-Solares et al. (2011). The uncertainties reported by Greiss et al. (2012b) appear to be unrealistically small (0.001 mag), so we adopt the rms of each magnitude as its uncertainty. | ffConverted from the INT/WFC Vega magnitudes reported by Greiss et al. (2012a, b) to SDSS AB magnitudes by inverting the transformation equations given by González-Solares et al. (2011). The uncertainties reported by Greiss et al. (2012b) appear to be unrealistically small (0.001 mag), so we adopt the rms of each magnitude as its uncertainty. | 2012 |
| WTFggBoyajian et al. (2016). | … | \phantom{0}\phantom{0}footnotemark: | \phantom{0}\phantom{0}footnotemark: | \phantom{0}\phantom{0}footnotemark: | … | … | … | 2014 |
| ASAS-SN | … | … | \phantom{0}\phantom{0}footnotemark: | … | … | … | … | 2015-2017 |
| ASAS | … | … | \phantom{0}\phantom{0}footnotemark: | \phantom{0}\phantom{0}footnotemark: | … | … | … | 2006-2017 |
Of the first five data sets listed in Table 4, only APASS offers any time resolution, with four measurements in each band during 2010 June and a single observation in 2012 October, spanning the rapid decrease in the brightness of Boyajian’s Star detected by Montet & Simon (2016). Averaging the 2010 measurements together, we find dimming of 0.35 mag in , 0.11 mag in , 0.13 mag in , 0.06 mag in , and 0.16 mag in from 2010 to 2012. Based on the overall uncertainties for each band listed in Table 4, we assume that each APASS magnitude has an uncertainty of mag, so the uncertainties on the magnitude differences should be mag. This and dimming is larger than what we measure with ASAS by . Although the decrease in brightness in seems anomalously large relative to the other filters for dust, the APASS data provide some evidence that Boyajian’s Star reddened during the course of the rapid dimming event in early 2012.
References
- Akritas & Bershady (1996) Akritas, M. G., & Bershady, M. A. 1996, ApJ, 470, 706
- Alencar et al. (2010) Alencar, S. H. P., Teixeira, P. S., Guimarães, M. M., et al. 2010, A&A, 519, A88
- Ballesteros et al. (2017) Ballesteros, F. J., Arnalte-Mur, P., Fernandez-Soto, A., & Martinez, V. J. 2017, MNRAS, in press, arXiv:1705.08427
- Bellm & Kulkarni (2017) Bellm, E., & Kulkarni, S. 2017, Nature Astronomy, 1, 0071
- Belokurov et al. (2017) Belokurov, V., Erkal, D., Deason, A. J., et al. 2017, MNRAS, 466, 4711
- Bodman & Quillen (2016) Bodman, E. H. L., & Quillen, A. 2016, ApJ, 819, L34
- Boyajian et al. (2017) Boyajian, T., Croft, S., Wright, J., et al. 2017, The Astronomer’s Telegram, No. 10405, 405
- Boyajian et al. (2016) Boyajian, T. S., LaCourse, D. M., Rappaport, S. A., et al. 2016, MNRAS, 457, 3988
- Chambers et al. (2016) Chambers, K. C., Magnier, E. A., Metcalfe, N., et al. 2016, ArXiv e-prints, arXiv:1612.05560
- Cody et al. (2014) Cody, A. M., Stauffer, J., Baglin, A., et al. 2014, AJ, 147, 82
- Cutri et al. (2003) Cutri, R. M., Skrutskie, M. F., van Dyk, S., et al. 2003, 2MASS All Sky Catalog of point sources.
- Deason et al. (2017) Deason, A. J., Belokurov, V., Erkal, D., Koposov, S. E., & Mackey, D. 2017, MNRAS, 467, 2636
- Devor et al. (2008) Devor, J., Charbonneau, D., O’Donovan, F. T., Mandushev, G., & Torres, G. 2008, AJ, 135, 850
- Drake et al. (2009) Drake, A. J., Djorgovski, S. G., Mahabal, A., et al. 2009, ApJ, 696, 870
- Egeland (2017) Egeland, R. 2017, PhD thesis, Montana State University, Bozeman, Montana, USA
- Everett et al. (2012) Everett, M. E., Howell, S. B., & Kinemuchi, K. 2012, PASP, 124, 316
- Eyer et al. (2017) Eyer, L., Mowlavi, N., Evans, D. W., et al. 2017, submitted to A&A, arXiv:1702.03295
- Foukal (2017) Foukal, P. 2017, ApJ, 842, L3
- Gaia Collaboration et al. (2016a) Gaia Collaboration, Brown, A. G. A., Vallenari, A., et al. 2016a, A&A, 595, A2
- Gaia Collaboration et al. (2016b) Gaia Collaboration, Prusti, T., de Bruijne, J. H. J., et al. 2016b, A&A, 595, A1
- Galazutdinov et al. (2013) Galazutdinov, G., Krełowski, J., Beletsky, Y., & Valyavin, G. 2013, PASP, 125, 1329
- González-Solares et al. (2011) González-Solares, E. A., Irwin, M., McMahon, R. G., et al. 2011, MNRAS, 416, 927
- Greiss et al. (2012a) Greiss, S., Steeghs, D., Gänsicke, B. T., et al. 2012a, AJ, 144, 24
- Greiss et al. (2012b) Greiss, S., Steeghs, D. T. H., Gänsicke, B. T., et al. 2012b, ArXiv e-prints, arXiv:1212.3613
- Grindlay et al. (2009) Grindlay, J., Tang, S., Simcoe, R., et al. 2009, in Astronomical Society of the Pacific Conference Series, Vol. 410, Preserving Astronomy’s Photographic Legacy: Current State and the Future of North American Astronomical Plates, ed. W. Osborn & L. Robbins, 101
- Henden & Munari (2014) Henden, A., & Munari, U. 2014, Contributions of the Astronomical Observatory Skalnate Pleso, 43, 518
- Henden et al. (2012) Henden, A. A., Levine, S. E., Terrell, D., Smith, T. C., & Welch, D. 2012, Journal of the American Association of Variable Star Observers (JAAVSO), 40, 430
- Hippke et al. (2016) Hippke, M., Angerhausen, D., Lund, M. B., Pepper, J., & Stassun, K. G. 2016, ApJ, 825, 73
- Hippke et al. (2017) Hippke, M., Kroll, P., Matthai, F., et al. 2017, ApJ, 837, 85
- Hobbs et al. (1982) Hobbs, L. M., Wallerstein, G., & Hu, E. M. 1982, ApJ, 252, L17
- Høg et al. (2000) Høg, E., Fabricius, C., Makarov, V. V., et al. 2000, A&A, 355, L27
- Hogg et al. (2010) Hogg, D. W., Bovy, J., & Lang, D. 2010, ArXiv e-prints, arXiv:1008.4686
- Jordi et al. (2006) Jordi, K., Grebel, E. K., & Ammon, K. 2006, A&A, 460, 339
- Katz (2017) Katz, J. I. 2017, ArXiv e-prints, arXiv:1705.08377
- Kelly (2007) Kelly, B. C. 2007, ApJ, 665, 1489
- Koch et al. (2010) Koch, D. G., Borucki, W. J., Basri, G., et al. 2010, ApJ, 713, L79
- Kochanek et al. (2017) Kochanek, C. S., Shappee, B. J., Stanek, K. Z., et al. 2017, submitted to PASP, arXiv:1706.07060
- Lacki (2016) Lacki, B. C. 2016, ArXiv e-prints, arXiv:1610.03219
- Lang et al. (2010) Lang, D., Hogg, D. W., Mierle, K., Blanton, M., & Roweis, S. 2010, AJ, 139, 1782
- Laycock et al. (2010) Laycock, S., Tang, S., Grindlay, J., et al. 2010, AJ, 140, 1062
- Lisse et al. (2015) Lisse, C. M., Sitko, M. L., & Marengo, M. 2015, ApJ, 815, L27
- Lockwood et al. (2007) Lockwood, G. W., Skiff, B. A., Henry, G. W., et al. 2007, ApJS, 171, 260
- Magnier et al. (2013) Magnier, E. A., Schlafly, E., Finkbeiner, D., et al. 2013, ApJS, 205, 20
- Makarov & Goldin (2016) Makarov, V. V., & Goldin, A. 2016, ApJ, 833, 78
- Marengo et al. (2015) Marengo, M., Hulsebus, A., & Willis, S. 2015, ApJ, 814, L15
- Mathur et al. (2014) Mathur, S., García, R. A., Ballot, J., et al. 2014, A&A, 562, A124
- Meng et al. (2017) Meng, H. Y. A., Rieke, G., Dubois, F., et al. 2017, ApJ, in press
- Metcalfe & van Saders (2017) Metcalfe, T. S., & van Saders, J. 2017, Sol. Phys., in press, arXiv:1705.09668
- Metzger et al. (2017) Metzger, B. D., Shen, K. J., & Stone, N. 2017, MNRAS, 468, 4399
- Montet & Simon (2016) Montet, B. T., & Simon, J. D. 2016, ApJ, 830, L39
- Montet et al. (2017) Montet, B. T., Tovar, G., & Foreman-Mackey, D. 2017, submitted to AAS Journals, arXiv:1705.07928
- Morales-Calderón et al. (2011) Morales-Calderón, M., Stauffer, J. R., Hillenbrand, L. A., et al. 2011, ApJ, 733, 50
- Neslušan & Budaj (2017) Neslušan, L., & Budaj, J. 2017, A&A, 600, A86
- Pojmański (2002) Pojmański, G. 2002, Acta Astronomica, 52, 397
- Price et al. (2000) Price, R. J., Crawford, I. A., & Barlow, M. J. 2000, MNRAS, 312, L43
- Ricker et al. (2014) Ricker, G. R., Winn, J. N., Vanderspek, R., et al. 2014, in Proc. SPIE, Vol. 9143, Space Telescopes and Instrumentation 2014: Optical, Infrared, and Millimeter Wave, 914320
- Schaefer (2016) Schaefer, B. E. 2016, ApJ, 822, L34
- Shappee et al. (2014) Shappee, B. J., Prieto, J. L., Grupe, D., et al. 2014, ApJ, 788, 48
- Sheikh et al. (2016) Sheikh, M. A., Weaver, R. L., & Dahmen, K. A. 2016, Physical Review Letters, 117, 261101
- Smith et al. (2013) Smith, K. T., Fossey, S. J., Cordiner, M. A., et al. 2013, MNRAS, 429, 939
- Thompson et al. (2016) Thompson, M. A., Scicluna, P., Kemper, F., et al. 2016, MNRAS, 458, L39
- van Saders et al. (2016) van Saders, J. L., Ceillier, T., Metcalfe, T. S., et al. 2016, Nature, 529, 181
- van Saders & Pinsonneault (2013) van Saders, J. L., & Pinsonneault, M. H. 2013, ApJ, 776, 67
- Waters et al. (2016) Waters, C. Z., Magnier, E. A., Price, P. A., et al. 2016, ArXiv e-prints, arXiv:1612.05245
- Watson et al. (2006) Watson, C. L., Henden, A. A., & Price, A. 2006, Society for Astronomical Sciences Annual Symposium, 25, 47
- Welty & Fitzpatrick (2001) Welty, D. E., & Fitzpatrick, E. L. 2001, ApJ, 551, L175
- Wenger et al. (2000) Wenger, M., Ochsenbein, F., Egret, D., et al. 2000, A&AS, 143, 9
- Wright et al. (2016) Wright, J. T., Cartier, K. M. S., Zhao, M., Jontof-Hutter, D., & Ford, E. B. 2016, ApJ, 816, 17
- Wright & Sigurðsson (2016) Wright, J. T., & Sigurðsson, S. 2016, ApJ, 829, L3
- York et al. (2000) York, D. G., Adelman, J., Anderson, Jr., J. E., et al. 2000, AJ, 120, 1579