11email: nielbock@hda-hd.de
The Intertropical Convergence Zone
This activity has been developed as a resource for the “EU Space Awareness” educational programme. As part of the suite “Our Fragile Planet” together with the “Climate Box” it addresses aspects of weather phenomena, the Earth’s climate and climate change as well as Earth observation efforts like in the European “Copernicus” programme. This resource consists of three parts that illustrate the power of the Sun driving a global air circulation system that is also responsible for tropical and subtropical climate zones. Through experiments, students learn how heated air rises above cool air and how a continuous heat source produces air convection streams that can even drive a propeller. Students then apply what they have learnt to complete a worksheet that presents the big picture of the global air circulation system of the equator region by transferring the knowledge from the previous activities in to a larger scale.
Key Words.:
equator, atmosphere, updraft, winds, convection1 Background information
1.1 Temperature, density and buoyancy
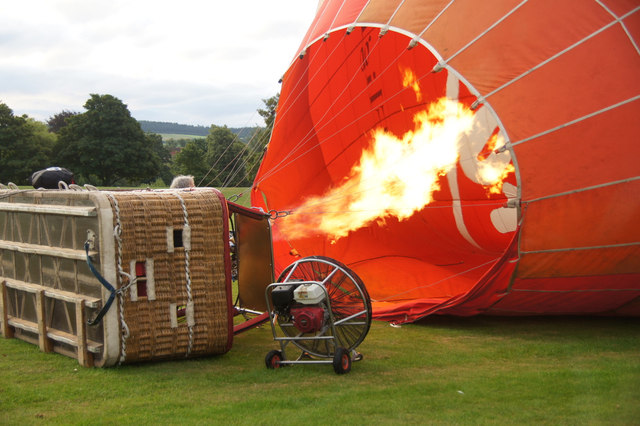
We all know from experience that the density of gases depends on their temperature. Cold air is denser than warm air. This is the reason why hot air balloons can fly and even lift up cargo.
Scientifically, this phenomenon is described by the Ideal Gas Law and the buoyant force according the Archimedes’ principle. Hence, the buoyant force is equivalent to the gravitational force that is exerted on the displaced air while the balloon inflates.
| (1) |
Here is the mass of the displaced air. In case of hot air balloons with the volume and the density of the air outside the balloon that was displaced :
| (2) |
Buoyancy is reached, when the buoyant force is equivalent to the gravitational force (only the air is considered):
| (3) |
Hence:
| (4) | |||||
| (5) | |||||
| (6) |
So, the resulting force is governed by the difference between the densities of the air inside and outside the balloon. For a hot air balloon, this density inside is changed by heating the air. This is where the Ideal Gas Law steps in. One way of writing it is:
| (7) |
is the total gas mass and is a constant. Therefore:
| (8) |
Since a hot air balloon is open, the pressure inside and outside the balloon remains the same during the heating process. It is a constant as well. Therefore:
| (9) |
When beginning heating the air inside the balloon, both the density and the temperature inside and outside are the same. Afterwards both quantities differ. Therefore, we can write:
| (10) |
Let us now get back to the resulting force of uplift:
| (11) |
The two densities are now connected to the temperature change. Therefore:
| (12) | |||||
| (13) |
Which leads to final expression for the resulting force of uplift:
| (14) |
In order for to be positive, we need:
| (15) |
So, the hot air balloon (in fact only the air inside it) rises, if the air temperature inside the balloon is higher than outside. In reality, the balloon lifts up, if the resulting force also compensates the gravitational force i.e. the weight of the balloon itself. As a result, a balloon of 18 m in diameter produces an uplift equivalent to a metric ton, if the air inside is heated from C to C, the maximum allowed for nylon fabric.
1.2 The Sun and the global wind system
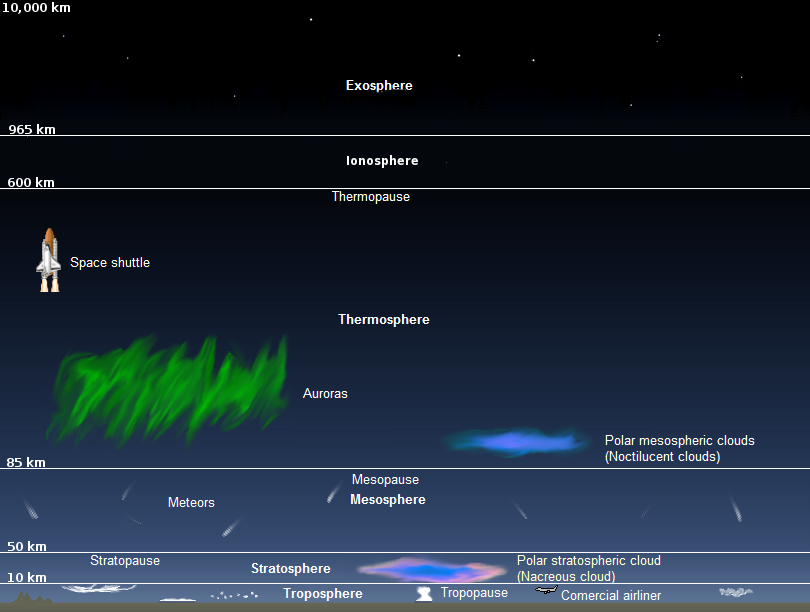
The atmosphere of the Earth consists of air. We know that whenever it is heated, it rises up (see above). Heating of the atmosphere is done by the Sun, mainly indirectly via heating the surface first which by producing infrared radiation in turn heats the air close to the ground. Since warm air has a lower density than cool air, it produces an updraft which by convection drags the air up into the highest layers of the troposphere about 10 – 15 km above ground (Fig. 2). While the air rises, it constantly cools down which reduces the buoyant force. At some point, the uplift stops, and the air is diverted horizontally north and south.
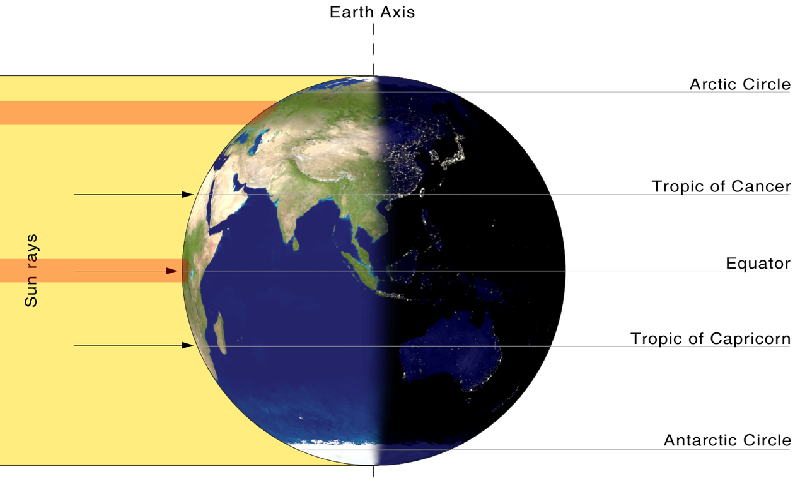
This process is most effective at latitudes where the Sun is at zenith, i.e. in a belt around the equator. This area is called the Intertropical Convergence Zone (ITCZ). It follows the apparent annual path of the Sun northward and southward during the seasons.
Cool air can store less water than warm air. Therefore, the rather humid air that rises in the ITCZ continuously loses its ability to store the water. As a result, clouds form from which eventually water is released as rain. In extreme cases, the convection can lead to severe weather phenomena like thunderstorms or even cyclones and hurricanes. This is the reason, why the low latitudes around the equator are strongly affected by a humid, tropical climate with low pressure areas and lots of rain. On satellite images, the ITCZ is very prominent due to a global cloud belt along the equator (see Figure 1). This demonstrates that satellite imagery can be an important tool to monitor the climate of the Earth.

The air has now become dry. While it is pushed north and south to latitudes around north and south, the already dried air drops, heats up, and is dried even more. This gives rise to the arid, subtropical climate we find there.
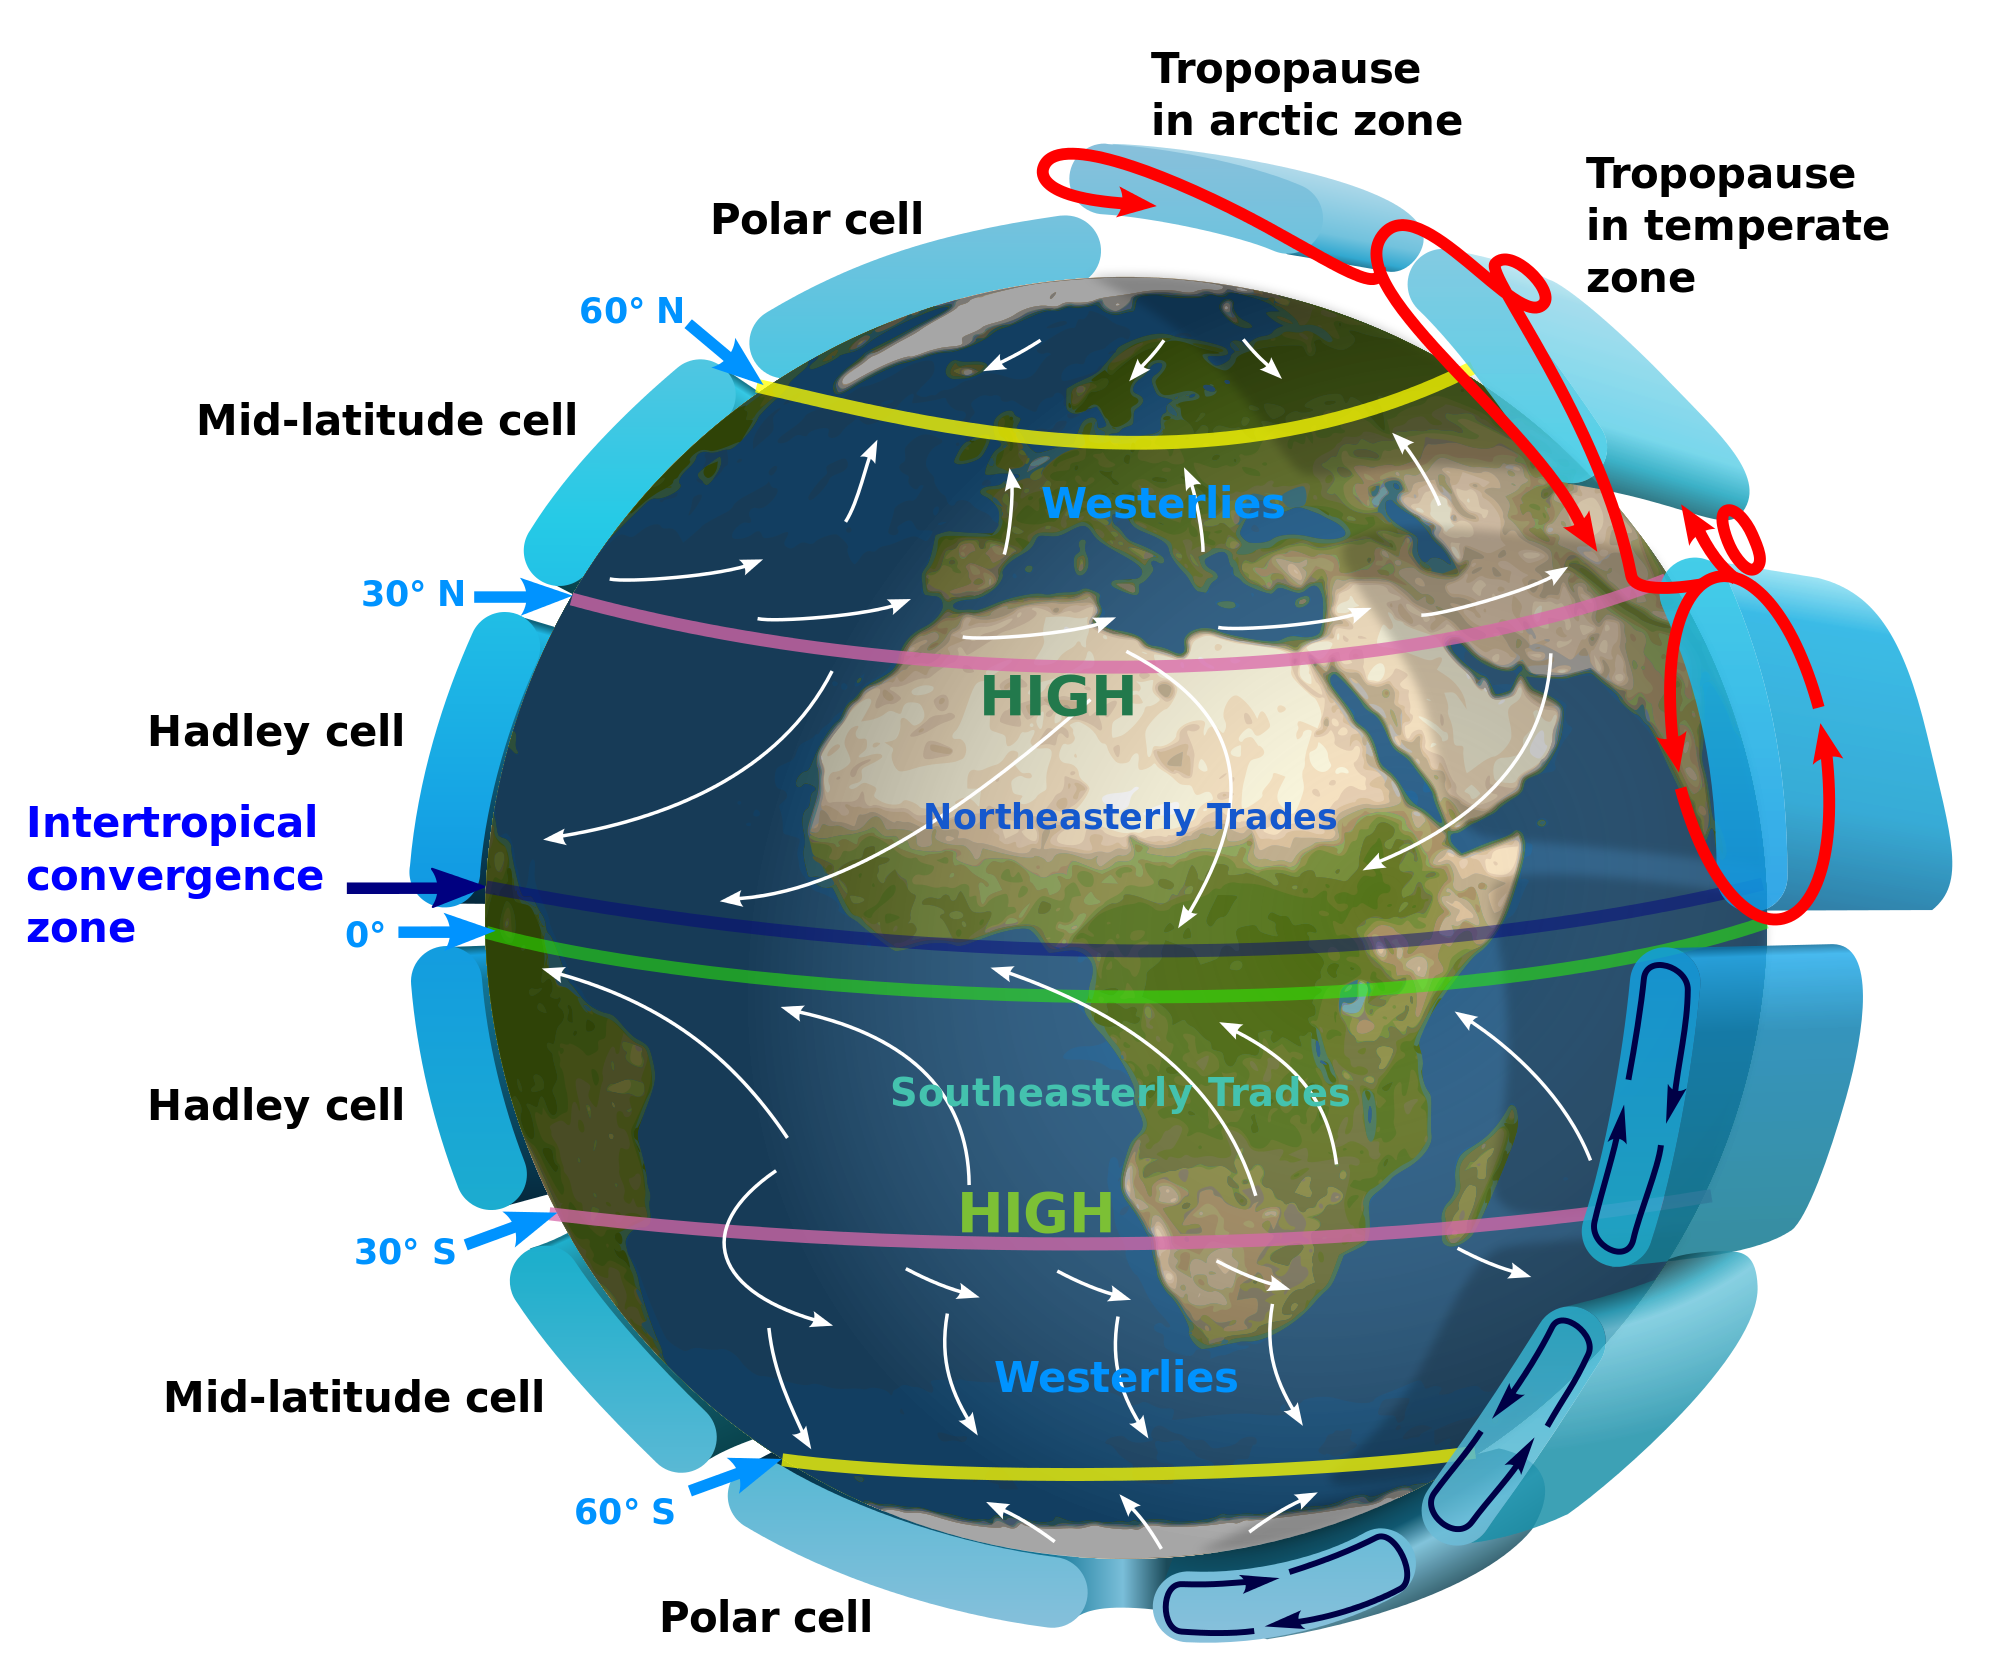
The cycle of the circulation closes with the air currents flowing back to the equatorial region and the ITCZ where they feed the convection again. Altogether, we have seen that the ITCZ with the rising air causes a global belt of air circulating roughly between the tropics around the equator and the dry deserts at approximately north and south. This belt is called the “Hadley cell” (see Fig. 4).

The convection zone at the ITCZ and the connected Hadley zone is only a part of a much larger and global air circulation system (see Fig. 5).
1.3 Possible influence of climate change
We have seen that thermal energy is the driver of wind, rain and temperature, i.e. the weather. Therefore, it seems plausible that the more heat is stored inside the atmosphere, the more energy is sitting there to influence the weather. Since the resulting buoyant force depends on temperature differences, especially between the Earth’s surface and high altitudes, we should expect that processes as those that we see inside the ITCZ are amplified.
In fact, there are already indications that along with the phenomenon of a gradual increase of global mean air temperatures throughout the recent decades (global warming), extreme weather situations have increased in number and severity (http://www.ucsusa.org/global_warming/science_and_impacts/impacts/global-warming-rain-snow-tornadoes.html). This is supported by recent results in climate results (https://www.sciencedaily.com/releases/2017/03/170307100337.htm).
2 List of material
The activities are carried out best in groups of two. The items listed below are indicated per group.
Common items:
-
•
paper handkerchief, napkin or dual chamber tea bag
-
•
matches or lighter
-
•
china plate or tinfoil (or any other non-flammable flat surface)
-
•
strong lamp (common bulb or tungsten halogen bulb, min. 100 W)
-
•
scissors
-
•
flat nose pliers, if available
-
•
glue (for cardboard)
-
•
pencil or similar pointed object
-
•
aluminium wrap of a tea light
-
•
drawing pin
For either of the following alternatives:
Alternative 1
-
•
cardboard tube (inner part of a kitchen roll)
-
•
black paint and brush or black coloured paper
-
•
one piece of cardboard (approx. 1 cm wide, 8 cm long)
Alternative 2
-
•
construction template provided with this sheet
-
•
black cardboard (22 cm x 20 cm)
-
•
one piece of card board (approx. 1cm wide, 12 cm long, see template)
3 Goals
Students will learn how the Sun drives the main engine of atmospheric circulation. They will experience hands-on, how irradiation and heat can drive convection. Students learn that warm air rises over cold air. They will understand that this basic phenomenon is the cause for the large scale air circulation systems on Earth and the warm and humid climate near the equator.
4 Learning objectives
Desired Student Outcomes for Activity 1: After this activity, the students will be able to explain that warm air rises above the surrounding cooler air and that the uplift can be strong enough to launch objects up into the air.
Desired Student Outcomes for Activity 2: After this activity, the students will be able to explain that a continuous convection stream can be produced, provided the energy source injects heat constantly. They will also understand that a supply of fresh air is needed to keep the engine going.
Desired Student Outcomes for Activity 3: This worksheet helps students to transfer the knowledge learnt in the first two activities to the situation on Earth, where the Sun is the main heat source. Students answer questions on how the air on Earth is heated and the effects of this. They will understand that the Intertropical Convergence Zone is only a part of a larger air circulation system that is the cause for the climate zones between the Tropics and the Subtropics.
5 Target group details
Suggested age range: 12 – 16 years
Suggested school level: Middle School, Secondary School
Duration: 1 hour
6 Evaluation
The answers given by the students to the questions as listed in the activity – partially stimulated by discussion – are the gauge by which the teacher can evaluate the learning outcome.
The teacher could ask students to draw a labelled diagram for the first two activities to show what they saw and write a couple of sentences about what happened and why.
The final activity, a worksheet, summarises what has been illustrated and discussed in the first two parts and puts it in the perspective of a global system on Earth. From this, it should be straightforward to judge to what degree the individual elements have been understood.
For a solution for the drawing, see Fig. 4 in the Background information.
7 Full description of the activity
7.1 Introduction: Questions and Answers
Show the students an Earth globe or a global map and ask them if they can identify the equator.
Q: Where are the poles? Where does the equator lie relative to the poles?
A: The equator is the line or circumference on the globe half way between the poles.

If possible, let the students use an on-line map tool to investigate the geography and satellite images of the equator region. The map tool may also be projected by one computer only. Possible map services with satellite imagery:
Q: Can you name countries that touch the equator? Do you know any cities close to it?
A: e.g. Ecuador (Quito, Galapagos), Brazil, Gabon (Libreville), Congo, Uganda (Kampala), Kenya, Malaysia, Indonesia.
Q: What is the typical vegetation there? A closer look at the satellite images helps to answer the question.
A: Rainforest.
Q: What is the typical weather there (humid or dry, cold or warm)?
A: Humid and warm, lots of rain.
Q: Can you think of a reason, why it is so warm there all year? Show them a model of the Sun-Earth-System (Fig. 7).
A: The Sun is the main heating source. Near the equator, it is always almost directly above.
Q: The air is heated up by the hot surface of the Earth. What happens with hot air? Imagine a hot-air balloon.
A: Warm/hot air rises above cold air.
Q: How would you be able to recognise that the air rises?
A: Wind
7.2 Activity 1: Flying flames
WARNING! This activity is only suitable for students that are responsible enough to handle a flame. Be sure to provide an inflammable environment and to supervise the students during the experiment. It is suggested to distribute lighters or matches only to small groups of students at a time. If in doubt, the experiment should be demonstrated by the teacher.
Smoke detectors may have to disabled for this.
Use a fireproof surface. A china plate or a piece of tinfoil may be used to protect the surface of normal desks or tables.
In this activity, the students will experience, how warm air rises above cooler air. The hot air produced by a burning piece of very light paper produces its own uplift and rises up in the air. This experiment should give rather a qualitative result meaning that the exact uplift force is not so important.
Gather the following items, one set per group (or one for the teacher only, if carried out as a demonstration):
-
•
paper handkerchief, napkin or dual chamber tea bag
-
•
matches or lighter
-
•
plate or/and tinfoil
-
•
scissors
Distribute the students in groups of two (suggested).
-
1.
Prepare the wick:
-
(a)
Paper handkerchiefs and napkins consist of several layers. Take only one and cut off one quarter.
-
(b)
If a tea bag is used, cut off the top and empty the bag. Unfold it.
-
(a)
-
2.
Form a tube (napkin, handkerchief, tea bag) of a few centimetres and put it on the plate, standing upright. It should stand stably. Avoid abrupt and fast movements to prevent moving air from blowing the wick away.
-
3.
Light it.
Discuss with the students what happened. Let the students describe in detail what they saw. While the wick burns down, it lifts off at some point.
Q: What happened to the air around the burning paper?
A: It was heated.
Q: What happens with heated air?
A: It rises.
Q: Can you explain why in the end the burning paper lifted off?
A: It was dragged along with the rising air.
7.3 Activity 2: Updraft tower
This activity demonstrates how heated air rises. As long as the heating source is present, a continuous updraft of the heated air is generated. The students will experience this phenomenon by building a model of an updraft tower. Afterwards, the concept of air circulation can be used to explain the process of terrestrial atmospheric circulation systems and the Intertropical Convergence Zone.
Tell the students that they will now build a model of such a tower. Tell them that it is a nice example of demonstrating vertical wind on a small scale. Gather the following items, one set per group.
-
•
scissors
-
•
flat nose pliers, if available
-
•
glue (for cardboard)
-
•
pencil or similar pointed object
-
•
aluminium wrap of a tea light
-
•
drawing pin
For either of the following alternatives:
Alternative 1
-
•
cardboard tube (inner part of a kitchen roll)
-
•
black paint and brush or black coloured paper
-
•
one piece of cardboard (approx. 1 cm wide, 8 cm long)
Alternative 2
-
•
construction template provided with this sheet
-
•
black cardboard (22 cm x 20 cm)
-
•
one piece of card board (approx. 1cm wide, 12 cm long, see template)
7.3.1 Building instructions

Alternative 1:
The first version may be somewhat simpler to produce, but might not be that effective, because the cardboard tube used in this example may a bit too narrow.
-
1.
Paint the outside of the cardboard tube black or glue it with black paper.
Alternative 2:
The second version is especially designed to match the diameters of the tower and the fan.
-
1.
Prepare the black cardboard according to the construction template provided.
-
2.
Roll the cardboard perpendicularly to the hashed area.
-
3.
Glue the tube at the hashed area.
-
4.
Cut out the grey areas or cut them from bottom to top and fold them up to form flaps (Fig. 11, left).
Common steps:
-
5.
Now we produce the fan using the tea light wrap. This part is quite delicate and has to be done very carefully.
-
6.
Cut 16 equal sections into the walls of the tea light wrap.
-
7.
Flatten the sections outside to the bottom of the wrap.
-
8.
Extend the cuts to the inner circle of the bottom of the wrap.
-
9.
Press the pencil exactly at the centre of the fan to form a small dent. Be careful not to punch a hole.
-
10.
Bend all 16 wings of the fan around an axis from the centre to the edge. Use the pliers if available.
-
11.
Punch the drawing pin through the centre and from the back of the small piece of cardboard.
-
12.
Glue the small piece of cardboard to the inside at the top of the tube. It should form an arc (Fig. 11, middle).
-
13.
Put the fan on top of the drawing pin.
-
14.
Balance the fan by bending the wings up and down.
-
15.
Illuminate the side of the tower with a strong lamp.
-
16.
Watch the fan rotate (Fig. 11, right).
Discuss the results with the students.
Q: Why does the fan rotate?
A: The air inside the tower is heated up and streams upward.
Q: How is the air heated? Remember that the lamp does not shine inside the tower.
A: The lamp heats the black tower, which in turn heats the air inside.
Q: What are holes at the bottom for?
A: They permit replenishing the tower with fresh air.
Q: If you compare this with the situation on Earth, what does the Sun do in the belt around the equator? What happens with the surface and the air above?
A: The Sun heats the ground which, in turn, heats the air. Just like the model of the updraft tower, the heated air rises and produces a continuous up-current of air.
Q: Can you imagine what happens with the air, when it climbs to high altitudes?
A: The air cools down and moisture condenses to rain.
Q: Coming back to the updraft tower: it had flaps at the bottom to allow replenishing the air. The same happens on Earth. What do we call horizontal air flows?
A: wind
7.4 Activity 3: Worksheet – The Wind Engine of the Earth
We have seen in the experiments that a heat source can heat up the air and cause an upward flow. The very same process happens on Earth.
Q: Look at Fig. 7. Where on Earth does the Sun heat most efficiently?
A: around the equator
Q: Heating the air directly is quite inefficient. When you think about the updraft tower experiment, the lamp did not heat the air. Describe the process, how eventually the solar energy heats the air.
A: The irradiation from the Sun heats the ground, which in turn heats the air. This is more efficient next to the surface as compared to higher altitudes.
Q: Which part of the atmospheric layers is heated strongest?
A: The one next to the surface.
Indicate the correct attributions:
The air close to the surface of the Earth is warm/cold.
The air at high altitudes above ground is warm/cold.
Q: What happens with the air close to the surface? Consider the temperature differences between low and high altitudes.
A: It rises above the cooler air.
Q: Warm air can store more water than cold air. What happens, when the air rises into higher layers of the atmosphere? Think of boiling water at home, when the hot air meets the cold air or cold surfaces.
A: The water vapour condenses. First to clouds, eventually to larger drops and rain.
Q: Can you explain why the equator regions of the Earth experience so much rain during the year?
A: Warm humid air is driven up to cooler atmospheric layers, where the water condenses to rain. This is a process that works almost all year.
Q: This region around the equator is also called the Intertropical Convergence Zone, abbreviated ITCZ. At some point, the air cannot rise any higher. It is diverted north and south. At those high altitudes, the air constantly cools down. What happens with cold air?
A: Cold air drops closer to the ground.
Q: We just mentioned that cold air can store less water than warm air. Can you explain why the desert areas north and south of the equator are so dry? What happens with the air, when it drops back to the surface?
A: When the warm air rises up to cooler layers, it cannot store water as efficiently and rain falls down. The air is dried by that process. When this air drops, it is heated up and potentially can store more water. Without replenishment with humid air, the air dries even more.
Q: Back at the surface, the air streams towards the equator region, where they converge (ITCZ). Those are winds we call the Trade Winds. Can you imagine why they are called this?
A: The Trade Winds are a fairly constant phenomenon that helped cargo ships to sail long distances. Its direction is fairly stable as well, so ships didn’t get lost so often.
Q: Try to make a prediction of what would happen with the winds and the weather in general, if the temperature continues to rise.
A: Temperature is the main engine of the updraft. Higher temperatures also lead to more water to be evaporated and enrich the air. As a result, one should expect more extreme phenomena related to the ITCZ.
Q: This is actually happening right now. It is called “Global Warming”. Explain what would happen, if we do not stop this process.
A: This aspect of the climate change will lead to more severe weather, especially near the tropics.
We have constructed an entire circulation system that begins and ends at the equator region. This system is called the Hadley cell. Can you draw a schematic with the most relevant elements and processes? Use the prepared sketch below as a starting point.
8 Connection to school curriculum
This activity is part of the Space Awareness category “Our Fragile Planet” and related to the curricula topics:
-
•
Atmosphere
-
•
Seasons
-
•
Composition and structure
-
•
Surface
8.1 Application to UK curriculum
The activity covers the following aspects of the subject of Geography in the curriculum of the United Kingdom.
| Level | Section |
|---|---|
| KS2 | Physical geography |
| describe and understand key aspects of: physical geography, including: climate zones, biomes and vegetation belts, rivers, mountains, volcanoes and earthquakes, and the water cycle | |
| KS3 | Locational knowledge |
| extend their locational knowledge and deepen their spatial awareness of the world’s countries using maps of the world to focus on Africa, Russia, Asia (including China and India), and the Middle East, focusing on their environmental regions, including polar and hot deserts, key physical and human characteristics, countries and major cities |
9 Conclusion
This activity consists of three parts that illustrate the power of the Sun driving a global air circulation system that is also responsible for tropical and subtropical climate zones. Through experiments, students learn how heated air rises above cool air and how a continuous heat source produces air convection streams that can even drive a propeller. Students then apply what they have learnt to complete a worksheet that presents the big picture of the global air circulation system of the equator region to a larger scale.
Acknowledgements.
This resource was developed in the framework of Space Awareness. Space Awareness is funded by the European Commission’s Horizon 2020 Programme under grant agreement no. 638653.Glossary
Appendix A Relation to other educational materials
This unit is part of a larger educational package called “Our Fragile Planet” that introduces several historical and modern techniques used for navigation. An overview is provided via: Our_Fragile_Planet.pdf
Appendix B Supplemental material
The supplemental material is available on-line via the Space Awareness project website at http://www.space-awareness.org. The direct download links are listed as follows:
- •
-
•
Updraft tower building template: astroedu1619-Intertropical_Convergence_Zone-ConstructionTemplate.pdf
-
•
Video of working updraft tower: https://youtu.be/rfdQnhONuFs