X-ray/gamma-ray flux correlations in the BL Lac Mrk 421 using HAWC data
Abstract:
The HAWC gamma ray observatory is located at the Sierra Negra Volcano in Puebla, Mexico, at an altitude of 4,100 meters. HAWC is a wide field of view array of 300 water Cherenkov detectors that are continuously surveying ~ 2sr of the sky, operating since March 2015. The large collected data sample allows HAWC to perform an unbiased monitoring of the BL Lac Mrk 421. This is the closest and brightest known extragalactic high-synchrotron-peaked BL Lac in the gamma-ray/X-ray bands and is extensively monitored by the Large Area Telescope (LAT) on-board the Fermi satellite, and the BAT and XRT instruments of the Swift satellite. In this work, we use 25 months of HAWC data together with Swift-XRT data to characterize potential correlations between both wavelengths. This analysis shows that HAWC and Swift-XRT data are correlated even stronger than expected for quasi-simultaneous observations.
1 Introduction
Blazars, a subclass of active galactic nuclei (AGN), are characterized by having an outflow pointing out close to the observer’s field of view. One of the closest, brightest and fastest varying blazars in the extragalactic X-ray/TeV sky is Markarian 421 (Mrk421). Mrk 421 located at 134 Mpc has been a frequent target of multiwavelength campaigns in order to study correlations in TeV -ray and X-ray bands. Observations at these energy bands have supported compelling evidence of correlated and simultaneous variability on different time scales [5, 6]. In this case, different types of correlations have been reported; lineal [7], quadratic [8] and fairly loose [9].
The broadband spectral energy distribution (SED) of Mrk 421 exhibits a double-peaked shape; the lower energy peak is located at X-rays and the second peak at hundreds of GeV. Both leptonic and hadronic models have been used to model the SED of this object [11], implying comparable jet powers.
In this paper we are presenting correlation studies of X-ray/gamma-ray bands using 25 months of data from November 26th, 2014 to December 31st, 2016. The work is organized as follows. In Section 2 we are describing the data set that is used to calculate the X-ray/gamma-ray correlation for Mrk 421. Section 3 presents the analysis and results and in Section 4 we discuss some theoretical implications.
2 Data Sets
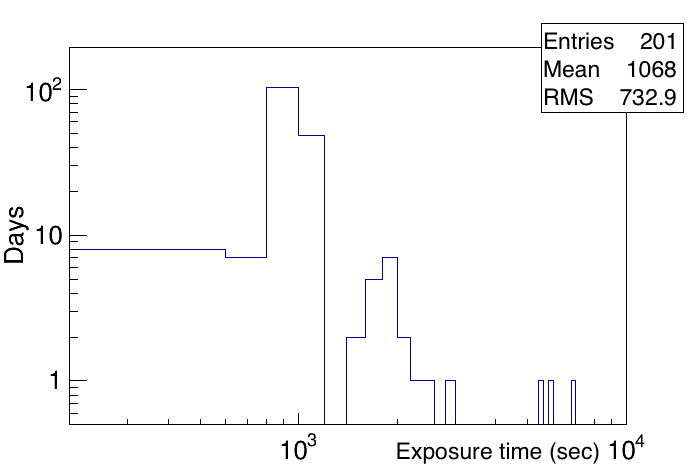
The HAWC daily light curve for Mrk 421 during the period from November 2014 to April 2016 is published in [16]. We use the same analysis to extend our data set up to December 2016. For X-ray data, we use public Swift-XRT light curves in photon counts from the web site given by [17]. The time bin size depends on the count rate. In particular during the period of HAWC observations, the Swift-XRT count rate was in general below cts/s. The minimum time bin size was such that a minimum of counts per bin were collected during a mean exposure time of s as observed in left panel of Figure 1, while the transit of Mrk 421 over HAWC last in average ~ 6 hr per day. The mean fraction of exposure times is 4.7.
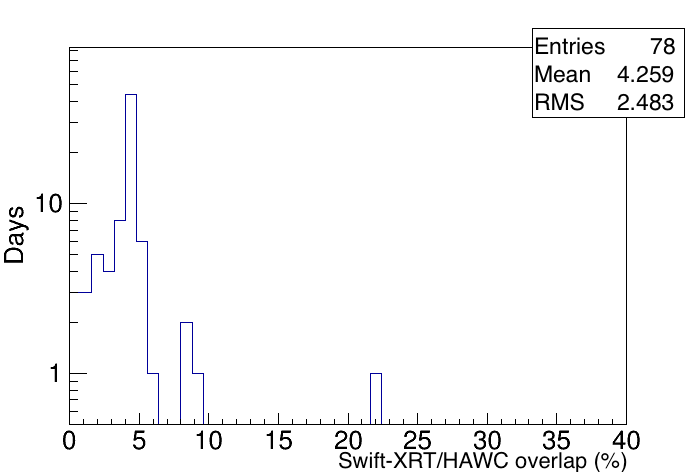
We extract the data for those 110 days when both instruments observed Mrk 421 and combine them per day and week. The mean fraction of exposure times slightly changes to 4.3 when requiring simultaneity of SWIFT/XRT observation with HAWC as shown in right panel of Figure 1. There are not simultaneous observations for 32 of the 110 (29) days included in this analysis.
3 Analysis and Results
We use the maximum likelihood approach discussed by D’Agostini [18] to determine the correlation between SWIFT-RXT and HAWC data. This approach assumes that both data sets are linearly correlated with an intrinsic scatter or,
| (1) |
where is the VHE integrated flux and is the X-ray count rate. To know more about the explicit role of the parameter please refer to [18].
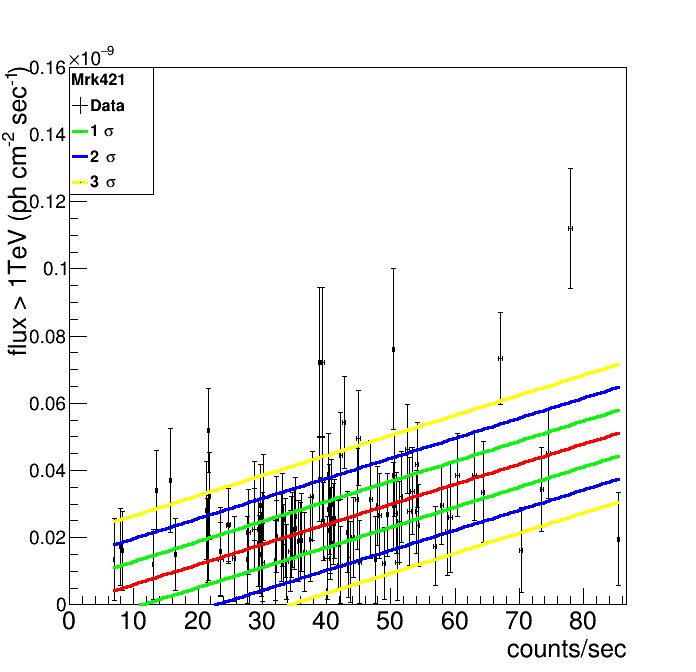
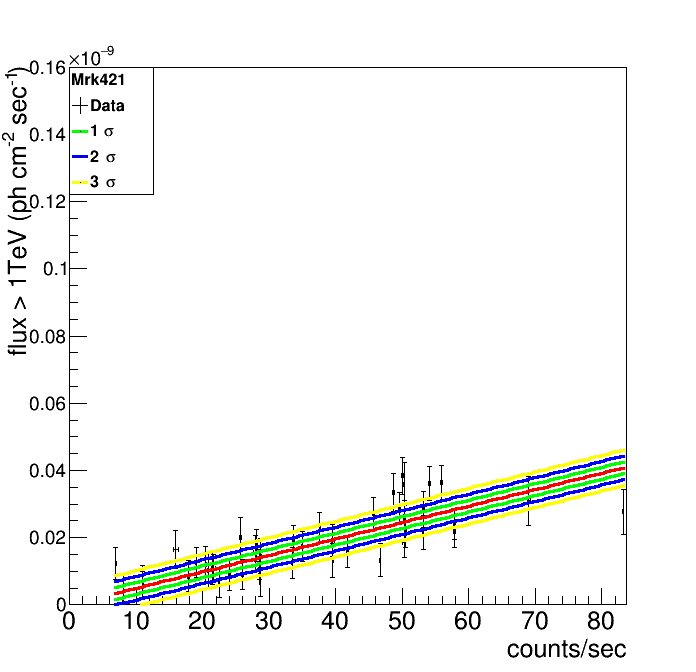
Then, the parameter values can be estimated by minimizing the minus-log-likelihood function given by D’Agostini [18]. We have obtained the values for the parameters given in Table 1. The fits are shown in Figure 2 and, green, blue and yellow lines represent 1, 2 and 3 scatter around the best fit, respectively. Although the uncertainties in the parameters are high for both cases, daily and weekly, the Pearson coefficients and the p-values indicate a strong correlation, within 3, between HAWC and SWIFT-XRT observations. The values obtained for the slope are not consistent with a flat fit, while the values for are consistent with zero. Thus, we have fixed the value of to zero in order to obtain a better estimation of the remaining parameters. The results are given in Table 1. Both fits are consistent. However, the scatter, quantified by , for the case of daily fluxes is higher than the expected by correcting the obtained for weekly fluxes. In the most optimistic case of having all the measurements per day, the correction should scale by . A possible explanation is an extra daily variability intrinsic to the source. If this is the case, it also explains the measurement of the highest flux of ph cm-2 s -1 in daily time scales inconsistent with the best fit for more than 6.
| binning | Pearson Coeff. | p-value | |||
| daily | 0.483 | ||||
| weekly | 0.788 | ||||
| daily | 0 fixed | 0.483 | |||
| weekly | 0 fixed | 0.788 |
4 Theoretical Interpretation
The broadband SED of Mkr421 is usually interpreted in the SSC and hadronic models. Electrons accelerated and confined in the emitting region by the magnetic field radiate by synchrotron emission peaking at X-rays. These synchrotron photons, in the leptonic scenario, are scattered up to higher energies only by inverse Compton and in the hadronic model serve as targets for the pion productions, producing high energy photons by decay products, cascade and synchrotron radiation among others. Therefore, an X-ray/VHE gamma-ray lineal correlation is expected only in the SSC scenario.
In this framework, the synchrotron spectrum is given by,
| (2) |
where the spectral synchrotron breaks and are given as,
| (3) | |||||
| (4) |
Here, is the bulk Lorentz factor, is the size of the emitting radio, is the magnetic density and is the density of electrons. The inverse Compton scattering of synchrotron spectrum can be written as
| (5) |
where the characteristic () and cooling () SSC energies are
| (6) | |||||
| (7) |
From eqs. (3), (2), (6) and (5), we can show that VHE -ray and X-ray fluxes are linearly correlated . Thus, it can be written as,
| (8) |
where is a function that depends on the bulk Lorentz factor, the size of the emitting radio, the strength of magnetic field and the density of electrons. From the previous quantities, we observe that the density of radiating electrons is the only quantity that varies in time, so the electrons are cooled as they continually emit synchrotron photons. Therefore, number of radiating electrons could be responsible of the small differences between daily and weekly correlations. Similarly, fluctuations of the magnetic field in small timescales could affect correlations in different timescales. However, we have not observed significant differences between daily and weekly correlations. More data will be included as HAWC keeps operations.
References
- [1] J. Buckleyb, R.A. Edelsonc, D. Hornsd, M. Jordan, Correlated X-ray and TeV variability in Markarian 421, New Astronomy Reviews 48 (5-6) 419-422
- [2] M. Blazejowski et al, A Multi-wavelength View of the TeV Blazar Markarian 421: Correlated Variability, Flaring, and Spectral Evolution, Astrophys.J.630 (130-141) 2005 [astro-ph/0505325v1].
- [3] Giacomo Bonnoli et al, MAGIC observations of Mkn 421 in 2008, and related optical/X-ray/TeV MWL study,, arXiv:0907.0831[astro-ph.HE]
- [4] The VERITAS Collaboration, I. de la Calle Perez, A. Ibarra, P. Rodriguez, The MAGIC Collaboration, Simultaneous Multiwavelength Observations of Markarian 421 During Outburst
- [5] Maraschi, L. and et al. Simultaneous X-Ray and TEV Observations of a Rapid Flare from Markarian 421 ApJ 695 (596) 2009
- [6] Bartoli, B. and et al. 4.5 Years of Multi-wavelength Observations of MRK 421 During the ARGO-YBJ and FERMI Common Operation Time ApJS 222 (6) 2016
- [7] Amenomori, M. and et al. 4Multi-TeV Gamma-Ray Flares from Markarian 421 in 2000 and 2001 Observed with the Tibet Air Shower Array ApJ 598 (242) 2003
- [8] Fossati G. et al, Multiwavelength Observations of Markarian 421 in 2001 March: An Unprecedented View on the X-Ray/TeV Correlated Variability ApJ 677 (906) 2008
- [9] Błażejowski, M. and et al. A Multiwavelength View of the TeV Blazar Markarian 421: Correlated Variability, Flaring, and Spectral Evolution ApJ 630 (130) 2005
- [10] Aleksić, J. and et al. The 2009 multiwavelength campaign on Mrk 421: Variability and correlation studies A&A 576 (126) 2015
- [11] Abdo, A. A. et al. Fermi Large Area Telescope Observations of Markarian 421: The Missing Piece of its Spectral Energy Distribution ApJ 736 (131) 2011
- [12] Fraija, N. and Marinelli, A. TeV -ray fluxes from the long campaigns on Mrk 421 as constraints on the emission of TeV-PeV neutrinos and UHECRs ApJ 70 (54) 2015
- [13] V. A. Acciari et al, Observation of Markarian 421 in TeV gamma rays over a 14-year time span, Astrophys.J.54 (1-10) 2014,[astro-ph.HE/1310.8150v1]
- [14] Bradt, H.V., Rothschild, R.E. and Swank, J.H. Astronomy and Astrophysics Supplement 97 355 1993
- [15] Levine, A.M. et al, Astrophysical Journal 469 L33 1996
- [16] A. U. Abeysekara et al, Daily Monitoring of TeV Gamma-Ray Emission from Mrk 421, Mrk 501, and the Crab Nebula with HAWC, ApJ 841 2 2017
- [17] M.C. Stroh & A.D. Falcone, ApJS 207 28 2013 [1305.4949]
- [18] D’Agostini, G., Fits, and especially linear fits, with errors on both axes, extra variance of the data points and other complications, 2005,