Light and Heavy Element Abundance Variations in the Outer Halo Globular Cluster NGC 6229
Abstract
NGC 6229 is a relatively massive outer halo globular cluster that is primarily known for exhibiting a peculiar bimodal horizontal branch morphology. Given the paucity of spectroscopic data on this cluster, we present a detailed chemical composition analysis of 11 red giant branch members based on high resolution (R 38,000), high S/N ( 100) spectra obtained with the MMT–Hectochelle instrument. We find the cluster to have a mean heliocentric radial velocity of –138.1 km s-1, a small dispersion of 3.8 km s-1, and a relatively low (M/LV)⊙ = 0.82. The cluster is moderately metal–poor with [Fe/H] = –1.13 dex and a modest dispersion of 0.06 dex. However, 18 (2/11) of the stars in our sample have strongly enhanced [La,Nd/Fe] ratios that are correlated with a small (0.05 dex) increase in [Fe/H]. NGC 6229 shares several chemical signatures with M 75, NGC 1851, and the intermediate metallicity populations of Cen, which lead us to conclude that NGC 6229 is a lower mass iron–complex cluster. The light elements exhibit the classical (anti–)correlations that extend up to Si, but the cluster possesses a large gap in the O–Na plane that separates first and second generation stars. NGC 6229 also has unusually low [Na,Al/Fe] abundances that are consistent with an accretion origin. A comparison with M 54 and other Sagittarius clusters suggests that NGC 6229 could also be the remnant core of a former dwarf spheroidal galaxy.
Subject headings:
stars: abundances, globular clusters: general, globular clusters: individual (NGC 6229)1. INTRODUCTION
Chemical inhomogeneity is a staple of globular cluster formation and evolution, and the ubiquitous presence of large light element abundance variations has become a defining characteristic of these systems (e.g., see review by Gratton et al. 2012a). Although the origins and implications of the light element variations remain unsolved problems (e.g., Bastian et al., 2015; Renzini et al., 2015), cluster self–enrichment due to pollution from previous generations of more massive stars is frequently invoked as a possible explanation (e.g., Decressin et al., 2007; de Mink et al., 2009; Bastian et al., 2013; Denissenkov et al., 2015; D’Antona et al., 2016). In this light, it is interesting to note that most clusters do not exhibit similar abundance variations for the heavier , Fe–peak, and neutron–capture elements, and Carretta et al. (2009a) have shown that for many cases a cluster’s intrinsic [Fe/H]111[A/B] log(NA/NB)star – log(NA/NB)☉ and log (A) log(NA/NH) + 12.0 for elements A and B. dispersion is 12. Therefore, most clusters likely completed star formation within the first 100 Myr in order to avoid further pollution by Type Ia supernovae ([Fe/H] and [/Fe] variations) and/or 4 M⊙ asymptotic giant branch (AGB) stars (CNO and s–process variations).
However, a growing number of clusters have been found that possess both light and heavy element abundance variations. These “iron–complex” clusters share a common set of chemical and physical properties, including: (1) intrinsic [Fe/H] spreads that are larger than the measurement errors and range from 12–18 for clusters such as NGC 1851 and M 75 (e.g., Carretta et al., 2011; Kacharov et al., 2013) to about a factor of 100 for Cen (e.g., Johnson & Pilachowski, 2010; Marino et al., 2011a); (2) significant enhancements in elements produced by the slow neutron–capture process (s–process) that are correlated with [Fe/H]; (3) high cluster masses (MV –8); (4) very blue and extended horizontal branch (HB) morphologies that frequently include significant numbers of extreme HB and blue hook stars; and (5) the simultaneous presence of first (O/Mg–rich; Na/Al–poor) and second (O/Mg–poor; Na/Al–rich) generation stars in populations with different metallicities. Although iron–complex cluster formation is not yet understood, the consistent signature of strong s–process enhancements in the more metal–rich populations is an indication that these systems experienced prolonged ( 100 Myr) star formation.
The unusual chemical and physical characteristics of iron–complex clusters suggest that these systems may have different origins than “normal” monometallic clusters. As summarized in Da Costa (2016), several lines of evidence suggest that iron–complex clusters may be the remnant cores of dwarf spheroidal galaxies that have been accreted and tidally disrupted by the Milky Way. For example, several of the most massive iron–complex clusters host metal–rich populations that have low [/Fe], low [La/Fe], and/or lack the traditional light element abundance variations associated with globular cluster formation (Carretta et al., 2010a; Johnson & Pilachowski, 2010; Marino et al., 2011a; Pancino et al., 2011; Yong et al., 2014; Johnson et al., 2015; Marino et al., 2015; Johnson et al., 2017a), and it is possible that these stars represent the original field star populations of their parent galaxies. The two most massive iron–complex clusters Cen and M 54 also present strong evidence supporting accretion origins. Simulations indicate Cen could easily survive merging with the Galactic disk (e.g., Bekki & Freeman, 2003), and the cluster is known to follow a strong retrograde orbit (Dinescu et al., 1999). Similarly, M 54 resides at the center of the Sagittarius dwarf spheroidal galaxy (e.g., Bellazzini et al., 2008) and clearly has an extragalactic origin. Several iron–complex clusters also show evidence of diffuse outer envelopes that extend beyond their tidal radii (Grillmair et al., 1995; Olszewski et al., 2009; Marino et al., 2014; Kuzma et al., 2016), and these extended halos could represent remnant field star populations.
If some fraction of the Galaxy’s iron–complex clusters were accreted, then it is prudent to search for these objects in the outer halo. Therefore, we present an investigation into the chemical composition of the outer halo (RGC 30 kpc) globular cluster NGC 6229 with the goal of determining if it is a typical halo cluster, an accreted monometallic cluster, or a lower mass iron–complex cluster. Da Costa (2016) noted that NGC 6229 is a candidate iron–complex cluster because it has MV –7.8 and exhibits an extended blue HB. In fact, NGC 6229 shares a similar HB morphology with the two intermediate metallicity iron–complex clusters M 75 and NGC 1851, and also NGC 2808 (Borissova et al., 1997, 1999; Catelan et al., 1998, 2002), which is known to host at least five populations with different light element abundances (e.g., Carretta, 2015; Milone et al., 2015). Some evidence suggests that NGC 6229 may be associated with a halo stream and/or the clusters Pal 4, NGC 7006, and Pyxis (Palma et al., 2002), but none of these associations have been confirmed (e.g., Grillmair, 2014). Similarly, conflicting evidence exists regarding the validity of surface brightness excesses in the outer regions of the cluster that may signal the presence of a tidal stream or diffuse halo (Sanna et al., 2012; Carballo-Bello et al., 2014; Bellazzini et al., 2015).
2. OBSERVATIONS AND DATA REDUCTION
The spectroscopic data for this project were obtained with the MMT 6.5m telescope instrumented with the Hectochelle multi–fiber spectrograph (Szentgyorgyi et al., 2011) in clear weather on 2016 January 30 and 2016 April 22–30. We utilized the “Cu28” (11 hours), “CJ26” (7 hours), and “OB24” (8 hours) filters to obtain high resolution (R 38,000), high signal–to–noise (S/N 100 per reduced pixel) spectra through a series of 1 hour exposures. All exposures were binned 2 1 in the spatial and dispersion directions. The CU28, CJ26, and OB24 setups provided spectra in the 5725–5890, 6140–6320, and 6690–6895 Å bands, respectively; however, since the fiber output is curved on the detector, the blue/red cut–off wavelengths are slightly different between fibers located near the center and edges of the CCD. As a result, certain features (e.g., Mg and Al) residing near the ends of each order were only measured in some fibers.
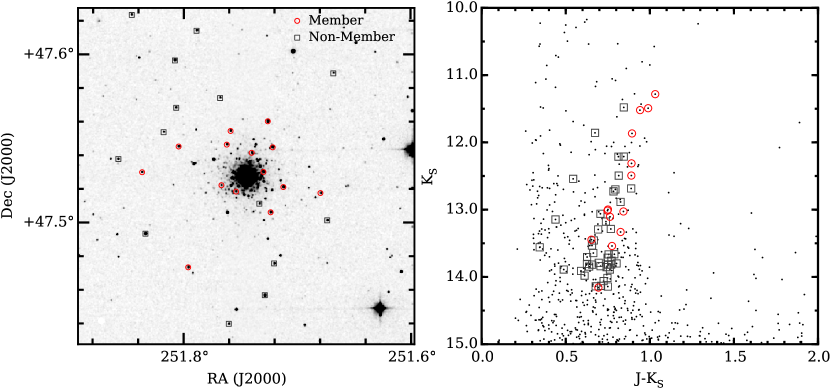
Using coordinates and photometry from the Two Micron All Sky Survey (2MASS; Skrutskie et al. 2006), we targeted 57 upper red giant branch (RGB) stars spanning 0.5–20 from the cluster center (see Figure 1). Approximately 30 additional fibers were placed on blank sky regions in order to obtain simultaneous sky spectra for subtraction. The targets ranged in luminosity from the RGB–tip down to about 1 magnitude brighter than the HB. Although the membership percentage correlates strongly with radial distance from the cluster center, the cluster’s large distance from the Sun (30 kpc) coupled with Hectochelle’s 1.5 fibers and 20 positioning constraints prevented placing additional fibers inside 0.5 of the cluster core with a single configuration. A summary of the 2MASS identifiers, J2000 coordinates, and photometry for all targets is included in Table 1.
A majority of the data reduction was carried out using the dedicated Hectochelle pipeline (Caldwell et al., 2009), which is maintained by the Telescope Data Center at the Smithsonian Astrophysical Observatory. The pipeline handles basic data reduction procedures, such as bias and overscan corrections, and also performs the fiber tracing, flat–fielding, wavelength calibration, and spectrum extraction. Additional processing, such as sky subtraction, spectrum co–addition, continuum normalization, and telluric correction, were carried out independently using standard IRAF222IRAF is distributed by the National Optical Astronomy Observatory, which is operated by the Association of Universities for Research in Astronomy, Inc., under cooperative agreement with the National Science Foundation. tasks.
3. RADIAL VELOCITIES AND CLUSTER MEMBERSHIP
Radial velocities were measured for each filter and exposure of every star with the XCSAO cross–correlation code (Kurtz & Mink, 1998). The velocities were measured relative to synthetic RGB spectra of similar temperature and metallicity that have been smoothed to match Hectochelle’s resolution. A summary of each star’s mean heliocentric radial velocity is provided in Table 1 along with the measurement uncertainty, which reflects the standard deviation of all measurements from each exposure and spectrograph configuration for each star.
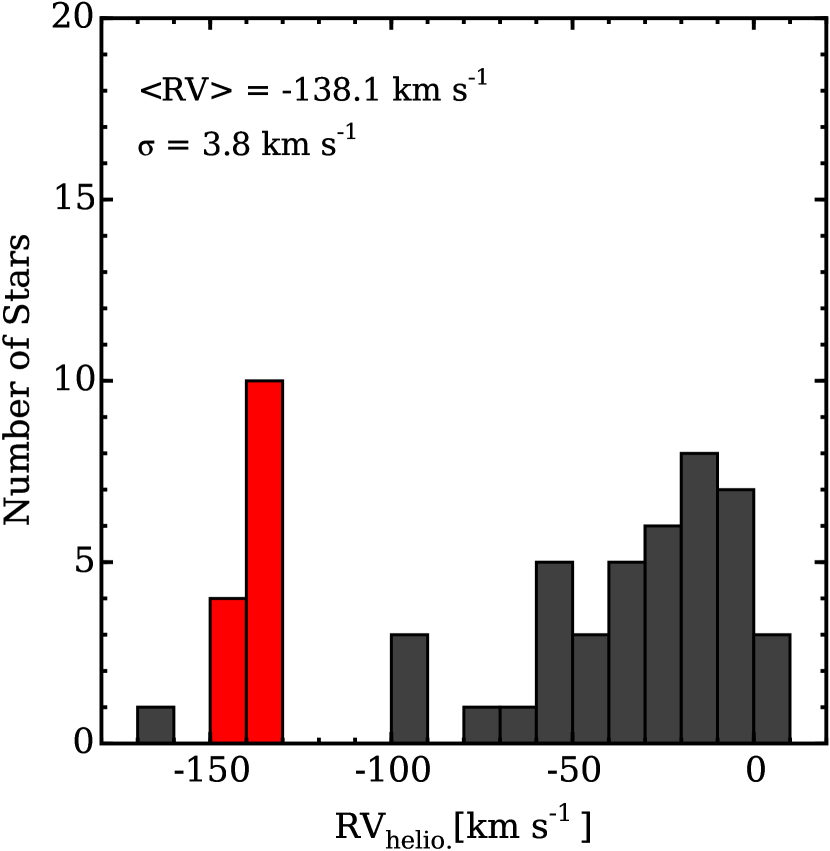
Typical measurement uncertainties ranged from about 0.3–0.6 km s-1, but we found one velocity variable star (2MASS 16470843+4744032; non–member) that varied by 33 km s-1 during the observing period. A small number of non–member stars have velocity uncertainties of 1–2 km s-1, but these are largely driven by mismatches between the object and template spectral types. Adopting limits of –150 and –130 km s-1 (see Figure 2), we found 14/57 (25) stars in our sample to be cluster members and all reside within 4 of the cluster center (see Figure 1).
Following the methodology of Walker et al. (2009), we derive a mean heliocentric cluster velocity and dispersion of –138.1 km s-1 and 3.8 km s-1, respectively. Although few velocity measurements are available in the literature for NGC 6229, we note that Pilachowski et al. (1983) measured a velocity of –139 km s-1 from one star. Additionally, a sample of 10 likely members within 4 of NGC 6229 from the Apache Point Observatory Galactic Evolution Experiment (APOGEE; Majewski et al. 2015) database yielded a similar velocity of –138.8 km s-1 ( = 4.2 km s-1).
Figure 2 illustrates that the member and non–member stars have clearly distinct velocity distributions, and therefore the cluster’s low velocity dispersion is unlikely to be affected by field star contamination. The star 2MASS 16472007+4729363 was found to have a heliocentric velocity of –162.7 km s-1, but it was classified as a non–member because the star’s spectroscopic temperature did not correlate with its J–KS color. Using the McLaughlin & van der Marel (2005) structural parameters for NGC 6229 and the M/L estimator of Strader et al. (2009), we find the cluster to have (M/LV)⊙ = 0.82. This is among the lower M/L ratios of clusters measured with the Strader et al. (2009) method, but is not extreme (e.g., Strader et al., 2011).
4. DATA ANALYSIS
4.1. Model Atmosphere Parameters
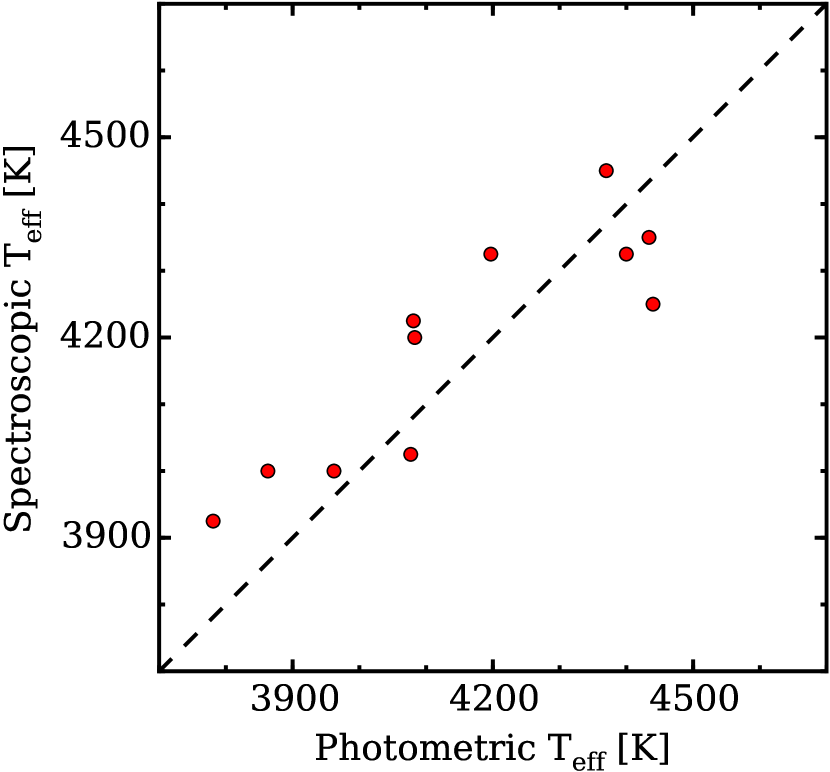
The effective temperatures (Teff) listed in Table 2 were determined by removing trends in plots of log (Fe I) versus excitation potential. However, since the cluster’s line–of–sight reddening is small (E(B–V) 0.01; Zinn 1980), we also estimated Teff values with dereddened J–KS photometry and the color–temperature relation of González Hernández & Bonifacio (2009). Figure 3 shows that the spectroscopic and photometric Teff estimates are in good agreement with a mean offset, in the sense Teff spectroscopic minus Teff photometric, of 35 K and a dispersion of 116 K. The star–to–star scatter in Figure 3 is in reasonable agreement with the 94 K Teff uncertainty of the color–temperature calibration. Note that 3/14 member stars were excluded from further analysis due to either lower S/N spectra or a significant disagreement ( 300 K) between the spectroscopic and photometric Teff estimates.
Surface gravities (log(g)) were determined from interpolation within the Dartmouth stellar isochrone database (Dotter et al., 2008) rather than the ionization equilibrium of iron. For each star, we initially adopted the log(g) value appropriate for a star with the photometric Teff and [Fe/H] = –1.2 dex, and iteratively updated the log(g) value based on new estimates of the star’s spectroscopic Teff and [Fe/H] abundance. We also assumed [/Fe] = 0.2 dex, an age of 12 Gyr (Arellano Ferro et al., 2015), and a canonical He abundance for the isochrone models.
Microturbulence (mic.) was set by removing trends in plots of log (Fe I) versus reduced equivalent width (EW). Lines with log(EW/) –4.5 were removed in order to avoid uncertainties in mic. due to line saturation. Finally, we set the model metallicity equal to the derived [Fe/H] abundance, and accounted for differences between [Fe/H] and [M/H] by adopting the –enhanced ATLAS9 model atmospheres from Castelli & Kurucz (2004).
4.2. Equivalent Width and Spectrum Synthesis Analyses
The abundances of Na I, Al I, Si I, Ca I, Cr I, Fe I, and Ni I were determined using EWs measured with the software package outlined in Johnson et al. (2014) and the abfind driver of the line analysis code MOOG (Sneden, 1973, 2014 version). Isolated lines were fit with single Gaussian profiles while weakly blended lines were deblended using multiple Gaussian profiles. Potential absorption lines were identified by visual inspection of a high S/N cluster member spectrum in comparison with the Arcturus atlas from Hinkle et al. (2000). Strongly blended lines were flagged and avoided during the analysis. In an effort to minimize the impact of departures from local thermodynamic equilibrium and model atmosphere deficiencies, all abundances were measured relative to Arcturus. Additionally, log(gf) values were determined by an inverse Arcturus abundance analysis using the [Fe/H] and [X/Fe] abundance ratios given in Johnson et al. (2012, 2014). A summary of the lines selected for measurement, along with their lower excitation potentials, log(gf) values, and adopted Arcturus and Solar log (X) abundances, is provided in Table 3. The final [Fe/H] and [X/Fe] ratios are listed in Tables 4–5.
For O I, Mg I, Cu I, Zr I, La II, and Nd II, the abundances were measured using the synth spectrum synthesis module of MOOG. Since the O abundance of a cool star can be affected by its C and N abundances, we simultaneously fit the 6300.3 Å [O I] and nearby CN features using the CN line lists from Sneden et al. (2014). Specifically, the [C/Fe] ratios were set at –0.3 dex for all stars while we iteratively improved the O and CN synthesis fits by varying log (O) and log (N). After determining the CNO abundances, log (Mg) was measured using only the bluest line of the 6318 Å Mg I triplet. For most stars, the redder triplet lines were too close to the CCD edge to provide reliable abundances. The nearby but broad Ca autoionization feature was fit by adjusting the log (Ca) abundance for each star; however, its effects were small ( 0.05 dex) for the stars in our sample.
The Zr I lines were also fit via spectrum synthesis, but since 90 of the total Solar Zr abundance is in the even–Z isotopes 90Zr, 92Zr, 94Zr, and 96Zr (e.g., Anders & Grevesse, 1989) we did not include any corrections for hyperfine broadening. The Nd abundance is also dominated by even–Z isotopes (e.g., Aoki et al., 2001; Den Hartog et al., 2003) and did not require additional corrections due to isotope wavelength shifts or hyperfine broadening.
The 5782 Å Cu I line can be significantly affected by a nearby diffuse interstellar band (DIB) when the line–of–sight reddening his high. However, since E(B–V) 0.01 for NGC 6229 we did not detect any significant DIB features. The 5782 Å line is relatively strong and dominated by the two odd–Z nuclei 63Cu (69.17) and 65Cu (30.83). Therefore, we derived all Cu abundances using the hyperfine line list from Cunha et al. (2002). Similarly, the La abundance is dominated by the 139La isotope, which frequently exhibits strong hyperfine broadening, and we adopted the line lists of Lawler et al. (2001) for all log (La) determinations. A summary of the selected lines and [X/Fe] ratios for all elements measured via spectrum synthesis is provided in Tables 3–5.
4.3. Abundance Uncertainties
The internal abundance uncertainties are dominated by errors in the model atmosphere parameter determinations, EW or spectrum synthesis fitting, and adopted log(gf) values. For the model atmosphere values, we have adopted typical uncertainties of 100 K in Teff, 0.15 (cgs) in log(g), 0.1 dex in [M/H], and 0.15 km s-1 in mic.. The temperature uncertainty is derived from Figure 3, which shows that the dispersion when comparing photometric and spectroscopic Teff estimates is approximately 100 K (see also Section 4.1). By extension, changing Teff 100 K also modifies log(g) by 0.15 (cgs) in the stellar isochrone set used here (see Section 4.1). The adopted metallicity uncertainty of 0.1 dex matches the typical line–to–line [Fe/H] dispersion, and the mic. uncertainty is derived from an examination of the scatter in plots of log (Fe I) versus reduced EW.
Given the high S/N ( 100 per reduced pixel) of the co–added spectra, the fitting errors for both EW and synthesis analyses are small ( 0.05 dex). Additionally, we assume that log(gf) uncertainties are mostly included in each element’s line–to–line abundance scatter, and that model atmosphere deficiencies are largely offset by keeping our analysis relative to the metal–poor giant Arcturus. Therefore, the abundance uncertainty values given in Tables 2, 4, and 5 include the line–to–line scatter of each element divided by and added in quadrature with the cumulative effects of changing each model atmosphere parameter by the amount specified above. For elements other than iron, the [X/Fe] uncertainties include any correlated variations between log (X) and log (Fe).
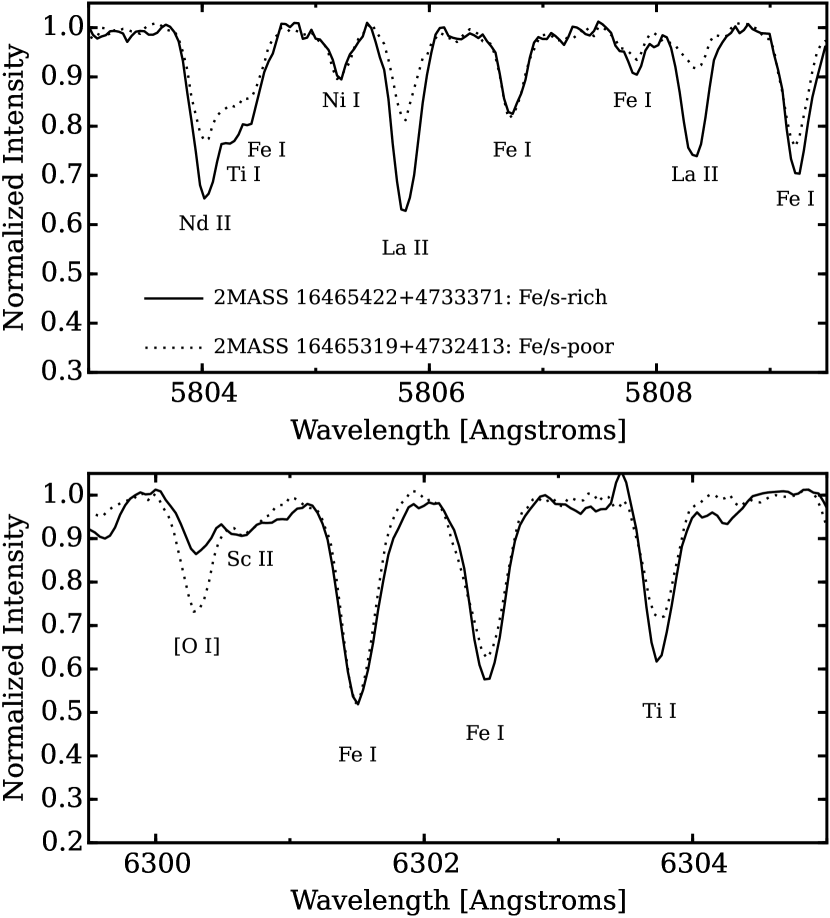
We did not find any significant trends between the derived abundance ratios and model atmosphere parameters. However, the three stars with [Fe/H] –1.1 have substantially lower [O/Fe] and higher [Na,Al/Fe] ratios, and 2/3 of these stars also exhibit very high [La,Nd/Fe] ratios. These abundance variations will be discussed further in Section 5, but Figure 4 shows that the light and heavy element abundance variations follow significant line strength variations and are not a result of model atmosphere uncertainties.
5. RESULTS AND DISCUSSION
Aside from studies by Pilachowski et al. (1983, high resolution; 1 star) and Wachter et al. (1998, medium resolution; 3 stars), which revealed that NGC 6229 exhibits an intrinsic [C/Fe] spread and is mildly –enhanced with [Ca/Fe] = 0.2, little is known about the detailed chemical composition of the cluster. Therefore, the present work represents the first composition analysis of a significant number (11 stars) of cluster members.
5.1. Light Elements
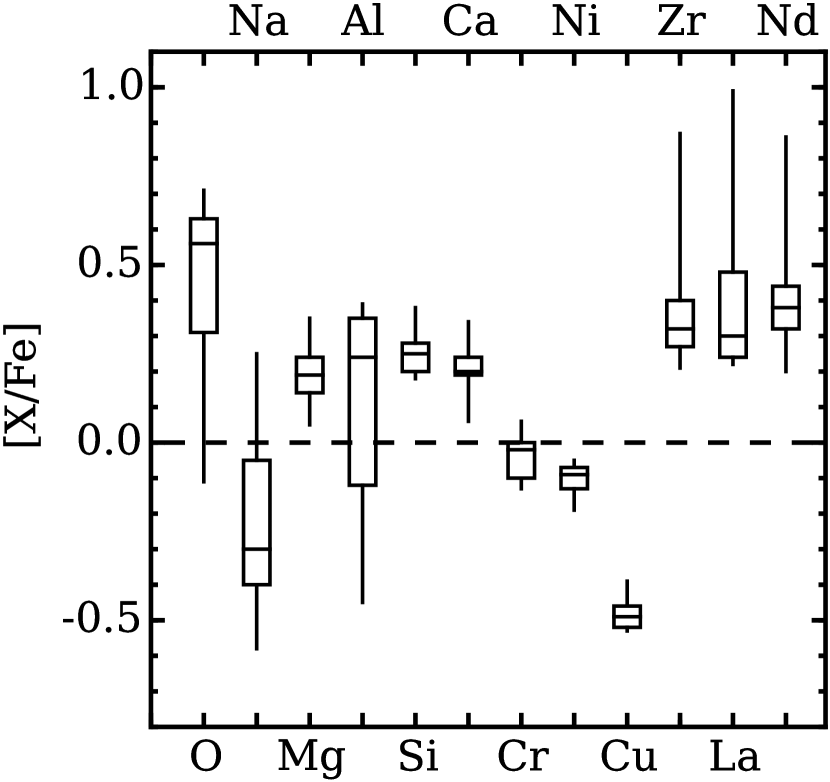
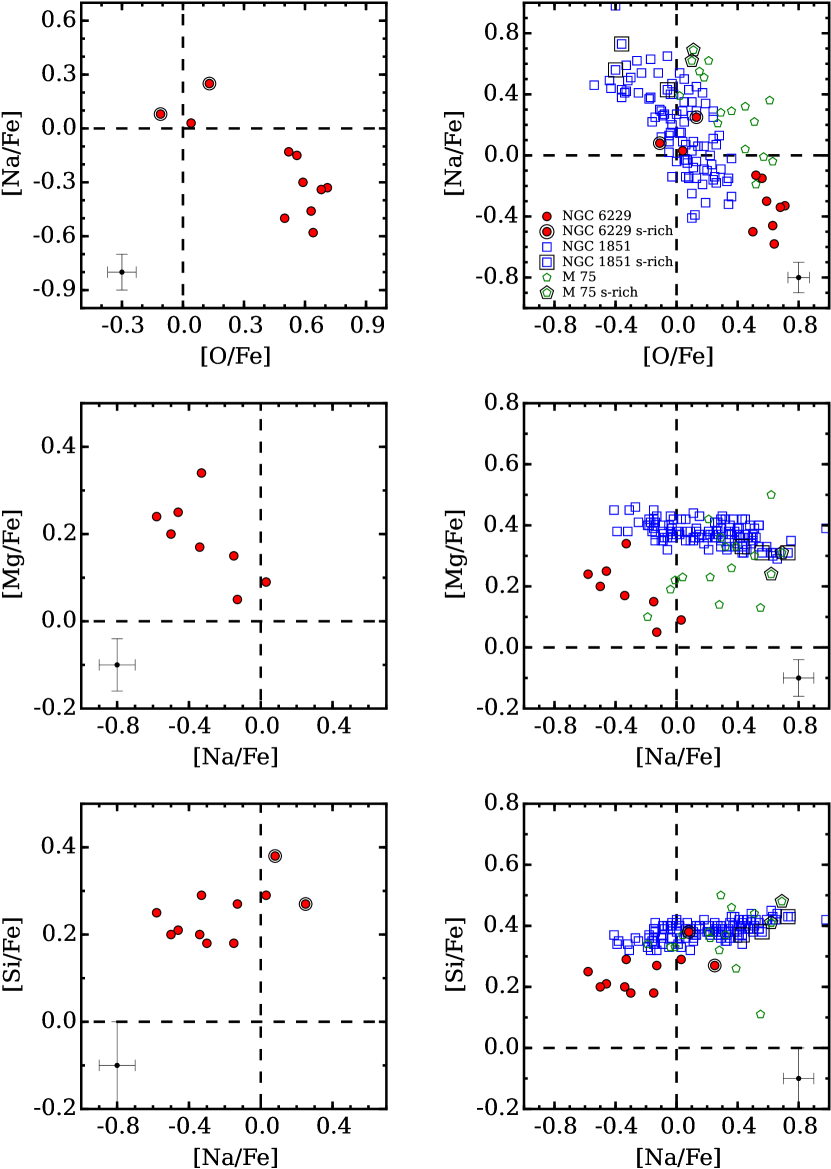
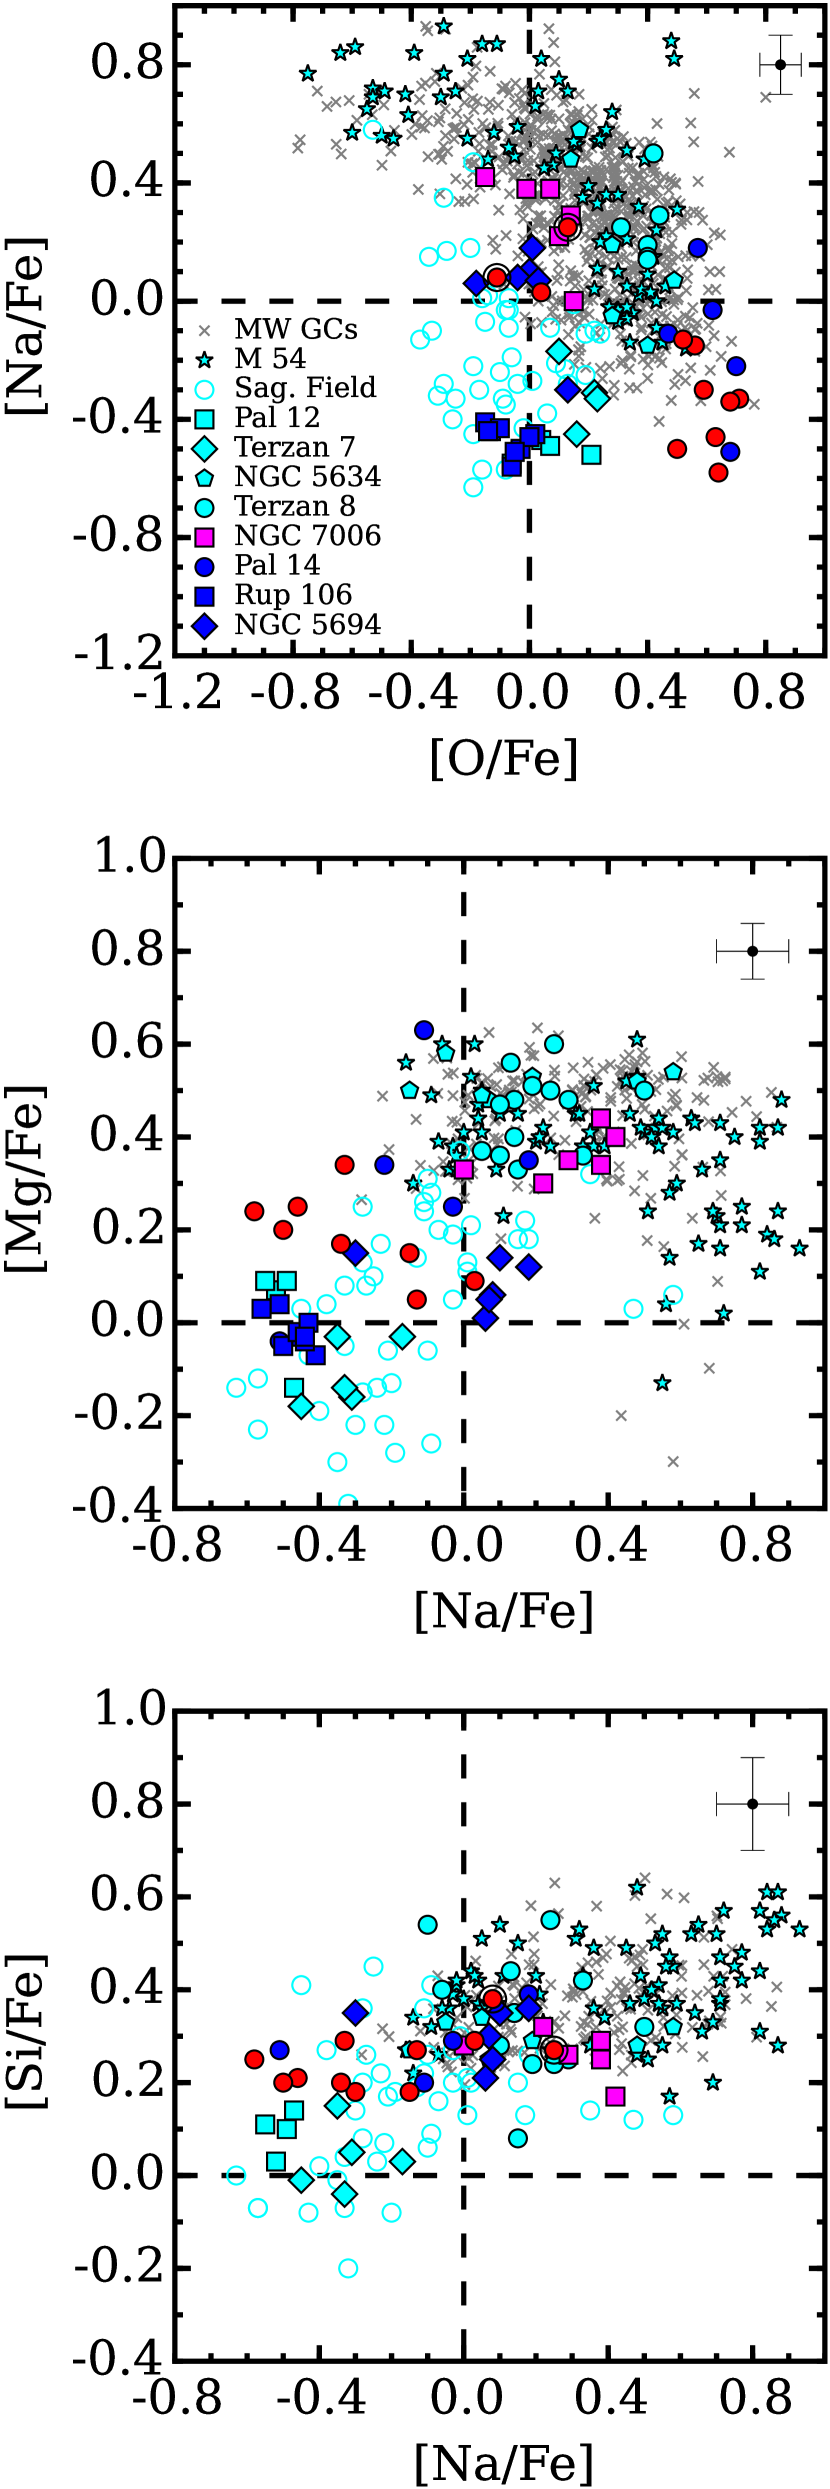
A summary of our derived [X/Fe] ratios is provided in Figure 5, and shows in agreement with Wachter et al. (1998) that the light elements exhibit large star–to–star abundance variations. In particular, [O/Fe], [Na/Fe], and [Al/Fe] span full ranges of 0.85 dex, and Figure 6 indicates that NGC 6229 exhibits the typical signatures of pollution from proton–capture burning: O–Na and Na–Mg anti–correlations along with a mild Na–Si correlation. Previous work has shown that the O–Na and Na–Al relations naturally arise when burning temperatures exceed 45–70 MK (e.g., Langer et al., 1997; Prantzos et al., 2007), but temperatures ranging from at least 70–100 MK are required in order to deplete 24Mg and produce 28Si (e.g., Ventura et al., 2011, 2013). Although the abundance variations of [Mg/Fe] and [Si/Fe] are significantly smaller in NGC 6229 than those of [O/Fe] and the odd–Z elements, the clear Na–Mg and Na–Si (anti–)correlations presented in Figure 6 indicate that the cluster’s second generation stars must have formed from gas that was processed at temperatures exceeding 70 MK. However, we did not observe any correlations between the light elements and [Ca/Fe], and NGC 6229 lacks the large [Ca/Mg] spread that is characteristic of clusters that experienced more extensive proton–capture nucleosynthesis (e.g., Carretta, 2015). We conclude that the gas from which the second generation stars in NGC 6229 formed likely did not experience burning temperatures higher than 100 MK.
Although NGC 6229 possesses the classical light element (anti–)correlations, its chemistry differs from most clusters in two key aspects: (1) both [Na/Fe] and [Al/Fe] are abnormally low and (2) a large gap is present in the O–Na anti–correlation (see Figure 6). The low [Na/Fe] and [Al/Fe] abundances are particularly interesting and will be discussed further in Section 5.6, but their strong depletion likely indicates that NGC 6229 did not form in its current environment. The origin of the O–Na gap is not clear and may simply reflect the small (11 star) sample size analyzed here; however, if confirmed with a larger sample, NGC 6229 would possess one of the largest O–Na discontinuities of any cluster. Photometric studies have shown that nearly all globular clusters contain stellar populations with unique light element chemistry (e.g., Piotto et al., 2015; Milone et al., 2017), but the difference in [O/Fe] between adjacent populations is typically 0.3 dex or less (e.g., Yong et al., 2005; Marino et al., 2008; Gratton et al., 2012b; Carretta, 2013; Kacharov et al., 2013; Carretta, 2015; Johnson et al., 2017b). In contrast, Figure 6 shows that the difference in [O/Fe] between O–rich and O–poor stars for NGC 6229 may be as large as 0.5 dex. Except for being shifted to lower [Na/Fe], the large O–Na gap in NGC 6229 closely mirrors the distribution observed in Cen stars with –1.3 [Fe/H] –0.9 (Johnson & Pilachowski, 2010; Marino et al., 2011a), and suggests that the two populations may have experienced similar formation processes333We note that both clusters also exhibit strikingly bimodal Na–Al correlations, but this distribution needs to be confirmed with a larger sample for NGC 6229..
The cluster’s O–Na discontinuity may also reflect its “clumpy” HB, which exhibits both a paucity of RR Lyrae stars and a gap in the blue HB (e.g., Catelan et al., 1998; Borissova et al., 1999). Several studies have shown that a star’s HB location is closely tied to its He abundance and light element composition (e.g., Gratton et al., 2011; Marino et al., 2011c; Gratton et al., 2012b; Villanova et al., 2012; Marino et al., 2014; Gratton et al., 2015), and from Figure 6 one might expect that NGC 6229 is dominated by red HB stars. However, the results from Borissova et al. (1997) and Catelan et al. (1998) indicate that the cluster has a ratio of red HB, RR Lyrae, and blue HB stars of about 32, 12, and 56, respectively. Therefore, NGC 6229 may be similar to clusters such as NGC 1851 and NGC 6723 where first generation stars, perhaps as a result of mild He enrichment or variable mass loss, populate both the red HB and a portion of the blue HB (Gratton et al., 2012b, 2015). If the data presented here are representative of the cluster’s global first–to–second generation ratio, then the first generation stars may also extend farther down the blue HB, similar to the HB distribution predicted by Tailo et al. (2016) for the O–rich/Na–poor intermediate metallicity stars of Cen. In this case, the 27 (3/11) of stars in our sample that are clearly O–poor/Na–rich will evolve to become only the warmest HB and extreme HB stars. A larger sample will be needed in order to determine if the O–Na gap is real and whether the number ratios of first and second generation stars can be reconciled with the cluster’s HB morphology.
5.2. Heavy Elements
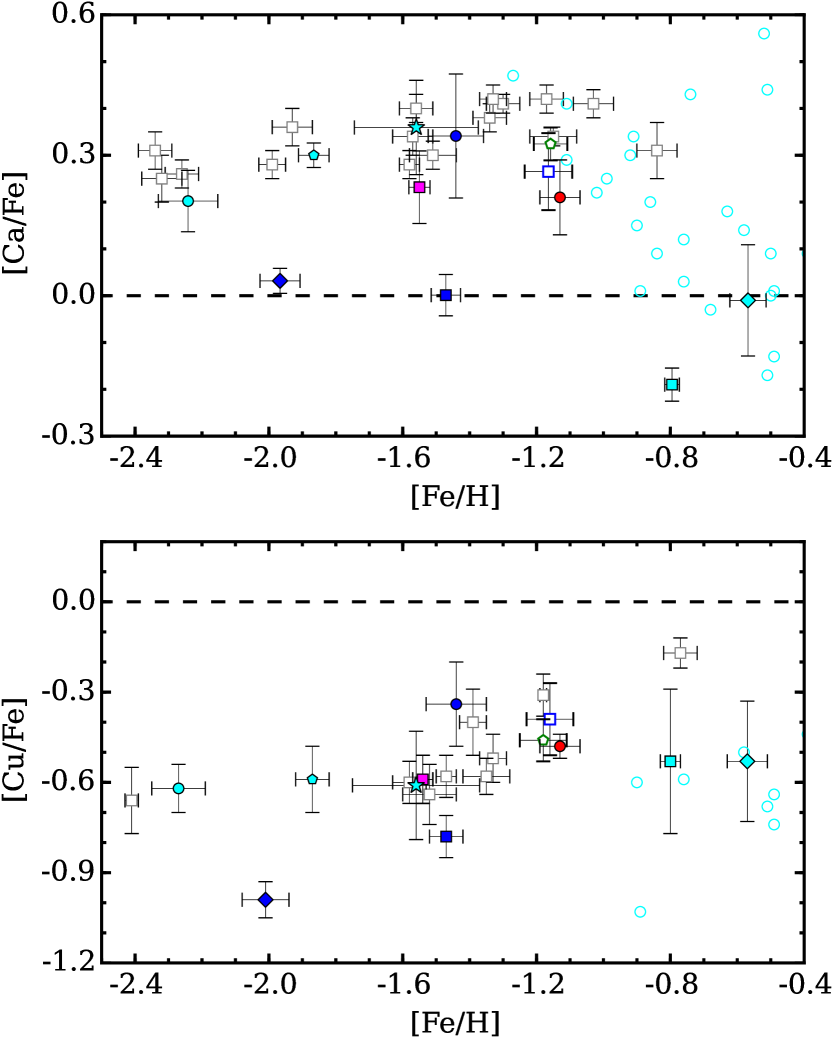
For [Ca/Fe], [Cr/Fe], [Ni/Fe], and [Cu/Fe], the star–to–star dispersions are 0.05 dex or less, and we find in agreement with Pilachowski et al. (1983) that the cluster is moderately –enhanced with [Ca/Fe] = 0.22 dex. Additionally, [Cr/Fe] and [Ni/Fe] exhibit approximately Solar ratios, and [Cu/Fe] is strongly depleted with [Cu/Fe] = –0.48 dex. In general, [Ca/Fe] is enhanced and [Cu/Fe] is depleted in metal–poor globular clusters, but in Section 5.6 we provide some evidence that NGC 6229 may be slightly –poor and Cu–poor compared to many similar metallicity Galactic clusters.
The heavy neutron–capture elements Zr, La, and Nd are all moderately enhanced with mean [X/Fe] ratios of 0.4 dex and dispersions of 0.2 dex. However, two stars in our sample have very high [La/Fe] and [Nd/Fe], and if these stars are removed then the mean heavy element [X/Fe] ratios decrease to 0.3 dex with dispersions of 0.1 dex. These moderate heavy element enhancements are typical for Galactic clusters near NGC 6229’s metallicity (e.g., James et al., 2004). Interestingly, the two La/Nd–rich stars are also among the most O–poor and Na/Al–rich in the cluster, which matches a pattern observed in both M 75 (Kacharov et al., 2013) and NGC 1851 (Carretta et al., 2011, see also Section 5.5).
Although we were unable to measure [Eu/Fe], we strongly suspect that the two La/Nd–rich stars were polluted by material that experienced extensive s–process enrichment, rather than the cluster exhibiting a large r–process dispersion (e.g., Roederer, 2011). For example, we note above that NGC 6229 shares similar composition characteristics with M 75 and NGC 1851, and both clusters contain stars where the La/Nd–enhancements were driven by the s–process (i.e., the stars have high [La,Nd/Eu] ratios). Furthermore, the La/Nd–enhanced stars in NGC 6229 would need to have [Eu/Fe] 1.2 in order to maintain r–process dominated ratios of [La/Eu] –0.3, but even the most Eu–rich clusters do not host stars with [Eu/Fe] 1 (e.g., Johnson et al., 2017b). Therefore, we conclude that NGC 6229 likely contains a separate population of stars that possess strong s–process enhancements.
5.3. Metallicity Distribution
The few spectroscopic and photometric metallicity estimates that exist for NGC 6229 span a wide range from [Fe/H] –1.5 to –1.05 dex, but the overall consensus is that the mean metallicity is probably around [Fe/H] = –1.3 to –1.1 (Pilachowski et al., 1983; Carney et al., 1991; Wachter et al., 1998; Borissova et al., 1999, 2001; Arellano Ferro et al., 2015). We note also that a reanalysis of the APOGEE data set by Ness et al. (2015) included 6 likely cluster members within 3 of the cluster core and found [Fe/H] = –1.35 dex ( = 0.16 dex). However, the large dispersion is driven by one star (2MASS 16464310+4731033) that is 0.35 dex more metal–rich than the main population. For the present data set, we find [Fe/H] = –1.13 dex ( = 0.06 dex), which is higher than some studies but within the range estimated by previous investigators. Similar to Ness et al. (2015), we also find 2MASS 16464310+4731033 to have a higher metallicity than most cluster stars, but the difference is considerably smaller at 0.05 dex. Despite the modest [Fe/H] dispersion measured here, the data suggest that NGC 6229 may possess light and heavy element signatures that are more similar to iron–complex, rather than monometallic, clusters.
5.4. Monometallic or Iron–Complex?
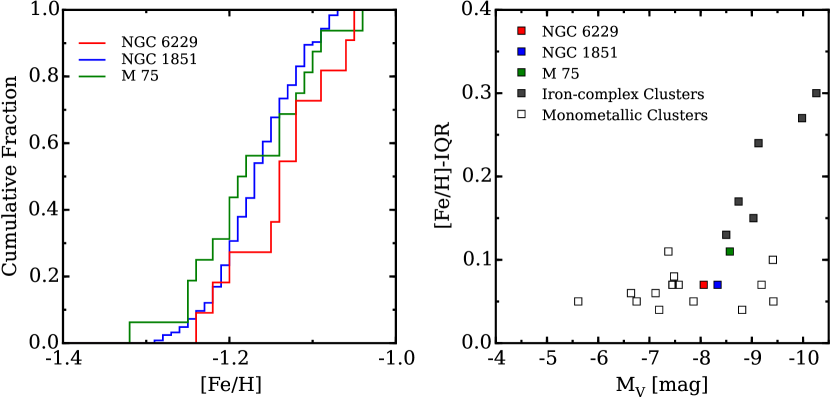
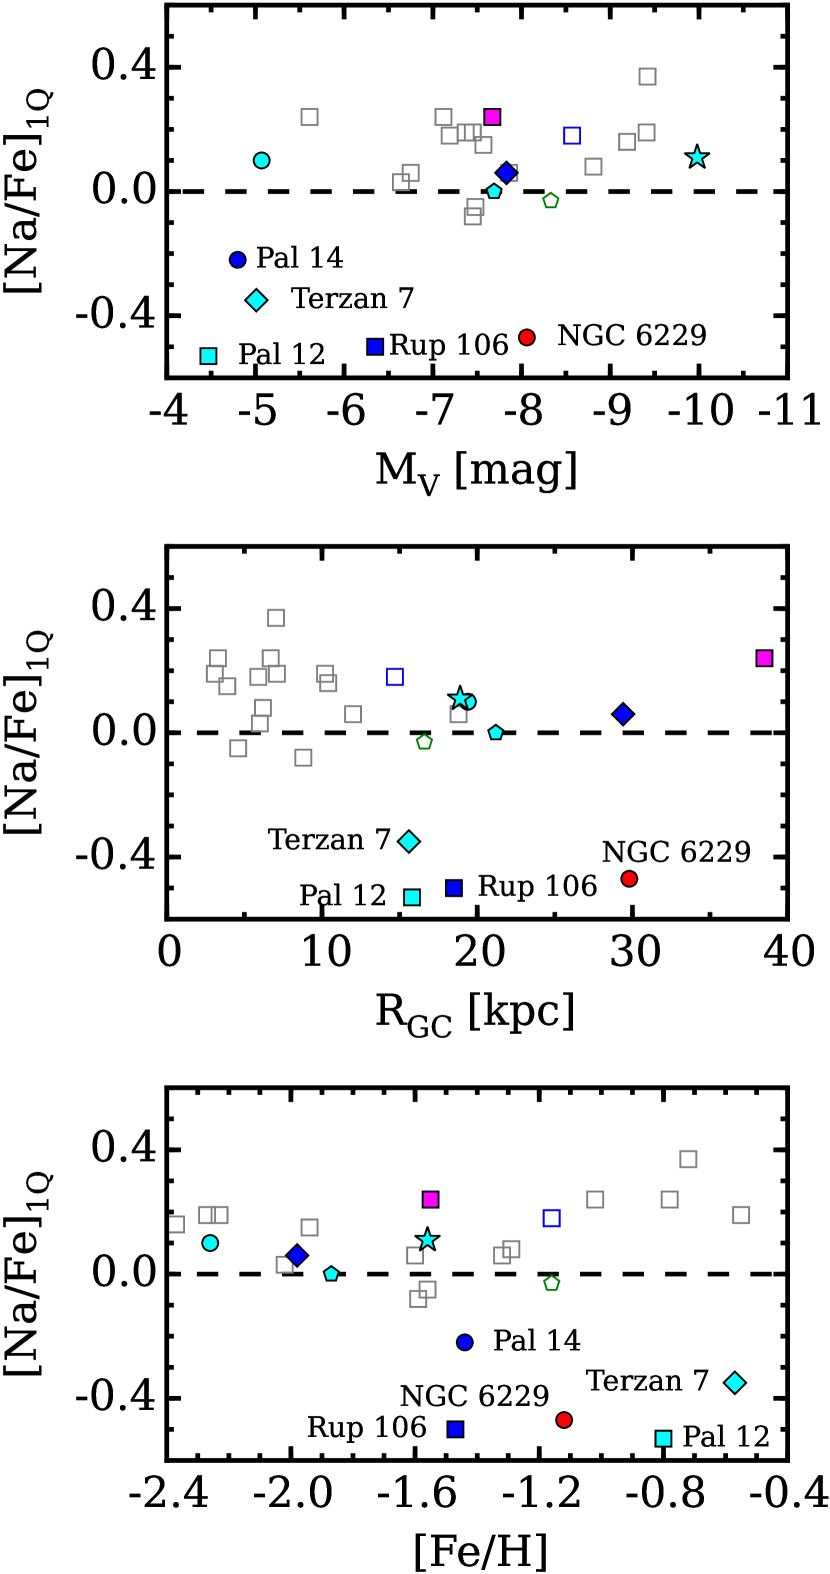
Since 18 (2/11) of the stars in our sample exhibit strongly enhanced [La,Nd/Fe] ratios, it is prudent to investigate whether NGC 6229 is a lower mass iron–complex cluster or a higher mass monometallic cluster. Classifying NGC 6229 as either a monometallic or iron–complex cluster primarily hinges on three questions: (1) is the observed scatter in [Fe/H] significant?; (2) are the enhancements in [La,Nd/Fe] correlated with [Fe/H]?; and (3) are the (presumably) s–process enhancements due to cluster pollution or binary mass transfer? The first question is difficult to answer with a small sample, and as stand–alone parameters the cluster’s [Fe/H] dispersion (0.06 dex; 17) and interquartile range (IQR; 0.07 dex) values do not immediately flag the cluster as a member of the iron–complex class. However, Figure 7 shows that at MV = –8.06 NGC 6229 spans a parameter space where the separation between iron–complex and monometallic clusters, based on metallicity spreads alone, is ambiguous.
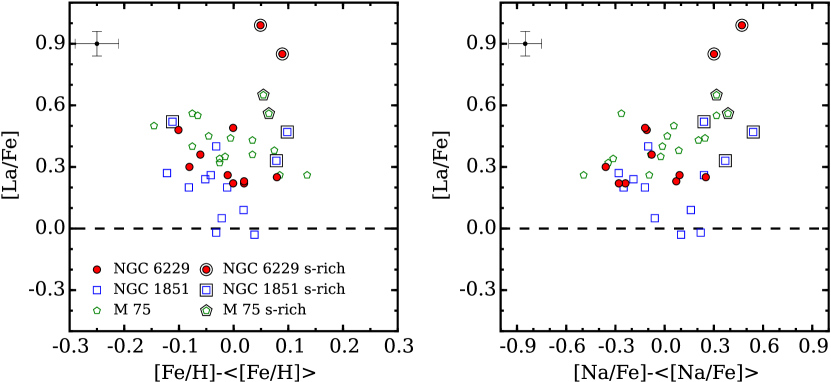
On the other hand, Figure 7 also indicates that except for small zero–point differences of 0.03 dex the metallicity distribution functions of NGC 6229, M 75, and NGC 1851 are nearly identical. Critically, the latter two systems are recognized as iron–complex clusters (Marino et al., 2015; Da Costa, 2016) because their s–process enhanced stars are thought to form distinct populations. In both cases, the s–process enhancements are correlated with small (0.05–0.10 dex) increases in [Fe/H] (Carretta et al., 2011; Kacharov et al., 2013). Figure 8 shows that NGC 6229 exhibits the same trend with the two La/Nd–rich stars being 0.05–0.10 dex more metal–rich than the cluster average. When all three clusters are combined, Figure 8 shows that we obtain a stronger correlation signature between [Fe/H] and [La,Nd/Fe] enhancements. In fact, a set of 106 random samplings of the combined data indicates only a 0.45 chance that one would draw 6 or more La/Nd–rich stars with [Fe/H] values at least 0.05 dex higher than the cluster average, and we conclude for all three clusters that the heavy element enhancements are likely correlated with small, but real, [Fe/H] enhancements.
An alternative explanation for the La/Nd–rich stars in NGC 6229 and other clusters, especially those for which only small samples of enriched stars have been found, is that they experienced mass transfer from binary companions. For NGC 6229, we did not detect radial velocity variations over the 3 month observing window, but cannot directly test the mass transfer scenario further without measuring additional heavy elements (e.g., see Roederer et al., 2016). However, previous work indicates that mass transfer alone is unlikely to produce significant numbers of s–process enhanced stars in globular clusters, and we note that D’Orazi et al. (2010) estimate that the binary fraction among second generation (Na–rich) cluster stars is only 1. In this context, we note that Figures 6 and 8 show that both La/Nd–rich stars in our sample are very Na–rich, and it is unlikely that a random sampling of 11 RGB stars would yield such a comparatively high fraction of second generation stars enriched by mass transfer events. Instead, a cluster self–enrichment process is the more probable scenario. Therefore, we conclude that NGC 6229 likely contains a separate population of stars enriched by the s–process and is the lowest mass iron–complex cluster currently known in the Galaxy444We note that Simmerer et al. (2013) found a potential [Fe/H] spread in NGC 3201, and that the cluster has a fainter absolute magnitude than NGC 6229 with MV = –7.45 (Harris, 1996). However, Mucciarelli et al. (2015) disputes the [Fe/H] spread claim, and we note that Muñoz et al. (2013) did not find any stars with strong s–process enhancements. Therefore, even if NGC 3201 does have a metallicity spread it may not share the same chemical traits that link other iron–complex clusters..
5.5. Implications of Correlated Light and Heavy Element Abundance Variations
In addition to sharing similar metallicities and heavy element patterns, NGC 6229, M 75 (Kacharov et al., 2013), and NGC 1851 (Yong & Grundahl, 2008; Yong et al., 2009; Carretta et al., 2011; Gratton et al., 2012c; Carretta et al., 2014a; Simpson et al., 2017) also exhibit an interesting correlation between their light and heavy element abundances that may provide insight into their formation. Figure 8 indicates that the s–process enhanced stars are consistently among the most Na–rich in their respective clusters despite the fact that all three systems exhibit different light element (anti–)correlations555Carretta et al. (2011) showed that the metal–poor and metal–rich populations in NGC 1851 contain stars with similar light element abundance ranges. However, in the context of this paper the correlation between light and heavy elements in NGC 1851 refers to the strong preference of stars with [Ba/H] –0.4 to have enhanced [Na/Fe]. For example, NGC 1851 stars with [Ba/H] –0.4 have [Na/Fe] = 0.14 dex ( = 0.26 dex) while those with higher [Ba/H] have [Na/Fe] = 0.51 dex ( = 0.26 dex). In other words, the s–process enhanced population in NGC 1851 is dominated by second generation (Na–rich) stars.. For example, Figure 6 shows that NGC 6229 has significantly lower [Na/Fe] and [Si/Fe] than M 75 and NGC 1851, M 75 exhibits a smaller range in [O/Fe] than NGC 6229 and NGC 1851, and only NGC 6229 and NGC 1851 have clear Na–Mg anti–correlations. Interestingly, we note that, in addition to sharing a large gap in the O–Na relation with NGC 6229, the intermediate metallicity (–1.3 [Fe/H] –0.9) stars of Cen also exhibit a similar preference for the s–process enhanced stars to have high [Na/Fe] (Johnson & Pilachowski, 2010; Marino et al., 2011a). Furthermore, the Cen stars likely experienced even more extreme proton–capture processing than NGC 6229, M 75, or NGC 1851. However, similar light and heavy element correlations are not present in the more metal–poor Cen stars nor in any other iron–complex clusters (Marino et al., 2009; Yong et al., 2014; Marino et al., 2015; Roederer et al., 2016; Johnson et al., 2017a), and s–process production is not correlated with light element abundance variations in most monometallic clusters (e.g., D’Orazi et al., 2010).
The data suggest that NGC 6229, M 75, NGC 1851, and the intermediate metallicity Cen stars all experienced similar modes of star formation, even if the chemical enrichment details (e.g., polluter mass ranges; initial compositions) varied from cluster–to–cluster. In this light, the delayed binary Type II supernova model outlined by D’Antona et al. (2016) and D’Ercole et al. (2016) provides a context with which we may interpret formation differences between clusters such as NGC 6229, which have Fe/s–process enhanced populations dominated by second generation stars, and clusters such as M 22, which have Fe/s–process enhanced populations exhibiting a mixture of first and second generation stars.
For both cases listed above, D’Antona et al. (2016) and D’Ercole et al. (2016) suggest that a mixing of AGB ejecta with pristine gas produces the light element abundance variations present in the “metal–poor” populations of iron–complex clusters. However, if a sufficient number of massive stars are initially below the supernova threshold (8–10 M⊙), are in close binary systems, and experience enough mass transfer to undergo core collapse, then a second “delayed” supernova epoch may occur and form a new population of stars with higher [Fe/H]. In this scenario, D’Ercole et al. (2016) notes that inhomogeneous mixing between supernova and AGB gas could produce both first and second generation stars when the mixed gas is reaccreted by the cluster, which would result in a system resembling M 22. Therefore, we speculate that the more metal–rich populations present in clusters similar to NGC 6229, where the ratio of second to first generation stars is considerably higher than in the metal–poor populations, could have formed if the delayed supernova gas and AGB ejecta were instead well–mixed. Alternatively, metal–rich first and second generations stars could form at different times, but this would require second generation stars to form first, perhaps as a result of a radial composition gradient, and also for star formation to end at earlier times in lower mass iron–complex clusters. Differences in radiative cooling time could also help explain a scenario in which second generation stars form more efficiently in higher metallicity populations (e.g., Herwig et al., 2012, see their Section 4.2.3). We note that cluster mergers may also remain a viable explanation (e.g., Carretta et al., 2010c; Gavagnin et al., 2016).
5.6. Clues to NGC 6229’s Origin and Evolution
NGC 6229 shares a variety of chemical characteristics with both monometallic and iron–complex clusters, but the cluster’s low [Na/Fe] (and [Al/Fe]) abundances distinguish it from most other Galactic systems. Figures 9–10 indicate that NGC 6229 shares its low [Na/Fe] ratios with the clusters Rup 106, Pal 12, Pal 14, and Terzan 7, and all four systems are strongly suspected to have extragalactic origins. For example, Pal 12 (Cohen, 2004) and Terzan 7 (Sbordone et al., 2007) are strongly tied to the Sagittarius stream while Pal 14 (Çalışkan et al., 2012) and Rup 106 (Villanova et al., 2013) exhibit chemical signatures reminiscent of those found in dwarf galaxies and/or their globular cluster populations. Figure 11 also indicates that NGC 6229 may be deficient by 0.2 dex in [Ca/Fe] and [Cu/Fe] compared to similar metallicity halo clusters. We note that the combination of low [Na/Fe], [/Fe], and [Cu/Fe], particularly at higher metallicity, is a chemical signature that is frequently associated with accreted systems, including Cen (Cunha et al., 2002; Pancino et al., 2002), field stars within the Sagittarius dwarf spheroidal galaxy (e.g., McWilliam et al., 2013), and accreted Galactic field stars (e.g., Nissen & Schuster, 2011). Combining these data with NGC 6229’s 30 kpc galactocentric radius leads us to conclude that NGC 6229 is also an accreted cluster and probably formed in a more massive progenitor system that has since been tidally disrupted by the Milky Way.
Previous attempts to match NGC 6229 to known tidal streams have been unsuccessful (e.g., Grillmair, 2014), but the cluster may have been part of a relatively low mass system and/or was accreted early in the Galaxy’s history. Unfortunately, little is known about the cluster’s orbit, but we can note that NGC 6229 may share a similar perigalactic distance (4 kpc) with NGC 5694 (van den Bergh, 1995), which has been shown to have an extragalactic origin (Mucciarelli et al., 2013). Palma et al. (2002) suggested that NGC 6229 may share a connection with NGC 7006, Pal 4, and Pyxis; however, the data presented here (see Figures 9–10) and in Kraft et al. (1998) do not provide strong evidence supporting a chemical link between NGC 6229 and NGC 7006. Additional observations of individual stars, along with measurements of cluster orbital parameters, are required to determine if NGC 6229, Pal 4, and/or Pyxis share a common origin.
Even though NGC 6229 exhibits some chemical properties associated with accreted clusters, Figures 9–10 also highlight significant differences. For example, all of the low–Na ([Na/Fe]1Q666[Na/Fe]1Q represents the first quartile of a cluster’s [Na/Fe] distribution. –0.1) clusters have [Fe/H] –1.5, but NGC 6229 is both significantly more massive and resides at a larger galactocentric radius than the other accreted systems (except Pal 14). Figure 9 also indicates that NGC 6229 has a more extended O–Na anti–correlation than other accreted clusters, and is the only low–Na cluster to exhibit both a clear Na–Mg anti–correlation and Na–Si correlation. The more extensive light element variations in NGC 6229 are consistent with its high mass and extended blue HB, and suggest that the cluster experienced pollution from higher temperature (mass?) sources than its lower mass low–Na counterparts.
In this light, the heavy element abundance spread and extensive light element variations of NGC 6229 more closely resemble the composition characteristics of M 54 (e.g., Carretta et al., 2010a), the iron–complex cluster and likely nuclear star cluster of the Sagittarius dwarf spheroidal galaxy, than the lower mass Sagittarius clusters Pal 12 and Terzan 7. As noted by Da Costa (2016), the similar chemical properties shared by M 54 and other iron–complex clusters is a key component of the hypothesis that these systems are former dwarf galaxy nuclei. By extension, we posit that NGC 6229 was not only accreted by the Milky Way, but may have been the nuclear star cluster of a system similar to, but less massive than, the Sagittarius dwarf spheroidal galaxy. However, the low [Na,Al/Fe] abundances of NGC 6229 indicate that the cluster, and by extension any progenitor system, experienced a different enrichment history than Sagittarius.
6. SUMMARY
Using high resolution (R 38,000) and S/N ( 100) spectra obtained with the MMT–Hectochelle multi–fiber spectrograph, we have identified 14 (out of a total sample of 57 targets) bright RGB member stars located near the outer halo globular cluster NGC 6229. We measured a mean cluster heliocentric radial velocity of –138.1 km s-1 and a modest velocity dispersion of 3.8 km s-1. The data suggest that NGC 6229 has a low, but not extreme, mass–to–light ratio of (M/LV)⊙ = 0.82.
For 11/14 member stars, we were able to perform a detailed chemical composition analysis using several elements ranging from oxygen to neodymium. We found that NGC 6229 exhibits the classical light element abundance variations associated with globular clusters, including clear O–Na and Na–Mg anti–correlations and Na–Al and Na–Si correlations. The light element abundance data indicate that the pollution sources within NGC 6229 must have reached temperatures of at least 75 MK, but the paucity of additional correlations involving elements heavier than Si likely sets an upper limit to the burning conditions of 100 MK. The light elements are particularly interesting for NGC 6229 because the first and second generation stars are separated by a gap of 0.5 dex in [O/Fe] and the [Na,Al/Fe] ratios are unusually low.
In general, NGC 6229 appears to be moderately –enhanced with a mean [Ca/Fe] = 0.22 dex ( = 0.08 dex). Additionally, the Fe–peak elements exhibit approximately Solar [X/Fe] ratios with dispersions of 0.05 dex. Similar to other metal–poor clusters, we found copper to be strongly depleted with [Cu/Fe] = –0.48 dex ( = 0.04 dex); however, NGC 6229 may be deficient by 0.2 dex in both [Cu/Fe] and [Ca/Fe] compared to other similar metallicity halo clusters. The neutron–capture elements Zr, La, and Nd were found to be uniformly enhanced by 0.3 dex with small star–to–star dispersions, but 2/11 stars exhibit strongly enhanced [La/Fe] and [Nd/Fe] ratios that are correlated with a small (0.05 dex) increase in [Fe/H]. Although we were not able to measure an r–process indicator such as [Eu/Fe], we strongly suspect that the [La,Nd/Fe] enhancements were due to s–process enrichment.
Previous investigations measured a variety of metallicities ranging from [Fe/H] –1.50 to –1.05 dex, and we found NGC 6229 to be near the higher end of this range with [Fe/H] = –1.13 dex ( = 0.06 dex). Interestingly, NGC 6229 was found to share a variety of peculiar chemical signatures with the similar metallicity iron–complex clusters M 75 and NGC 1851, and also with the intermediate metallicity populations of Cen. In particular, all four systems exhibit: (1) distinct populations of stars with s–process enhancements; (2) similar correlations between [Fe/H] and [La,Nd/Fe]; and (3) unusual correlations between [Na/Fe] and [La,Nd/Fe]. Although the [Fe/H] spread alone is insufficient to identify NGC 6229 as an iron–complex cluster, the chemical signatures listed above combined with the fact that M 75, NGC 1851, and Cen have been identified as iron–complex systems lead us to conclude that NGC 6229 is also an iron–complex cluster. If confirmed with a larger sample, NGC 6229 would be the lowest mass iron–complex cluster known in the Galaxy.
Of the chemical signatures listed above, we found the consistent correlation between [Na/Fe] and [La,Nd/Fe] among several clusters to be particularly interesting. We interpreted this trend within the context of the delayed Type II supernova model discussed in D’Antona et al. (2016) and D’Ercole et al. (2016), and speculated that the predominance of Na–rich stars in the Fe/s–process enhanced populations of clusters such as NGC 6229 may be driven by homogeneous mixing between delayed supernova gas and AGB ejecta. However, differences in star formation efficiency and time, perhaps aided by variations in the cooling properties of first and second generation star gas, and also cluster merger scenarios, remain possible explanations of why the Fe/s–process enhanced populations of some clusters are dominated by second generation stars and others have a mixture of first and second generation stars.
The signature of low [Na/Fe], [Al/Fe], [Ca/Fe], and [Cu/Fe] in NGC 6229 strongly suggests that the cluster has an extragalactic origin, but no clear progenitor galaxy has been identified. Previous work noted a possible association between NGC 6229 and NGC 7006, but the data presented here and in the literature do not support a strong chemical link between the clusters. NGC 6229 has also been linked to Pal 4 and Pyxis, but additional composition analyses of individual stars are required before any clear associations can be made. Although several accreted clusters in the Milky Way have low [Na/Fe], NGC 6229 seems to stand out as having experienced more extensive chemical enrichment and is considerably more massive. In fact, the chemical and physical characteristics of NGC 6229 may be a closer match to M 54 than the lower mass clusters accreted from the Sagittarius dwarf spheroidal galaxy. Therefore, we speculate that NGC 6229 may also be the former core of a system that was similar to, but less massive than, the Sagittarius galaxy. However, the cluster’s low [Na,Al/Fe] abundances indicate that NGC 6229 and any progenitor system would have experienced a different chemical enrichment history than Sagittarius.
Future work may focus on obtaining a deeper understanding of the connection between clusters such as NGC 6229, M 75, and NGC 1851, which share several chemical characteristics but may have very different sub–giant branch (SGB) morphologies. In particular, it would be instructive to know whether NGC 6229 has a clear double SGB similar to NGC 1851. Additionally, it will be especially important to obtain larger spectroscopic samples of stars in NGC 6229, M 75, and other outer halo clusters to confirm whether these systems truly host significant populations of s–process enhanced stars. For NGC 6229, [Eu/Fe] measurements will help confirm that the [La,Nd/Fe] enhancements observed here are driven by the s–process, and a larger sample of [O/Fe] and [Na/Fe] abundances will show whether or not the large gap in the O–Na relation is real. An updated orbital solution for NGC 6229 would also be helpful for investigating further any connections between the cluster and stellar streams, and will also help trace its origin.
References
- Anders & Grevesse (1989) Anders, E., & Grevesse, N. 1989, Geochim. Cosmochim. Acta, 53, 197
- Aoki et al. (2001) Aoki, W., Ryan, S. G., Norris, J. E., et al. 2001, ApJ, 561, 346
- Arellano Ferro et al. (2015) Arellano Ferro, A., Mancera Piña, P. E., Bramich, D. M., et al. 2015, MNRAS, 452, 727
- Bastian et al. (2013) Bastian, N., Lamers, H. J. G. L. M., de Mink, S. E., et al. 2013, MNRAS, 436, 2398
- Bastian et al. (2015) Bastian, N., Cabrera-Ziri, I., & Salaris, M. 2015, MNRAS, 449, 3333
- Bekki & Freeman (2003) Bekki, K., & Freeman, K. C. 2003, MNRAS, 346, L11
- Bellazzini et al. (2008) Bellazzini, M., Ibata, R. A., Chapman, S. C., et al. 2008, AJ, 136, 1147
- Bellazzini et al. (2015) Bellazzini, M., Mucciarelli, A., Sollima, A., et al. 2015, MNRAS, 446, 3130
- Bonifacio et al. (2000) Bonifacio, P., Hill, V., Molaro, P., et al. 2000, A&A, 359, 663
- Borissova et al. (1997) Borissova, J., Catelan, M., Spassova, N., & Sweigart, A. V. 1997, AJ, 113, 692
- Borissova et al. (1999) Borissova, J., Catelan, M., Ferraro, F. R., et al. 1999, A&A, 343, 813
- Borissova et al. (2001) Borissova, J., Catelan, M., & Valchev, T. 2001, MNRAS, 324, 77
- Caldwell et al. (2009) Caldwell, N., Harding, P., Morrison, H., et al. 2009, AJ, 137, 94
- Çalışkan et al. (2012) Çalışkan, Ş., Christlieb, N., & Grebel, E. K. 2012, A&A, 537, A83
- Carballo-Bello et al. (2014) Carballo-Bello, J. A., Sollima, A., Martínez-Delgado, D., et al. 2014, MNRAS, 445, 2971
- Carney et al. (1991) Carney, B. W., Fullton, L. K., & Trammell, S. R. 1991, AJ, 101, 1699
- Carretta et al. (2009a) Carretta, E., Bragaglia, A., Gratton, R., D’Orazi, V., & Lucatello, S. 2009a, A&A, 508, 695
- Carretta et al. (2009b) Carretta, E., Bragaglia, A., Gratton, R. G., et al. 2009b, A&A, 505, 117
- Carretta et al. (2009c) Carretta, E., Bragaglia, A., Gratton, R., & Lucatello, S. 2009c, A&A, 505, 139
- Carretta et al. (2010a) Carretta, E., Bragaglia, A., Gratton, R. G., et al. 2010a, A&A, 520, A95
- Carretta et al. (2010b) Carretta, E., Bragaglia, A., Gratton, R., et al. 2010b, ApJ, 712, L21
- Carretta et al. (2010c) Carretta, E., Gratton, R. G., Lucatello, S., et al. 2010c, ApJ, 722, L1
- Carretta et al. (2011) Carretta, E., Lucatello, S., Gratton, R. G., Bragaglia, A., & D’Orazi, V. 2011, A&A, 533, A69
- Carretta (2013) Carretta, E. 2013, A&A, 557, A128
- Carretta et al. (2014a) Carretta, E., D’Orazi, V., Gratton, R. G., & Lucatello, S. 2014a, A&A, 563, A32
- Carretta et al. (2014b) Carretta, E., Bragaglia, A., Gratton, R. G., et al. 2014b, A&A, 561, A87
- Carretta (2015) Carretta, E. 2015, ApJ, 810, 148
- Carretta et al. (2017) Carretta, E., Bragaglia, A., Lucatello, S., et al. 2017, A&A, 600, A118
- Castelli & Kurucz (2004) Castelli, F., & Kurucz, R. L. 2004, arXiv:astro-ph/0405087
- Catelan et al. (1998) Catelan, M., Borissova, J., Sweigart, A. V., & Spassova, N. 1998, ApJ, 494, 265
- Catelan et al. (2002) Catelan, M., Borissova, J., Ferraro, F. R., et al. 2002, AJ, 124, 364
- Cohen (2004) Cohen, J. G. 2004, AJ, 127, 1545
- Cunha et al. (2002) Cunha, K., Smith, V. V., Suntzeff, N. B., et al. 2002, AJ, 124, 379
- D’Antona et al. (2016) D’Antona, F., Vesperini, E., D’Ercole, A., et al. 2016, MNRAS, 458, 2122
- D’Ercole et al. (2016) D’Ercole, A., D’Antona, F., & Vesperini, E. 2016, MNRAS, 461, 4088
- D’Orazi et al. (2010) D’Orazi, V., Gratton, R., Lucatello, S., et al. 2010, ApJ, 719, L213
- Da Costa (2016) Da Costa, G. S. 2016, The General Assembly of Galaxy Halos: Structure, Origin and Evolution, 317, 110
- Decressin et al. (2007) Decressin, T., Meynet, G., Charbonnel, C., Prantzos, N., & Ekström, S. 2007, A&A, 464, 1029
- de Mink et al. (2009) de Mink, S. E., Pols, O. R., Langer, N., & Izzard, R. G. 2009, A&A, 507, L1
- Den Hartog et al. (2003) Den Hartog, E. A., Lawler, J. E., Sneden, C., & Cowan, J. J. 2003, ApJS, 148, 543
- Denissenkov et al. (2015) Denissenkov, P. A., VandenBerg, D. A., Hartwick, F. D. A., et al. 2015, MNRAS, 448, 3314
- Dinescu et al. (1999) Dinescu, D. I., van Altena, W. F., Girard, T. M., & López, C. E. 1999, AJ, 117, 277
- Dotter et al. (2008) Dotter, A., Chaboyer, B., Jevremović, D., et al. 2008, ApJS, 178, 89-101
- González Hernández & Bonifacio (2009) González Hernández, J. I., & Bonifacio, P. 2009, A&A, 497, 497
- Gavagnin et al. (2016) Gavagnin, E., Mapelli, M., & Lake, G. 2016, MNRAS, 461, 1276
- Gratton et al. (2011) Gratton, R. G., Lucatello, S., Carretta, E., et al. 2011, A&A, 534, A123
- Gratton et al. (2012a) Gratton, R. G., Carretta, E., & Bragaglia, A. 2012a, A&A Rev., 20, 50
- Gratton et al. (2012b) Gratton, R. G., Lucatello, S., Carretta, E., et al. 2012b, A&A, 539, A19
- Gratton et al. (2012c) Gratton, R. G., Villanova, S., Lucatello, S., et al. 2012c, A&A, 544, A12
- Gratton et al. (2015) Gratton, R. G., Lucatello, S., Sollima, A., et al. 2015, A&A, 573, A92
- Grillmair et al. (1995) Grillmair, C. J., Freeman, K. C., Irwin, M., & Quinn, P. J. 1995, AJ, 109, 2553
- Grillmair (2014) Grillmair, C. J. 2014, ApJ, 790, L10
- Harris (1996) Harris, W. E. 1996, AJ, 112, 1487
- Herwig et al. (2012) Herwig, F., VandenBerg, D. A., Navarro, J. F., Ferguson, J., & Paxton, B. 2012, ApJ, 757, 132
- Hinkle et al. (2000) Hinkle, K., Wallace, L., Valenti, J., & Harmer, D. 2000, Visible and Near Infrared Atlas of the Arcturus Spectrum 3727-9300 A ed. Kenneth Hinkle, Lloyd Wallace, Jeff Valenti, and Dianne Harmer. (San Francisco: ASP) ISBN: 1-58381-037-4, 2000
- James et al. (2004) James, G., François, P., Bonifacio, P., et al. 2004, A&A, 427, 825
- Johnson & Pilachowski (2010) Johnson, C. I., & Pilachowski, C. A. 2010, ApJ, 722, 1373
- Johnson et al. (2012) Johnson, C. I., Rich, R. M., Kobayashi, C., & Fulbright, J. P. 2012, ApJ, 749, 175
- Johnson et al. (2014) Johnson, C. I., Rich, R. M., Kobayashi, C., Kunder, A., & Koch, A. 2014, AJ, 148, 67
- Johnson et al. (2015) Johnson, C. I., Rich, R. M., Pilachowski, C. A., et al. 2015, AJ, 150, 63
- Johnson et al. (2017a) Johnson, C. I., Caldwell, N., Rich, R. M., et al. 2017a, ApJ, 836, 168
- Johnson et al. (2017b) Johnson, C. I., Caldwell, N., Rich, R. M., et al. 2017b, ApJ, 842, 24
- Kacharov et al. (2013) Kacharov, N., Koch, A., & McWilliam, A. 2013, A&A, 554, A81
- Kraft et al. (1998) Kraft, R. P., Sneden, C., Smith, G. H., Shetrone, M. D., & Fulbright, J. 1998, AJ, 115, 1500
- Kurtz & Mink (1998) Kurtz, M. J., & Mink, D. J. 1998, PASP, 110, 934
- Kuzma et al. (2016) Kuzma, P. B., Da Costa, G. S., Mackey, A. D., & Roderick, T. A. 2016, MNRAS, 461, 3639
- Langer et al. (1997) Langer, G. E., Hoffman, R. E., & Zaidins, C. S. 1997, PASP, 109, 244
- Lawler et al. (2001) Lawler, J. E., Bonvallet, G., & Sneden, C. 2001, ApJ, 556, 452
- Majewski et al. (2015) Majewski, S. R., Schiavon, R. P., Frinchaboy, P. M., et al. 2015, arXiv:1509.05420
- Marino et al. (2008) Marino, A. F., Villanova, S., Piotto, G., et al. 2008, A&A, 490, 625
- Marino et al. (2009) Marino, A. F., Milone, A. P., Piotto, G., et al. 2009, A&A, 505, 1099
- Marino et al. (2011a) Marino, A. F., Milone, A. P., Piotto, G., et al. 2011a, ApJ, 731, 64
- Marino et al. (2011b) Marino, A. F., Sneden, C., Kraft, R. P., et al. 2011b, A&A, 532, A8
- Marino et al. (2011c) Marino, A. F., Villanova, S., Milone, A. P., et al. 2011c, ApJ, 730, L16
- Marino et al. (2014) Marino, A. F., Milone, A. P., Yong, D., et al. 2014, MNRAS, 442, 3044
- Marino et al. (2015) Marino, A. F., Milone, A. P., Karakas, A. I., et al. 2015, MNRAS, 450, 815
- McLaughlin & van der Marel (2005) McLaughlin, D. E., & van der Marel, R. P. 2005, ApJS, 161, 304
- McWilliam et al. (2013) McWilliam, A., Wallerstein, G., & Mottini, M. 2013, ApJ, 778, 149
- Milone et al. (2015) Milone, A. P., Marino, A. F., Piotto, G., et al. 2015, ApJ, 808, 51
- Milone et al. (2017) Milone, A. P., Piotto, G., Renzini, A., et al. 2017, MNRAS, 464, 3636
- Mucciarelli et al. (2013) Mucciarelli, A., Bellazzini, M., Catelan, M., et al. 2013, MNRAS, 435, 3667
- Mucciarelli et al. (2015) Mucciarelli, A., Lapenna, E., Massari, D., Ferraro, F. R., & Lanzoni, B. 2015, ApJ, 801, 69
- Muñoz et al. (2013) Muñoz, C., Geisler, D., & Villanova, S. 2013, MNRAS, 433, 2006
- Ness et al. (2015) Ness, M., Hogg, D. W., Rix, H.-W., Ho, A. Y. Q., & Zasowski, G. 2015, ApJ, 808, 16
- Nissen & Schuster (2011) Nissen, P. E., & Schuster, W. J. 2011, A&A, 530, A15
- Olszewski et al. (2009) Olszewski, E. W., Saha, A., Knezek, P., et al. 2009, AJ, 138, 1570
- Palma et al. (2002) Palma, C., Majewski, S. R., & Johnston, K. V. 2002, ApJ, 564, 736
- Pancino et al. (2002) Pancino, E., Pasquini, L., Hill, V., Ferraro, F. R., & Bellazzini, M. 2002, ApJ, 568, L101
- Pancino et al. (2011) Pancino, E., Mucciarelli, A., Bonifacio, P., Monaco, L., & Sbordone, L. 2011, A&A, 534, A53
- Pilachowski et al. (1983) Pilachowski, C. A., Bothun, G. D., Olszewski, E. W., & Odell, A. 1983, ApJ, 273, 187
- Piotto et al. (2015) Piotto, G., Milone, A. P., Bedin, L. R., et al. 2015, AJ, 149, 91
- Prantzos et al. (2007) Prantzos, N., Charbonnel, C., & Iliadis, C. 2007, A&A, 470, 179
- Renzini et al. (2015) Renzini, A., D’Antona, F., Cassisi, S., et al. 2015, MNRAS, 454, 4197
- Roederer (2011) Roederer, I. U. 2011, ApJ, 732, L17
- Roederer et al. (2016) Roederer, I. U., Mateo, M., Bailey, J. I., et al. 2016, MNRAS, 455, 2417
- Sanna et al. (2012) Sanna, N., Dalessandro, E., Lanzoni, B., et al. 2012, MNRAS, 422, 1171
- Sbordone et al. (2007) Sbordone, L., Bonifacio, P., Buonanno, R., et al. 2007, A&A, 465, 815
- Simmerer et al. (2003) Simmerer, J., Sneden, C., Ivans, I. I., et al. 2003, AJ, 125, 2018
- Simmerer et al. (2013) Simmerer, J., Ivans, I. I., Filler, D., et al. 2013, ApJ, 764, L7
- Simpson et al. (2017) Simpson, J. D., Martell, S. L., & Navin, C. A. 2017, MNRAS, 465, 1123
- Skrutskie et al. (2006) Skrutskie, M. F., Cutri, R. M., Stiening, R., et al. 2006, AJ, 131, 1163
- Sneden (1973) Sneden, C. 1973, ApJ, 184, 839
- Sneden et al. (2014) Sneden, C., Lucatello, S., Ram, R. S., Brooke, J. S. A., & Bernath, P. 2014, ApJS, 214, 26
- Strader et al. (2009) Strader, J., Smith, G. H., Larsen, S., Brodie, J. P., & Huchra, J. P. 2009, AJ, 138, 547
- Strader et al. (2011) Strader, J., Caldwell, N., & Seth, A. C. 2011, AJ, 142, 8
- Szentgyorgyi et al. (2011) Szentgyorgyi, A., Furesz, G., Cheimets, P., et al. 2011, PASP, 123, 1188
- Tailo et al. (2016) Tailo, M., Di Criscienzo, M., D’Antona, F., Caloi, V., & Ventura, P. 2016, MNRAS, 457, 4525
- van den Bergh (1995) van den Bergh, S. 1995, AJ, 110, 1171
- Ventura et al. (2011) Ventura, P., Carini, R., & D’Antona, F. 2011, MNRAS, 415, 3865
- Ventura et al. (2013) Ventura, P., Di Criscienzo, M., Carini, R., & D’Antona, F. 2013, MNRAS, 431, 3642
- Villanova et al. (2012) Villanova, S., Geisler, D., Piotto, G., & Gratton, R. G. 2012, ApJ, 748, 62
- Villanova et al. (2013) Villanova, S., Geisler, D., Carraro, G., Moni Bidin, C., & Muñoz, C. 2013, ApJ, 778, 186
- Wachter et al. (1998) Wachter, S., Wallerstein, G., Brown, J. A., & Oke, J. B. 1998, PASP, 110, 821
- Walker et al. (2009) Walker, M. G., Belokurov, V., Evans, N. W., et al. 2009, ApJ, 694, L144
- Yong et al. (2005) Yong, D., Grundahl, F., Nissen, P. E., Jensen, H. R., & Lambert, D. L. 2005, A&A, 438, 875
- Yong & Grundahl (2008) Yong, D., & Grundahl, F. 2008, ApJ, 672, L29
- Yong et al. (2009) Yong, D., Grundahl, F., D’Antona, F., et al. 2009, ApJ, 695, L62
- Yong et al. (2014) Yong, D., Roederer, I. U., Grundahl, F., et al. 2014, MNRAS, 441, 3396
- Zinn (1980) Zinn, R. 1980, ApJS, 42, 19
| Star Name | RA | DEC | J | H | KS | RVhelio. | RVhelio. Error |
|---|---|---|---|---|---|---|---|
| (2MASS) | (degrees) | (degrees) | (mag.) | (mag.) | (mag.) | (km s-1) | (km s-1) |
| Cluster Members | |||||||
| 16464310+4731033 | 251.679603 | 47.517605 | 13.870 | 13.142 | 13.027 | 139.6 | 0.4 |
| 16465095+4731163 | 251.712295 | 47.521198 | 12.482 | 11.659 | 11.492 | 136.4 | 0.6 |
| 16465319+4732413 | 251.721631 | 47.544823 | 12.462 | 11.650 | 11.520 | 140.1 | 0.5 |
| 16465362+4730222 | 251.723456 | 47.506184 | 13.383 | 12.649 | 12.493 | 135.1 | 0.3 |
| 16465422+4733371 | 251.725949 | 47.560307 | 12.315 | 11.463 | 11.283 | 145.6 | 0.6 |
| 16465515+4731485 | 251.729808 | 47.530163 | 12.761 | 12.022 | 11.867 | 134.8 | 0.6 |
| 16465763+4732296 | 251.740135 | 47.541565 | 13.763 | 13.147 | 13.015 | 138.9 | 0.2 |
| 16470094+4731065 | 251.753932 | 47.518482 | 14.315 | 13.592 | 13.540 | 132.2 | 0.5 |
| 16470210+4733163 | 251.758753 | 47.554543 | 13.869 | 13.153 | 13.106 | 138.5 | 0.4 |
| 16471104+4728244 | 251.796019 | 47.473461 | 13.203 | 12.499 | 12.312 | 140.4 | 0.9 |
| 16471308+4732430 | 251.804508 | 47.545284 | 13.749 | 13.114 | 12.998 | 144.0 | 0.3 |
| 16472079+4731478 | 251.836647 | 47.529964 | 14.158 | 13.497 | 13.332 | 136.0 | 0.4 |
| 16470403+4731201 | 251.766795 | 47.522274 | 14.852 | 14.193 | 14.158 | 140.0 | 0.4 |
| 16470289+4732471 | 251.762075 | 47.546425 | 14.099 | 13.485 | 13.446 | 136.0 | 0.3 |
| NonMembers | |||||||
| 16460104+4747575 | 251.504343 | 47.799309 | 14.189 | 13.566 | 13.533 | 15.0 | 0.6 |
| 16463345+4741560 | 251.639382 | 47.698902 | 14.055 | 13.428 | 13.287 | 25.1 | 0.4 |
| 16461569+4743371 | 251.565412 | 47.726974 | 14.530 | 13.901 | 13.758 | 26.3 | 0.4 |
| 16470381+4746477 | 251.765914 | 47.779942 | 13.512 | 12.878 | 12.728 | 90.2 | 0.6 |
| 16463660+4745098 | 251.652502 | 47.752739 | 14.763 | 14.113 | 14.015 | 54.3 | 0.6 |
| 16461166+4745117 | 251.548617 | 47.753258 | 14.585 | 13.914 | 13.815 | 14.1 | 0.9 |
| 16461965+4744207 | 251.581876 | 47.739101 | 14.125 | 13.514 | 13.458 | 36.5 | 0.7 |
| 16465487+4727249 | 251.728632 | 47.456921 | 12.325 | 11.669 | 11.480 | 5.1 | 0.2 |
| 16465059+4725208 | 251.710830 | 47.422451 | 14.486 | 13.927 | 13.790 | 96.8 | 0.5 |
| 16472581+4732161 | 251.857562 | 47.537819 | 13.905 | 13.558 | 13.560 | 6.4 | 0.3 |
| 16471626+4733136 | 251.817755 | 47.553802 | 14.502 | 13.921 | 13.911 | 3.7 | 0.3 |
| 16464036+4735195 | 251.668207 | 47.588772 | 14.602 | 13.932 | 13.800 | 30.0 | 0.5 |
| 16464167+4730049 | 251.673662 | 47.501385 | 13.585 | 13.305 | 13.146 | 7.9 | 0.3 |
| 16465290+4728328 | 251.720420 | 47.475780 | 13.767 | 13.215 | 13.061 | 30.3 | 0.5 |
| 16465601+4730407 | 251.733386 | 47.511307 | 14.452 | 13.752 | 13.663 | 11.3 | 0.5 |
| 16473405+4744203 | 251.891907 | 47.738995 | 13.494 | 12.895 | 12.699 | 25.0 | 0.3 |
| 16472302+4737244 | 251.845944 | 47.623466 | 14.331 | 13.843 | 13.704 | 5.1 | 0.2 |
| 16470431+4734268 | 251.767967 | 47.574135 | 14.378 | 13.984 | 13.890 | 58.5 | 0.4 |
| 16470931+4736507 | 251.788805 | 47.614105 | 14.420 | 13.782 | 13.665 | 43.2 | 0.4 |
| 16471359+4734059 | 251.806635 | 47.568306 | 14.568 | 14.029 | 13.816 | 0.4 | 0.6 |
| 16471388+4735472 | 251.807857 | 47.596451 | 13.086 | 12.618 | 12.542 | 38.1 | 0.2 |
| 16470843+4744032 | 251.785164 | 47.734230 | 14.818 | 14.269 | 14.140 | 78.3 | 33.3 |
| 16484573+4736346 | 252.190551 | 47.609638 | 14.787 | 14.169 | 14.062 | 6.4 | 0.7 |
| 16482177+4717330 | 252.090731 | 47.292526 | 14.653 | 14.005 | 13.890 | 99.4 | 0.3 |
| 16482482+4718547 | 252.103440 | 47.315212 | 14.309 | 13.715 | 13.645 | 28.6 | 0.3 |
| 16473751+4733136 | 251.906305 | 47.553795 | 13.056 | 12.394 | 12.211 | 16.6 | 0.2 |
| 16481312+4731205 | 252.054702 | 47.522373 | 13.987 | 13.412 | 13.294 | 0.9 | 0.3 |
| 16471253+4720264 | 251.802221 | 47.340672 | 14.474 | 14.037 | 13.817 | 54.9 | 2.2 |
| 16470246+4726234 | 251.760290 | 47.439854 | 13.711 | 13.083 | 12.885 | 13.2 | 0.6 |
| 16473678+4723058 | 251.903258 | 47.384945 | 14.843 | 14.527 | 14.133 | 35.8 | 0.4 |
| 16472007+4729363 | 251.833642 | 47.493423 | 12.532 | 11.970 | 11.858 | 162.7 | 0.2 |
| 16480524+4728377 | 252.021860 | 47.477150 | 14.485 | 13.899 | 13.846 | 20.1 | 0.7 |
| 16464816+4750080 | 251.700676 | 47.835579 | 13.309 | 12.702 | 12.494 | 6.5 | 0.7 |
| 16453637+4743149 | 251.401557 | 47.720821 | 14.597 | 14.072 | 13.854 | 14.2 | 0.5 |
| 16455361+4744279 | 251.473399 | 47.741108 | 14.893 | 14.324 | 14.143 | 40.2 | 2.0 |
| 16461661+4723453 | 251.569209 | 47.395924 | 14.464 | 13.849 | 13.715 | 19.2 | 0.4 |
| 16461515+4730523 | 251.563131 | 47.514542 | 14.593 | 14.060 | 13.981 | 21.9 | 0.6 |
| 16452323+4733276 | 251.346830 | 47.557678 | 13.025 | 12.364 | 12.212 | 2.1 | 0.3 |
| 16454657+4737036 | 251.444072 | 47.617680 | 14.433 | 13.785 | 13.807 | 11.4 | 0.7 |
| 16451881+4734262 | 251.328400 | 47.573971 | 14.547 | 13.928 | 13.840 | 56.3 | 0.6 |
| 16463089+4712585 | 251.628720 | 47.216267 | 13.917 | 13.328 | 13.178 | 57.7 | 0.4 |
| 16460964+4720273 | 251.540195 | 47.340931 | 13.574 | 12.910 | 12.685 | 49.1 | 0.9 |
| 16453643+4723148 | 251.401798 | 47.387466 | 14.566 | 13.918 | 13.815 | 68.5 | 0.3 |
| Star Name | Teff | log(g) | [Fe/H] | [Fe/H] | mic. |
|---|---|---|---|---|---|
| (2MASS) | (K) | (cgs) | (dex) | (dex) | (km s-1) |
| 16464310+4731033 | 4325 | 1.35 | 1.08 | 0.04 | 1.70 |
| 16465095+4731163 | 4000 | 0.85 | 1.11 | 0.04 | 2.00 |
| 16465319+4732413 | 4000 | 0.85 | 1.21 | 0.04 | 2.05 |
| 16465362+4730222 | 4200 | 1.15 | 1.13 | 0.04 | 1.75 |
| 16465422+4733371 | 3925 | 0.70 | 1.04 | 0.04 | 2.00 |
| 16465515+4731485 | 4025 | 0.90 | 1.05 | 0.04 | 1.65 |
| 16465763+4732296 | 4250 | 1.25 | 1.23 | 0.04 | 1.60 |
| 16470094+4731065 | 4450 | 1.60 | 1.11 | 0.05 | 1.40 |
| 16470210+4733163 | 4325 | 1.35 | 1.19 | 0.04 | 1.80 |
| 16471104+4728244 | 4225 | 1.20 | 1.14 | 0.04 | 2.20 |
| 16471308+4732430 | 4350 | 1.40 | 1.13 | 0.04 | 1.70 |
| 16472079+4731478 | |||||
| 16470403+4731201 | |||||
| 16470289+4732471 |
| Wavelength | Species | E.P. | log(gf) | log (X)⊙ | log (X)Arcturus |
|---|---|---|---|---|---|
| (Å) | (eV) | (dex) | (dex) | ||
| 6300.30 | [O I] | 0.00 | 9.750 | 8.69 | 8.63 |
| 6160.75 | Na I | 2.10 | 1.210 | 6.33 | 5.89 |
| 6318.72 | Mg I | 5.11 | 2.010 | 7.58 | 7.38 |
| 6696.02 | Al I | 3.14 | 1.520 | 6.47 | 6.28 |
| 6698.67 | Al I | 3.14 | 1.910 | 6.47 | 6.28 |
| 5753.62 | Si I | 5.62 | 1.104 | 7.55 | 7.38 |
| 5793.07 | Si I | 4.93 | 1.974 | 7.55 | 7.38 |
| 6155.13 | Si I | 5.62 | 0.764 | 7.55 | 7.38 |
| 6237.32 | Si I | 5.61 | 1.075 | 7.55 | 7.38 |
| 6721.85 | Si I | 5.86 | 0.956 | 7.55 | 7.38 |
| 5867.56 | Ca I | 2.93 | 1.740 | 6.36 | 6.07 |
| 5783.06 | Cr I | 3.32 | 0.490 | 5.67 | 5.09 |
| 5787.92 | Cr I | 3.32 | 0.183 | 5.67 | 5.09 |
| 5790.65 | Cr I | 1.00 | 4.053 | 5.67 | 5.09 |
| 5844.60 | Cr I | 3.01 | 1.660 | 5.67 | 5.09 |
| 5731.76 | Fe I | 4.26 | 1.185 | 7.52 | 7.02 |
| 5732.30 | Fe I | 4.99 | 1.429 | 7.52 | 7.02 |
| 5734.56 | Fe I | 4.96 | 1.744 | 7.52 | 7.02 |
| 5752.03 | Fe I | 4.55 | 1.083 | 7.52 | 7.02 |
| 5753.12 | Fe I | 4.26 | 0.899 | 7.52 | 7.02 |
| 5759.54 | Fe I | 4.30 | 2.169 | 7.52 | 7.02 |
| 5760.34 | Fe I | 3.64 | 2.514 | 7.52 | 7.02 |
| 5775.08 | Fe I | 4.22 | 1.229 | 7.52 | 7.02 |
| 5778.45 | Fe I | 2.59 | 3.582 | 7.52 | 7.02 |
| 5793.91 | Fe I | 4.22 | 1.733 | 7.52 | 7.02 |
| 5806.72 | Fe I | 4.61 | 0.946 | 7.52 | 7.02 |
| 5807.78 | Fe I | 3.29 | 3.417 | 7.52 | 7.02 |
| 5809.22 | Fe I | 3.88 | 1.622 | 7.52 | 7.02 |
| 5811.91 | Fe I | 4.14 | 2.465 | 7.52 | 7.02 |
| 5814.81 | Fe I | 4.28 | 1.904 | 7.52 | 7.02 |
| 5827.88 | Fe I | 3.28 | 3.259 | 7.52 | 7.02 |
| 5835.10 | Fe I | 4.26 | 2.152 | 7.52 | 7.02 |
| 5837.70 | Fe I | 4.29 | 2.327 | 7.52 | 7.02 |
| 5849.68 | Fe I | 3.69 | 3.046 | 7.52 | 7.02 |
| 5855.08 | Fe I | 4.61 | 1.611 | 7.52 | 7.02 |
| 5859.59 | Fe I | 4.55 | 0.663 | 7.52 | 7.02 |
| 5862.36 | Fe I | 4.55 | 0.457 | 7.52 | 7.02 |
| 5881.75 | Fe I | 2.18 | 5.177 | 7.52 | 7.02 |
| 5883.82 | Fe I | 3.96 | 1.369 | 7.52 | 7.02 |
| 6159.37 | Fe I | 4.61 | 1.866 | 7.52 | 7.02 |
| 6180.20 | Fe I | 2.73 | 2.638 | 7.52 | 7.02 |
| 6187.99 | Fe I | 3.94 | 1.736 | 7.52 | 7.02 |
| 6200.31 | Fe I | 2.61 | 2.391 | 7.52 | 7.02 |
| 6213.43 | Fe I | 2.22 | 2.544 | 7.52 | 7.02 |
| 6221.67 | Fe I | 0.86 | 6.482 | 7.52 | 7.02 |
| 6226.73 | Fe I | 3.88 | 2.199 | 7.52 | 7.02 |
| 6229.23 | Fe I | 2.85 | 2.935 | 7.52 | 7.02 |
| 6232.64 | Fe I | 3.65 | 1.250 | 7.52 | 7.02 |
| 6246.32 | Fe I | 3.60 | 0.945 | 7.52 | 7.02 |
| 6270.22 | Fe I | 2.86 | 2.674 | 7.52 | 7.02 |
| 6271.28 | Fe I | 3.33 | 2.822 | 7.52 | 7.02 |
| 6290.54 | Fe I | 2.59 | 4.353 | 7.52 | 7.02 |
| 6290.97 | Fe I | 4.73 | 0.562 | 7.52 | 7.02 |
| 6315.81 | Fe I | 4.08 | 1.709 | 7.52 | 7.02 |
| 6710.32 | Fe I | 1.49 | 4.877 | 7.52 | 7.02 |
| 6726.67 | Fe I | 4.61 | 1.177 | 7.52 | 7.02 |
| 6733.15 | Fe I | 4.64 | 1.549 | 7.52 | 7.02 |
| 6739.52 | Fe I | 1.56 | 5.030 | 7.52 | 7.02 |
| 6806.84 | Fe I | 2.73 | 3.162 | 7.52 | 7.02 |
| 6810.26 | Fe I | 4.61 | 1.089 | 7.52 | 7.02 |
| 6828.59 | Fe I | 4.64 | 0.944 | 7.52 | 7.02 |
| 6839.83 | Fe I | 2.56 | 3.364 | 7.52 | 7.02 |
| 6841.34 | Fe I | 4.61 | 0.810 | 7.52 | 7.02 |
| 6842.69 | Fe I | 4.64 | 1.249 | 7.52 | 7.02 |
| 6843.65 | Fe I | 4.55 | 0.942 | 7.52 | 7.02 |
| 6857.25 | Fe I | 4.08 | 2.228 | 7.52 | 7.02 |
| 6858.15 | Fe I | 4.61 | 1.098 | 7.52 | 7.02 |
| 6861.94 | Fe I | 2.42 | 3.900 | 7.52 | 7.02 |
| 6862.48 | Fe I | 4.56 | 1.528 | 7.52 | 7.02 |
| 5760.83 | Ni I | 4.11 | 0.760 | 6.25 | 5.81 |
| 5805.21 | Ni I | 4.17 | 0.720 | 6.25 | 5.81 |
| 5846.99 | Ni I | 1.68 | 3.240 | 6.25 | 5.81 |
| 6175.36 | Ni I | 4.09 | 0.609 | 6.25 | 5.81 |
| 6176.81 | Ni I | 4.09 | 0.260 | 6.25 | 5.81 |
| 6177.24 | Ni I | 1.83 | 3.550 | 6.25 | 5.81 |
| 6186.71 | Ni I | 4.11 | 0.890 | 6.25 | 5.81 |
| 6223.98 | Ni I | 4.11 | 0.970 | 6.25 | 5.81 |
| 6767.77 | Ni I | 1.83 | 2.100 | 6.25 | 5.81 |
| 6772.31 | Ni I | 3.66 | 0.990 | 6.25 | 5.81 |
| 5782.11 | Cu I | 1.64 | hfs | 4.04 | 3.71 |
| 5879.78 | Zr I | 0.15 | 1.350 | 2.58 | 2.08 |
| 5885.62 | Zr I | 0.07 | 2.030 | 2.58 | 2.08 |
| 5805.77 | La II | 0.13 | hfs | 1.13 | 0.57 |
| 6262.29 | La II | 0.40 | hfs | 1.13 | 0.57 |
| 5740.86 | Nd II | 1.16 | 0.330 | 1.42 | 0.97 |
| 5811.57 | Nd II | 0.86 | 0.800 | 1.42 | 0.97 |
| 5842.37 | Nd II | 1.28 | 0.401 | 1.42 | 0.97 |
| 5882.79 | Nd II | 0.56 | 1.415 | 1.42 | 0.97 |
| Star Name | [O/Fe] | [O/Fe] | [Na/Fe] | [Na/Fe] | [Mg/Fe] | [Mg/Fe] | [Al/Fe] | [Al/Fe] | [Si/Fe] | [Si/Fe] | [Ca/Fe] | [Ca/Fe] |
|---|---|---|---|---|---|---|---|---|---|---|---|---|
| (2MASS) | (dex) | (dex) | (dex) | (dex) | (dex) | (dex) | (dex) | (dex) | (dex) | (dex) | (dex) | (dex) |
| 16464310+4731033 | 0.13 | 0.07 | 0.25 | 0.11 | 0.39 | 0.10 | 0.27 | 0.08 | 0.19 | 0.12 | ||
| 16465095+4731163 | 0.63 | 0.07 | 0.46 | 0.11 | 0.25 | 0.06 | 0.45 | 0.10 | 0.21 | 0.08 | 0.22 | 0.12 |
| 16465319+4732413 | 0.64 | 0.07 | 0.58 | 0.11 | 0.24 | 0.06 | 0.12 | 0.10 | 0.25 | 0.09 | 0.19 | 0.12 |
| 16465362+4730222 | 0.50 | 0.07 | 0.50 | 0.11 | 0.20 | 0.06 | 0.20 | 0.14 | 0.26 | 0.12 | ||
| 16465422+4733371 | 0.11 | 0.07 | 0.08 | 0.11 | 0.35 | 0.10 | 0.38 | 0.10 | 0.21 | 0.12 | ||
| 16465515+4731485 | 0.04 | 0.07 | 0.03 | 0.11 | 0.09 | 0.06 | 0.24 | 0.10 | 0.29 | 0.12 | 0.18 | 0.12 |
| 16465763+4732296 | 0.71 | 0.07 | 0.33 | 0.11 | 0.34 | 0.06 | 0.29 | 0.08 | 0.34 | 0.12 | ||
| 16470094+4731065 | 0.56 | 0.07 | 0.15 | 0.11 | 0.15 | 0.06 | 0.18 | 0.09 | 0.18 | 0.12 | ||
| 16470210+4733163 | 0.59 | 0.07 | 0.30 | 0.11 | 0.18 | 0.09 | 0.33 | 0.12 | ||||
| 16471104+4728244 | 0.52 | 0.07 | 0.13 | 0.11 | 0.05 | 0.06 | 0.27 | 0.12 | 0.06 | 0.12 | ||
| 16471308+4732430 | 0.68 | 0.07 | 0.34 | 0.11 | 0.17 | 0.06 | 0.20 | 0.09 | 0.19 | 0.12 | ||
| 16472079+4731478 | ||||||||||||
| 16470403+4731201 | ||||||||||||
| 16470289+4732471 |
| Star Name | [Cr/Fe] | [Cr/Fe] | [Ni/Fe] | [Ni/Fe] | [Cu/Fe] | [Cu/Fe] | [Zr/Fe] | [Zr/Fe] | [La/Fe] | [La/Fe] | [Nd/Fe] | [Nd/Fe] |
|---|---|---|---|---|---|---|---|---|---|---|---|---|
| (2MASS) | (dex) | (dex) | (dex) | (dex) | (dex) | (dex) | (dex) | (dex) | (dex) | (dex) | (dex) | (dex) |
| 16464310+4731033 | 0.08 | 0.14 | 0.13 | 0.04 | 0.46 | 0.09 | 0.32 | 0.13 | 0.99 | 0.08 | 0.72 | 0.08 |
| 16465095+4731163 | 0.01 | 0.14 | 0.06 | 0.03 | 0.49 | 0.09 | 0.36 | 0.12 | 0.22 | 0.06 | 0.33 | 0.08 |
| 16465319+4732413 | 0.02 | 0.13 | 0.08 | 0.04 | 0.52 | 0.09 | 0.28 | 0.15 | 0.30 | 0.06 | 0.45 | 0.06 |
| 16465362+4730222 | 0.09 | 0.14 | 0.09 | 0.04 | 0.39 | 0.09 | 0.25 | 0.12 | 0.22 | 0.06 | 0.20 | 0.06 |
| 16465422+4733371 | 0.06 | 0.13 | 0.19 | 0.05 | 0.48 | 0.09 | 0.87 | 0.15 | 0.85 | 0.06 | 0.86 | 0.06 |
| 16465515+4731485 | 0.13 | 0.14 | 0.05 | 0.04 | 0.45 | 0.09 | 0.21 | 0.15 | 0.25 | 0.06 | 0.26 | 0.05 |
| 16465763+4732296 | 0.01 | 0.14 | 0.06 | 0.04 | 0.49 | 0.09 | 0.40 | 0.16 | 0.48 | 0.06 | 0.39 | 0.09 |
| 16470094+4731065 | 0.01 | 0.13 | 0.10 | 0.06 | 0.53 | 0.09 | 0.23 | 0.05 | 0.32 | 0.14 | ||
| 16470210+4733163 | 0.05 | 0.12 | 0.09 | 0.03 | 0.46 | 0.09 | 0.27 | 0.13 | 0.36 | 0.05 | 0.42 | 0.07 |
| 16471104+4728244 | 0.10 | 0.14 | 0.12 | 0.05 | 0.52 | 0.09 | 0.43 | 0.17 | 0.26 | 0.05 | 0.36 | 0.09 |
| 16471308+4732430 | 0.13 | 0.13 | 0.19 | 0.04 | 0.52 | 0.09 | 0.49 | 0.06 | 0.38 | 0.06 | ||
| 16472079+4731478 | ||||||||||||
| 16470403+4731201 | ||||||||||||
| 16470289+4732471 |