Wing structure in the phase diagram of the Ising Ferromagnet URhGe close to its tricritical point investigated by angle-resolved magnetization measurements
Abstract
High-precision angle-resolved dc magnetization and magnetic torque studies were performed on a single-crystalline sample of URhGe, an orthorhombic Ising ferromagnet with the axis being the magnetization easy axis, in order to investigate the phase diagram around the ferromagnetic (FM) reorientation transition in a magnetic field near the axis. We have clearly detected first-order transition in both the magnetization and the magnetic torque at low temperatures, and determined detailed profiles of the wing structure of the three-dimensional -- phase diagram, where and denotes the field components along the and the axes, respectively. The quantum wing critical points are located at 1.1 T and 13.5 T. Two second-order transition lines at the boundaries of the wing planes rapidly tend to approach with each other with increasing temperature up to K. Just at the zero conjugate field (), however, a signature of the first-order transition can still be seen in the field derivative of the magnetization at K, indicating that the tricritical point exists in a rather high temperature region above 4 K. This feature of the wing plane structure is consistent with the theoretical expectation that three second-order transition lines merge tangentially at the triciritical point.
pacs:
Valid PACS appear hereI Introduction
The discoveries of uranium-based ferromagnetic (FM) superconductors, as represented by UGe2 Saxena et al. (2000), URhGe Aoki et al. (2001), and UCoGe Huy et al. (2007), have had a great impact, because superconductivity and ferromagnetism had been thought to compete with each other. The superconducting properties in the above three uranium-based superconductors are extremely unusual, such as the microscopic coexistence of superconductivity and ferromagnetism Hattori et al. (2012); Ohta et al. (2010); de Visser et al. (2009); Kotegawa et al. (2005), possible occurrence of an odd-parity pairing Saxena et al. (2000); Aoki et al. (2001); Huy et al. (2007), the huge enhancement of exceeding the Pauli-limiting field in UCoGe Huy et al. (2007); Aoki et al. (2009), and re-entrant superconductivity (RSC) in URhGe Lévy et al. (2009). These anomalous behavior are observed around FM quantum phase transition, and hence magnetic quantum fluctuations are considered to be responsible for the emergence of such unusual superconducting states Tokunaga et al. (2015); Hattori et al. (2012); Taufour et al. (2011).
We focus in this paper on the magnetic behavior of URhGe, which crystallizes in the orthorhombic TiNiSi structure with the space group having a zig-zag chain of uranium atoms along the axis Tran et al. (1998). URhGe is known to be an itinerant ferromagnet in which a magnetic moment of /U aligns along the axis below K Lévy et al. (2005); Hardy et al. (2011). Magnetic anisotropy is very strong in URhGe, with the axis being the magnetization easy axis. Owing to its strong anisotropy, of this compound can be tuned to zero by applying a magnetic field along the axis, perpendicular to the spontaneous moment Hardy et al. (2011). The situation is analogous to an Ising ferromagnet in a transverse magnetic field Pfeuty (1970), for which a quantum phase transition (QPT) accompanying a reorientation of the magnetic moment into a state with can be expected at a finite critical field . Previous studies by transport ( K), magnetic torque ( K) and magnetization ( K) measurements indicate that the transition occurs at T in URhGe for and becomes first order at low temperature Lévy et al. (2009, 2005); Hardy et al. (2011); Aoki and Flouquet (2014). Because the critical field is very close to the field in which the RSC emerges, it has been argued that the magnetic fluctuations associated with the moment reorientation play an essential role of RSC Lévy et al. (2005, 2009); Tokunaga et al. (2015).
Recently, a FM QPT in clean metals has attracted much interest because a first-order QPT is commonly observed Brando et al. (2016). If is decreased by some tuning parameter such as pressure, the nature of the transition changes from second order to first order at a tricritical point TCP, and by application of a small field parallel to the spontaneous moment surfaces or “wings” of first-order transition emerge Belitz et al. (1999, 2005). The edges of the wing planes are second-order transition lines, terminating at in quantum wing critical points (QWCPs) Kirkpatrick and Belitz (2015). This type of “-- phase diagram” with pressure as a tuning parameter has been studied in itinerant FM compounds, such as UGe2 Taufour et al. (2010); Pfleiderer and Huxley (2002); Kotegawa et al. (2011), ZrZn2 Uhlarz et al. (2004), URhAl Shimizu et al. (2015), UCoGa Míšek et al. (2017), and an itinerant metamagnet UCoAl Aoki et al. (2011). In these systems, however, either high pressure (UGe2, ZrZn2, URhAl, UCoGa) or negative pressure (UCoAl) is required to tune to zero, making it difficult to examine the magnetization behavior near QPT. In contrast, as a magnetic field parallel to the axis being the tuning parameter, URhGe provides a good opportunity to investigate the whole FM phase diagram by various means. Indeed, when a magnetic field is slightly tilted from the axis towards axis, the FM wing structure has been observed below TCP in the “-- phase diagram” in URhGe Lévy et al. (2007, 2009), where denotes the -axis component of the magnetic field, conjugate to the order parameter (OP). The location of TCP has been reported to be 2 K and K by thermoelectric power Gourgout et al. (2016) and nuclear magnetic resonance (NMR) Kotegawa et al. (2015) experiments, respectively. Remarkably, the zero resistivity region of the RSC at 50 mK exactly overlaps the wing QPT region in the - plane Lévy et al. (2007, 2009), further evidencing the close connection between RSC and the FM QPT.
It should be noticed that the RSC apparently emerges around the first-order FM transition region. A possible explanation of this unusual behavior is that URhGe might be close to a quantum TCP Lévy et al. (2007). There has been, however, a controversy regarding the location of TCP in URhGe Gourgout et al. (2016); Kotegawa et al. (2015). Further investigation is thus needed to clarify the FM QPT in URhGe. Up to present, no direct magnetization measurement has been performed in URhGe in the QPT region; field variation of the magnetization in a limit has been obtained by a extrapolation of the vs. data measured above 2 K for Hardy et al. (2011). In the present paper, we have performed low-temperature angle-resolved dc magnetization measurements on URhGe in order to investigate the magnetization behavior near the wing structure of the FM QPT. We obtained the -- phase diagram and determined the detailed profiles of the wing structure as well as the location of TCP.
II Experimental Procedures
Single-crystalline URhGe was grown at JAEA, and cut into a rectangular shape with the 4.4 mg mass. The present sample does not show superconductivity. It has been recognized that superconductivity as well as RSC only appears in stoichiometric samples of URhGe with a very small residual resistivity Miyake et al. (2008). By contrast, the FM transition is much more robust and does not change much even in doped systems URh0.9Co0.1Ge and URhxIr1-xGe Tokunaga et al. (2015); Pospíšil et al. (2017). It should be noticed, however, that the sample quality might influence the magnetization behavior, in particular at the vicinity of QCPs.
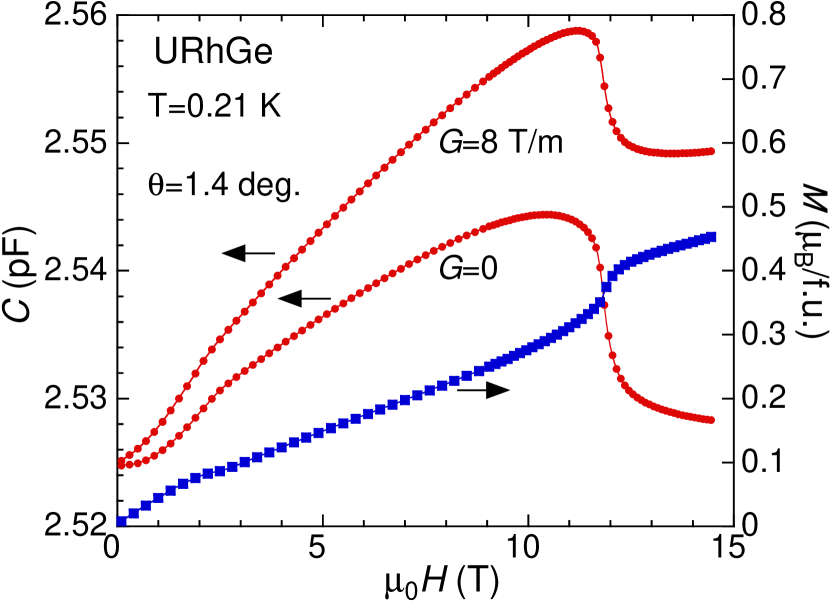
DC magnetization measurements were performed by means of a capacitively-detected Faraday magnetometer Sakakibara et al. (1994). In this method, we detect a magnetic force () proportional to the magnetization of the sample situated in an inhomogeneous field as a capacitance change of a capacitive transducer. Here, denotes the vertical axis, along which the magnetic fields up to 14.5 T were generated by a superconducting solenoid. The capacitance transducer consists of a fixed plate and a mobile plate that is suspended by thin phosphor-bronz wires and can move in proportion to an applied force. We applied the field gradient of T/m in this experiment. The sample was mounted on the capacitor transducer with varnish (GE7031) so that its axis is oriented close to the direction. In this situation, the -axis component of the magnetization, , is mainly detected. However, a huge magnetic torque component () is superposed on the output of the capacitor transducer due to the strong magnetic anisotropy. In order to eliminate the torque contribution, we measure the torque back ground with switched off (), and subtract it from the data with switched on.
Figure 1 shows an example of the data processing, in which the raw capacitance () data of URhGe obtained at 0.21 K in magnetic fields tilted by 1.4∘ from the axis in the plane, are shown (solid circles) with two different field gradient values T/m and . The magnetization curve (solid squares) is obtained by taking a difference of the two data. Further details of the data processing are given in Ref. Sakakibara et al. (1994). Just at , however, we had a difficulty in subtracting the torque background, as discussed later. The data is also useful to qualitatively estimate the -axis component of the magnetization , i.e., the OP of the FM state, under the fields near the axis.
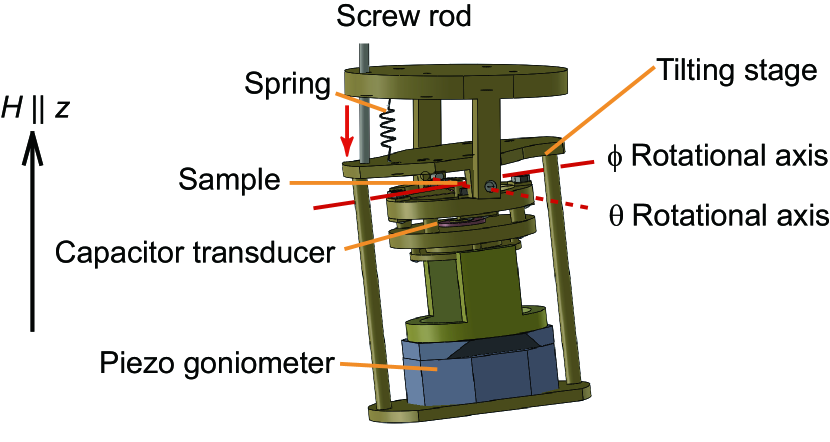
A 3He-4He dilution refrigerator was used to cool the sample in the temperature range of 0.25 K 6 K. The orientation of the URhGe crystal was precisely controlled in the and planes within an accuracy of less than 0.1∘ using a piezo-stepper-driven goniometer ( rotation) combined with a home-made tilting stage ( rotation) Kittaka et al. (2014), where () and () are the rotation angle in the and the planes, respectively. Figure 2 shows a schematic view of the two-axis rotation device. The two rotation axes, orthogonal to each other, intersect the sample position. The angle of the tilting stage is varied by a screw, which is rotated from the top of the insert with a shaft that is thermally isolated. The full details of the two-axis rotation device will be published elsewhere. In the present study, we measured the dependence of the magnetic responses in the plane.
III Results
III.1 Torque component
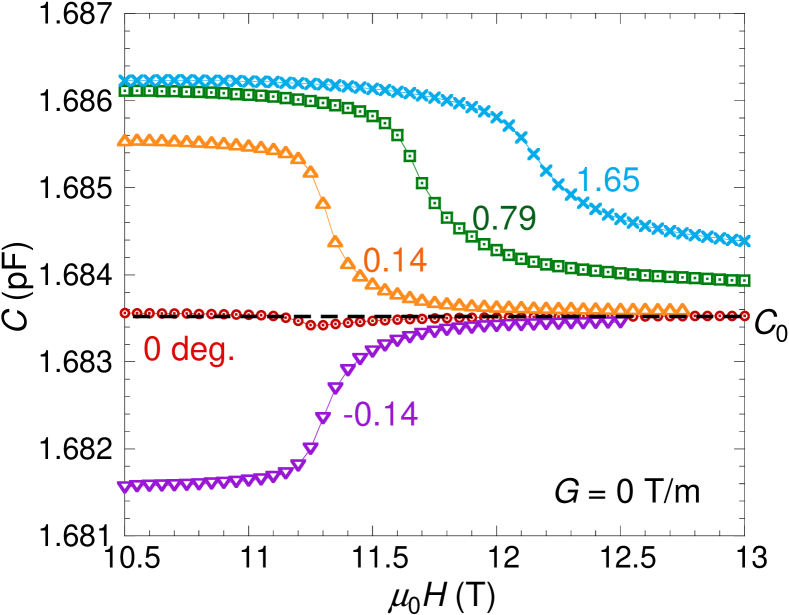
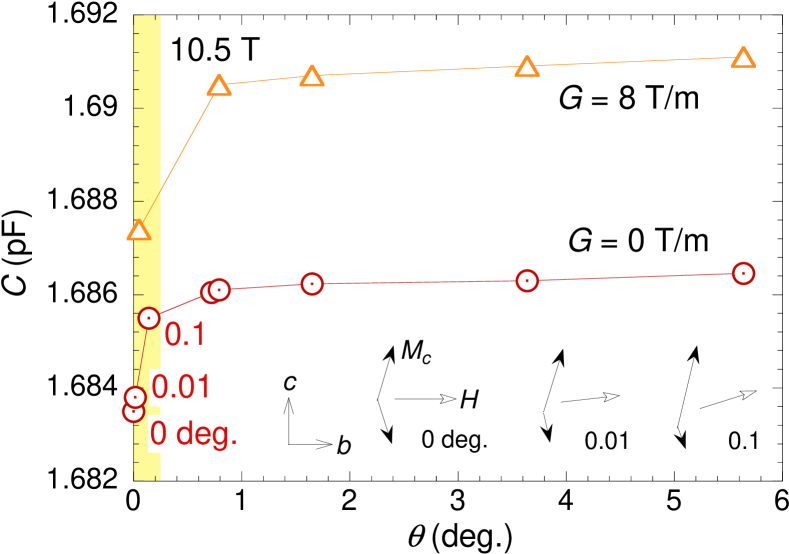
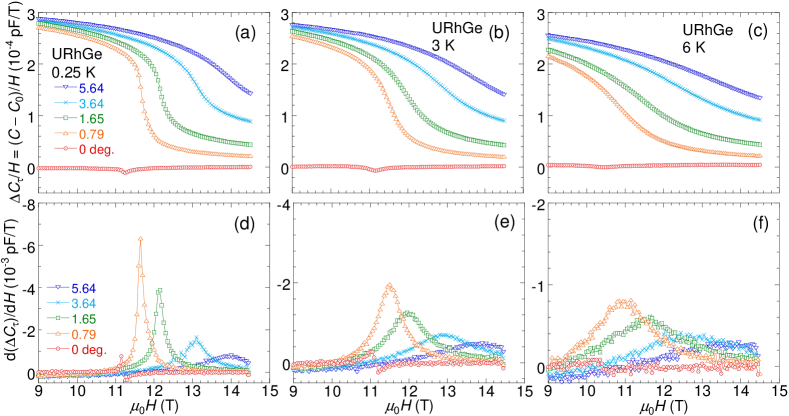
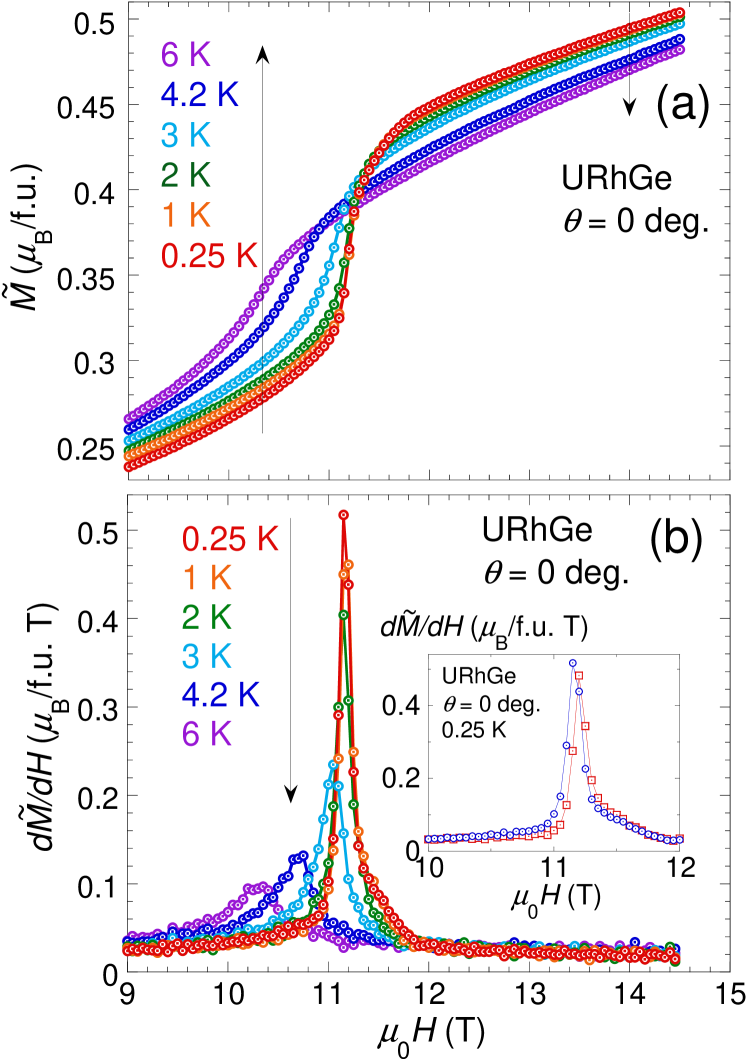
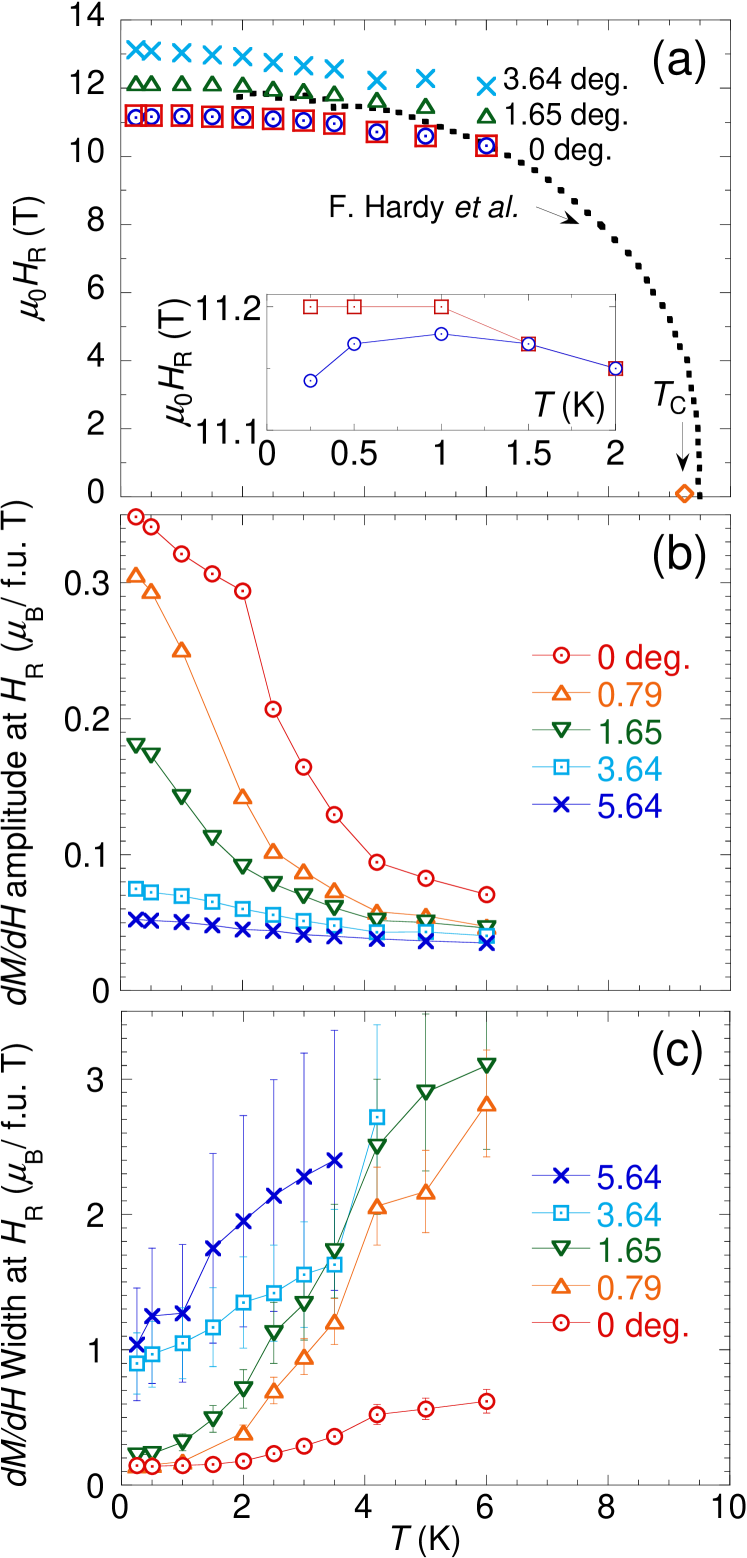
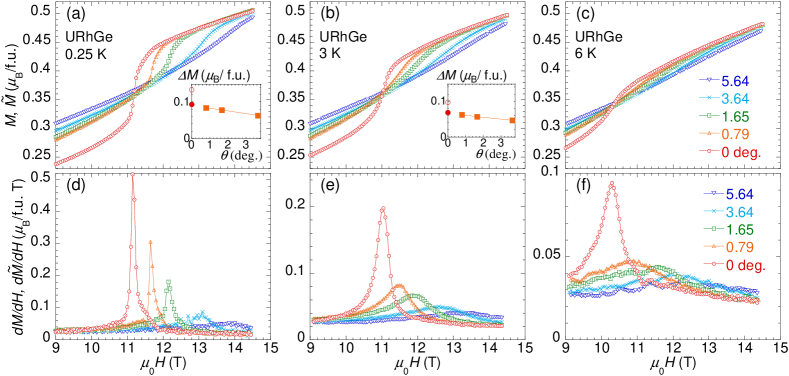
Figure 3 shows the raw capacitance () data near with zero field gradient () measured at K for several values, where is the angle between and the axis in the plane. The dashed line at pF indicates the capacitance value at . The capacitance difference is thus proportional to the torque component . There is a huge torque contribution below the reorientation field 12-13 T for coming from the large component. Interestingly, the data at , in which the magnetic field direction is precisely adjusted to the axis, show virtually no torque contribution. This is because a perfect alignment of the magnetic field along the axis () yields an equal population of the FM domains with pointing along and directions (the inset of Fig. 4), resulting in the zero-torque state even below . The degree of the domain alignment changes with , and saturates above 0.79∘. Note that the torque changes its sign for a negative value, as expected. Above , the torque component almost vanishes for , indicating that the magnetic moment becomes almost parallel to the field direction. For , on the other hand, a finite torque remains even well above . This is due to an intrinsic magnetic anisotropy of the system. In Fig. 4, we plot the value at T and K with (open circles) and T/m (open triangles) for several values. The data represents the domain alignment as a function of the -axis field . The data clearly show that the single domain state is reached at , or T.
Figure 5 shows the field variation of , the quantity proportional to , measured at (a) 0.25, (b) 3, and (c) 6 K in a field range near for the angles ∘, 0.79∘, 1.65∘, 3.64∘, and 5.64∘. The differential curves are also shown in Figs. 5(d)-5(f). For ∘, the domain state with zero magnetic torque persists up to T, where a small kink appears upon the moment reorientation. For and K, the sudden collapse of seen at T indicates a first-order transition. This transition becomes broader and shifts to the higher field side with increasing and decreasing . These features are more clearly seen in the differential data [Figs. 5(d)-(f)].
These torque data thus directly probe the behavior of the OP across the transition, and can be used to construct the wing structure phase diagram for ∘. As mentioned above, however, the torque component is not so sensitive to the phase transition very close to ∘ because of the domain formation. In order to explore the phase transition for ∘, in particular the TCP, we evaluate the field variation of the magnetization in the following.
III.2 Magnetization
Magnetization curves for various field angle near the axis can be obtained from the capacitance data with T/m by subtracting a torque background ( data), on the basis of the assumption that the torque contribution is the same for and 8 T/m. In most cases, this condition holds with good accuracy. As explained later, however, we found it difficult to fulfill this condition at for a technical problem, and as a consequence some residual torque contribution remains in the magnetization curve at for . For this reason, we denote the magnetization curve at by , and distinguish it from the data for for which the torque component is properly subtracted.
Figures 6(a) and (b) show of URhGe and the differential curve , respectively, obtained at 0.25, 1, 2, 3, 4.2, and 6 K. At 0.25 K, a magnetization jump is observed at T. reaches 0.46 /U above , in agreement with the previous result Hardy et al. (2011). This magnetization value is very close to the spontaneous magnetization at , in accordance with a simple picture of the moment reorientation from the easy axis to the axis at Tokunaga et al. (2015); Lévy et al. (2009); Hardy et al. (2011). Just above , there is a small shoulder-like anomaly, which is also seen in as a small hump. As shown in the inset of Fig. 6(b), a small hysteresis is observed in the transition at 0.25 K, implying the transition to be of first order. With increasing temperature, the magnetization jump becomes broader and weaker, and the critical field shifts to the lower field side. This change of the transition behavior becomes prominent above 2 K. Surprisingly, however, the peak feature in can be seen even at 6 K.
Figure 7(a) shows temperature dependence of obtained from the present torque and magnetization measurements at ∘, 1.65∘, and 3.64∘, together with the previous results (dotted line) Aoki et al. (2011). Here is determined by the position of the peak of and in Figs. 5 and 6. The results at is qualitatively the same as the previous reports, and the line of shifts to the higher field side with increasing the angle . More precisely, the critical field of T obtained here is slightly lower than the previously reported values Lévy et al. (2005, 2007); Aoki et al. (2011); Hardy et al. (2011). The inset of Fig. 7(a) compares the critical field defined in the ascending (open squares) and descending (open circles) fields. A small but distinct hysteresis appears and grows in amplitude on cooling below 1.5 K.
Figures 7(b) and 7(c) show the temperature evolution of the amplitude of the peak in at and the transition width defined by the full width at the half maximum, respectively, measured at several . A remarkable weakening of the transition is evident above 2 K, the temperature which is close to reported previously Gourgout et al. (2016). The transition width for ∘ shows a significant broadening above 2 K. At , by contrast, the transition remains relatively sharp even near 6 K, suggesting that the first-order-like behavior persists up to this temperature.
Figure 8 shows the magnetization curves of URhGe near for values from 0.79∘ to 5.64∘ measured at (a) 0.25, (b) 3, and (c) 6 K, together with their differential curves for (d) 0.25, (e) 3, and (f) 6 K. Note that the torque component is properly subtracted for the results at . Comparing Figs. 8(d)-8(f) with Figs. 5(d-f), one can see that shows qualitatively the same behavior with ; the jump in is correlated to the negative jump in . In particular, both data yield the same critical field .
For comparison, and for ∘ are also plotted in these figures. Whereas agrees with for at fields above , an apparent disparity is evident below ; appears to be underestimated. We attribute this problem to an incomplete subtraction of the torque component in the condition. A difficulty is that the vertical field gradient produces a small -axis component of the magnetic field on the sample not and slightly deflects the field angle, accordingly. We estimate the angle shift to be at T/m. Even such a tiny change in , however, causes a significant effect at ∘ because the torque component for shows very strong variation there (Fig. 4). As a consequence, the condition of the torque component being independent of fails, resulting in an incomplete torque subtraction for and an overestimate of the magnetization jump.
In order to get a reliable estimation of the magnetization jump for ∘, we plot the metamagnetic jump for the field direction ∘, 1.65∘ and 3.64∘ in the inset of Figs. 8(a) and 8(b). In both plots, shows a gradual angular variation, and its linear extrapolation to ∘ gives /f.u. at 0.25 K and /f.u. at 3 K. One sees that for ∘ (open circles) is about 1.5 times overestimated for both and 3 K. In what follows, accordingly, we reduce the peak value of by a factor 0.7 in the discussion of the angular variation of the transition. We note that thus corrected amplitude of the magnetization jump at 0.25 K for ∘ is in good agreement with the previous estimate by extrapolation of the data Hardy et al. (2011).
IV Discussion
We employ these data of and for construction of the URhGe wing structure phase diagram. As passes through the first-order wing plane at a fixed in the phase diagram (see Fig. 11(c)), as well as exhibit a peak. Mapping those peak positions to the space then provides the wing phase diagram. Figure 9 shows the contour plot of around the FM wing structure of URhGe in the - plane at various temperatures. Dotted lines indicate the traces of the field sweep at fixed angles , along which the magnetization data were obtained. Green dots on the contour plots represent the peak position of measured at ∘, 0.79∘, 1.65∘, 3.64∘, and 5.64∘, and solid lines are guides to the eye. One can see that the bright arc in Fig. 9, i.e., the first-order transition region, becomes narrower as increases. Above 4.2 K, the bright spot can only be seen at , indicating the first-order transition is confined to the narrow region. Similar plots can also be obtained from the data and the results are shown in Fig. 10. Note that the data points are absent at in Fig. 11(b) because the torque component vanishes there due to a ferromagnetic domain formation. These plots thus represent cuts of the wing plane at various temperatures (see Fig. 11(c)), indicating that the wing planes are slightly warped.
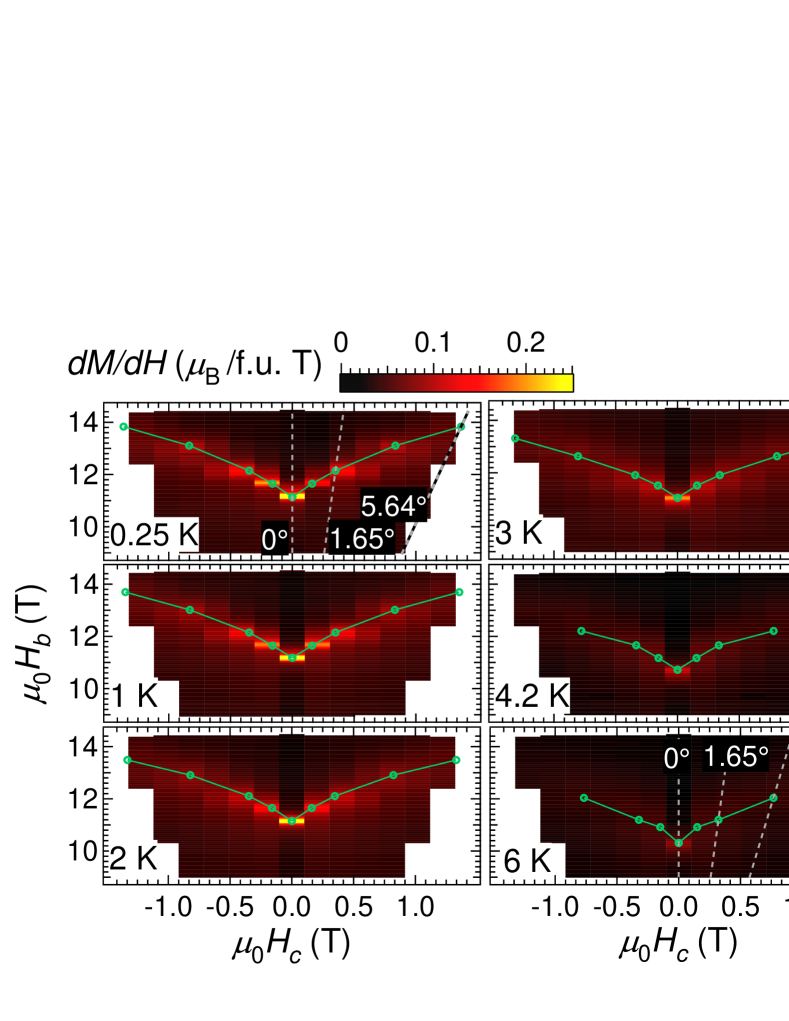
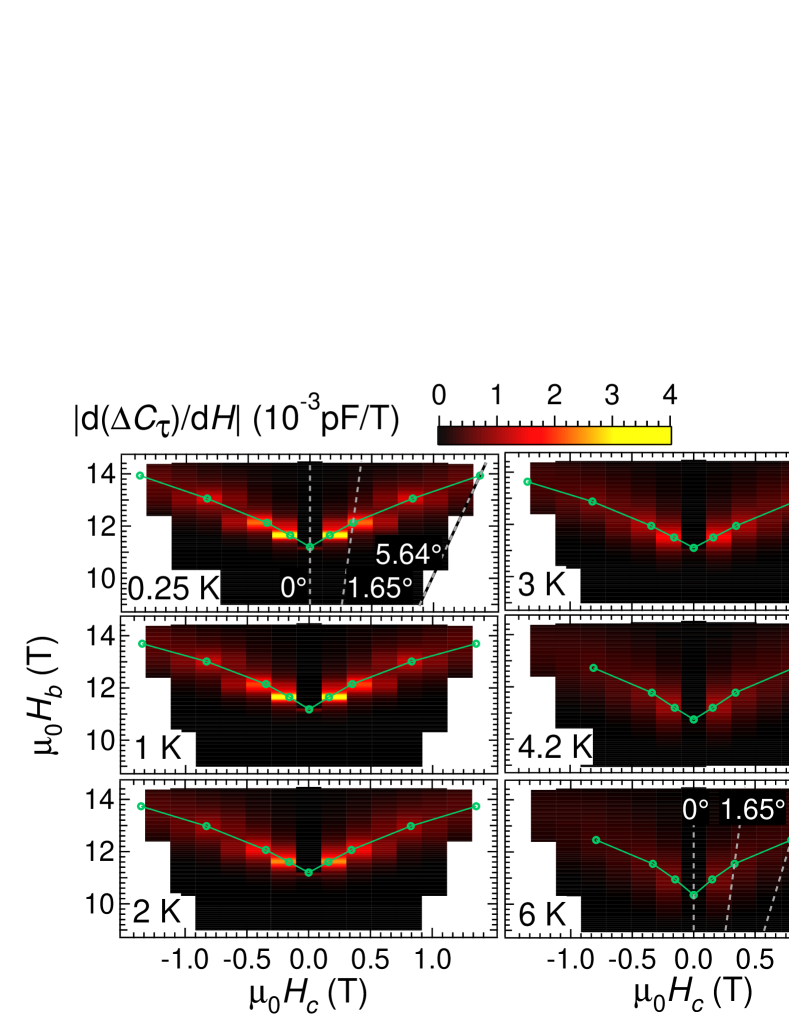
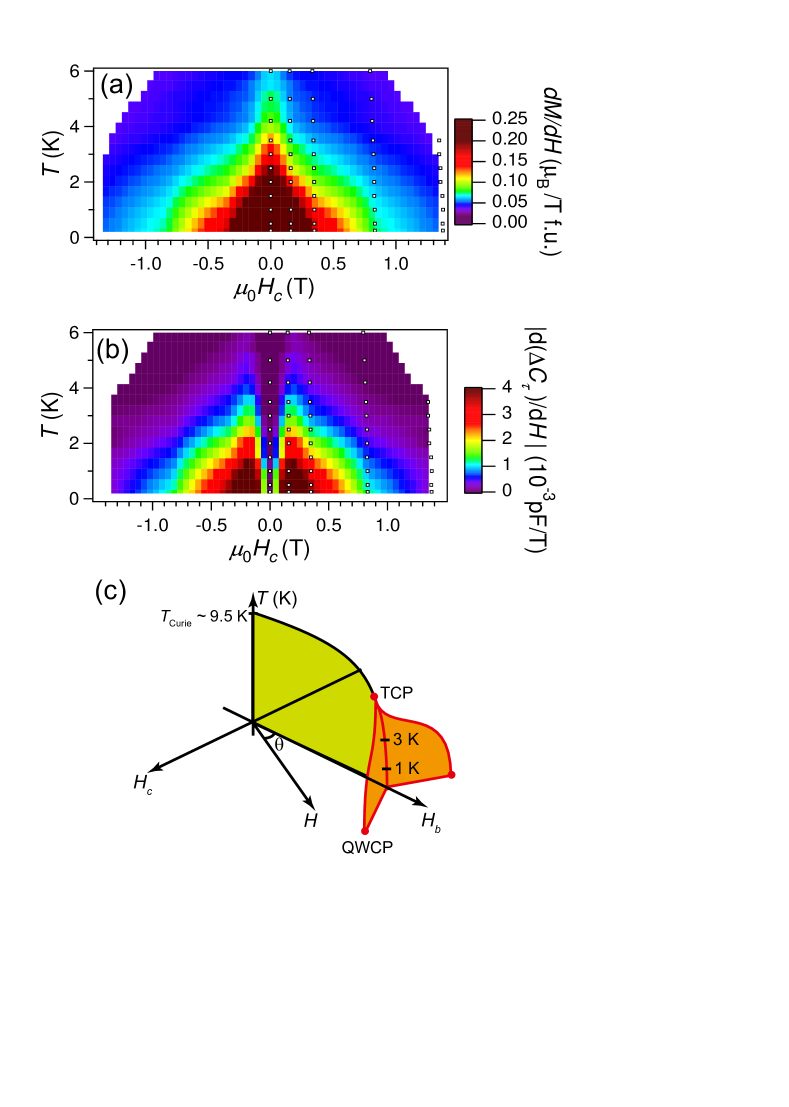
Figure 11 shows the color contour plot of the peak amplitude of (a) and (b) , projected on the plane. These plots provide imaging of the wing plane viewed from the axis. Overall, the wing plane is bell shaped and steeply extends to higher temperatures above 4 K at . This feature of the wing plane is in agreement with the phenomenological analysis that three second-order transition lines meet at TCP tangentially Taufour et al. (2016).
In a prototypical ferromagnet, a first-order transition changes into a second-order one at the edge of the wing plane. One therefore expects that , the field derivative of the OP, becomes divergent on the line connecting TCP and QWCP Karube et al. (2012). Unlike the expectation, however, the peak amplitude of of URhGe decreases progressively as increases, making it somewhat difficult to define the wing edge from these data. This observation, along with the smallness of the hysteresis in , demonstrate the weak nature of the first-order transition in this compound. Nevertheless, from Fig. 11(b) we may judge that the wing plane extends to 1.1 T at , because outside this range the landscape of becomes suddenly flat and low. Thus the location of QWCP is estimated to be 1.1 T and 13.5 T.
Similar difficulty exists in the determination of TCP. Since has poor sensitivity to detect TCP at () because of the ferromagnetic domain issue, we inspect the data. One should keep in mind that is not the OP of the phase transition under consideration. We therefore need some theoretical inputs to discuss the phase transition by the data near ∘. Up to now, no established microscopic theory is at hand for the field-induced phase transition in URhGe. We thus rely on the phenomenological model Mineev (2015) that treats the phase transition of an Ising ferromagnet in a magnetic field perpendicular to the spontaneous magnetization. According to the theory, can be expressed in terms of as
| (1) |
where and are the coefficients of the and the terms in the Landau free energy expansion, respectively. A first-order spin reorientation transition is predicted by this model when exceeds a certain critical value Mineev (2015). As described in the next paragraph, we can see from this equation how at the transition evolves with in the plane; diverges at the transition for , whereas it does not for .
At a second-order transition point above TCP, on the plane develops as , where is given by
| (2) |
with being a constant Mineev (2015). Even though shows an infinite change of slope at , does not exhibit a strong singularity; from Eqs. (1) and (2), would only exhibit a finite change of slope as a function of or . This feature of can indeed be seen in the magnetization data measured in various fields Hardy et al. (2011). By contrast, just at , because the term in the renormalized free energy vanishes. In this case, would diverge as because a square-root singularity remains in . Below TCP, diverges as well, reflecting a finite jump of at the first-order transition.
By looking at the contour plot in Fig. 11(a), we find that the peak amplitude for ∘ becomes progressively smaller with increasing above 2 K. It can be seen, however, that in Fig. 8(f) still exhibits a rather sharp peak, i.e. divergent behavior, at 6 K. This fact suggests that the first-order nature of the transition persists up to this temperature. We note that this important feature of the transition is observable only in a very narrow angular window of .
Up to now, there have been a few reports regarding the location of TCP in URhGe. In the 73Ge NMR spectra study performed in a field of 12 T applied parallel to the axis, a phase separation of the FM and the paramagnetic states, the fingerprint of the first-order transition, can be seen at least up to 4.3 K, giving rather strong evidence that is well above this temperature Kotegawa et al. (2015). By contrast, the thermoelectric power experiment claims much lower TCP temperature of 2 K Gourgout et al. (2016). The wing structure phase diagram (Fig. 11) obtained in the present experiment is consistent with the NMR results. It should be noticed that a misalignment of the magnetic field by from the axis would yield an incorrect estimate of K.
Finally, some remarks are made regarding RSC in URhGe. The RSC in this system emerges not only near the quantum wing critical point, but also along the first-order quantum phase transition line of the wing structure at . Indeed, the zero-resistivity state of RSC at 50 mK occurs along the first-order transition line in the plane, terminating at QWCP Lévy et al. (2005). A possible origin of this unusual phenomena has been attributed to longitudinal () magnetic fluctuations, and discussed in relation to a quantum TCP that can be expected when is very low Lévy et al. (2005, 2009); Tokunaga et al. (2015). The present results reveal, however, that there is a large disparity between K and K; , indicating that the system is not close to a quantum TCP. In this regard, we point out that the first-order transition in this system is very weak in nature, as evidenced by a smallness in the hysteresis of the critical field as well as a rapid broadening of the transition with . Such a weakness of the first-order transition might host substantial fluctuations even at low temperatures .
V Conclusion
We have investigated the quantum phase transition of an Ising ferromagnet URhGe by means of high-precision angle-resolved dc magnetization measurements in magnetic fields applied near the axis. A first-order spin reorientation transition has been observed at low temperatures, accompanied by a small hysteresis in the critical field. The temperature and angular variations of the transition observed in the magnetization as well as in the magnetic torque allow us to construct the three-dimensional phase diagram, where () is the conjugate field parallel to the order parameter and is the -axis component of the field that tunes down to zero. The tricritical point is estimated to be located above 4 K in the plane. On cooling below , a wing structure develops by increasing . We have succeeded in directly determining the detailed profiles of the wing structure. The quantum wing critical points exist at T and T. Three second-order transition lines meet at tangentially, so that a precise tuning of along the axis within 0.8∘ is needed to correctly determine the position of TCP. The reentrant superconductivity in this system is not due to a quantum TCP Lévy et al. (2007), but is rather related to unusually weak nature of the first-order transition represented by a smallness of the hysteresis and a broadness of the transition.
Acknowledgements.
The present work was supported in part by a Grant-in-Aid for Scientific Research on Innovative Areas “J-Physics” (15H05883) and KAKENHI (15H03682) from MEXT.References
- Saxena et al. (2000) S. Saxena, P. Agarwal, K. Ahilan, F. Grosche, R. Haselwimmer, M. Steiner, E. Pugh, I. Walker, S. Julian, P. Monthoux, et al., Nature 406, 587 (2000).
- Aoki et al. (2001) D. Aoki, A. Huxley, E. Ressouche, D. Braithwaite, J. Flouquet, J.-P. Brison, E. Lhotel, and C. Paulsen, Nature 413, 613 (2001).
- Huy et al. (2007) N. Huy, A. Gasparini, D. De Nijs, Y. Huang, J. Klaasse, T. Gortenmulder, A. de Visser, A. Hamann, T. Görlach, and H. v. Löhneysen, Phys. Rev. Lett. 99, 067006 (2007).
- Hattori et al. (2012) T. Hattori, Y. Ihara, Y. Nakai, K. Ishida, Y. Tada, S. Fujimoto, N. Kawakami, E. Osaki, K. Deguchi, N. Sato, et al., Phys. Rev. Lett. 108, 066403 (2012).
- Ohta et al. (2010) T. Ohta, T. Hattori, K. Ishida, Y. Nakai, E. Osaki, K. Deguchi, N. K. Sato, and I. Satoh, J. Phys. Soc. Jpn. 79, 023707 (2010).
- de Visser et al. (2009) A. de Visser, N. T. Huy, A. Gasparini, D. E. de Nijs, D. Andreica, C. Baines, and A. Amato, Phys. Rev. Lett. 102, 167003 (2009).
- Kotegawa et al. (2005) H. Kotegawa, A. Harada, S. Kawasaki, Y. Kawasaki, Y. Kitaoka, Y. Haga, E. Yamamoto, Y. Onuki, K. M. Itoh, E. Haller, et al., J. Phys. Soc. Jpn. 74, 705 (2005).
- Aoki et al. (2009) D. Aoki, T. D. Matsuda, V. Taufour, E. Hassinger, G. Knebel, and J. Flouquet, J. Phys. Soc. Jpn. 78, 113709 (2009).
- Lévy et al. (2009) F. Lévy, I. Sheikin, B. Grenier, C. Marcenat, and A. Huxley, J. Phys.: Condens. Matter 21, 164211 (2009).
- Tokunaga et al. (2015) Y. Tokunaga, D. Aoki, H. Mayaffre, S. Krämer, M.-H. Julien, C. Berthier, M. Horvatić, H. Sakai, S. Kambe, and S. Araki, Phys. Rev. Lett. 114, 216401 (2015).
- Taufour et al. (2011) V. Taufour, A. Villaume, D. Aoki, G. Knebel, and J. Flouquet, J. Phys. Conf. Ser. 273, 012017 (2011).
- Tran et al. (1998) V. Tran, R. Troć, and G. André, J. Magn. Magn. Mater. 186, 81 (1998).
- Lévy et al. (2005) F. Lévy, I. Sheikin, B. Grenier, and A. D. Huxley, Science 309, 1343 (2005).
- Hardy et al. (2011) F. Hardy, D. Aoki, C. Meingast, P. Schweiss, P. Burger, H. v. Löhneysen, and J. Flouquet, Phys. Rev. B 83, 195107 (2011).
- Pfeuty (1970) P. Pfeuty, Ann. Phys. 57, 79 (1970).
- Aoki and Flouquet (2014) D. Aoki and J. Flouquet, J. Phys. Soc. Jpn. 83, 061011 (2014).
- Brando et al. (2016) M. Brando, D. Belitz, F. M. Grosche, and T. R. Kirkpatrick, Rev. Mod. Phys. 88, 025006 (2016).
- Belitz et al. (1999) D. Belitz, T. R. Kirkpatrick, and T. Vojta, Phys. Rev. Lett. 82, 4707 (1999).
- Belitz et al. (2005) D. Belitz, T. R. Kirkpatrick, and J. Rollbühler, Phys. Rev. Lett. 94, 247205 (2005).
- Kirkpatrick and Belitz (2015) T. R. Kirkpatrick and D. Belitz, Phys. Rev. Lett. 115, 020402 (2015).
- Taufour et al. (2010) V. Taufour, D. Aoki, G. Knebel, and J. Flouquet, Phys. Rev. Lett. 105, 217201 (2010).
- Pfleiderer and Huxley (2002) C. Pfleiderer and A. D. Huxley, Phys. Rev. Lett. 89, 147005 (2002).
- Kotegawa et al. (2011) H. Kotegawa, V. Taufour, D. Aoki, G. Knebel, and J. Flouquet, J. Phys. Soc. Jpn. 80, 083703 (2011).
- Uhlarz et al. (2004) M. Uhlarz, C. Pfleiderer, and S. M. Hayden, Phys. Rev. Lett. 93, 256404 (2004).
- Shimizu et al. (2015) Y. Shimizu, D. Braithwaite, B. Salce, T. Combier, D. Aoki, E. N. Hering, S. M. Ramos, and J. Flouquet, Phys. Rev. B 91, 125115 (2015).
- Míšek et al. (2017) M. Míšek, J. Prokleška, P. Opletal, P. Proschek, J. Kaštil, J. Kamarád, and V. Sechovský, AIP Advances 7, 055712 (2017).
- Aoki et al. (2011) D. Aoki, T. Combier, V. Taufour, T. D. Matsuda, G. Knebel, H. Kotegawa, and J. Flouquet, J. Phys. Soc. Jpn. 80, 094711 (2011).
- Lévy et al. (2007) F. Lévy, I. Sheikin, and A. Huxley, Nat. Phys. 3, 460 (2007).
- Gourgout et al. (2016) A. Gourgout, A. Pourret, G. Knebel, D. Aoki, G. Seyfarth, and J. Flouquet, Phys. Rev. Lett. 117, 046401 (2016).
- Kotegawa et al. (2015) H. Kotegawa, K. Fukumoto, T. Toyama, H. Tou, H. Harima, A. Harada, Y. Kitaoka, Y. Haga, E. Yamamoto, Y. Ōnuki, et al., J. Phys. Soc. Jpn. 84, 054710 (2015).
- Miyake et al. (2008) A. Miyake, D. Aoki, and J. Flouquet, J. Phys. Soc. Jpn. 77, 094709 (2008).
- Pospíšil et al. (2017) J. Pospíšil, Y. Haga, S. Kambe, Y. Tokunaga, N. Tateiwa, D. Aoki, F. Honda, A. Nakamura, Y. Homma, E. Yamamoto, et al., Phys. Rev. B 95, 155138 (2017).
- Sakakibara et al. (1994) T. Sakakibara, H. Mitamura, T. Tayama, and H. Amitsuka, Jpn. J. Appl. Phys. 33, 5067 (1994).
- Kittaka et al. (2014) S. Kittaka, A. Kasahara, T. Sakakibara, D. Shibata, S. Yonezawa, Y. Maeno, K. Tenya, and K. Machida, Phys. Rev. B 90, 220502 (2014), Supplemental Material.
- (35) From Maxwell equation , we expect (in vacuum) at the magnet center. The vertical field gradient T/m along the axis of the sample thus produce a field gradient of order 4 T/m along the axis. An off-center displacement of the sample of 1mm then results in a -axis field of 4 mT.
- Taufour et al. (2016) V. Taufour, U. S. Kaluarachchi, and V. G. Kogan, Phys. Rev. B 94, 060410 (2016).
- Karube et al. (2012) K. Karube, T. Hattori, S. Kitagawa, K. Ishida, N. Kimura, and T. Komatsubara, Phys. Rev. B 86, 024428 (2012).
- Mineev (2015) V. P. Mineev, Phys. Rev. B 91, 014506 (2015).