Whole Genome Phylogenetic Tree Reconstruction Using Colored de Bruijn Graphs
Abstract
We present kleuren, a novel assembly-free method to reconstruct phylogenetic trees using the Colored de Bruijn Graph. kleuren works by constructing the Colored de Bruijn Graph and then traversing it, finding bubble structures in the graph that provide phylogenetic signal. The bubbles are then aligned and concatenated to form a supermatrix, from which a phylogenetic tree is inferred. We introduce the algorithms that kleuren uses to accomplish this task, and show its performance on reconstructing the phylogenetic tree of 12 Drosophila species. kleuren reconstructed the established phylogenetic tree accurately and is a viable tool for phylogenetic tree reconstruction using whole genome sequences. Software package available at: https://github.com/Colelyman/kleuren.
Index Terms:
phylogenetics; algorithm; whole genome sequence; colored de Bruijn graphI Introduction
Whole genome sequences are readily available and affordable like never before [1] due to the advent of high-throughput Next Generation Sequencing (NGS) which has provided researchers with vast amounts of genomic sequencing data that has transformed the landscape of understanding of genomes. The field of phylogenetics, which discovers the evolutionary relationship between taxa, has been no exception to this transformation. Phylogenetics has responded to the copious amounts of high throughput data with novel alignment-free and assembly-free methods [2, 3] that are better suited [4] to handle the large amounts of data more efficiently than the traditional alignment-based phylogenetic methods. The traditional approach to phylogenetic tree reconstruction requires a homology search throughout the genomes of the taxa, a Multiple Sequence Alignment (MSA) of the homologs, and a tree construction from the resulting matrix. Each of these steps can be computationally expensive and may introduce many unnecessary assumptions that can be avoided by using an alignment-free and assembly-free method.
Alignment-free and assembly-free methods [5, 6, 7, 8] don’t come without their disadvantages, one of which being that many of these methods abstract away the source of the phylogenetic signal to a method akin to shared kmer-counting. We propose an assembly-free whole genome phylogenetic tree reconstruction method using the Colored de Bruijn Graph (CdBG) [9], a data structure that is commonly used for detecting variation and comparing genomes.
The CdBG is similar to a traditional de Bruijn Graph (dBG) in that the substrings of a certain length, referred to as kmers, of a sequence represent the vertices of the dBG and an edge exists between two vertices if the suffix of the first vertex is the prefix of the second vertex. The CdBG differs from the traditional dBG in that each vertex is associated to an unique color (or set of colors) which could be a differing sample, species, or taxon.
We introduce the kleuren (Dutch for ”colors” in tribute of Nicolaas Govert de Bruijn, the de Bruijn graph’s namesake) software package which implements our methods. kleuren works by finding bubble regions [9, 10] of the CdBG, which are where one or more colors diverge at a node, which act as pseudo-homologous regions between the taxa. The sequence for each taxon in each bubble is then extracted and a MSA is performed, then the MSA’s from each bubble are concatenated to form a supermatrix in which a phylogenetic tree of evolution is constructed.
II Methods
II-A Definitions
Given the alphabet which are nucleotide codes, let a dBG , be defined as where is the set of vertices and where is the unique sequence of length of and where is the set of edges and where is an edge connecting two vertices such that the sequence of and overlap by characters. Let a CdBG, , be defined as for taxa where is the dBG of the taxon. We refer to each as a distinct color or taxon.
Furthermore, let a path, in be defined as a sequence of vertices from such that for all subsequences of , the edge . Let a bubble, , in be defined as such that each is associated with one or more colors, that the first and last vertices of are identical, and that (see Figure 1).
Finally, let be defined as where is the vertices (or the unique kmers) of the dBG, .
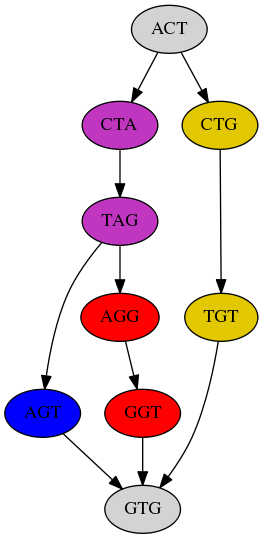
A. Bubble in a Colored de Bruijn Graph
| Color 1 | Path: ACTGTG |
|---|---|
| Color 2 | Path: ACTAGGTG |
| Color 3 | Path: ACTAGTG |
B. Paths in the Bubble of Each Color
II-B Software Architecture
We use the dbgfm software package [11] to construct and represent the dBG’s of the individual taxa. kleuren provides an interface to interact with the individual dBG’s to create a CdBG, where each taxon is considered a color. The dbgfm package uses the FM-Index [12], as a space efficient representation of the dBG.
II-C kleuren Algorithms
II-C1 Overall Algorithm
kleuren works by iterating over the superset of vertices, , and discovering vertices that could form a bubble. A vertex, , could form a bubble if is present in or more colors of , where is set by the user as a command line parameter. Note that the lower that is, the more potential bubbles that may be found, but kleuren will take longer to run because more vertices will be considered as the starting vertex of a bubble. Let be considered as the starting vertex of the bubble, ; then the end vertex, , of is found (see Section II-C2). After the end vertex is found, the path, , between and is found for each color in (see Section II-C3). This process is repeated until each vertex in has been either considered as a starting vertex of a bubble, or has been visited while extending the path between a starting and ending vertex.
II-C2 Finding the End Vertex
The end vertex is found by traversing the path from the until a vertex is found that is in at least colors. The is then used in the function to extend the path (see Section II-C3).
II-C3 Extending the Path
The main functions that discover the sequences found in a bubble are the Extend the Path Functions (see Section II-C3). To extend the between the and we use a recursive function that traverses the dBG for a color in which every possible path between the and is explored up to the (provided as a command line parameter by the user). The parameter allows the user to specify how thorough kleuren will search for a bubble; the higher the the more bubbles that kleuren will potentially find, but the longer kleuren will take because at each depth there are exponentially more potential paths to traverse.
II-D Data Acquisition
II-E Tree Construction and Parameters
We used the DSK software package [15] to count the kmers present in all of the Drosophila species. To find the bubbles, we used the following parameters: (kmer size of ) and (all colors in the were required to contain a vertex in order to search for a bubble starting at that vertex) and ran instances of kleuren concurrently for days to find bubbles. When all of the bubbles in the CdBG had been identified, we used MAFFT [16] to perform a MSA for each sequence in every bubble that kleuren identified (see Figure 2 A.). Then each MSA was concatenated to form a supermatrix (see Figure 2 B.) using Biopython [17]. The phylogenetic tree was then inferred from the supermatrix by Maximum Likelihood using IQ-TREE [18] (see Figure 2 C.).
II-F Bubble Assumptions
Our method is based on the assumption that bubbles are representative of homologous regions of the taxa genomes. We propose that this assumption is reliable because it has been shown that dBG’s are a suitable method to align sequences [21, 22, 23], and by identifying the bubbles in the CdBG we find the sections of the graph that contain the most phylogenetic signal.
| Color 1 | Path: ACT--GTG |
|---|---|
| Color 2 | Path: ACTAGGTG |
| Color 3 | Path: ACTA-GTG |
A. Multiple Sequence Alignment of the Sequences in Bubble (Figure 1)
| Color 1 | Path: ACT--GTGATT-A… |
|---|---|
| Color 2 | Path: ACTAGGTGATTC-… |
| Color 3 | Path: ACTA-GTGATTCA… |
B. Supermatrix of Multiple Sequence Alignments concatenated
forked edges, /tikz/every pin edge/.append style=Latex-, shorten ¡=2.5pt, darkgray, /tikz/every pin/.append style=darkgray, /tikz/every label/.append style=darkgray, before typesetting nodes= delay= where content=coordinate, , where n children=0tier=terminus, label/.wrap pgfmath arg=right:#1content(), content=, , for tree= grow’=0, s sep’+=10pt, l sep’+=15pt, , l sep’+=10pt, [, [ [ Color 3] [ Color 2] ] [ Color 1] ]
C. Phylogenetic Tree
III Results
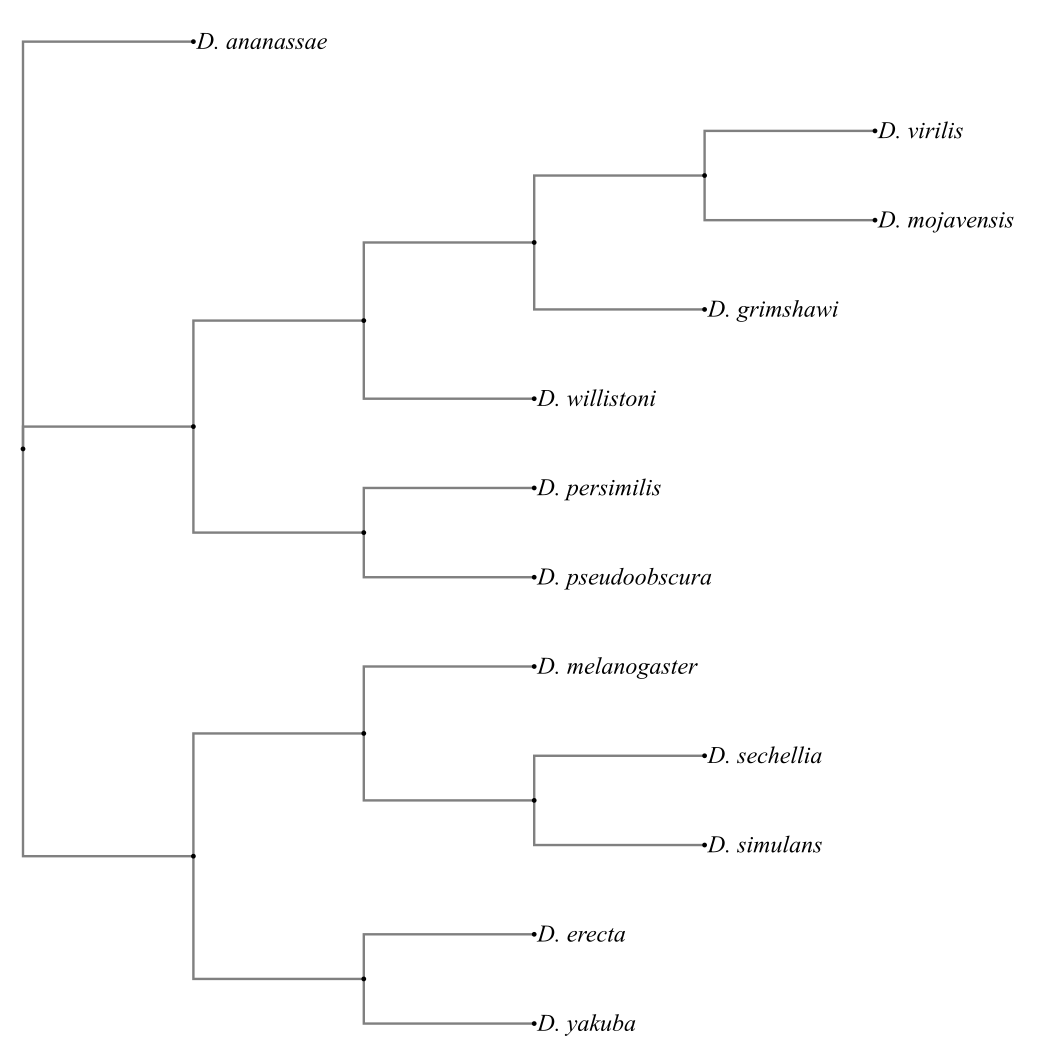
kleuren constructed a tree (see Figure 3) consistent with the established tree found in [14] (the Robinson-Foulds distance [24] between the two trees is 0). Even though we ran many concurrent instances of kleuren for multiple days (see Section II-E), not all of the kmers in were explored for potential bubbles; meaning that many more bubbles could be found in this CdBG which would only make the phylogeny more concrete.
Before this final successful run, there were a number of unsuccessful attempts made to construct the tree. Initial attempts were unsuccessful because (the super-set of kmers) that kleuren uses to find bubbles was semi-sorted (segments of the file were sorted, but all of the kmers in the file were not in lexicographic order) so the vertices that kleuren used to search for bubbles were skewed towards vertices that were lexicographically first. We remedied this issue by shuffling the order of the kmer file so that there was no lexicographic bias towards the bubbles that kleuren finds.
A previous attempt resulted in a tree that had a normalized Robinson-Fould’s distance from the established tree occurred because there were too few bubbles, and therefore there was not enough phylogenetic signal for the correct tree to be constructed. To find more bubbles, we split up the kmer file into parts so that multiple instances of kleuren could find bubbles concurrently. We also discovered that there was a high frequency of adenines (A) (a frequency around in comparison to the other nucleotides) in the final supermatrix that could skew the final tree because nucleotides have differing mutation rates. We thought this bias towards A was due to the fact that in the function (see Algorithm 3) the may be sorted, so the function would traverse the that started with an A before traversing the other (see Algorithm 3, line: 18). Similar to the previous sorting problem, we shuffled the order of the so that the first that was traversed would not always be lexicographically first. Despite this change, the final supermatrix that produced the true tree still had a bias towards A (see Section V).
IV Conclusion
We introduced a novel method of constructing accurate phylogenetic trees using a CdBG. Our method, kleuren, uses whole genome sequences to construct a CdBG representation, then it traverses the CdBG to discover bubble structures which become the basis for phylogenetic signal between taxa and eventually produces a phylogenetic tree.
As the NGS era progresses, whole genome sequences are becoming more prevalent for more non-model organisms, in which phylogenies of these organisms have never been constructed. kleuren is a viable method to relatively quickly and accurately construct the phylogenies for these newly sequenced organisms.
V Future Work
We plan to optimize kleuren so that it can find more bubbles in a shorter amount of time. We will do this by replacing the underlying data structure for how the CdBG is represented. dbgfm, the current method used to represent the dBG in kleuren, sacrifices time efficiency for memory efficiency by storing the FM-Index entirely on disk, thus slowing down queries into the dBG. When kleuren runs faster, more bubbles will be found, and more phylogenetic signal will be present so that a more accurate tree can be constructed.
We also plan to investigate the reasons for the high abundance of A’s in the supermatrix (see Section III) further, and balance the frequency of nucleotides in the supermatrix.
Furthermore, we would like to look into how kleuren performs when the CdBG is constructed using read sequencing data rather than assembled genomes.
Acknowledgment
This work was funded through the Utah NASA Space Grant Consortium and EPSCoR and through the BYU Graduate Research Fellowship.
The authors would like to thank Kristi Bresciano, Michael Cormier, Justin B. Miller, Brandon Pickett, Nathan Schulzke, and Sage Wright for their thoughts concerning the project. The authors would also like to thank the Fulton Supercomputing Laboratory at Brigham Young University for their work to maintain the super-computer on which these experiments were run.
References
- [1] S. C. Schuster, “Next-generation sequencing transforms today’s biology,” Nature Methods, vol. 5, no. 1, pp. 16–18, dec 2007. [Online]. Available: https://doi.org/10.1038/nmeth1156
- [2] H. Fan, A. R. Ives, Y. Surget-Groba, and C. H. Cannon, “An assembly and alignment-free method of phylogeny reconstruction from next-generation sequencing data,” BMC Genomics, vol. 16, no. 1, jul 2015. [Online]. Available: https://doi.org/10.1186/s12864-015-1647-5
- [3] J. Qi, H. Luo, and B. Hao, “CVTree: a phylogenetic tree reconstruction tool based on whole genomes,” Nucleic Acids Research, vol. 32, no. Web Server, pp. W45–W47, jul 2004. [Online]. Available: https://doi.org/10.1093/nar/gkh362
- [4] C. X. Chan and M. A. Ragan, “Next-generation phylogenomics,” Biology Direct, vol. 8, no. 1, jan 2013. [Online]. Available: https://doi.org/10.1186/1745-6150-8-3
- [5] B. Haubold, “Alignment-free phylogenetics and population genetics,” Briefings in Bioinformatics, vol. 15, no. 3, pp. 407–418, nov 2013. [Online]. Available: https://doi.org/10.1093/bib/bbt083
- [6] O. Bonham-Carter, J. Steele, and D. Bastola, “Alignment-free genetic sequence comparisons: a review of recent approaches by word analysis,” Briefings in Bioinformatics, vol. 15, no. 6, pp. 890–905, jul 2013. [Online]. Available: https://doi.org/10.1093/bib/bbt052
- [7] C. X. Chan, G. Bernard, O. Poirion, J. M. Hogan, and M. A. Ragan, “Inferring phylogenies of evolving sequences without multiple sequence alignment,” Scientific Reports, vol. 4, no. 1, sep 2014. [Online]. Available: https://doi.org/10.1038/srep06504
- [8] H. Yi and L. Jin, “Co-phylog: an assembly-free phylogenomic approach for closely related organisms,” Nucleic Acids Research, vol. 41, no. 7, pp. e75–e75, jan 2013. [Online]. Available: https://doi.org/10.1093/nar/gkt003
- [9] Z. Iqbal, M. Caccamo, I. Turner, P. Flicek, and G. McVean, “De novo assembly and genotyping of variants using colored de Bruijn graphs,” Nature Genetics, vol. 44, no. 2, pp. 226–232, jan 2012. [Online]. Available: https://doi.org/10.1038/ng.1028
- [10] G. Peng, P. Ji, and F. Zhao, “A novel codon-based de Bruijn graph algorithm for gene construction from unassembled transcriptomes,” Genome Biology, vol. 17, no. 1, nov 2016. [Online]. Available: https://doi.org/10.1186/s13059-016-1094-x
- [11] R. Chikhi, A. Limasset, S. Jackman, J. T. Simpson, and P. Medvedev, “On the representation of de bruijn graphs,” in Research in Computational Molecular Biology: 18th Annual International Conference, RECOMB 2014, Pittsburgh, PA, USA, April 2-5, 2014, Proceedings, R. Sharan, Ed. Cham: Springer International Publishing, 2014, pp. 35–55. [Online]. Available: https://doi.org/10.1007/978-3-319-05269-4_4
- [12] P. Ferragina and G. Manzini, “Opportunistic data structures with applications,” in Proceedings of the 41st Annual Symposium on Foundations of Computer Science, ser. FOCS ’00. Washington, DC, USA: IEEE Computer Society, 2000, pp. 390–. [Online]. Available: http://dl.acm.org/citation.cfm?id=795666.796543
- [13] L. S. Gramates, S. J. Marygold, G. dos Santos, J.-M. Urbano, G. Antonazzo, B. B. Matthews, A. J. Rey, C. J. Tabone, M. A. Crosby, D. B. Emmert, K. Falls, J. L. Goodman, Y. Hu, L. Ponting, A. J. Schroeder, V. B. Strelets, J. Thurmond, P. Zhou, and FlyBase Consortium, “FlyBase at 25: looking to the future,” Nucleic Acids Research, vol. 45, no. D1, pp. D663–D671, oct 2016. [Online]. Available: https://doi.org/10.1093/nar/gkw1016
- [14] M. W. Hahn, M. V. Han, and S.-G. Han, “Gene family evolution across 12 drosophila genomes,” PLoS Genetics, vol. 3, no. 11, p. e197, 2007. [Online]. Available: https://doi.org/10.1371/journal.pgen.0030197
- [15] G. Rizk, D. Lavenier, and R. Chikhi, “DSK: k-mer counting with very low memory usage,” Bioinformatics, vol. 29, no. 5, pp. 652–653, jan 2013. [Online]. Available: https://doi.org/10.1093/bioinformatics/btt020
- [16] K. Katoh and D. M. Standley, “MAFFT multiple sequence alignment software version 7: Improvements in performance and usability,” Molecular Biology and Evolution, vol. 30, no. 4, pp. 772–780, jan 2013. [Online]. Available: https://doi.org/10.1093/molbev/mst010
- [17] P. J. A. Cock, T. Antao, J. T. Chang, B. A. Chapman, C. J. Cox, A. Dalke, I. Friedberg, T. Hamelryck, F. Kauff, B. Wilczynski, and M. J. L. de Hoon, “Biopython: freely available Python tools for computational molecular biology and bioinformatics,” Bioinformatics, vol. 25, no. 11, pp. 1422–1423, mar 2009. [Online]. Available: https://doi.org/10.1093/bioinformatics/btp163
- [18] L.-T. Nguyen, H. A. Schmidt, A. von Haeseler, and B. Q. Minh, “IQ-TREE: A fast and effective stochastic algorithm for estimating maximum-likelihood phylogenies,” Molecular Biology and Evolution, vol. 32, no. 1, pp. 268–274, nov 2014. [Online]. Available: https://doi.org/10.1093/molbev/msu300
- [19] J. Huerta-Cepas, F. Serra, and P. Bork, “ETE 3: Reconstruction, analysis, and visualization of phylogenomic data,” Molecular Biology and Evolution, vol. 33, no. 6, pp. 1635–1638, feb 2016. [Online]. Available: https://doi.org/10.1093/molbev/msw046
- [20] O. Robinson, D. Dylus, and C. Dessimoz, “Phylo.io: Interactive viewing and comparison of large phylogenetic trees on the web,” Molecular Biology and Evolution, vol. 33, no. 8, pp. 2163–2166, apr 2016. [Online]. Available: https://doi.org/10.1093/molbev/msw080
- [21] B. Raphael, “A novel method for multiple alignment of sequences with repeated and shuffled elements,” Genome Research, vol. 14, no. 11, pp. 2336–2346, nov 2004. [Online]. Available: https://doi.org/10.1101/gr.2657504
- [22] I. Minkin, A. Patel, M. Kolmogorov, N. Vyahhi, and S. Pham, “Sibelia: A scalable and comprehensive synteny block generation tool for closely related microbial genomes,” in Algorithms in Bioinformatics: 13th International Workshop, WABI 2013, Sophia Antipolis, France, September 2-4, 2013. Proceedings. Berlin, Heidelberg: Springer Berlin Heidelberg, 2013, pp. 215–229. [Online]. Available: http://dx.doi.org/10.1007/978-3-642-40453-5_17
- [23] I. Minkin, S. Pham, and P. Medvedev, “TwoPaCo: an efficient algorithm to build the compacted de Bruijn graph from many complete genomes,” Bioinformatics, p. btw609, sep 2016. [Online]. Available: https://doi.org/10.1093/bioinformatics/btw609
- [24] D. Robinson and L. Foulds, “Comparison of phylogenetic trees,” Mathematical Biosciences, vol. 53, no. 1-2, pp. 131–147, feb 1981. [Online]. Available: https://doi.org/10.1016/0025-5564(81)90043-2