Observation of Radially Inward Turbulent Particle Flux in ETG dominated Plasma of LVPD
Abstract
Radially inward turbulent particle flux is observed in the core region of target plasma of Large Volume Plasma Device(LVPD)where electron temperature driven turbulence condition satisfied region satisfy conditions for ETG turbulence, i.e. threshold condition, , where density scale length, and temerature scale length, [S.K. Mattoo et al., Phys. Rev. Lett., 108, 255007(2012)Mattoo_PRL ]. The measured flux is dominantly electrostatic () although the nature of the measured turbulence is electromagnetic(). The turbulence has been established as a consequence of electron temperature gradient (ETG) driven modes. Experimental observations of phase angle between density () and potential () fluctuations, and electrostatic particle flux, shows good agreement with the corresponding theoretical estimates for ETG turbulence.
I Introduction
Turbulent transport is a ubiquitous phenomenon prevalent in laboratory, space and astrophysical systems Althaus ; Boqdan ; Tynan_PPCF2009 ; J. Connor ; Aschwanden . Transport in general determines the mean profile and the confinement properties of the system. In magnetic confinement fusion research, for example in tokomaks, one of the most important and burning issue is improvement of energy and particle confinement time for controlled thermonuclear reaction. The confinement properties degrade because of high outward particle and heat flux which is observed to be several magnitudes higher than the classical or neoclassical flux Wei . This anomalous flux is attributed to turbulent fluctuations due to various instabilities inherent in the system. Confined systems are naturally inhomogeneous which act as source of free energy to drive the system, unstable to slightest of the perturbations over a desperate range of scales, from electron, ion to system size scale.
While ultimately measurements in high temperature fusion plasmas in toroidal geometry must be undertaken, but it is desirable to have a hierarchy of experiments for comparison with the goal of isolating important physical effects in simplest possible geometry. Linear devices like Columbia Linear Machine (CLM) Wei , Large Volume Plasma Device (LVPD) Mattoo_PRL , and by Moon et al Moon have taken initiative in addressing some of the physical issues which are difficult to study in high temperature, toroidal devices.
Large scale perturbations are easy to probe in tokamaks and tremendous progress has been made on ion temperature gradient driven micro-turbulent mode and MHD modes. Electron larmor radius scale fluctuations () ) in the range of due to electron temperature gradient (ETG) is hard to probe in tokamaks due to extremely small scale length, though some progress has been made in National Spherical Torus Experiment (NSTX) Ren and Tore Supra Horton_2004 .
On the other hand it is possible to scale up the size of the ETG mode in a simpler setting of straight magnetic field line geometry. Recently, ETG turbulence was established in the target region of LVPD Mattoo_PRL . This device can be divided into three regions – source region where plasma is produced by filament heating, the filter region which provides a strong transverse magnetic field over a radial extent of 100 cm() to stop the energetic electrons emitted from the filament and the target region where plasma appears after diffusing through the filter magnetic field. Fluctuation and turbulent transport studies reported in this paper are done in the target region at distance of from the EEF location.
Both electrostatic and electromagnetic particle fluxes due to turbulent fluctuations are measured across the radius of the target chamber. It is observed that the turbulent particle flux is radially inward across the radius of the target plasma. The electromagnetic flux is observed to be several orders of magnitude less than the electrostatic particle flux. Hence the detailed investigation is provided on the electrostatic particle flux. The equilibrium electron density and temperature profiles are also measured which shows centrally peaked profiles. This is consistent with the observed particle pinch. How? Unlike in tokamaks where the particle fuelling is done at the edge, the plasma source in LVPD comprises of heated tungsten filaments arranged in the periphery of a rectangle, coaxial to the device located at one axial end. Clearly, the filaments are not exactly at the edge, but a bit inside and not shodowed by the excited filter region. Since the axial diffusion is much larger than the transverse diffusion, the plasma formed at one axial end spreads rapidly and along the field lines and hence the effective particle source can be thought to be axially elongated and slightly inside the radial edge. Clearly, central density can build up only if there is an inward particle transport i.e., a particle pinch.
In this paper, the electrostatic particle flux is measured, compared and a theoretical explanation is provided for the observed behaviour of it across the radius. The particle flux results due to the phase difference between the density and potential fluctuation, different from 180 degree. The cross phase angle obtained in experiment matches well with the cross angle due to the non-adiabatic ion response resulting from the perpendicular resonance of the ETG mode with the ions. The net fluctuation induced flux is found inward directed. The flux obtained by this model is some hybrid of pure diffusion and thermo-diffusion since it cannot be split in these two parts clearly. However in the flat density region the flux becomes purely thermo-diffusive. It is also found that the thermodynamic entropy of the system is reduced due to inward particle flux. This means that the heat flux, wave particle energy exchange, external sources and other dissipations together must overcome the entropy destruction by inward particle flux for net entropy production.
The rest of the paper is organized as follows; the experimental setup and diagnostics is described in section I. The experimental results are discussed in section II. In section III, a summary of experimental results are given and a discussion on comparison of experimental results with the theoretical estimation is provided in Section IV.
II Experimental setup and diagnostics
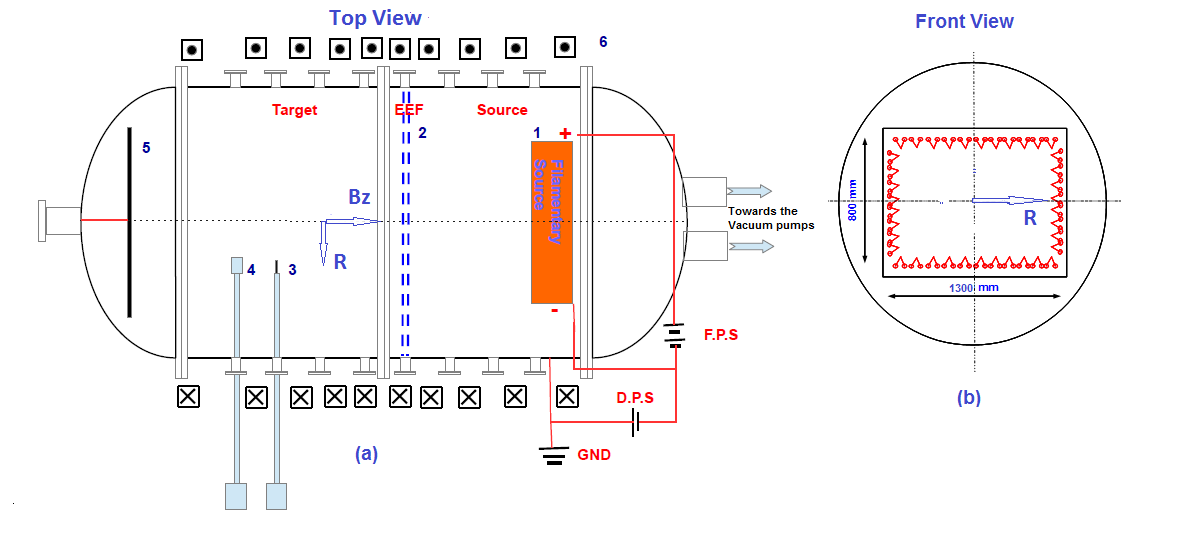
The experimental setup consists of: (1)the LVPD Mattoo_RSI device [FIG. 1] (2)the Electron Energy Filter(EEF) SKSingh_RSI , (3) particle flux probes for diagnostics of electrostatic and electromagnetic fluctuations (4)the PXI based data acquisition system. The LVPD is a double walled, water cooled SS304 vacuum chamber having a diameter and length supplemented by a combination of rotary-root-diffstak pumps, capable of pumping the system to a base pressure of .
The plasma source is a directly heated tungsten wire based multi- filamentary source with number of hairpin shaped filaments () arranged on the periphery of a rectangular ()back plate [figure 1 (b)]. Pulsed plasma (Argon gas, Pressure mbar and ) is produced by applying a discharge voltage of V between the plasma source and anode (vacuum vessel) in an ambient axial magnetic field, G, produced by
a set of coils, garlanded on LVPD.
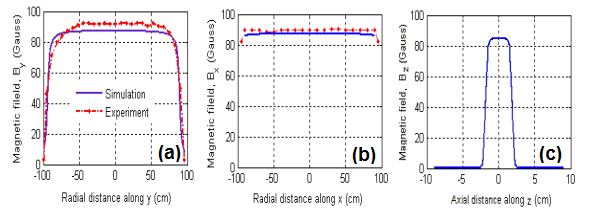
The Electron Energy Filter (EEF) is a rectangular shaped with varying aspect ratio solenoid consisting of 155 numebr of individual coils arranged in sets having a width of . Each set has been designed with equal resistive electrical path length. The EEF is coupled to a capacitor bank based pulse power suply capable of supplying a maximum current of for pulse duration of flat top 5kA_RSI . The EEF produces a uniform transverse magnetic field of with input current of for an EEF activation length of that coprise of 13 identical central coils. EEF has divided the LVPD plasma into three distinct experimental regions namely, Source, EEF and target regions. The source region comprise of multi-filamentary source, the EEF region is the plasma volume enclosed by the solenoid itself and the target region is the region that receives the diffused plasma from the sources region through the EEF region. The fields within the cross-section of the EEF and along the LVPD axis are shown in FIG 3. A comparison of the measured field with that obtained through simulation exhibits good agreement. The magnetic field produced by EEF along the z-axis shows a rapid reduction in its value outside the EEF boundary and attains level of G at a distance of cm from the centre of the solenoid on either side of target and source plasma. This ensures the region of our study is unaffected by the EEF field.
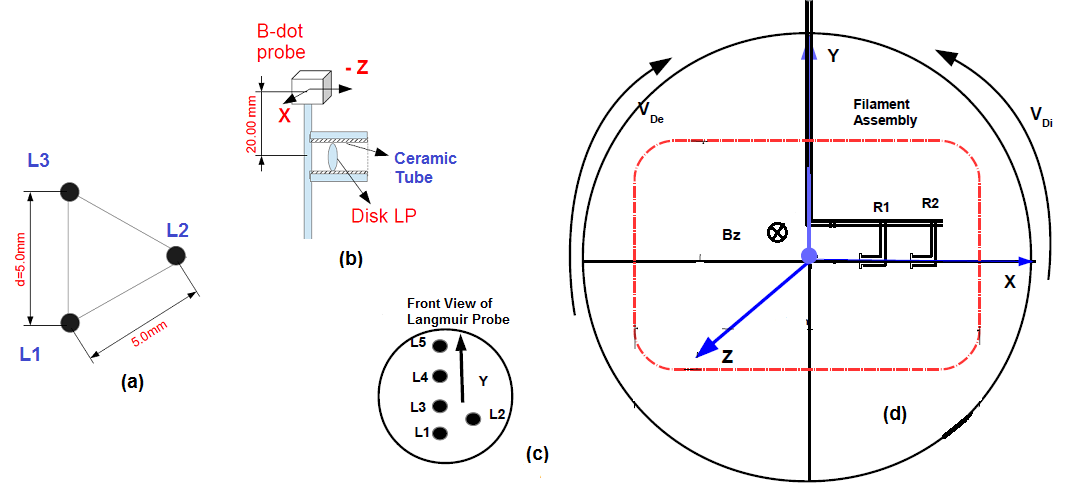
The experiments are carried out in the target region of LVPD where ETG relevant plasma conditions are satisfied that includes finite electron temperature fluctuations (). Plasma parameters are measured by using Langmuir and B-dot probes. The plasma potential is measured by using a hot emissive probe smith_RSI . The electron temperature, is determined from the I-V characteristic of the Langmuir probe. The azimuthal wavelength and phase velocity of mode are measured by an array of cylindrical Langmuir probes (N , diameter mm, length mm, and separation, mm) mounted on a radially movable shaft. The fluctuation data and mean parameters are recorded at sampling rates of and subjected to bandpass filter with lower and upper frequency cut off of Hz to kHz, respectively. Schematic of probe assembly is shown in figure 2.
The electrostatic particle flux data in the region is captured using a specially designed three probe assembly in configuration with length of vertices as, . In this configuration, two probes separated vertically () are measuring the floating potential fluctuations () and third probe () intercepting different magnetic field line is used for measuring the density fluctuations () see figure 2(a). We have also configured probe assembly with two vertically separated emissive probes in order to measure the plasma potential fluctuation () directly. This is carried out to see the effect of temperature fluctuation () over the measurement of poloidal electric field fluctuation () by the use of measured different potential fluctuation. We preferred the probe configuration with three Langmuir probes as our measurements showed that the fluctuation amplitudes for both floating and plasma potential measurement for the measurent of particle flux have no significant variation (). The tungsten wires ( , and ) are used for Langmuir probes construction. They are mounted on a radially moving linear probe drive with probe shaft capable of providing travel length of meter within the vacuum chamber. The ion saturation current signal is obtained by biasing the probe at , and the floating potential measurements are carried out with unbiased floating probes terminated across a high impedance ( ). The large data length of more than data points is used for power spectral analysis and is obtained from ensemble of approximately identical plasma discharges. The data series is constructed by extracting data points from the steady state period of from each plasma discharge. This data is segmented into () bins of data points each for obtaining a higher frequency resolution in spectral analysis.
In finite beta plasma () conditions of target plasma, we carried out measurement of magnetic fluctuation induced particle flux ( ) by simultaneous measurement of correlated fluctuations in and parallel streaming electron flux,. The fluctuations in magnetic field are measured using a - axis magnetic probe (Bifilar configuration, Loop diameter = mm, turns, , mm). The pickup coil is calibrated using a known magnetic field of a Helmholtz coil. A transfer function for the pickup coil is used to derive the magnetic field from the pickup voltage, . Since the output voltage of B-dot probe is proportional to its cross-sectional area (), the number of turns in the coil(), and the time characteristics of the magnetic field(). Hence the obtained output voltage from a B-dot prove is given by . So the time varying magnetic field can be obtained as . Therefore to obtain the magnetic field signal we use RC-integrator with time constant() ms such that ,where is frequency of turbulence. The measured magnetic field is compared for both its amplitude and the frequency spectra. The parallel electron current is measured by a disc Langmuire probe (figure 2(b)) accommodated well inside a cylindrical metallic(SS304) tube with a isolation of ceramic tube.The parallel electron current is measured by a disc probe accommodated well inside a cylindrical hollow ceramic tube. The probe is placed in such a manner that it hardly intercepts the ion current and measures only electron contribution. The fluctuations in parallel electron current density, is measured by keeping the disc probe biased at plasma potential ( ). Both 3-axis probe assembly and the disc probe are mounted on a single ceramic mould so that it samples same plasma.
The data acquired for different parameters is captured in PXI based channel fast data acquisition system. Out of total channels, are single ended channels with maximum sampling rate of , digitization rate of bit, and record length of and single ended channels with maximum sampling rate of , digitization rate of bit and a record length of . The data is retrieved to local computers for post processing.
III Experimental Observation
III.1 Temporal Evolution of Plasma
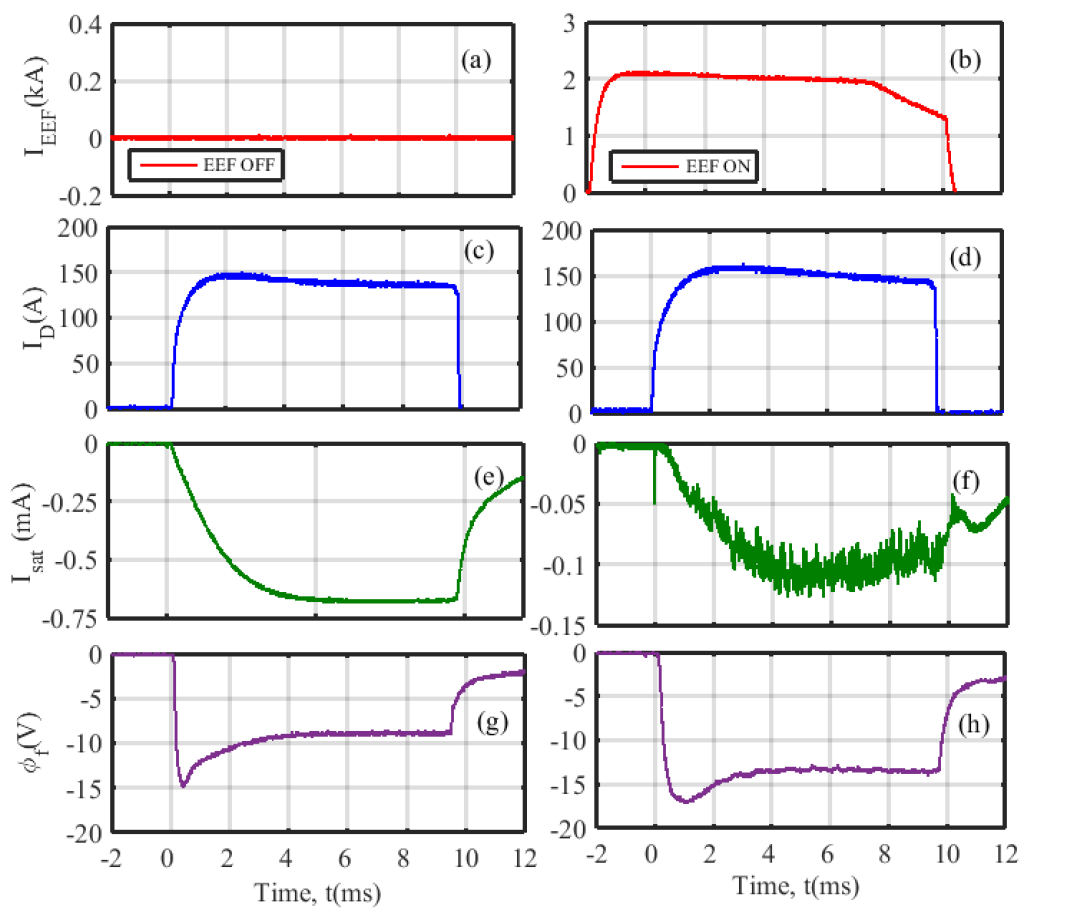
To understand the turbulence features in plasma, the basic plasma parameters such as electron temperature, , plasma density, , and floating potential, , and there fluctuations are measured by using conventional Langmuire probe within the plasma pulse duration. The typical temporal profiles of pulsed plasma parameters in the target region in the presence of EEF OFF and EEF ON are shown in figure 4.
In the experiments, the plasma discharge pulse is accommodated within the EEF pulse length. Figure 4 shows the plasma characteristics measured in the traget region for EEF OFF and EEF ON cases. Figure 4(a)-4(b) shows the typical EEF dischage pulse. Figure 4(c)-4(d) shows the typical discharge current profile with EEF OFF and EEF ON cases in LVPD. Figure 4(e)-4(f) shows the ion saturation current () attains steady in the pulse duration of for both the EEF OFF and EEF ON conditions but it is evident from this figure that the fluctuation levels is more prominent in EEF ON case than EEF OFF case. Since the ion saturation current, ( ), measurement mimics the plasma density, in this view we can assure that the density level can be reduced by almost a factor of in EEF ON case than EEF OFF case. Figure 4(g)-4(h) shows the time evolution of floating potential for EEF OFF and ON cases. The mean floating potential shows an increase with EEF ON case.
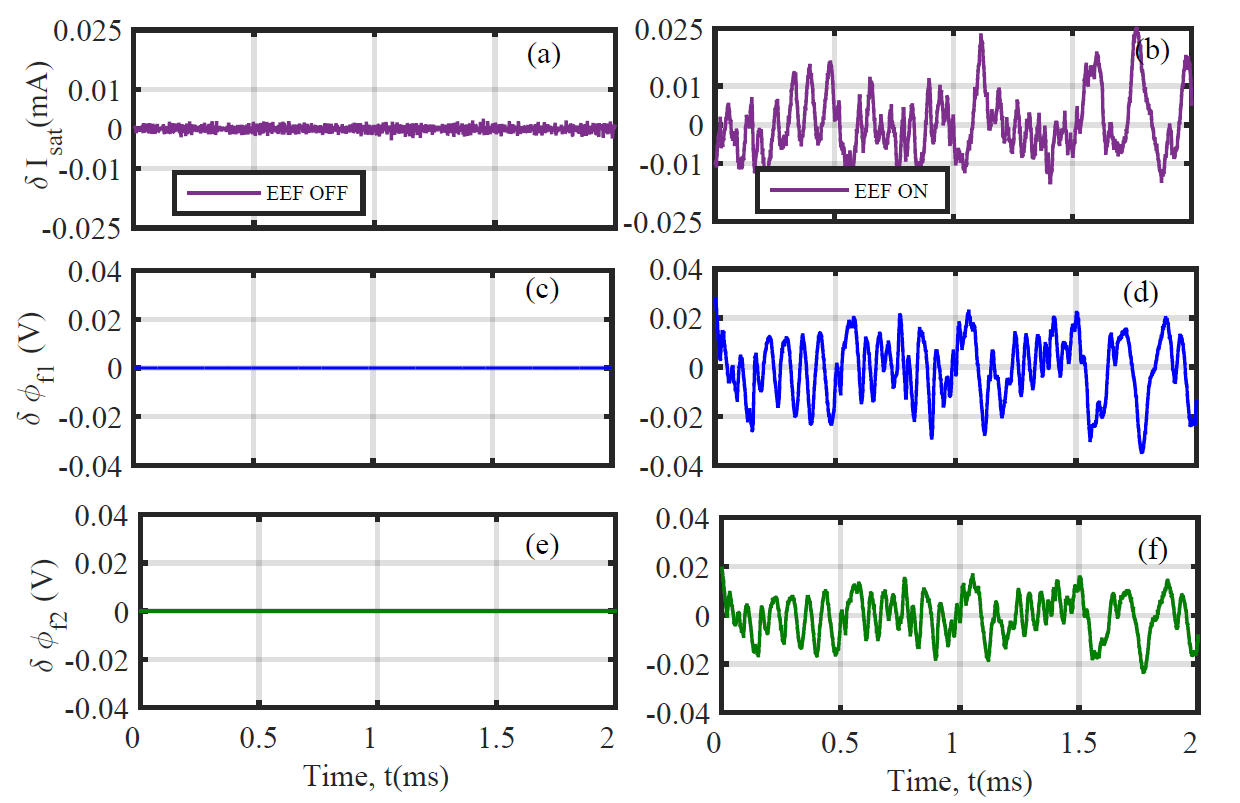
A typical time profile of ion-saturation fluctuation, ( )and potential fluctuations ( and ) in the core region of target plasma ( ) is obtained using flux probe assembly for EEF OFF and EEF ON cases as shown in figure 5. We observed that fluctuations are significantly high when EEF is ON and the fluctuation levels remain close to the noise level when EEF is OFF.
III.2 Radial plasma profiles
Mean radial profiles of basic plasma parameters are shown in figure 6. The plasma density, , electron temperature, , floating potential and plasma potential , are measured for investigating the plasma for EEF OFF and EEF ON case. We carried out investigations for confirming performance of EEF for producing a Maxwellian plasma by validating the relationship in the target region of LVPD plasma. A detailed characterization of the plasma in the presence of EEF was reported by Sushil et alSKSingh_PPCF , where it was shown that various scale lengths of density () and electron temperature() are possible by suitably configuring various elements of EEF.
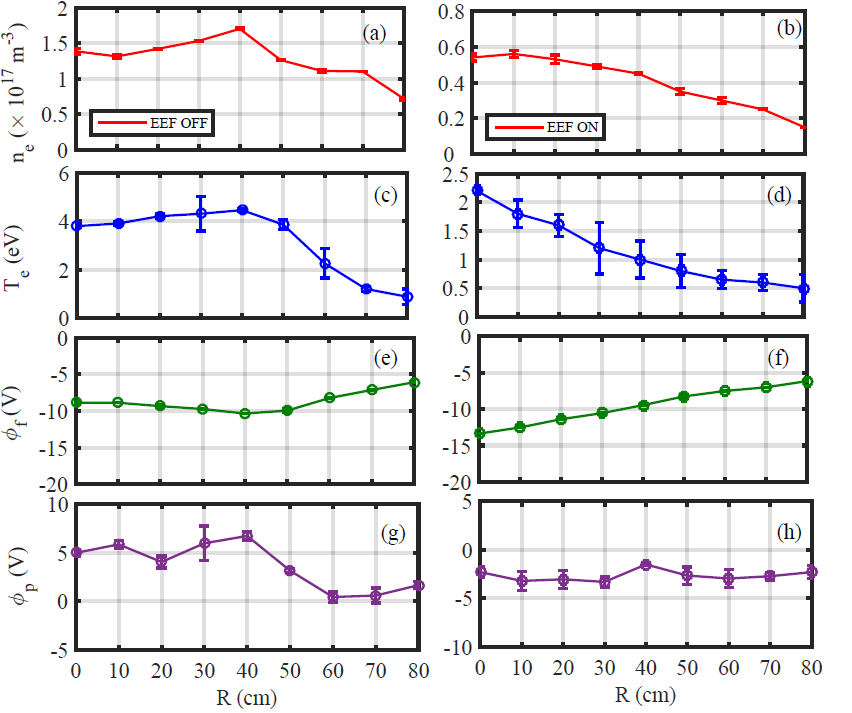
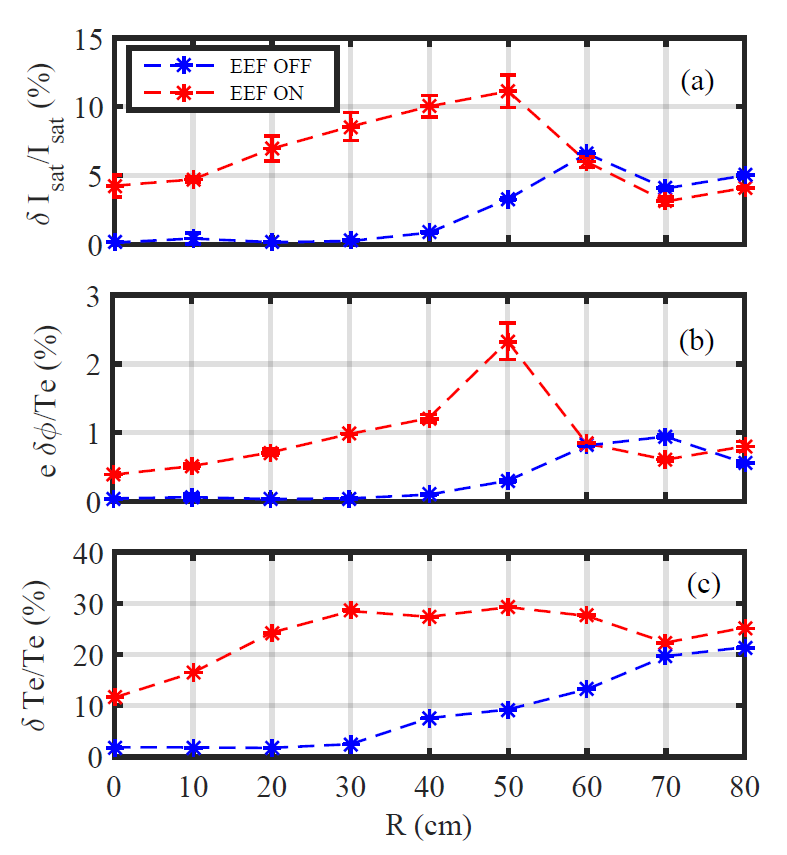
Although, various configurations of the EEF are excited, we restricted our measurements here to the best two cases when ETG conditions is not satisfied i.e. EEF OFF case and when ETG condition is satisfied i.e. EEF ON case in the target plasma of LVPD for studying equilibrium profiles and fluctuations of plasma parameters. For EEF OFF case, the profile of plasma density, , and electron temperature, , is flat in the core region (). The floating potential, () and the plasma potential, (), profiles also follow the density and temperature profiles in the core of target plasma . These profiles shows finite gradient in the outer region (). The profile flatness in the core plasma for EEF OFF case does not satisfy the ETG threshold conditions. As a consequence no significant fluctuations are observed in the core plasma when EEF is OFF [figure 5 ((a), (c) and (e))]. For EEF ON case, the core plasma exhibits a flat density profile () but sharp gradient in electron temperature profile (). The radial floating potential () profile shows a gradient but the plasma potential profile remains flat. This assures the absence of radial electric field in the core plasma. The gradient scale lengths of density, , and electron temperature, satisfying the ETG turbulence threshold conditions (). Existence of ETG turbulence is seen as significant enhancement of density and potential fluctuations in this region [figure 5((b), (d) and (f))]. The core region is dominated solely by the gradient in electron temperature whereas the outer region has pressure gradients. There is no electric field present resulting no rotation in ETG dominant region.The core region has both electrons and ions well confined by the applied magnetic field ( )but as ion larmor radius, cm, the plasma density gets flattened on that scale. The electron temperature follows the electron larmor radius, as it exhibits a significant gradient. The turbulence in the core region is dominated by electron temperature gradient but in outer region, it is primarily due to the pressure gradients. The ions remains unconfined in LVPD target region and they have tendency to move radially out in successive collisions. Electrons follow the field lines and move primarily along the axis in order to maintain quasi-neutrality. The radial profiles for density ( )and potential ( ), temperature ( ) fluctuations are investigated in the core and edge regions and compared for EEF OFF and ON cases. Experimentally special attention is given to the core turbulence where ETG is well established. We observed that fluctuation amplitudes are higher in the core region when EEF is ON. The typical level of normalized fluctuations obtained for density fluctuation, , potential fluctuation, and temperature fluctuation, are , and respectively [figure 7]. These fluctuations in the core region approach nearly noise level when EEF is OFF. In edge region for EEF OFF case, the level of fluctuations increases, reason for this may be the enhanced gradient observed in the mean plasma profiles and wall effects. It is interesting to note here that the temperature fluctuations remain low in EEF OFF case. Also, in the edge region, electron temperature gradient is insignificant for EEF ON plasma.
III.3 Cross Correlation
Nature of turbulence and their mutual correlation can be understood better by studying cross-correlation, and power spectra. These are necessary for identifying the nature of instability. We have measured the correlation coefficients between density and potential fluctuations for EEF OFF and ON cases as shown in Fig 8.
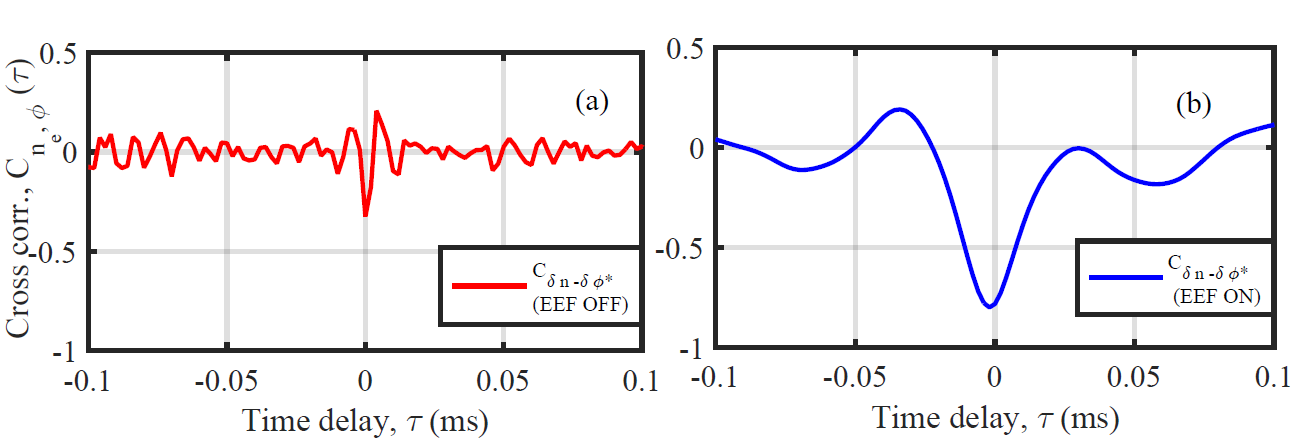
The normalized density fluctuations and the potential are found to be strongly anti-correlated which is for ETG, .
The correlation coefficient . Its value reduces
to and becomes weakly correlated when EEF is switched off. These measurements are
carried out using array of three probe assembly, where probe separation between the pair
probes is mm. There may be a slight spatial de-correlation as the probes used are not located
on the same magnetic field line.
III.4 Correlation Length
The radial correlation lengths are obtained for the density fluctuations in the ETG dominated
and edge regions. For this, a pair of probes is used and one of the probe is kept stationary
while other moves radially outward in a step of cm. These measurements are undertaken so
as to establish the region where observed fluctuations remains correlated. In ETG dominated
region, this distance comes out to be cm and in the edge region, it reduces to cm
respectively as shown in figure 9.

III.5 Power Spectra Plot
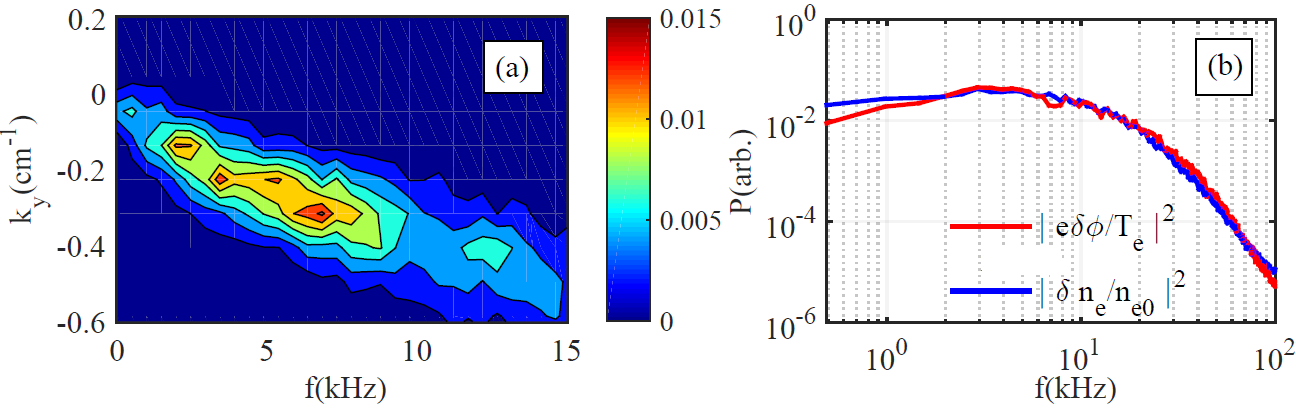
The turbulence observed in the core region exhibits broad band spectra with significant power between kHz. As shown in figure 10(a) the mode frequency observed in the lower hybrid range, i.e. , where , ion cyclotron frequency, , electron cyclotron frequency also satisfying the following characteristics such as , , and , where are electron Larmor radii’s respectively, which suggest that the instability driving the turbulence is ETG. The joint wave number–frequency spectrum is determined for the fluctuations as shown in figure 10(a). We have used data obtained from probes separated in the vertical direction with probe spacing cm. The spectrum peaks at kHz with perpendicular wave number . The spectrum exhibits a width in frequency, , and wave vector , supporting its broad band nature. The plasma fluctuation has a long poloidal wavelength, cm. The phase velocity of the observed mode is , in poloidal direction. We have put probe identifiers for the correct assessment of drift direction (FIG 2 ). The k-spectra shows an asymmetrical distribution of power to different modes. The auto power spectra of density () and potential () fluctuation presents a broad band spectra with peak power residing within frequency, kHz [figure 10(b)].
III.6 Phase Velocity
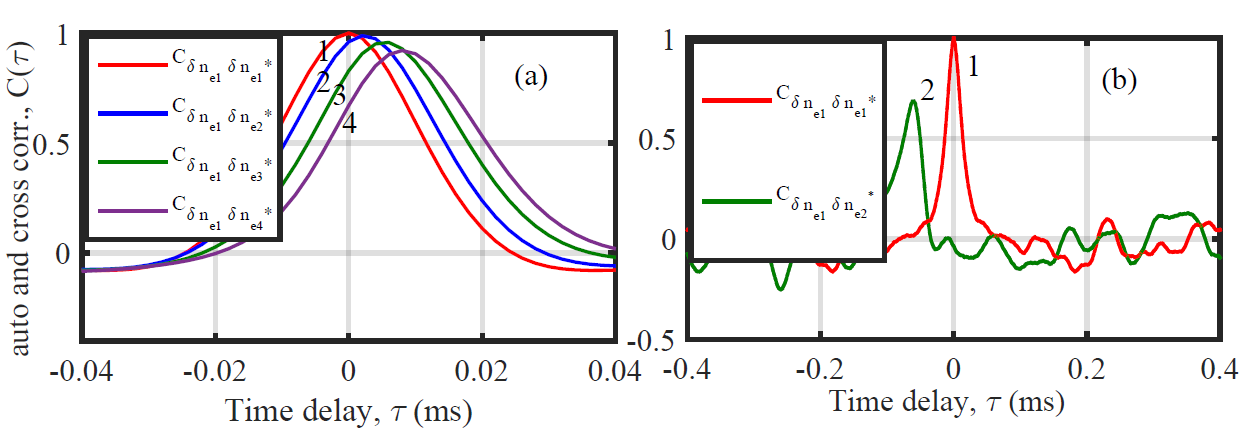
The radial phase velocity for density fluctuations shows that the fluctuations propagating radially inward towards the core of the device. The measurements are carried out by using two radially separated Langmuir probes kept at and respectively. Fig [11] shows the auto and cross correlation for density fluctuations measured by the probes. From the cross correlation time, the radial phase velocity is measured to be, . Same measurements were repeated at different radial locations in the core plasma and are found that the fluctuation phase velocity is radially inward. Similarly, poloidal phase velocity has been measured by using two vertically separated Langmuir probes ( ). The measurement shows that the order of poloidal phase velocity ( ) is comparable to radial phase velocity of the fluctuations.
IV Plasma Transport
In this section we will show the measurement that will estimate the particle transport due to the ETG driven fluctuations in the core target plasma of LVPD and hence the net plasma transport. We will calculate the fluctuation induced electrostatic flux and electromagnetic flux in order to estimate net particle flux due to fluctuation and in the next section we will compare the experimentally measured electrostatic particle flux with theoretical estimates.
IV.1 Electrostatic Particle Flux estimation
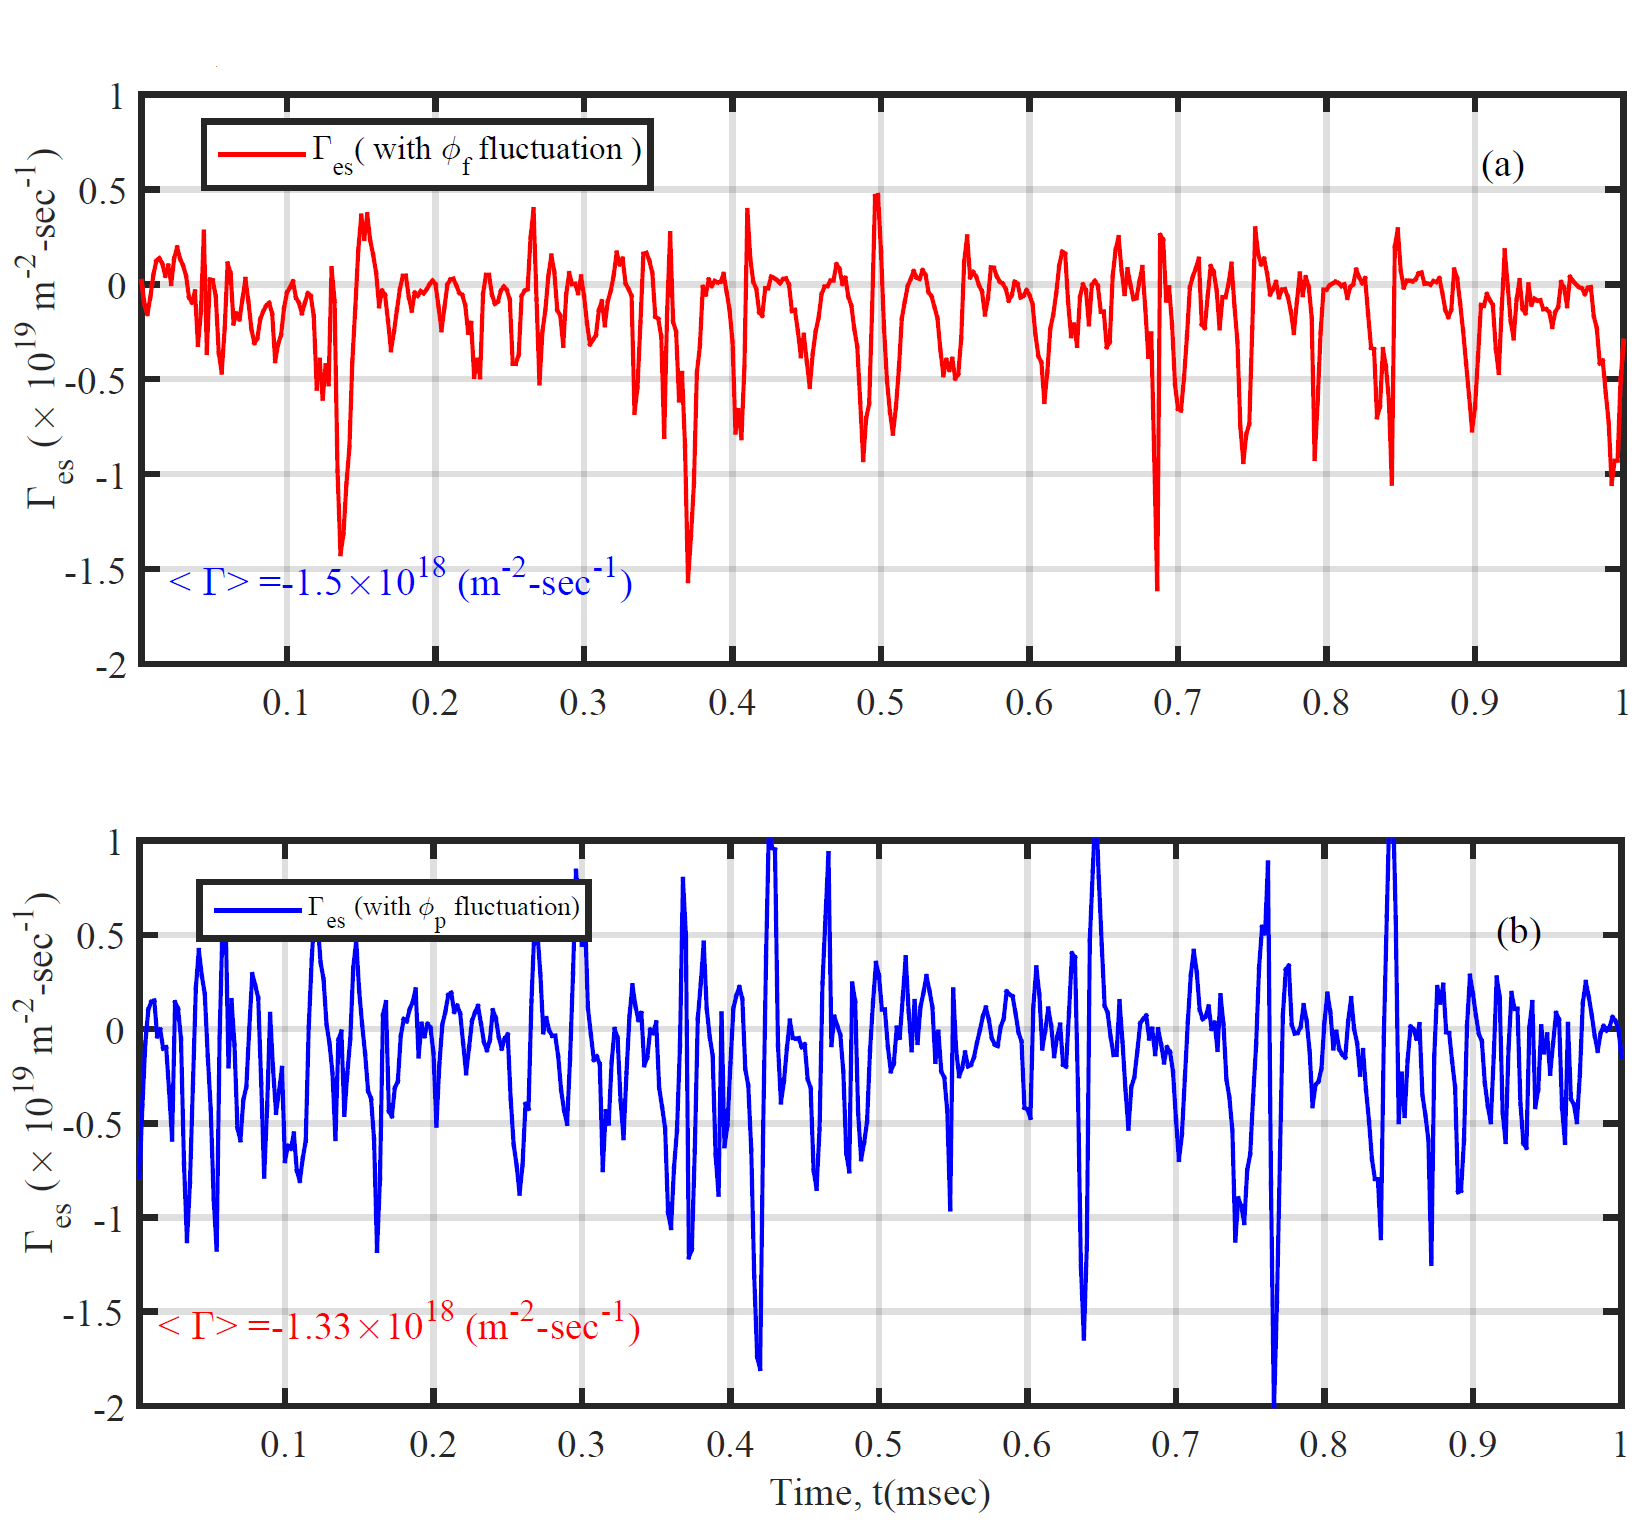
The electrostatic particle flux ( ) is measured from the correlated density fluctuation () and fluctuation radial velocity () estimated from poloidally fluctuating electric field () by drift, where is measured by two poloidally separted probes as , where is probe separation. Then the electrostatic particle flux is calculated as, . In the temperature fluctuations, electric field fluctuation measurement for estimation the particle flux with floating potential fluctuation measurements may not yield correct results. We therefore have compared the electrostatic particle fluxes by the estimation of electric field calculated from the floating potential () as well as plasma potential (). From fig 12 it is clear that both measurement of particle flux are qualitatively and quantitatively are within the error bar. As there is no significant difference is observed in the flux estimation therefore, for our convenience we carried out further estimations of particle flux using floating potential techniques.
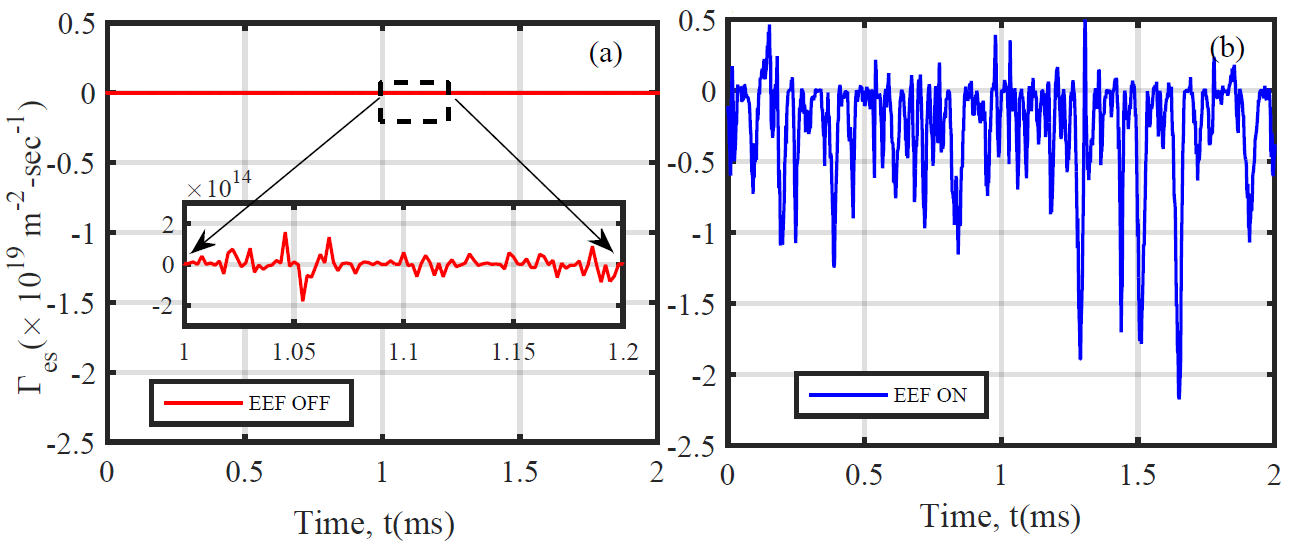
Further experiments are carried out for flux measured by Langmuir probes at R = 30cm for EEF OFF and ON cases. It is evident from the figure 13 that the electrostatic flux is significantly enhanced () when EEF is ON and ETG conditions are established. In the case of EEF OFF the electrostatic flux () remains insignificant and is lower by an order of () from EEF ON case. Also, it can be commented that the observed electrostatic flux in ETG region has significant and its negative sign suggests that the net particle flux induced due to the fluctuations are moving radially inward.
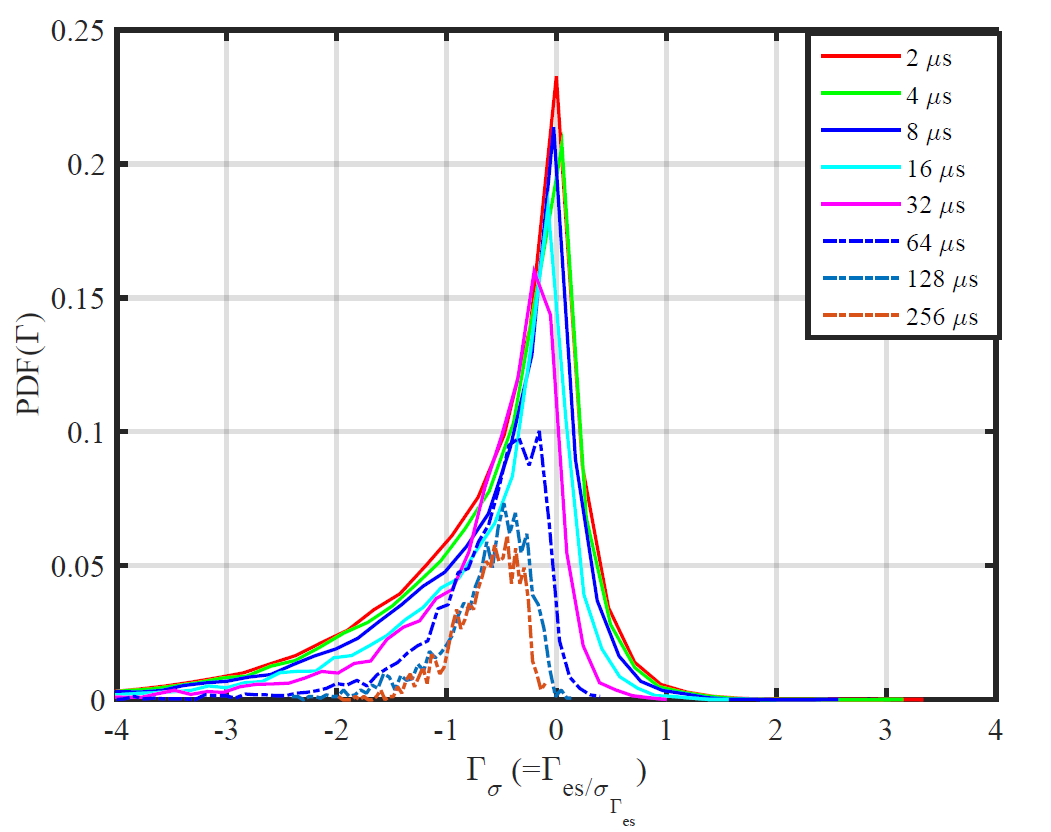
To ensure the nature of particle flux in ETG region, the statistical analysis is performed using sufficient length of data points. The PDF analysis of particle flux is non-Gaussian in nature [figure 14]. It is asymmetric and negatively skewed. The skewness and kurtosis obtained are and , respectively. The negative skewness indicates a predominance of large negative flux.
Following the work of Carreras Carreras , the PDF for the fluctuation-induced turbulent flux is
| (1) |
where measure the strength and sign of the correlation between density and velocity fluctuation , the parameters and are the square of the variance of and , respectively. is modified Bessel function and its argument is symmetric with respect to the flux direction. By the use of equation 1 the averaged flux is derived as
| (2) |
For the averaged flux to be outward, and it is also an indirect measurement of relative phase between and and is described by the expression
| (3) |
Taking the phase information from experimental observation as , and the use of equation 3 the value of which is greater than , suggesting averaged flux to be inward. The calculated flux after measuring , by the use of comes out , having same order what we have obtained experimentally.
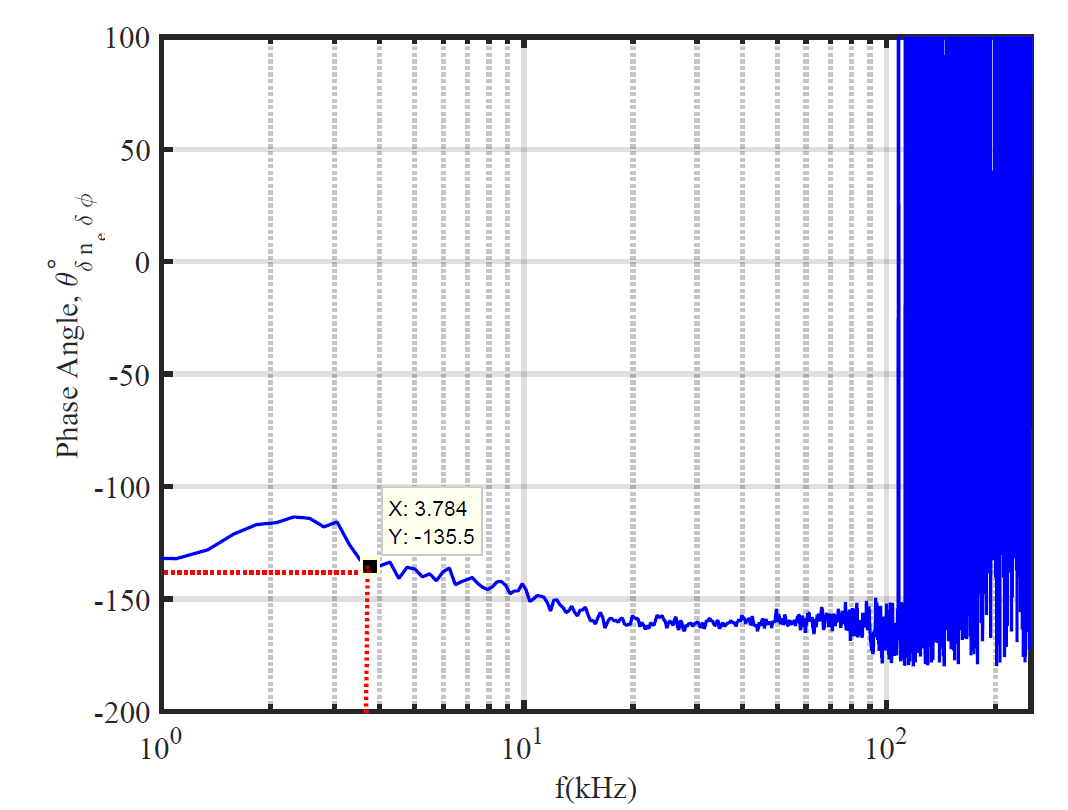
We have observed fluctuation induced finite inward particle flux from the correlated density and potential fluctuations. Theory predicts a finite phase delay ( ) between the density and potential fluctuations as a consequence of which a net turbulent particle transport takes place. We have measured the cross phase between the density and potential fluctuations as a function of frequency at [Figure 15]. It can be seen that the cross phase angle corresponding to our frequency band of interest is finite and is significantly deviated from . It should be noted that for EEF OFF case, potential fluctuations are insignificant and are not correlated with density fluctuations hence the particle flux is negligible comparing with EEF ON case.
IV.2 Electromagnetic Particle Flux
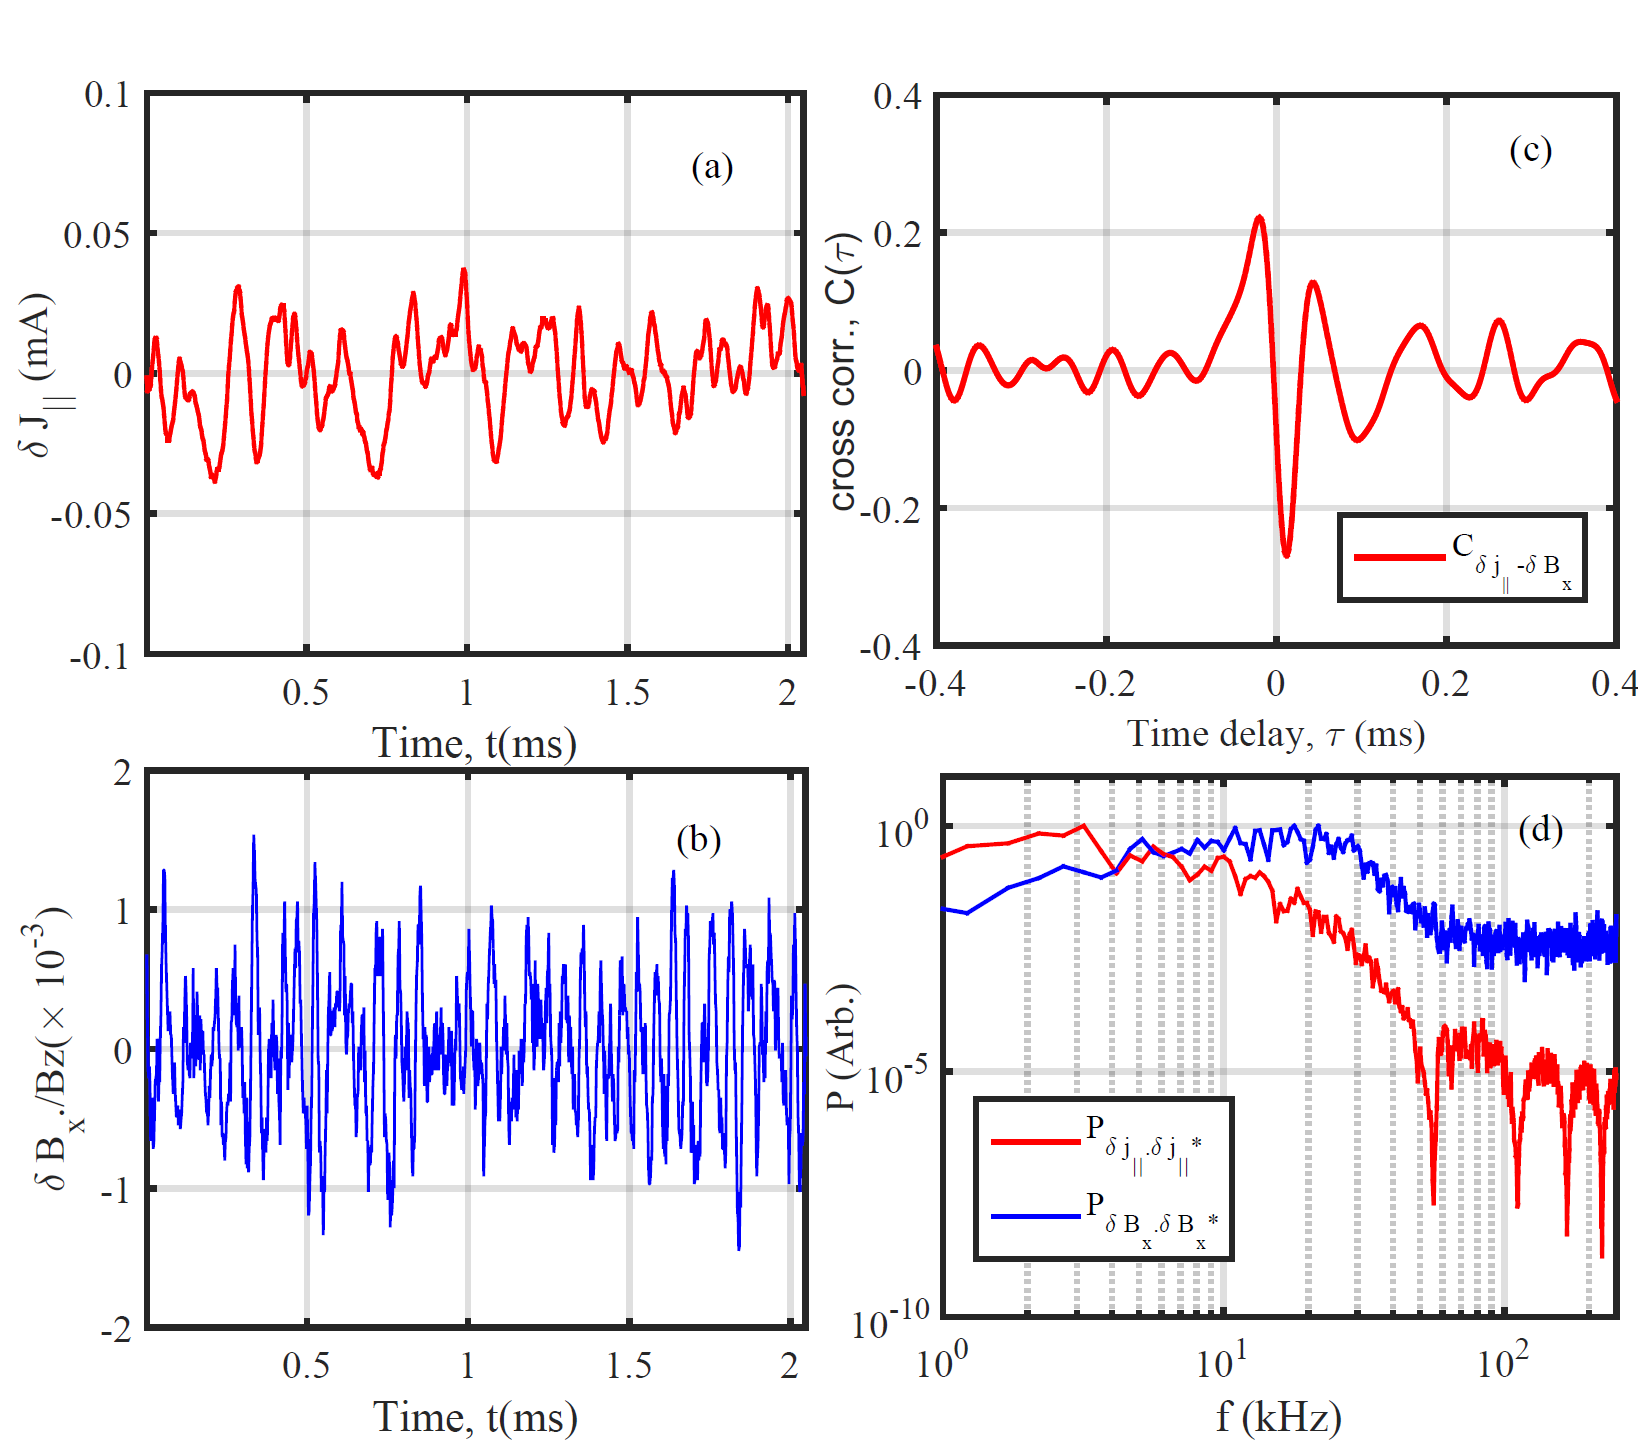
To understand the electromagnetic effect of ETG turbulence over the particle transport, a experimental work is carried out by simultaneous measurement of correlated fluctuation in radial magnetic field () and parallel streaming electron flux,(). FIG 16 shows the time profile of normalized parallel current fluctuation () and radial magnetic field fluctuation () with a level of and respectively. Their corresponding cross-correlation and power spectra are obtained which is shown in figure 16 (c) and figure 16 (d), respectively. From these plots we can infer that parallel electron current and radially magnetic field fluctuation share a common frequency band but they are weakly correlated as depicted from the cross correlation plot.
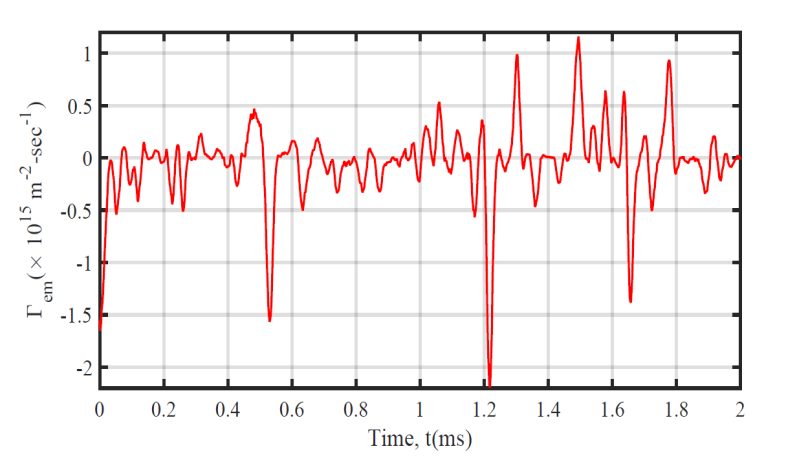
The electromagnetic electron particle flux ()can be estimated as
. The particle flux obtained from the simultaneous measurement of both parallel electron current fluctuation, and radial magnetic field fluctuation, is shown in figure 17. The magnitude of obtained flux is of the order of . On comparison with electrostatic counterpart, we observed that , hence contribution of magnetic flux to total flux is negligible for this experimental observation.
The net fluctuation induced particle flux is sum of electrostatic and electromagnetic components,
Irrespective of high beta plasma in LVPD, observation suggests that it’s the electro static counterpart only, which dominates the net turbulent particle flux.
V Theoretical Explanation
The radial profile of time averaged particle flux () and density() potential ()
cross correlation angle () is shown in Fig 18 It is seen that the particle flux
() is radially inward in the inner region and is roughly maximizing at radial location where
is maximum. Also the cross angle is most deviated from where is maximum. The profile of particle
flux is set by the product of density and potential fluctuation amplitudes and sinus of the cross angle.
Experimental
results are compared with the theoretical model proposed by R Singh et al.RSingh_2013 for turbulent flux in the electrostatic ETG turbulence. To make things clear we provide in the following the essential of model. Ions are considered as unmagnetized and collisionless. In the limit , ETG mode resonates with background ions, which deviates from Boltzmannian.
| (4) |
This non-adiabatic ion-response induces a particle flux due to phase lag between density and potential fluctuation. The particle flux is given by
| (5) |
where is the cross angle between density and potential fluctuation. The particle flux expression for ion response is given by eqn 4 becomes
| (6) |
where , is electron larmor radius, is real frequency. Clearly the particle flux is negative because of real frequency is negative for positive . The flux is in gnereral proportional to and survives even when the density profile becomes flat. In the flat density region flux is proportional to and hence is of purely thermodiffusive nature. A thrmodiffusivity can be defined as follows
| (7) | |||
Clearly thermodiffusivity is a nonlinear function of and is proportional to . The experimental results are compared with theoretical values for cross angle obtained from Eq 4 and for flux from Eq. 5. For each comparison the value for and for are choosen corresponding to peak power of density perturbation in space.
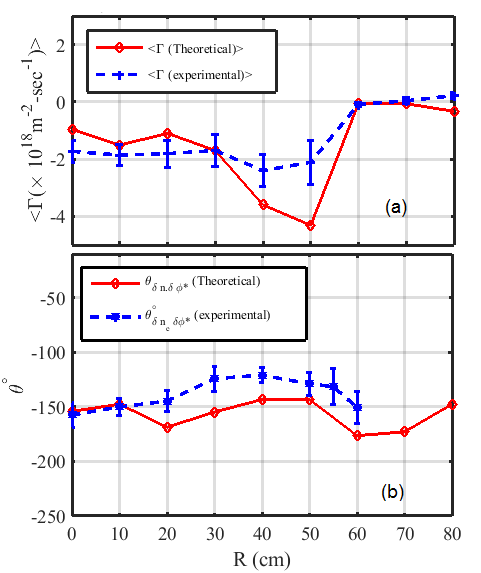
As shown in fig 18 , the radial profiles of cross phase and flux thus obtained follows similar trend as the experimental profiles and has good agreement with each other. The small quantitative difference between theory and experiment could be due to the fact that for theoretical estimate we only consider the mode with maximum power while in experimental observation all the modes are contributing to produce the net particle flux larger than the theoretical estimates. However the same argument does not seem to hold around the maximum flux region where the theoretical estimates corresponding to maximum power mode is larger than experimental observation. The electromagnetic particle flux on the other hand is given by
| (8) |
which vanishes since the summand is odd on and also the fact that it has no real part.
By the use of the transport equation, for electron, written as
| (9) |
| (10) |
We can obtained the change in entropy as derived by Horton et. al. Horton_entropy due to the anomalous processes is given by
| (11) |
Where , is the entropy of the system, is particle flux, is thermal flux, and is rate of change of wave/fluctuation energy density due to resonant interactions with particles.
From the equation 11 we find that the inward anomalous particle flux leads the reduction in entropy of system which should be compensated by the radial thermal flux is such that the entropy production from anomalous transport should be positive definite.
VI Summary and Conclusion
We studied the particle transport due to turbulent fluctuations in the LVPD. The sources of the underlying turbulence has been established to be due to electron temperature gradient driven in the core of the target region of the device. This is ensured by making the target region free from the energetic electrons by using transverse magnetic field with the help of an EEF. Phase velocity, density -potential correlation and turbulence power spectra confirms that the observed turbulence is driven by ETG. Radial profile of turbulent particle flux and density-potential cross phase () has been measured. It is found that the net electrostatic flux is negative i.e., radially inward and is order . The particle flux maximizes in the region where the maximum clearly indicative that the flux is due to the fluctuation resulting from ETG. A net particle flux results from the phase difference between the density and potential fluctuation other than . The Radial profile of density-potential cross phase shows that the cross phase angle deviates from the most where is maximum. Turbulence intensity also maximizes roughly at the location where is maximum which act in synergy with the cross phase angle to maximize the flux. The experimental cross phase angle and flux has been compared with the cross phase and flux resulting due to the non-adiabatic ion response due to the resonant interaction of the ions with the ETG mode . The experimental and theoretical results quantitatively follows the same trend across the radius and matches within with each other.
Electromagnetic component of the particle flux has been also measured and has been found to be insignificant compared to level of electrostatic particle flux . Hence complete radial profile of the electromagnetic flux is not attempted. The temporal correlation of parallel electron current and radial magnetic fluctuations are found too weak to produce a significant flux. This is consistent with the fact that theoretically the electromagnetic particle flux in ETG turbulence is expected to be zero.
References
References
- (1) S.K. Mattoo, S.K. Singh, L.M. Awasthi, R.Singh and P.K. Kaw, Phys. Rev. Lett. 108, 255007 (2012).
- (2) Althaus LG, Benvenuto OG, MNRAS 278:981-84(1996).
- (3) Bogdan TJ, Cattaneo F, Malagoli A., Astrophys. J. 407:316-29 (1993).
- (4) G R Tynan, A Fujisawa, and G McKee, Plasma Phys. Controlled Fusion 51, 113001(2009).
- (5) J. Connor, Plasma Phys Controlled Fusion, 37, A119 (1995)
- (6) Aschwanden, M.J., Physics of Solar Corona: An Introduction with Problems and Solutions (Springer-Verlag) (March 21), ISBN-10:3540307656 (2006).
- (7) Wei. X, V. Sokolov, and A.K. Sen, Phys. Plasmas 17, 042108 (2010)
- (8) Moon C., Toshiro Kanchocko and RikizoHatakeyama, Phys. Rev. Lett., 111, 115001(20143)
- (9) Ren Y., S.M. Kane, E. Mazzucato, Phys. Rev. Lett. 106,165005(2011).
- (10) Horton W , Phys. Plasmas 11 2600(2004)
- (11) S.K. Mattoo, V.P. Anitha, L.M. Awasthi, Rev. Sci. Instrum. 72, 42109(2010).
- (12) S.K. Singh, P.K. Srivastava, L.M. Awasthi, S.K. Mattoo, A.K. Sanyasi, R.Singh, and P.K. Kaw, Rev. Sci. Instrum. 85, 033507 (2014).
- (13) P. K. Srivastava, S. K. Singh, A. K. Sanyasi, L.M. Awasthi, and S.K. Mattoo, Rev. Sci. Instrum. 87, 073501(2016).
- (14) J.R. Smith, N. Hershkowitz and P. Coakley , Rev. Sci. Instrum., 2, 50(1979).
- (15) Everson E.T., P.Pribyl, C.G. Constantin, A. Zylstra, D. Schaeffer, N.L. Kugland, and C. Niemann, Rev. Sci. Instrum. 80, 113505(2009)
- (16) S K Singh, L M Awasthi, S K Mattoo, P K Srivastava, R Singh and P K Kaw, Plasma Phys. Controlled Fusion 54, 124015(2012).
- (17) R. Singh, VarunTangri, H. Nordman and J. Weiland, Phys. Plasmas 10, 8(2001)
- (18) Beall J.M., Y.C. Kim, and E.J. Powers, J. Appl. Phys. 53, 3933(1982)
- (19) M. Endler, H. Niedermeyer, L. Giannone, E. Holzhaver, A.Rudyj, G. Theimer, N. Tsosis, ASDEX TEAM, Nucl. Fusion 35, 11 (1995).
- (20) R. Jha, P. K. Kaw, S. K. Mattoo et al., Nucl. Fusion, 33, 8(1993).
- (21) V. Sokolov and A.K. Sen, Phys. Rev. Lett. 107, 155001(2011).
- (22) H. Lin, Roger D. bengston and Ch. P. Ritz, Phys. Fluids B, 1, 10(1989)
- (23) R. Jha, A. Das, N. Bisai and P. Kaw, AIP Conf. Proc. 1308, 13 (2010).
- (24) B.A. Carreras, C. Hidalgo, E. Sanchez, M.A. pedrosa, R. Balbin, I Garcia-Cortes, B. van Milligen, D. E. Newman, and V.E. Lynch, Phys. Plasmas 3, 2664(1996).
- (25) C.W. Horton, Turbulent Transport in Magnetized Plasmas (World Scientific, Hackensack, NJ, 2012)
- (26) R. Singh, Hogun Jhang, and P.H. Diamond, Phys. Plasmas 20, 112506 (2013).
- (27) Wendell HORTON Jr, Phys. Lett. 67A, 2 (1978).