The Transition of a Type IIL Supernova into a Supernova Remnant:
Late-time Observations of SN 2013by
Abstract
We present early-time Swift and Chandra X-ray data along with late-time optical and near-infrared observations of SN 2013by, a Type IIL supernova (SN) that occurred in the nearby spiral galaxy ESO 138G10 ( Mpc). Optical and NIR photometry and spectroscopy follow the late-time evolution of the supernova from days +89 to +457 post-maximum brightness. The optical spectra and X-ray light curves are consistent with the picture of a SN having prolonged interaction with circumstellar material (CSM) that accelerates the transition from supernova to supernova remnant (SNR). Specifically, we find SN 2013by’s H profile exhibits significant broadening ( 10,000 km s-1) on day +457, the likely consequence of high-velocity, H-rich material being excited by a reverse shock. A relatively flat X-ray light curve is observed that cannot be modeled using inverse-Compton scattering processes alone but requires an additional energy source most likely originating from the SN-CSM interaction. In addition, we see the first overtone of CO emission near 2.3 on day +152, signaling the formation of molecules and dust in the SN ejecta and is the first time CO has been detected in a Type IIL supernova. We compare SN 2013by to Type IIP supernovae whose spectra show the rarely observed SN-to-SNR transition in varying degrees and conclude that Type IIL SNe may enter the remnant phase at earlier epochs than their Type IIP counterparts.
Subject headings:
Supernovae: General Supernovae: Individual: SN 2013by1. Introduction
Type II supernovae, the most common type of core-collapse stellar explosion, are divided into two broad classes, Type IIL and IIP, based on their lightcurves (CCSNe; Li et al. 2011). They are associated with red supergiant progenitor stars that have initial masses between 8-20 M⊙, but the origins of their observational diversity are not fully understood (Smartt et al., 2009; Valenti et al., 2016).
Type IIP SNe (SN IIP) are defined by the nearly uniform plateaus in their lightcurves that last 100 days (Arcavi et al., 2012; Faran et al., 2014). In contrast, Type IIL (SN IIL) light curves decline linearly and exhibit a magnitude change of more than 0.5 mags in the first 50 days post maximum brightness (s50 0.5 mag) (Li et al., 2011; Faran et al., 2014). SNe IIP generally have fainter peak magnitudes , while SNe IIL are the most luminous SNe II with a nearly uniform peak magnitude of roughly -17.5 (Filippenko, 1997; Li et al., 2011), though they can reach magnitudes of up to -19.3 at their brightest (Richardson et al., 2002).
The prevailing view is that the progenitors of Type IIL SNe are higher mass stars (20 M⊙) that have larger radii and less hydrogen than the progenitors of most Type IIP (Blinnikov & Bartunov, 1993; Filippenko, 1997). SN IIL also produce more O-rich ejecta and typically have stronger [O I]/H ratios than the other Type II subclasses (Faran et al., 2014).
However, some recent studies suggest that Type IIP and IIL SNe may be closely related (Anderson et al., 2014; Sanders et al., 2015; Valenti et al., 2015). Late-time photometry of SNe IIL can exhibit a significant drop in magnitude roughly 100 days past maximum brightness, resembling the one seen in Type IIP SN after the plateau phase. This suggests that the nebular phases of these subtypes may be similar (Valenti et al., 2015).
In addition, it is possible to recreate Type IIL and IIP lightcurves using the same progenitor but with varying degrees of circumstellar material (CSM) surrounding the star. This may explain why some SN appear to take on characteristics of multiple Type II subclasses as they evolve, like SN 2013fs (Morozova et al., 2017).
SN 2013by was discovered on 23 April 2013 in the galaxy ESO 138-G10 at coordinates (2000) = 16h 59m 02.43s, (2000) = 60∘ 11′ 418 by the Backyard Observatory Supernova Search (BOSS) (Parker et al., 2013). Valenti et al. (2015) observed it to have a short rise time of roughly 10 days, reaching a peak absolute magnitude of MV = -18.2 on 1 May 2013 assuming a distance of 14.8 Mpc. The SN then declined at a rate of s50 = 1.46 mag, placing it well above the SN IIL threshold defined by Li et al. (2011). This was followed by a sharp decline in magnitude some 80 days post explosion.
Spectra obtained in the first few weeks post-shock breakout showed features consistent with moderately interacting SNe II/IIn (Milisavljevic et al., 2013). A comprehensive investigation by Valenti et al. (2015) led them to conclude that SN ejecta interacted with surrounding circumstellar material for more than one month after post-max.
Here we report on early X-ray observations from +2 to +70 days post-maximum brightness plus optical and near infra-red observations from +89 to +457 days of SN 2013by. In §2 we present our data and observations, in §3 we discuss the results of our photometry and spectroscopy, and in §4 we investigate the implications these results have on the SN environment and the progenitor system. Throughout this work we adopt the NASA Extragalactic Database111http://ned.ipac.caltech.edu/ distance to the host galaxy ESO 138-G10 to be Mpc ( = ), which is derived from the radial velocity of km s-1 (Koribalski et al., 2004) assuming H km s−1 Mpc-1 after correcting for Local Group infall towards the Virgo cluster.
2. Data Set
2.1. Optical and Near Infrared Observations
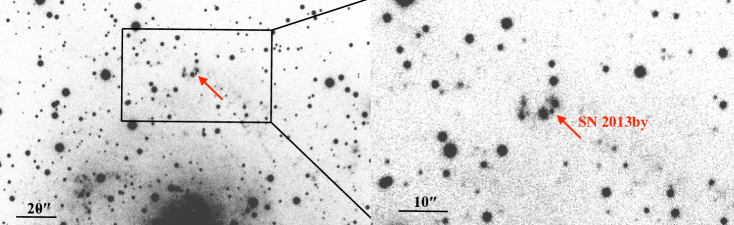
In Figure 1 we present Sloan images of SN 2013by in ESO 138-G10 obtained with the 6.5m Magellan Baade telescope at the Las Campanas Observatory. At day +457 the SN can be seen between two adjacent sources north of the host galaxy’s center. Multiple epochs of low-resolution optical spectra of SN 2013by were also obtained.
The spectra were taken with the IMACS f/2 camera using the E2V CCD with a 300 lines mm-1 6700 Å grating in combination with a 07 wide slit. A set of s exposures were taken on 29 September 2013 (day +151) and 3 February 2014 (day +278), and s exposures were obtained on 1 August 2014 (day +457). Acquisition images in the Sloan filter, which are listed in Table 1, were obtained at each epoch and used for our photometry.
Three epochs of near-infrared spectra were also obtained in 2013 and 2014 at days +89, +152, and +279 with the Baade telescope using the FoldedPort Infrared Echellette (FIRE; Simcoe et al. 2008) in combination with the low-dispersion prism, a wide slit, and a Hawaii-2RG detector. The spectral resolution was in -band. Total exposure times were between 1200-1800s and split up into individual 158s integrations that were dithered along the slit in an ABBA pattern. Details of all our observations can be found in Tables 1 and 2.
Data reduction of the images and optical spectra was done using iraf222IRAF is distributed by the National Optical Astronomy Observatories, which are operated by the Association of Universities for Research in Astronomy, Inc., under cooperative agreement with the National Science Foundation. and consisted of bias and background subtraction, wavelength calibration, and aperture extraction. FIRE data were reduced following standard procedures (Hsiao et al., 2013) using a IDL pipeline (FIREHOSE). The host galaxy recession velocity was removed from all spectra.
| Date | Instrument | Exposure Time | Band | Mag |
|---|---|---|---|---|
| (s) | (r′) | |||
| 29 Sept 2013 | IMACS | 3 | Sloan r | 17.14 0.07 |
| 3 Feb 2014 | IMACS | 30 | Sloan r | 17.99 0.17 |
| 1 Aug 2014 | IMACS | 10 | Sloan r | 20.78 0.08 |
| Date | Instrument | Exposure Time | Wavelength |
|---|---|---|---|
| (s) | Region | ||
| 29 July 2013 | FIRE | 8 x 158 | NIR |
| 29 Sept 2013 | IMACS | 2 x 1200 | Optical |
| 30 Sept 2013 | FIRE | 10 x 158 | NIR |
| 3 Feb 2014 | IMACS | 2 x 1200 | Optical |
| 4 Feb 2014 | FIRE | 10 x 158 | NIR |
| 1 Aug 2014 | IMACS | 2 x 1800 | Optical |
2.2. X-Ray Observations
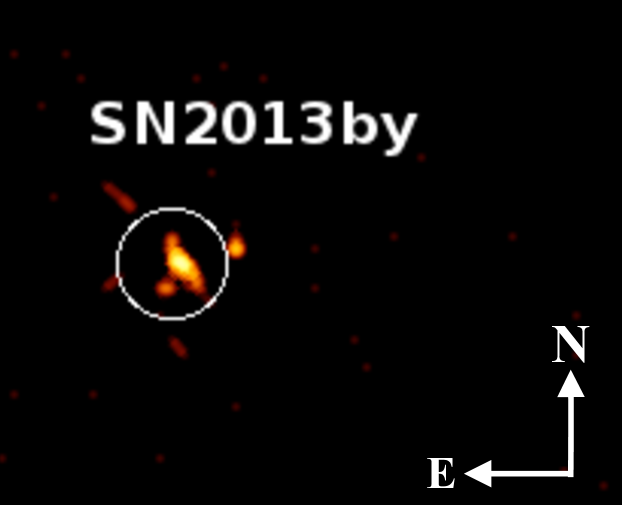
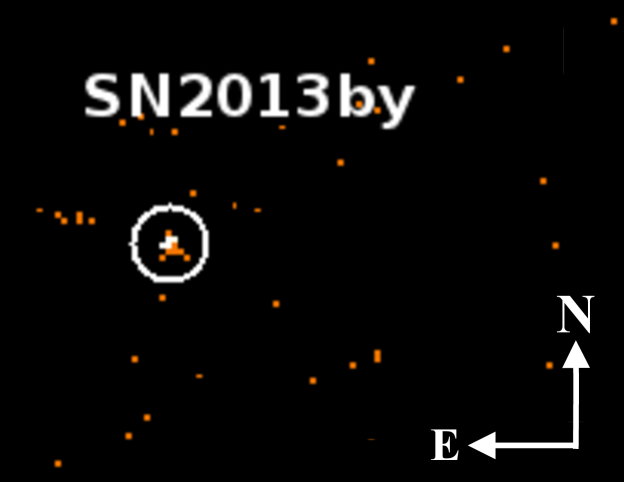
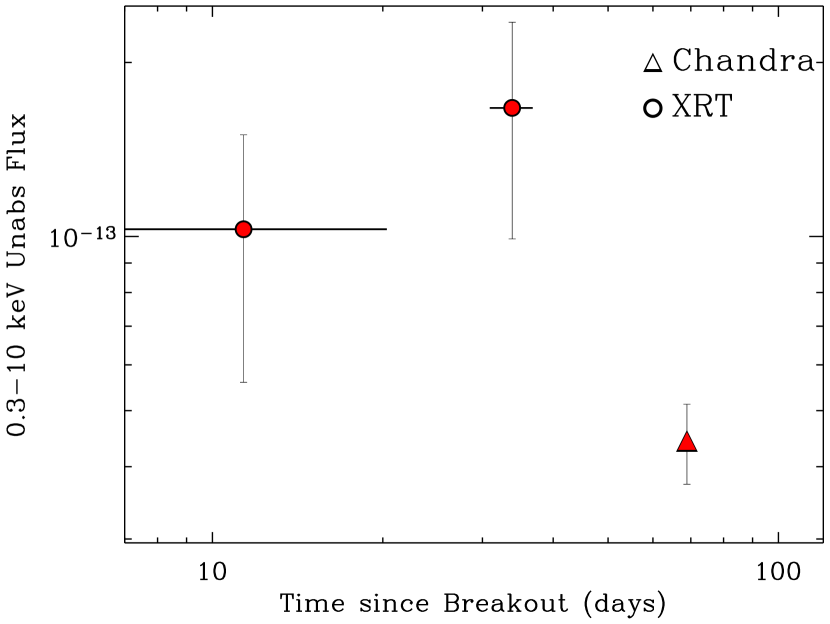
The Swift X-Ray Telescope (Gehrels et al., 2004; Burrows et al., 2005) started observing SN 2013by on 24 April 2013, just 2 days after the estimated shock breakout (Valenti et al., 2015) (PI Margutti). XRT data was analyzed using HEASOFT (v6.15) along with the corresponding calibration files. Standard filtering and screening criteria was applied. An X-ray source was clearly detected by the XRT at the position of SN 2013by (Fig. 2) until days since breakout. At t days the X-ray source was too faint and no longer detected by Swift-XRT (Fig. 3).
Follow-up X-ray imaging of SN 2013by by the Chandra X-ray Observatory (CXO) with ACIS-S was initiated on 30 June 2013, corresponding to days since breakout (PI Pooley), see Figure 2. Data have been reduced with the CIAO software package (version 4.6) and corresponding calibration files. Standard ACIS data filtering has been applied.
In the 9.8 ks Chandra observation, X-ray emission at the location of SN 2013by is seen, with a significance of . The spectrum is well modeled by an absorbed power-law with a spectral photon index () and Galactic neutral hydrogen absorption N (Kalberla et al., 2005). The corresponding unabsorbed 0.3-10 keV flux is . We use the best-fitting spectral parameters above to flux to calibrate the entire X-ray data set. The temporal evolution of the X-ray emission from SN 2013by is presented in Figure 3.
| SN | Type | Reference |
|---|---|---|
| 1959D | IIL | Arp 1961 |
| 1966B | IIL | Gates et al. 1967; Tsvetkov 1983 |
| 1970G | IIL | Barbon et al. 1973; Winzer 1974 |
| 1979C | IIL | de Vaucouleurs et al. 1981; Barbon et al. 1982b |
| 1980K | IIL | Barbon et al. 1982a; Buta 1982; Tsvetkov 1983 |
| 1988Z | IIn | Stathakis et al. 1989; Pollas et al. 1989 |
| Gaskell et al. 1989; Turatto et al. 1993 | ||
| Aretxaga et al. 1999 | ||
| 2004dj | IIP | Zhang et al. 2006 |
| 2004et | IIP | Li et al. 2005; Sahu et al. 2006 |
| Maguire et al. 2010; Faran et al. 2014 | ||
| 2006jd | IIn | Brown et al. 2014 |
| 2008es | IIP | Miller et al. 2009; Brown et al. 2014 |
| 2010al | IIn | Brown et al. 2014 |
| 2011hw | IIn | Smith et al. 2012; Brown et al. 2014 |
| 2013by | IIL | Valenti et al. 2015 |
| 2013ej | IIP | Brown et al. 2014 |
| 2014G | IIL | Brown et al. 2014 |
3. Results
3.1. Optical Photometry
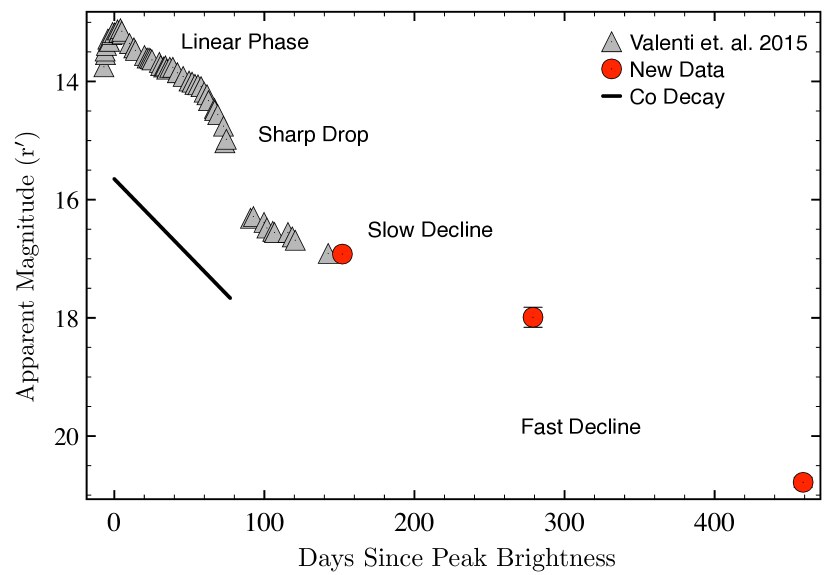
A plot of our Sloan photometry of SN 2013by is shown in Figure 4. Gray triangles are photometry taken from Valenti et al. (2015), with the red circles indicating the new photometric observations presented here. Together these data span from day -8 to +457 of the light curve evolution.
The observed late-time slope is less steep than that expected solely from heating by radioactive 56Co decay (the solid line), where the SN initially fades at a rate of s50 = 1.46 mag. This suggests that an additional energy source is powering its late-time luminosity. SN 2013by’s late-time light curve appears to decay at a fairly constant rate of roughly 0.45 mag per 50 days between days +100 and +278, but increases to around 0.77 mag per 50 days afterward.
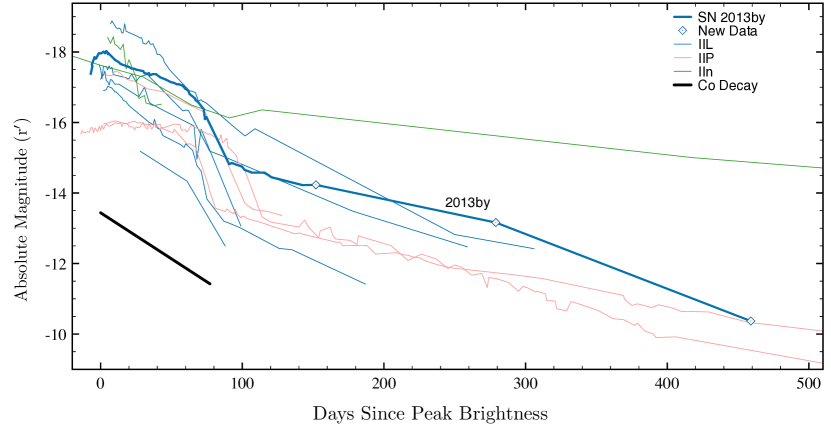
In Figure 5 we compare the Sloan light curves of a sample of Type IIP, IIL, and IIn SNe out to epochs comparable to those presented for SN 2013by. A list of the SNe used in this figure can be found in Table 3 and the and magnitudes were converted to Sloan using prescriptions outlined in Jester et al. (2005).
The early light curve of SN 2013by decays at a rate similar to those observed for the few other SN IIL having published data. However, after a steep drop around 80 days post-maximum light, the decay rate is similar to that seen in SNe IIP (Valenti et al., 2015).
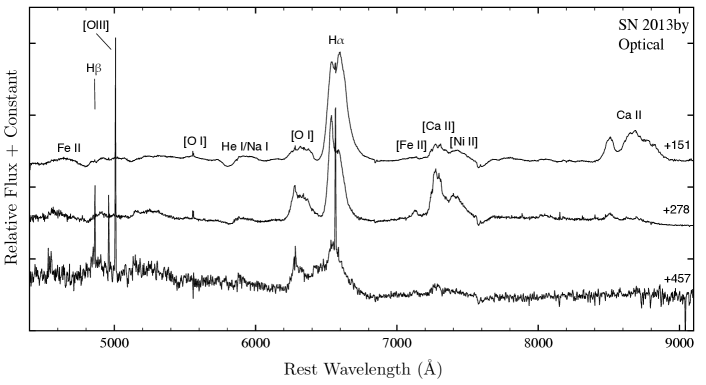
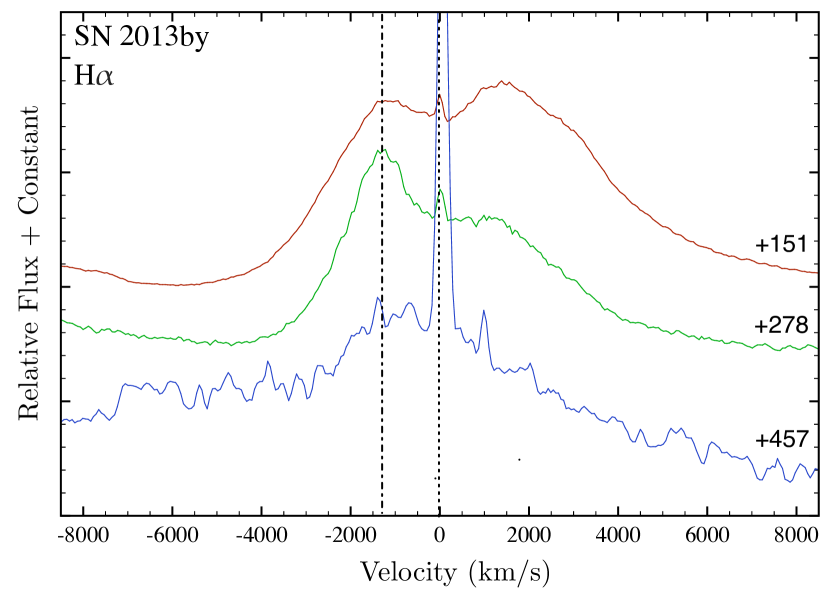
3.2. Optical and NIR Spectroscopy
Rest-frame optical and NIR spectra of SN 2013by are presented in Figure 6 with the strong emission features labeled. Significant evolution can be seen, most notably in the H profile. At day +151, H is the dominant feature and shows an asymmetric triple peaked distribution where the emission is strongest at redshifted velocities, peaking at a velocity of around +1500 km/s. On day +278, the red emission has diminished and the blue flux now dominates with a centroid near -1250 km s-1. The overall shape and width of this feature remains roughly the same during this transition.
However on day +457, the H profile is no longer triple peaked and the ratio of H/[O I] diminishes significantly. The blue wing of H has increased from 4000 km s-1 on day +278 to 7500 km s-1 on day +457. It is difficult to determine the full velocity extent of the blue wing of the H profile due to its blending with the [O I] 6300, 6364 lines. The red wing has maintained a maximum velocity of roughly +4500 km s-1. Figure 7 shows the emission line profiles of H at all three epochs.
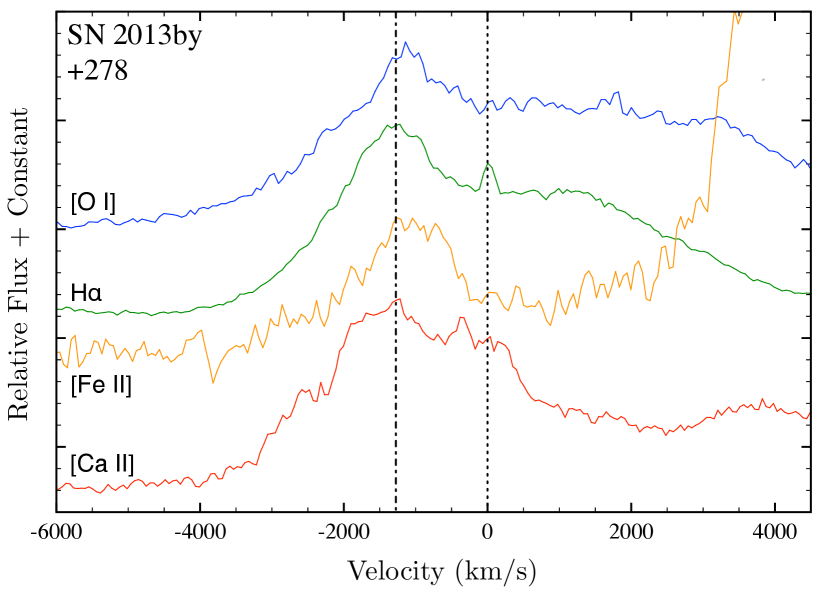
The blueshifted peak observed in the day +278 H profile is also seen in the [O I], [Ca II], and [Fe II] 7155 lines and Figure 8 shows a comparison of these emission line profiles. All four emission line profiles share the same blueshift of 1000 1500 km/s. The emission peak is most prominent on day +278. Many features fade significantly by day +457.
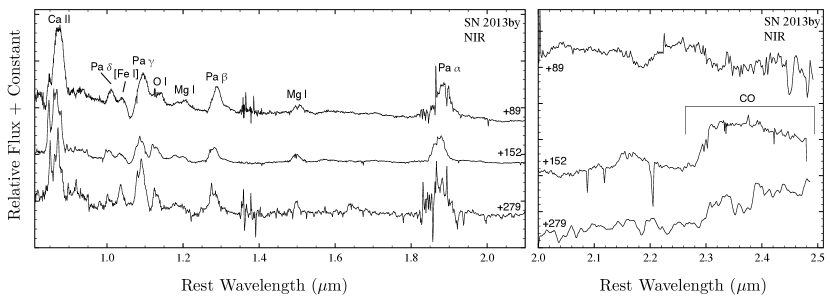
In the NIR (Fig. 6), the spectrum looks somewhat different and is dominated by Paschen emission features with the Pa line extending from roughly 5000 km s-1 to 5500 km s-1. The NIR hydrogen lines do not show the same asymmetry as that seen in the optical line profiles, which suggests that the optical lines have been affected by optical depth effects and/or extinction due to internal dust. The other prominent ions observed in the spectra include [Fe I] 1.044 µm, O I 1.130 µm, and Mg I 1.503 µm. He I 1.08 µm is only distinctly seen at day +279.
At day +152, emission from the first overtone of CO at 2.3 2.5 can be seen in the right panel of Figure 6. This is the first time CO has been detected in a Type IIL SNe. The +279 day spectrum lacks sufficient signal-to-noise to determine if CO is detected. CO formation is common in Type II SN and is typically seen +100 days after the SN explosion (Cherchneff & Sarangi, 2011; Yuan et al., 2016).
The presence of CO signals the early formation of molecules and dust, as described by Gerardy et al. (2000). This is consistent in the switch from a redshifted to a blueshifted asymmetry seen in the H at day +278, where the emergence of CO and dust creation inhibit transmission of far side ejecta.
4. Discussion
Our observations of SN 2013by span late-time epochs rarely observed in SNe IIL. Together with data spanning days -8 to +109 previously reported in Valenti et al. (2015), our complementary analyses form a set of observations covering from -8 to +457 days post-maximum brightness. The completeness of this data set enable us to follow the evolution of a Type IIL supernova and connect the properties of its early and late phases.
4.1. The SN-CSM Interaction
Many features of SN 2013by observed in the first 100 days post-explosion suggest that the SN interacted with local CSM. Milisavljevic et al. (2013) reported that a narrow (FWHM km s-1) H profile observed in spectra obtained in the first week after discovery exhibited a blue-to-red asymmetry consistent with an intermediate Type IIL/IIn supernova.
Valenti et al. (2015) reported high-velocity (15,000 km s-1) H absorption as well as a weak P-Cygni profile in their spectra obtained around this time and shortly afterward. Both analyses drew the conclusion that SN 2013by likely interacted with CSM that was less dense than material encountered by a typical Type IIn supernovae.
Our new observations at epochs beyond +151 days are consistent with this picture. The optical and X-ray light curves both suggest input of energy from SN-CSM interaction (Sections 3.1 and 4.2). The triple-peaked H emission line profile seen in our optical spectra at days +151 and +278 (Fig. 7) is not unlike that observed in SN 1998S, which was interpreted as being due to the SN interacting with a toroidal distribution of clumpy CSM viewed edge on (Gerardy et al., 2000). Interpreted in this way, the central unresolved (FWHM km s-1) component is the result of CSM that has been photoionized ahead of the forward shock (although contribution from coincident H II region emission is possible), and the blue- and red-shifted broad components form as a result of interaction along the front and back segments of the disk.
4.2. X-ray Analysis
X-ray emission in young SNe is associated with interaction between the forward blast wave and surrounding nearby ISM/CSM environment that has been shaped by the stellar progenitor prior to core-collapse. Thus, our X-ray observations can be utilized to derive information about the mass-loss history of the progenitor star before stellar death (Björnsson & Fransson, 2004; Chevalier & Fransson, 2006).
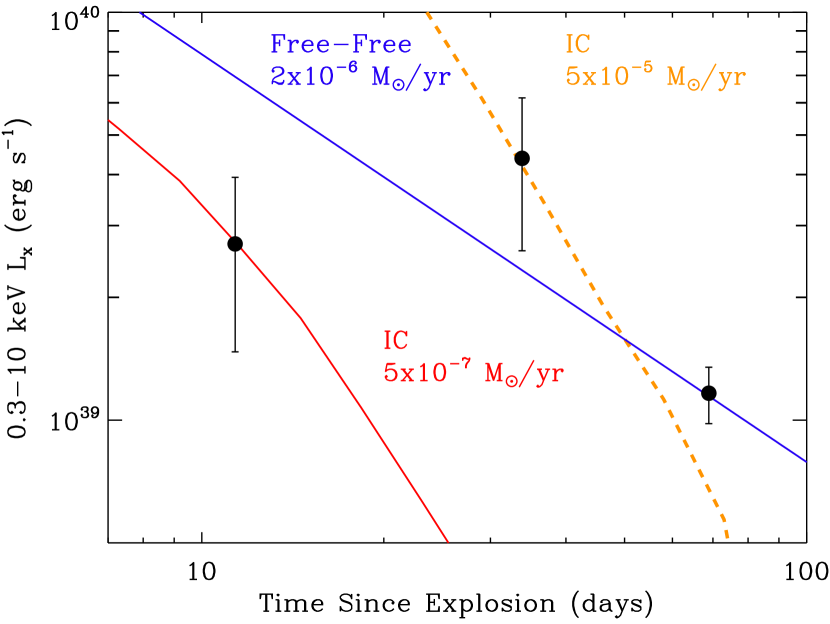
Inverse Compton (IC) emission originates from the upscattering of optical photospheric photons into the X-ray energy range by relativistic electrons accelerated at the SN shock. When the optical SN is bright, IC emission can dominate the X-ray luminosity. The optical bolometric light-curve of SN 2013by peaks at days post-shock breakout (Valenti et al., 2015).
Assuming that IC dominates around the optical peak, and adopting the formalism of Margutti et al. (2012) modified for massive star density profiles (Margutti et al., 2014), we infer a mass-loss rate of for a wind velocity of v10 km s-1. This calculation assumes an electron distribution with power-law index and a post-shock energy fraction into relativistic electrons , which are standard values in SN modeling (e.g. Chevalier & Fransson 2006), and , where the ejecta density profile scales as . The X-ray luminosities do not account for intrinsic absorption, which may be important at early times, and thus the inferred mass-loss rate represents a lower limit to the true value.
The flat temporal evolution of the detected X-ray emission after optical peak suggests that other radiative processes take over at this time. First, we derive a rough upper limit on by assuming that IC emission is the only source of X-rays at days post explosion and obtain (v10 km s-1), shown in Figure 9.
At day, the optical emission from SN 2013by is significantly fainter and IC emission is likely negligible. Interpreting the detected X-ray luminosity as due to free-free thermal emission from the reverse shock in a wind medium, and adopting the formalism by Chevalier & Fransson (2006) for an oxygen dominated ejecta, we infer (v10 km s-1) for a range of , shown as the blue line in Figure 9. However, we caution that our calculations should be treated as order of magnitude estimates due to the sparse coverage of the X-ray data and the limited spectral information.
4.3. The SN to SNR Transition
Optical emission from supernovae in the first few months to years after explosion is powered by the radioactive decay chain 56Ni56Co56Fe. In Type II events the dominant emission line is H with typical FWHM velocities of km s-1.
As the forward shock encounters increasing amounts of CSM, a reverse shock develops that propagates into outward expanding ejecta, which then becomes heated and ionized (Chevalier & Fransson, 1994). Due to the reverse shock interacting with high-velocity ejecta, these velocities are distinctly larger than those observed at earlier epochs ( yr after explosion). Indeed, the majority of CCSNe that have been observed more than two years after explosion have line velocities of 5000 10,000 km s-1 (Fesen et al., 1999).
It is the formation of a reverse shock where the ejecta become shock heated that the SN begins to transition towards becoming a SNR (Milisavljevic et al., 2012; Milisavljevic & Fesen, 2017). This transition is rarely observed. Only in a handful of nearby cases has it been possible to monitor core collapse explosions several years to decades after maximum light. The timescale of the SN-to-SNR transition is strongly dependent on the explosion dynamics, the progenitor structure, and the properties of local CSM/ISM environment it encounters.
In SN 2013by, we appear to be observing the SN-SNR transition within the first two years after the explosion. Specifically, we interpret the large Doppler broadening of H emission line profile observed in SN 2013by one year post-max to be due to outer H-rich ejecta being excited by the passage of the reverse shock.
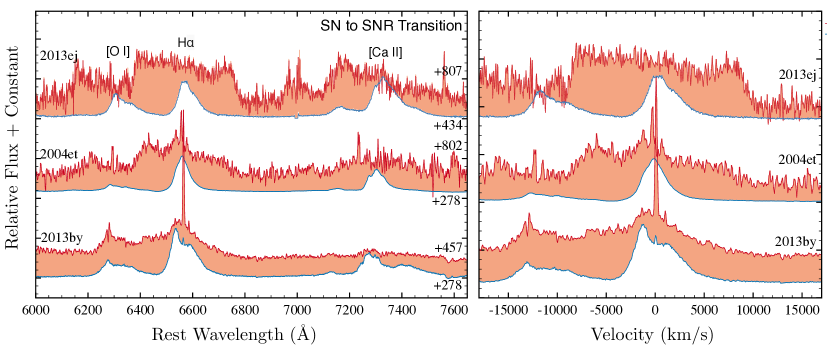
In Figure 10, we highlight this transition in SN 2013by and compare it to examples observed in SNe IIP. Emission observed during epochs prior to broadening are associated with heating by radioactive 56Co (blue), whereas those where broadening is observed are associated with passage of the reverse shock through outer H-rich ejecta (red), where the reverse shock spectra are shaded to emphasize the evolution between the early and late epochs.
Comparing SN 2013by to two Type IIP SNe, SN 2013ej and SN 2004et, the broad H emission in SN 2013by seen at day +457 associated with reverse shock interaction is comparatively weak. The spectrum of SN 2013ej on day +807 is dominated by its broad, flat-topped H profile that extends out to velocities of roughly -9000 and +10,000 km s-1 (Mauerhan et al., 2017). Such flat-topped or ‘square’ emission line profiles can be produced by a spherical shell of material that becomes excited by a reverse shock.
Although the H profile seen in SN 2004et extends out to comparable velocities of SN 2013ej, it is not completely flat-topped. This may be due to components from both 56Co heating and reverse shock interaction. The central, lower velocity (FWHM ¡ 3500 km s-1 at +278 days) component rises above the higher velocity (7000 km s-1) flat-topped component. The broad H profile also exhibits the broad blue-red asymmetry seen in SN 2013ej. Mid-infrared observations support the notion that the asymmetry seen here is due to the formation of dust in the ejecta (Kotak et al., 2009).
In SN 2013by, the broadening seen in the blue, increasing from -4000 km s-1 on day +278 to at least -7500 km s-1 on day +457. Interestingly, the broadening of H in SN 2013by is apparent at a significantly earlier epoch than the other two SNe. While evidence of reverse shock emission in SNe 2004et and 2013ej is not visible until +800 days, SN 2013by shows indications of this phenomenon by +457 days. However, broad [O I] 6300,6364 emission is present in both 2013ej and 2004et, but not in SN 2013by. Presumably this means that its reverse shock has not reached 2013by’s O-rich ejecta at this epoch.
4.4. The SN 2013by Progenitor
Unlike SNe IIP, SNe IIL may belong to a class of progenitor systems where the effects of binary evolution strongly affect the outcome of the observed supernova explosion and may be the first in an evolutionary link of increasingly stripped stars between IIL IIb Ib SNe (Nomoto et al., 1996). Analysis of the SN-to-SNR transition can provide clues about the progenitor star’s evolution, including its possible binary nature and mass loss in the poorly understood phases approaching core collapse.
Type IIL supernovae are thought to be associated with stars that have relatively low mass ( M⊙) and/or extended hydrogen-rich envelopes with radii as large as regular red supergiants (200 R⊙). These low-density envelopes allow the shock break out velocity at the bottom of the H-rich envelope to be higher, thus sending a stronger blastwave into surrounding ISM/CSM compared to their Type IIP counterparts that have much more massive and dense envelopes.
This framework is consistent with the three objects we have considered here. In the SNe IIP objects, SN 2013ej and SN 2004et, the Doppler broadening was observed at epochs twice as late as that observed for SN 2013by. Hence, an early transition to the reverse shock phase may be a characteristic of SNe IIL. It may also explain why many SNe IIL such as SN 1970G, SN 1979C, and SN 1980K are visible decades after explosion (Fesen, 1993; Fesen et al., 1999; Milisavljevic et al., 2009).
Moreover, analysis of the X-ray light curve provides insight into the progenitor’s environment prior to explosion. The flat temporal evolution of the X-ray light curve suggests that there is an additional flux contribution from a source other than IC emission at later times. Around day +70 free-free emission due to the reverse shock interacting with the wind medium dominates.
5. Conclusions
We have presented X-ray, optical, and near-infrared observations of the Type IIL SN 2013by. These multi-epoch observations provide a look into the late time evolution of a SN IIL and allow us to infer the properties of the progenitor star and mass loss history. We extend the light curve of SN 2013by from Valenti et al. (2015) out to late times to create a light curve that spans from day -8 to day +457. Our main results and conclusions are as follows:
1) Spectral and photometric properties indicate that SN 2013by quickly interacted with local CSM. For early data up to day +278, modeling of SN 2013by’s optical and X-ray light curves requires energy sources in addition to radioactive 56Co heating and IC upscattering, respectively. SN-CSM interaction is the most natural explanation. The triple-peaked H emission line profile of SN 2013by observed on days +151 and +278 is not unlike that observed in SN 1998S, which was interpreted to be the consequence of H-rich ejecta interacting with nearby dense CSM distributed in a disk along the equatorial plane.
2) The SN-SNR transition time frame in SN 2013by (between days +278 and +457) is faster than that observed in these other CCSNe objects at much later times, suggesting that reverse shock formation may occur earlier for SNe IIL than for SNe IIP. This is consistent with the notion that SNe IIL have less massive and/or more extended H-rich envelopes due to mass loss as compared to those of SNe IIP at the time of explosion.
3) On day +457, SN 2013by’s H emission feature exhibited significant broadening from roughly 4000 km s-1 at day +278 to 7500 km s-1, which is consistent with the emergence of a reverse shock exciting high velocity H-rich ejecta. The observed flat light curve of the X-ray light curve is indicative of CSM interaction and the formation of the reverse shock. We suggest that SN 2013by’s progenitor underwent sustained mass-loss just prior to explosion.
4) We detect the first overtone of CO at 2.3 in the NIR spectrum at day +152. This is the first time CO has been detected in a Type IIL SN. The presence of CO is indicative of the early formation of dust and is consistent with the blue-red asymmetry observed in the emission line profiles (Figs. 7 and 8).
Models of SN-CSM interaction predict how the emission will evolve with time as the reverse shock penetrates into deeper layers of ejecta (Chevalier & Fransson, 2016). It is anticipated that the velocity widths of emission lines in SN 2013by will narrow with time and that the relative line strengths should change as expansion drives down ejecta density. Specifically, the flux ratio [O III]/([O I]+[O II]) should increase with time, and H/([O I]+[O II]) should decrease (Milisavljevic et al., 2012).
Additional late-time observations of other SNe IIL may help clarify the speed of the SN-SNR transition in these objects. The timescale of the SN-SNR transition provides useful information about the mass and distribution of the progenitor star’s mass loss in the terminal stages leading to core collapse. Establishing time lines for the SN-SNR transition relative to Type IIL and IIP SNe will lead to a better understanding of the nature of the CSM environment around Type II SNe and build a more complete picture of their progenitors.
References
- Anderson et al. (2014) Anderson, J. P., González-Gaitán, S., Hamuy, M., et al. 2014, ApJ, 786, 67
- Arcavi et al. (2012) Arcavi, I., Gal-Yam, A., Cenko, S. B., et al. 2012, ApJ, 756, L30
- Aretxaga et al. (1999) Aretxaga, I., Benetti, S., Terlevich, R. J., et al. 1999, MNRAS, 309, 343
- Arp (1961) Arp, H. 1961, ApJ, 133, 883
- Barbon et al. (1973) Barbon, R., Ciatti, F., & Rosino, L. 1973, A&A, 29, 57
- Barbon et al. (1982a) —. 1982a, A&A, 116, 35
- Barbon et al. (1982b) Barbon, R., Ciatti, F., Rosino, L., Ortolani, S., & Rafanelli, P. 1982b, A&A, 116, 43
- Björnsson & Fransson (2004) Björnsson, C.-I., & Fransson, C. 2004, ApJ, 605, 823
- Blinnikov & Bartunov (1993) Blinnikov, S. I., & Bartunov, O. S. 1993, A&A, 273, 106
- Brown et al. (2014) Brown, P. J., Breeveld, A. A., Holland, S., Kuin, P., & Pritchard, T. 2014, Ap&SS, 354, 89
- Burrows et al. (2005) Burrows, D. N., Hill, J. E., Nousek, J. A., et al. 2005, Space Sci. Rev., 120, 165
- Buta (1982) Buta, R. J. 1982, PASP, 94, 578
- Cherchneff & Sarangi (2011) Cherchneff, I., & Sarangi, A. 2011, in IAU Symposium, Vol. 280, The Molecular Universe, ed. J. Cernicharo & R. Bachiller, 228–236
- Chevalier & Fransson (1994) Chevalier, R. A., & Fransson, C. 1994, ApJ, 420, 268
- Chevalier & Fransson (2006) —. 2006, ApJ, 651, 381
- Chevalier & Fransson (2016) —. 2016, ArXiv e-prints, arXiv:1612.07459
- de Vaucouleurs et al. (1981) de Vaucouleurs, G., de Vaucouleurs, A., Buta, R., Ables, H. D., & Hewitt, A. V. 1981, PASP, 93, 36
- Faran et al. (2014) Faran, T., Poznanski, D., Filippenko, A. V., et al. 2014, MNRAS, 445, 554
- Faran et al. (2014) Faran, T., Poznanski, D., Filippenko, A. V., et al. 2014, MNRAS, 442, 844
- Fesen (1993) Fesen, R. A. 1993, ApJ, 413, L109
- Fesen et al. (1999) Fesen, R. A., Gerardy, C. L., Filippenko, A. V., et al. 1999, AJ, 117, 725
- Filippenko (1997) Filippenko, A. V. 1997, ARA&A, 35, 309
- Gaskell et al. (1989) Gaskell, C. M., Koratkar, A. P., Pollas, C., Maury, A., & Williams, P. 1989, IAU Circ., 4761
- Gates et al. (1967) Gates, H. S., Zwicky, F., Bertola, F., Ciatti, F., & Rudnicky, K. 1967, AJ, 72, 912
- Gehrels et al. (2004) Gehrels, N., Chincarini, G., Giommi, P., et al. 2004, ApJ, 611, 1005
- Gerardy et al. (2000) Gerardy, C. L., Fesen, R. A., Höflich, P., & Wheeler, J. C. 2000, AJ, 119, 2968
- Hsiao et al. (2013) Hsiao, E. Y., Marion, G. H., Phillips, M. M., et al. 2013, ApJ, 766, 72
- Jester et al. (2005) Jester, S., Schneider, D. P., Richards, G. T., et al. 2005, AJ, 130, 873
- Kalberla et al. (2005) Kalberla, P. M. W., Burton, W. B., Hartmann, D., et al. 2005, A&A, 440, 775
- Koribalski et al. (2004) Koribalski, B. S., Staveley-Smith, L., Kilborn, V. A., et al. 2004, AJ, 128, 16
- Kotak et al. (2009) Kotak, R., Meikle, W. P. S., Farrah, D., et al. 2009, ApJ, 704, 306
- Li et al. (2005) Li, W., Van Dyk, S. D., Filippenko, A. V., & Cuillandre, J.-C. 2005, PASP, 117, 121
- Li et al. (2011) Li, W., Leaman, J., Chornock, R., et al. 2011, MNRAS, 412, 1441
- Maguire et al. (2010) Maguire, K., Di Carlo, E., Smartt, S. J., et al. 2010, MNRAS, 404, 981
- Margutti et al. (2012) Margutti, R., Soderberg, A. M., Chomiuk, L., et al. 2012, ApJ, 751, 134
- Margutti et al. (2014) Margutti, R., Milisavljevic, D., Soderberg, A. M., et al. 2014, ApJ, 797, 107
- Mauerhan et al. (2017) Mauerhan, J. C., Van Dyk, S. D., Johansson, J., et al. 2017, ApJ, 834, 118
- Milisavljevic et al. (2013) Milisavljevic, D., Fesen, R., Pickering, T., et al. 2013, Central Bureau Electronic Telegrams, 3506
- Milisavljevic & Fesen (2017) Milisavljevic, D., & Fesen, R. A. 2017, ArXiv e-prints, arXiv:1701.00891
- Milisavljevic et al. (2012) Milisavljevic, D., Fesen, R. A., Chevalier, R. A., et al. 2012, ApJ, 751, 25
- Milisavljevic et al. (2009) Milisavljevic, D., Fesen, R. A., Kirshner, R. P., & Challis, P. 2009, ApJ, 692, 839
- Miller et al. (2009) Miller, A. A., Chornock, R., Perley, D. A., et al. 2009, ApJ, 690, 1303
- Morozova et al. (2017) Morozova, V., Piro, A. L., & Valenti, S. 2017, ApJ, 838, 28
- Nomoto et al. (1996) Nomoto, K., Iwamoto, K., Suzuki, T., et al. 1996, Compact stars in binaries, 165, 119
- Parker et al. (2013) Parker, S., Kiyota, S., Morrell, N., et al. 2013, Central Bureau Electronic Telegrams, 3506
- Pollas et al. (1989) Pollas, C., Buil, C., Dambrine, J. P., et al. 1989, IAU Circ., 4742
- Richardson et al. (2002) Richardson, D., Branch, D., Casebeer, D., et al. 2002, AJ, 123, 745
- Sahu et al. (2006) Sahu, D. K., Anupama, G. C., Srividya, S., & Muneer, S. 2006, MNRAS, 372, 1315
- Sanders et al. (2015) Sanders, N. E., Soderberg, A. M., Gezari, S., et al. 2015, ApJ, 799, 208
- Simcoe et al. (2008) Simcoe, R. A., Burgasser, A. J., Bernstein, R. A., et al. 2008, in Proc. SPIE, Vol. 7014, Ground-based and Airborne Instrumentation for Astronomy II, 70140U
- Smartt et al. (2009) Smartt, S. J., Eldridge, J. J., Crockett, R. M., & Maund, J. R. 2009, MNRAS, 395, 1409
- Smith et al. (2012) Smith, N., Mauerhan, J. C., Silverman, J. M., et al. 2012, MNRAS, 426, 1905
- Stathakis et al. (1989) Stathakis, R. A., Sadler, E. M., & Couch, W. 1989, IAU Circ., 4721
- Tsvetkov (1983) Tsvetkov, D. Y. 1983, Peremennye Zvezdy, 22, 39
- Turatto et al. (1993) Turatto, M., Cappellaro, E., Danziger, I. J., et al. 1993, MNRAS, 262, 128
- Valenti et al. (2015) Valenti, S., Sand, D., Stritzinger, M., et al. 2015, MNRAS, 448, 2608
- Valenti et al. (2016) Valenti, S., Howell, D. A., Stritzinger, M. D., et al. 2016, MNRAS, 459, 3939
- Weiler et al. (2002) Weiler, K. W., Panagia, N., Montes, M. J., & Sramek, R. A. 2002, ARA&A, 40, 387
- Winzer (1974) Winzer, J. E. 1974, JRASC, 68, 36
- Yuan et al. (2016) Yuan, F., Jerkstrand, A., Valenti, S., et al. 2016, MNRAS, 461, 2003
- Zhang et al. (2006) Zhang, T., Wang, X., Li, W., et al. 2006, AJ, 131, 2245