Charge regulation of nonpolar colloids
Abstract
Individual colloids often carry a charge as a result of the dissociation (or adsorption) of weakly-ionized surface groups. The magnitude depends on the precise chemical environment surrounding a particle, which in a concentrated dispersion is a function of the colloid packing fraction . Theoretical studies have suggested that the effective charge in regulated systems could, in general, decrease with increasing . We test this hypothesis for nonpolar dispersions by determining over a wide range of packing fractions () using a combination of small-angle X-ray scattering and electrophoretic mobility measurements. All dispersions remain entirely in the fluid phase regime. We find a complex dependence of the particle charge as a function of the packing fraction, with initially decreasing at low concentrations before finally increasing at high . We attribute the non-monotonic density dependence to a crossover from concentration-independent screening at low , to a high packing fraction regime in which counterions outnumber salt ions and electrostatic screening becomes -dependent. The efficiency of charge stabilization at high concentrations may explain the unusually high stability of concentrated nanoparticle dispersions which has been reportedBatista, Larson, and Kotov (2015).
pacs:
82.70.-y, 82.70.Dd, 42.50.WkI Introduction
Virtually all colloids carry a charge when immersed in an electrolyte. The subsequent Coulombic interactions are crucial to a wide variety of processes including understanding the programmed self-assembly of nanoparticlesBatista, Larson, and Kotov (2015), the phase stability of suspensionsDerjaguin and Landau (1941); Verwey and Overbeek (1948), and the hierarchical architecture of virus structuresSiber, Losdorfer Bozoic, and Podgornik (2012). A practical challenge is that the charge is not fixed a priori but typically free to adjust through a chemical equilibriumNinham and Parsegian (1971). Strongly acidic or basic groups tend to be fully dissociated, regardless of system parameters such as salt concentration or pH, while the dissociation of weak acid or base surface groups depends on the electrochemical potentialNinham and Parsegian (1971). As a result, colloids carrying weak ionic groups are often referred to as charge regulated, in the sense that the effective surface-charge density is not fixed but adapts to minimize the free energy of the system with ions migrating on and off surface sites. To date, the concepts of charge regulation (CR) have been applied almost exclusively to aqueous systems. Examples include analysis of the electrostatic double-layer interactions between surfaces covered with protonated groupsNinham and Parsegian (1971); Behrens and Borkovec (1999); Dan (2002); Trefalt, Behrens, and Borkovec (2016), explanation of the extremely long-range attractive forces that operate between proteins with dissociable amino acid groups close to their point of zero chargeKirkwood and Shumaker (1952); Lund and Jonsson (2013); Adzic and Podgornik (2015), or the role of charge regulation effects in determining not only the magnitude but the sign of the force between asymmetrically-charged particlesPopa et al. (2010); Cao et al. (2017). In contrast, little is known regarding the role of CR in nonpolar systems, where the degree of dissociation of surface ionic groups is small yet finite and complex charging processes operateLee, Zhou, and Behrens (2016). Indeed the strong long-range repulsive interactions arising from Coulombic charges in low dielectric solvents make nonpolar systems a fascinating testing ground for CR concepts.
The double-layer interactions between charge-regulating particles are different to those between fully dissociated particlesEverts, Boon, and van Roij (2016); Smallenburg et al. (2011). For example, from Poisson-Boltzmann theory the repulsive disjoining pressure between identically-charged surfaces spaced by , in the limit of small separations (), is fixed directly by the osmotic pressure of the ions which are trapped in the gap between the two surfaces by electroneutrality constraintsAndelman (1995). In a CR system the degree of dissociation of surface groups and hence the concentration of released counterions is controlled by the total electrostatic potential , which is itself a function of the separation between the charged surfaces. As a result, the effective surface charge density and differ substantially from the predictions of a constant-charge (CC) model as the two charge-regulated surfaces are brought together. In general, it has been found that CR significantly weakens the repulsive interactions between surfacesMarkovich, Andelman, and Podgornik (2016); Behrens and Borkovec (1999); Ninham and Parsegian (1971), as the increase in counterion osmotic pressure is relieved by a shift in the dissociation equilibria towards the uncharged state.
The effect of charge regulation on the repulsive interactions between particles in concentrated dispersions has been examined in a number of studiesEverts, Boon, and van Roij (2016); Smallenburg et al. (2011). To simplify the many-body electrostatic problem, a Poisson-Boltzmann (PB) cell approximation has been frequently employed in which the dispersion is divided up into identical spherical cells, each containing just one colloid in osmotic equilibrium with a salt reservoir of Debye length . Cell calculations using different CR schemesEverts, Boon, and van Roij (2016); Smallenburg et al. (2011) show that, independent of the specific surface chemistry, the colloidal particle discharges monotonically with increasing packing fraction – in the sense that the colloid charge reduces with increasing . This is in line with the asymptotic dependence observed for charge-regulated plates as . The charge reduction is predicted to be most severe in dispersions of small particles and solutions of low ionic strength where .
The experimental situation is however less clear, which may be accounted in part by the focus so far on systems with relative large . Royall et al. (2006), using charges estimated from radial distribution functions measured at , have argued that the sequence of reentrant transitions observed upon increasing the colloid density in some charged nonpolar suspensions (fluid BCC fluid FCC), is a consequence of a steady reduction in with increasing . In recent work, Kanai et al. (2015) have explored the crystallization of large () colloids, charged by the addition of the surfactant Aerosol-OT (sodium bis(2-ethyl 1-hexyl)sulfosuccinate or AOT) in a nonpolar solvent mixture. They observed close agreement between the reentrant phase boundaries measured and numerical calculations of the electrostatic charging effects produced by the reverse micelles. In an alternative approach, Vissers et al. (2011) measured the electrophoretic mobility of concentrated nonpolar dispersions at . Using an approximate cell model to take into account double-layer overlap, they showed that the particle charge reduced with increasing concentration.
If the strength of the electrostatic repulsions between charge-regulated particles decays rapidly with increasing colloid packing fraction, it is feasible that concentrated dispersions of charged nanoparticles could become colloidally unstable at very low ionic strengths, due to the absence of a strong enough osmotic repulsion to counter attractive van der Waals forcesLin and Wiesner (2012). Indeed, the notion that a high colloid surface-potential (and consequently a large particle charge) at low colloid concentrations does not necessarily guarantee stability has been proposed for some time. Over fifty years ago, Albers and Overbeek (1959a, b) noted the absence of any correlation between the electrokinetic -potential of water-in-benzene emulsions and their stability against coalescence. Later work by Mishchuk, Sanfeld, and Steinchen (2004) suggested that a charge-stabilized water-in-oil emulsion should be unstable above a critical volume fraction, which reduced as the ion concentration fell. Indeed there have been repeated experimental reportsBensley and Hunter (1983); van Mil, Crommelin, and Wiersema (1984); Green and Parfitt (1988); Wang et al. (2013) of rapid coagulation at high colloid concentrations and low electrolyte concentrations in dispersions with high surface potentials, which would be sufficient to stabilize a more dilute system.
In this article, we present a study of the packing fraction dependence of the effective charge and the bulk correlations in nonpolar colloids in the weak screening regime (). Experiments were carried out over an extended range of concentrations () using small nanoparticles in solutions of very low ionic strengths, so the dimensionless screening parameters studied are considerably smaller than in any previous work. This has the advantage that the charge reduction due to regulation is evident at significantly lower packing fractions. By using two different methods to prepare charged nonpolar dispersions, we systematically varied the background ion concentration within the range . We determined the effective charge as a function of by an analysis of (i) the particle structure factor obtained from X-ray scattering measurements, and (ii) the density dependence of the electrophoretic mobility at . At low packing fractions, we observe the charge reduction predicted by theory for a charge-regulated system at low . However at high particle concentrations () we demonstrate a surprising density dependence of the effective charge, with increasing with . Extensive measurements reveal that this is a general feature of concentrated charged dispersions at low ionic strengths. Our dispersions always remain entirely in the fluid regime so the changes identified are not a consequence of phase changes, such as crystallization. Our paper is organized as follows: In Sec. II existing CR models are summarized and we show that, although details differ, all models predict a monotonic reduction in the effective charge with increasing packing fraction. Details of the nanoparticle systems and the analysis methods used in our experiments are detailed in Sec. III. In Sec IV.1 we confirm that, without added charge, our colloids display pure hard-sphere interactions. The electrophoretic mobility of dilute charged dispersions is analysed in Sec. IV.2 and shown to be consistent with a simple CR model. The charge at high packing fractions is extracted from measured structure factors in Sec. IV.3. Interestingly, we find that the measured charge increases, rather than decreasing with particle concentration as would be expected naively. This observation suggests that charge stabilization is much more effective in highly concentrated suspensions than is generally believed. We discuss the origins of the surprising increase in the particle charge with concentration in Sec. IV.4, before concluding in Sec V.
II Charge regulation models
We consider dispersions of charged nanoparticles of radius and charge suspended in a solvent of volume , and relative permittivity at a temperature . The colloid number density is and the corresponding packing fraction is . The double-layer repulsions between particles are controlled by two length scales: the solvent-specific Bjerrum length where , is the Boltzmann constant, is the fundamental charge, and is the permittivity of a vacuum, and the (reservoir) Debye screening length , with the number density of univalent salt ions in the reservoir. In dodecane at , the Bjerrum length is .
Although at high packing fractions or for thick double layers many-body interactions between charged nanoparticles can become significantKlein et al. (2002); Russ et al. (2002), ab-initio computer simulationsLöwen and Kramposthuber (1993); Dobnikar et al. (2006) show that the colloidal structure of a concentrated dispersion can often be approximated remarkably well by representing the effective pair potential by the hard-sphere Yukawa (HSY) function,
| (1) |
where is the dimensionless pair separation, is the centre-to-centre distance, and the range and strength of the interparticle repulsions are evaluated from the effective charge and the screening length , according to
| (2) |
and
| (3) |
While the HSY potential has been widely used, there is no rigorous route to construct such a potential at a finite nanoparticle density. In the low density limit , Eq. 1 does reduce, under Debye-Huckel conditions (), to the classical expressions derived by Derjaguin and LandauDerjaguin and Landau (1941) and Verwey and OverbeekVerwey and Overbeek (1948) with and . In general, however the effective parameters and will be density dependent. Denton, for instance, has derivedDenton (2000) an expression similar to Eq. 1 from a rigorous statistical mechanical treatment but with a modified screening parameter that incorporates both the counterions released from the particle and corrects for excluded volume effects. For a colloid of charge , and added 1:1 electrolyte of density the screening parameter is obtained as
| (4) |
where is the colloid number density. In this work, we follow this approach and fix the effective screening parameter using Eq. 4.
To illustrate the consequences of charge regulation, we determine the effective charge using a PB-cell model of the dispersion, in which each particle is placed at the centre of a Wigner-Seitz spherical cell of radius . The electrostatic potential is then a spherically-symmetric function of the radial variable , measured from the centre of cell. To facilitate a direct comparison between theoretical predictions and experiment we compute the scaled electrostatic potential and the reduced effective charge as a function of by solving numerically the non-linear Poisson-Boltzmann equation on the interval ,
| (5) |
where . Equation 5 is solved subject to the appropriate charge regulation boundary conditionsSmallenburg et al. (2011); Everts, Boon, and van Roij (2016) together with the constraint, , which follows from the overall charge neutrality of the Wigner-Seitz cell. The effective charge is obtained from the numerically-obtained electrostatic potential by matching at the edge of the cell to a solution of the linearized PB equationTrizac et al. (2003).
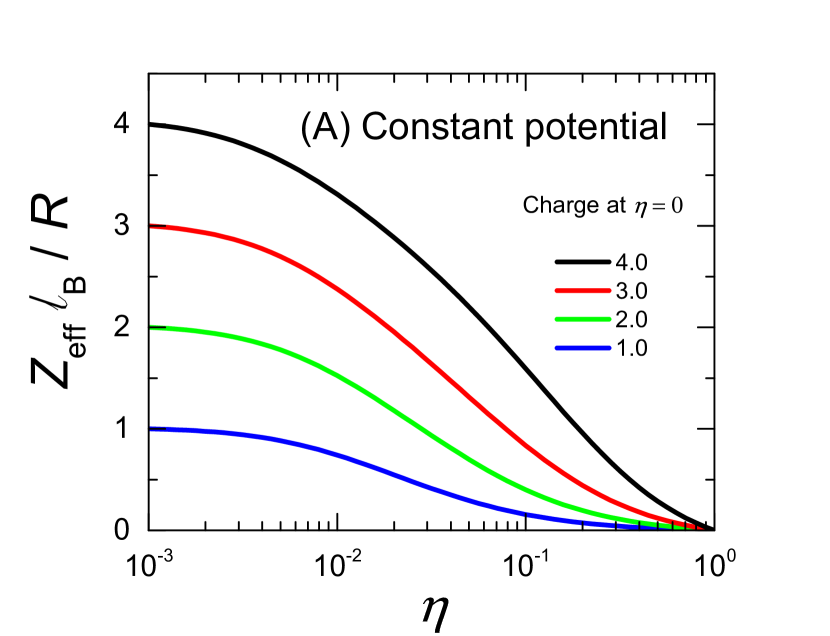
The simplest theoretical model of a charged colloid is as a spherical insulator with a constant charge (CC model). The CC model implies no exchange between surface binding sites and free ions in solution so that the bare charge remains frozen, independent of the electrolyte concentration and the particle packing fraction . Recently, there have been a number of attemptsRoberts et al. (2008); Smallenburg et al. (2011); Everts, Boon, and van Roij (2016) to develop more realistic statistical models of charge regulation in a low dielectric environment. Fig. 1 shows numerical predictions for the dimensionless charge as a function of the packing fraction , for a number of different surface chemistries. Crucially, we see that while the details of each model differ, they share a common qualitative behavior in that the particles are predicted to discharge continuously with increased colloid density.
Everts, Boon, and van Roij (2016), for instance, have proposed that the net colloid charge is determined by a balance between two competing surface ionization reactions,
| (6) |
where S1,2 denote different sites on the colloidal surface which bind either positive (\ceP+) or negative ions (\ceN-). We label the generic two-site charge regulation scheme, outlined in Eq. II, as an example of a CR2 model. Numerical solution of this model reveals that the charge carried by the colloidal particle reduces monotonically with increasing colloid density, in contrast to the CC model. Effectively, the particle discharges continuously as a function of , with the charge asymptotically tending to as .
In the limit, where there is a significant adsorption of both positive and negative ions onto the particle, the CR2 boundary condition reduces to the simpler constant potential (CP) model. The ionization of the positive and negative surface groups adjusts so that as particles approach each other counterions migrate back onto surface sites to maintain a fixed surface potential, and the surface charge density decreases monotonically with increasing colloid density. Theoretical arguments for the validity of a CP model in nonpolar dispersions have been made by a number of authorsHsu, Dufresne, and Weitz (2005); Roberts et al. (2008); Smallenburg et al. (2011); Everts, Boon, and van Roij (2016). Roberts et al. (2008) have, for instance, analysed a model of charge regulation in which charged micelles adsorb onto the surface of a colloid and shown that it is equivalent to assuming constant potential boundary conditions provided that (a) both positive and negative micelles are able to adsorb and (b) the surface coverage of micelles is below the saturation limit.
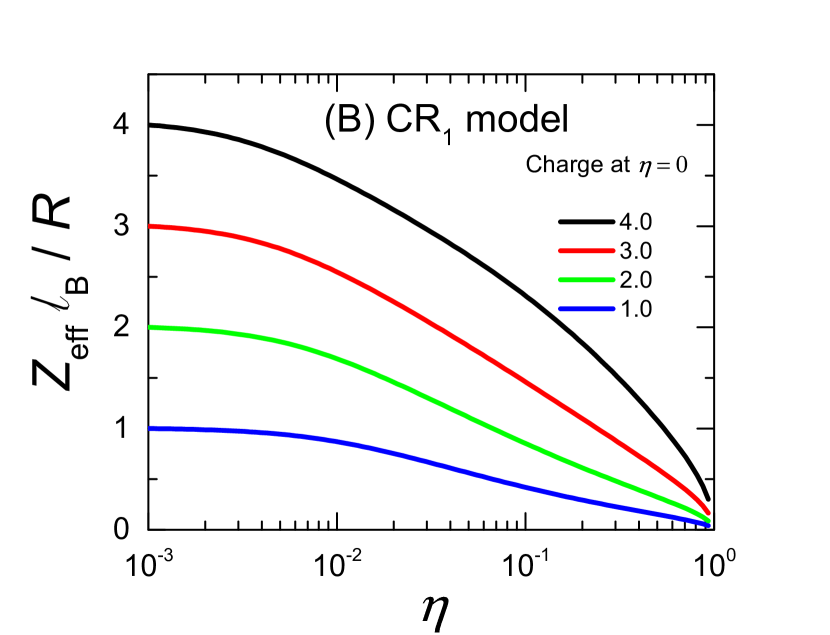
Finally, Smallenburg et al. (2011) has compared numerical predictions for as a function of from a single-site association/dissociation equilibrium (CR1 model)
| (7) |
with CP calculations and found that although the predicted surface charges are indistinguishable at low densities, there are significant variations at higher . These observations are consistent with more general predictionsMarkovich, Andelman, and Podgornik (2016) that the repulsions between surfaces with both positive and negative sites more closely resemble the constant potential limit than a surface with only a single ionizable site. The CR1 scheme however still predicts a qualitatively similar charge dependence to the CR2 model, in that decreases monotonically from a finite low- value to essentially 0 at .
III Materials and methods
III.1 Colloids
The systems studied consisted of three batches of nanoparticles (NP1-NP3), approximately in radii, dispersed in dry dodecane (dielectric constant ) at a packing fraction . Each system consisted of a core of poly(methyl methacrylate) [PMMA] surrounded by a chemically-grafted shell of poly(12-hydroxystearic acid) [PHSA]. The particles were prepared in-houseAntl et al. (1986); Hussain, Robinson, and Bartlett (2013) by a free-radical dispersion polymerization of methyl methacrylate (MMA) and methacrylic acid (MAA) in a mass ratio of 98:2 using 2,2´-azobis(2-methylpropionitrile) [AIBN] as initiator and a preformed graft copolymer poly(12-hydroxystearic acid)-g-poly(methyl methacrylate) as dispersant. The synthesis was carried out at in a mixed solvent of dodecane and hexane (2:1 by wt.) for , before the temperature was raised to for a further , in the presence of a catalyst, to covalently lock the stabilizer to the surface of the particle. All particles were undyed. Colloids were purified by repeated cycles of centrifugation and redispersion in freshly-dried dodecane to remove excess electrolyte and stabilizer. Once cleaned, the average hydrodynamic radius was determined by dynamic light scattering (DLS) using a Malvern Zetasizer nano S90 (Malvern instruments, UK). The sizes are given in Table 2. Nanoparticles were stored under nitrogen to prevent water uptake and ion generation. The conductivity of the purified dispersions was checked prior to use with a Scientifica (UK) model 627 conductivity meter.
We employed two routes to generate charge: batches NP1 and NP2 were differently-sized PMMA particles, with the same surface chemistry, which were both charged negativeHsu, Dufresne, and Weitz (2005); Roberts et al. (2008) by the addition of the surfactant AOT while nanoparticles NP3 had a different surface chemistry, and were charged positive by the dissociation of lipophilic ionic groupsGillespie et al. (2013); Hussain, Robinson, and Bartlett (2013) introduced into the particle during synthesis. AOT (98%, Aldrich, UK) was purified by dissolution in dry methanol and centrifuged prior to use to remove residual salts. It was used at molar concentrations above the critical micellar concentrationSmith et al. (2013) , where although the majority of the reverse micelles are neutral conductivity measurementsEicke, Borkovec, and Das-Gupta (1989); Roberts et al. (2008) show that a small fraction of the micelles ( in ) are ionized by thermal fluctuations. Measurement of the conductivity and viscosity of AOT in dodecane confirmed that the total molar concentration of reverse micellar ions increased linearlyRoberts et al. (2008) with , with . A range of AOT concentrations, from was employed, which correspond to total micellar ion concentrations of . Suspensions were prepared by dilution of the same concentrated particle stock for all AOT concentrations to ensure accurate relative concentrations. The dominant ionic species are singly-charged positive and negative AOT micelles. The colloid charge is not fixed but regulated by a competitive adsorption of cationic and anionic micellar ions onto the particle surfaceRoberts et al. (2008). Batch NP3, in contrast, contains no-added salt and is a counterion-only system. Particles were charged by copolymerization into the core of the particle of approximately 4 wt% of the ionic monomer n-tridodecyl-propyl-3-methacryloyloxy ammonium tetrakis [3,5-bis (trifluoromethyl) phenyl] borate (\ce[ILM-(C12)]+\ce[TFPB]-). The molecular structure of the polymeric NP3 nanoparticles is described, in greater detail, in the supplementary information. The ionic monomer and nanoparticles were prepared following the procedures outlined in previous workGillespie et al. (2013); Hussain, Robinson, and Bartlett (2013). Ionic dissociation of surface-bound \ce[ILM-(C12)]+\ce[TFPB]- groups generated a positive colloid charge of together with negative \ce[TFPB]- counterions in solutionGillespie et al. (2013).
III.2 Electrophoretic mobility
The electrophoretic mobility as a function of packing fraction was measured at using phase-analysis light scattering (Zetasizer Nano, Malvern, UK). The mobility , where is the electrophoretic velocity induced by an applied electric field of strength , was determined from the modulation in the phase of scattered light produced by a periodic triangular -field. Equilibrated samples were transferred into clean square quartz-glass cuvettes and a non-aqueous dip cell (PCS1115, Malvern) with a electrode gap placed in the cell. In a typical measurement, a series of runs were performed at different driving voltages between 10 V and 50 V and the scattering from a laser was collected at a scattering angle of . No systematic dependence of on was observed. Any measurement where the phase plot significantly deviated from the expected triangular form was discarded, and the measurement repeated. Since PMMA nanoparticles in dodecane are weakly scatterers of light, reliable electrophoretic mobilities were recorded over a relatively wide range of packing fractions, .
III.3 Modelling of electrophoretic mobility
The electrophoretic mobility of a colloidal particle is determined by a balance between electrostatic and hydrodynamic forces. In the limits of low concentration and the reduced mobility, defined by the expression (where is the solvent of viscosity), is equal to the scaled particle charge . At finite concentrations however, the mobility decreases approximately logarithmicallyLobaskin et al. (2007) with increasing , as frictional forces grow because of strengthening particle-particle interactions. To model the effects of interactions, we follow the theoretical analysis of Levine and NealLevine and Neale (1974) who proposed a cell model for the mobility in a concentrated dispersion, valid in the linear PB limit. OhshimaOhshima (1997) derived an equivalent expression,
| (8) | |||||
where is the potential at the cell boundary and, the integrand is a function of the scaled potential within the cell,
| (9) | |||||
with .
III.4 Small-angle X-ray scattering (SAXS)
SAXS measurements were performed at a temperature of on the Diamond Light Source (Didcot, UK) using the I22 beamline at a wavelength of and a sample to detector distance of leading to a useful -range of approximately 0.015 – . The scattering wave vector is defined as
| (10) |
where is the scattering angle and is the incident X-ray wavelength. Dispersions were loaded into reusable flow-through quartz capillary cells that were filled alternately with samples of the background solvent and the dispersion to allow accurate subtractions of the background. At least ten 2D images of each were collected, azimuthally averaged, transmission and background corrected according to established procedures to yield the scattered intensity , as a function of . An additional series of higher resolution measurements were made at the ESRF (Grenoble, France) on the ID02 beamline with a -range of approximately 0.01 – .
The intensity scattered by a dispersion of spherical particles with a narrow size distribution can be factored as
| (11) |
where is an instrumental factor, is the packing fraction, is the polydisperse particle form factor, and is the measured structure factorNarayanan (2007). This was determined experimentally from the intensity ratio,
| (12) |
where the dilute scattered intensity was measured at a sufficiently low packing fraction () to ensure that all interparticle interactions were suppressed and .
III.5 Charge screening
The effective screening length in the micelle-containing systems can not be calculated directly from Eq. 4 because the micellar ions are in equilibrium with neutral micelles, through an auto-ionization reaction of the form \ceM+ + M- ¡=¿ 2M. The mixture of charged and neutral micelles acts effectively as a charge buffer. To model the buffering process, we characterize the self-ionization equilibrium constant as , with the number density of the micelles. If the colloid has a surface charge of , then, from charge neutrality, the number density of positive ions in solution is . Adopting the particle radius as a natural length scale and introducing the scaled ion densities then we may express the scaled positive ion density simply as , where .
Substituting this expression into the law of mass action gives the equilibrium ion concentrations, in the presence of charged nanoparticles, as
| (13) |
The total ion concentration is therefore , which is less than the value of obtained by naively adding the salt and counterion densities together, demonstrating the charge buffering effect. From Eq. III.5 the corresponding screening parameter is
| (14) |
which in the limit of no background ions () reduces to the counterion-only limit
| (15) |
IV Results and Discussion
IV.1 Nanoparticles
We used nanoparticles with a core of poly(methyl methacrylate) [PMMA] of radius sterically stabilized by a chemically-grafted shell of poly-12-hydroxystearic acid [PHSA] of thickness suspended in dodecane. To determine the core radius , the excess (nanoparticle dispersion minus solvent) SAXS scattering profiles were measured from dilute dispersions (). The X-ray scattering length density of the core was calculated to be and the stabiliser layer as , where the uncertainty is due to the variation in mass density reported in the literature. The calculated X-ray scattering length density of dodecane is , so the shell contrast is weak and the scattering arises predominately from the PMMA core. To model the dilute particle data, we used a polydisperse core-shell model with a Schulz size distributionDi Cola et al. (2009) adjusting the (mean) core radius and the polydispersity to best describe the measured . The shell thickness was fixed at on the basis of previous measurementsLiddle, Narayanan, and Poon (2011); Di Cola et al. (2009). Agreement between the model calculations and the low- SAXS data is very good, with the fitted values of and listed in Table 2.
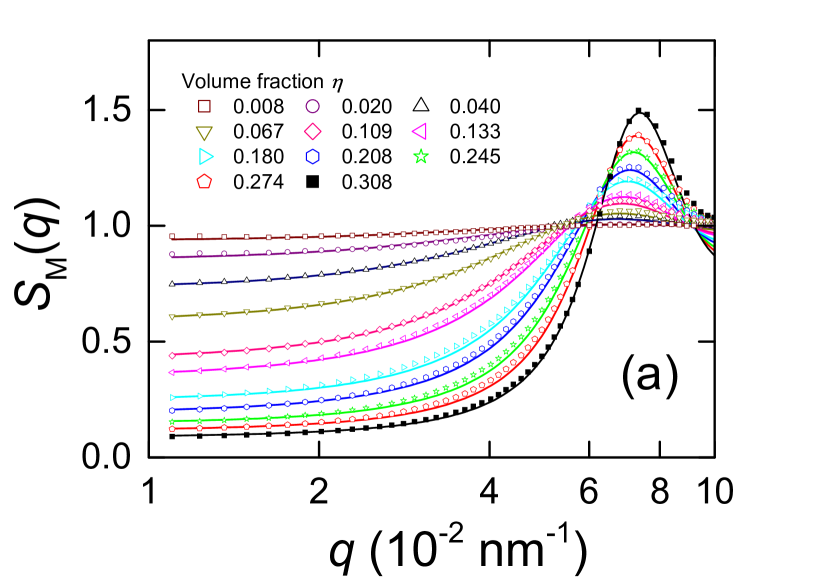
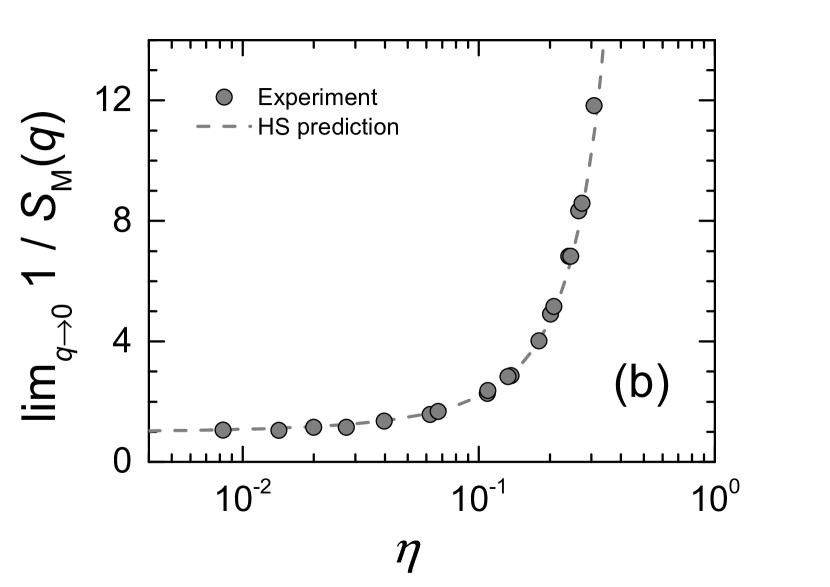
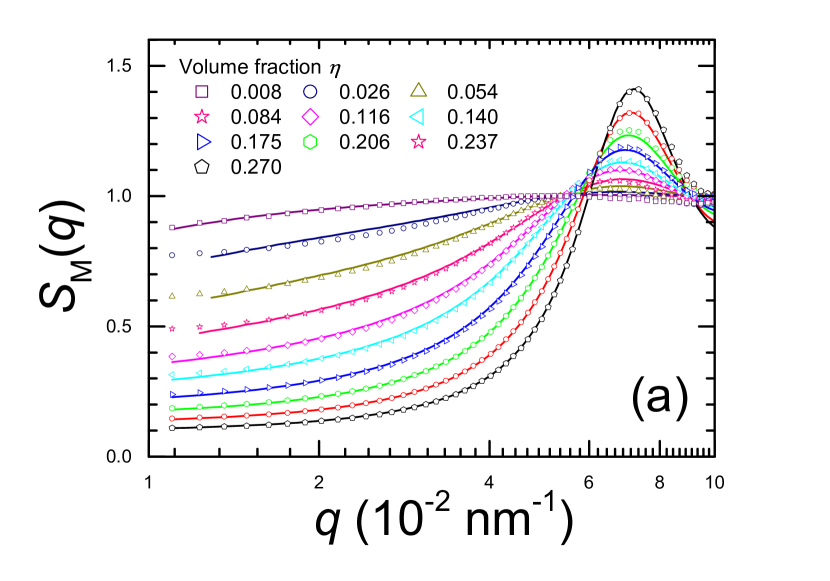
A thick polymeric shell is a highly efficient way to stabilize a nanoparticle but interpenetration of polymers in the shell can, particularly at high concentrations, result in a softness in the mutual interactions between grafted particles. To test if the core-shell structure of the synthesised nanoparticles was altered in concentrated dispersions we conducted a series of SAXS measurements, using the procedures outlined in Sec. III.4, to determine the structure factor of uncharged particles as a function of packing fraction. The experimental results for are depicted by the symbols shown in Fig. 2(a). The solid lines show fits to the measured using a polydisperse hard-sphere (HS) model, using as adjustable parameters the effective HS radius , and the ratio , where is the experimentally-determined core packing fraction. On the basis of the dilute form factor results, the size polydispersity was fixed at . The HS calculations can be seen to describe the experimental structure factors extremely well over a wide range of wavevectors and nanoparticle concentrations. The hard-sphere character of the nanoparticles was confirmed further by comparing the low- limit of the measured inverse colloid-colloid structure factor with the Carnahan and Starling prediction for the isothermal compressibility of a hard-sphere fluid. The agreement evident in Fig. 2(b) is very good. Overall, we found an effective HS radius of , which is smaller than the magnitude of the core-shell radius estimated from the form factor analysis. We attribute this discrepancy to interpenetration of interlocking polymer shells at high packing fractions. We therefore fix the effective HS radius for our systems as . The resulting values for the effective HS radius (), the hydrodynamic radius determined by dynamic light scattering (), the core radius () from SAXS analysis, and the normalized polydispersity for the systems studied are collected together in Table 2.
| Nanoparticle | () | () | () | |
|---|---|---|---|---|
| NP1 | 43.3 | 49.0 | 38.3 0.3 | 0.10 |
| NP2 | 58.0 | 63.0 | 53.0222SAXS data not recorded, so assume with . | 0.10 |
| NP3 | 33.7 | 36.0 | 28.7 0.2 | 0.13 |
IV.2 Charge regulation
To generate a particle charge we have used two approaches: (a) surface modification, and (b) adsorption of charged reverse micelles. Although the molecular mechanism of particle charging in low polarity solvents is not well understood, different hypotheses have been proposed which emphasise either ‘charge created’ on the particle by the dissociation of surface groups or ‘charge acquired’ by the adsorption of charged surfactant species. Our experiments use examples from both categories. System NP3 was charged by the addition of a lipophilic ionic comonomer to the dispersion synthesis (for details, see Sec. III.1). Dissociation of an anion from the surface of the nanoparticle generated a positive particle charge. The charge equilibrium can be represented by the single-site CR1 dissociation process,
| (16) |
where denotes a positively-charged surface-bound group, and a negative species. Nanoparticle NP1 and NP2 were, in contrast, charged negative by addition of the oil-soluble ionic surfactant Aerosol-OT at molar concentrations above the critical micellar concentration so that spherical reverse micelles form in solution. It has been proposedRoberts et al. (2008); Lee, Zhou, and Behrens (2016) that charge regulation in systems containing AOT is a multi-site CR2 process with two independent association reactions,
| (17) |
where refer to charged reverse micelles and the balance between the two competing adsorption processes (and the net charge) depends on the hydrophilicity of the particle surface.
The effect of charge regulation on the surface charge was demonstrated by measurement of the reduced electrophoretic mobility as a function of packing fraction , with the data shown in Fig. 3. For a comparison between different nanoparticle batches, we consider all mobilities in reduced units where is the viscosity of the solvent, and is the solvent-specific Bjerrum length. For isolated particles, the reduced mobility assumes the value in the Hückel limit (), where is the reduced mobility at infinite dilution and is the dimensionless surface potentialLobaskin et al. (2007). However as dispersions become more concentrated the electrophoretic mobility drops. When the electrostatic interactions are strongly screened () the electrophoretic mobility shows only a relatively weak concentration dependence, since the electric-field-driven dynamics originates only from within a thin interfacial region at the particle’s surfaceAnderson (1989). The mobility drop by a factor of as is increased from 10-4 to 10-2 seen in Figure 3 is therefore quite surprising. A similar dependence of was seen for all samples studied, with the data plotted in Fig. 3(a) suggesting that concentrations of are still not sufficiently low enough to reach the infinite-dilution limit .
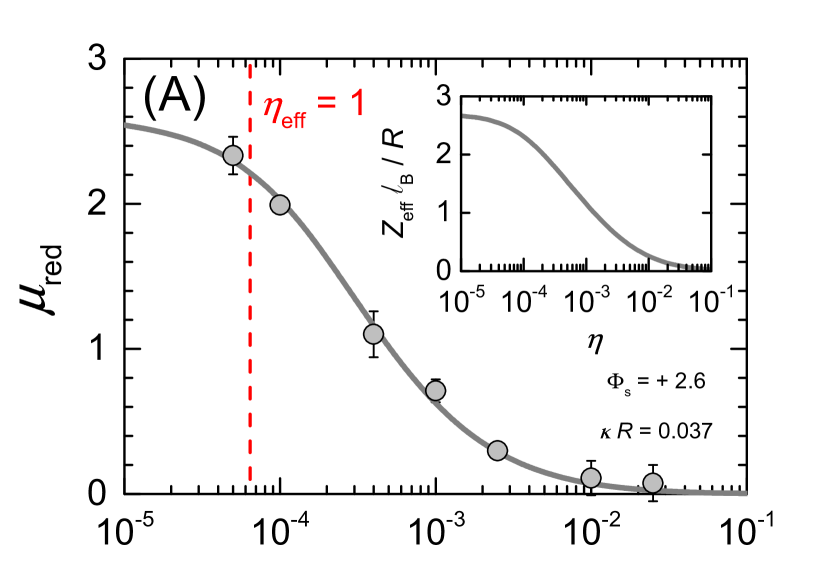
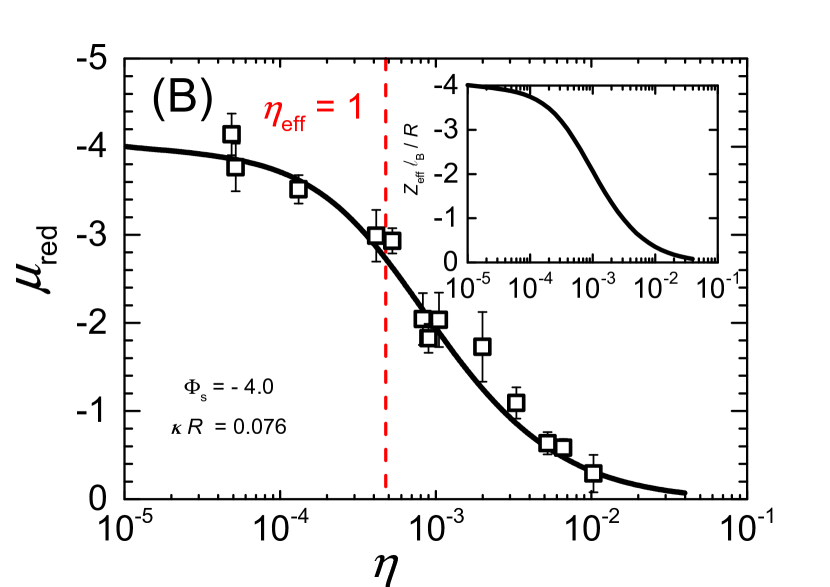
Qualitatively, the sharp drop in the electrophoretic mobility occurs because of the strong mutual interactions between charged nanoparticles in the weak screening limit. The reduction in will be significant at concentrations where the electrical double-layers of neighbouring particles first begin to overlap. If we approximate a charged nanoparticle and its ionic atmosphere as a new effective particle of radius then mutual overlap will occur when the effective volume fraction is of order unity, or equivalently . In the NP3 batch, where , concentration effects will be important at concentrations as low as . The vertical dotted lines in Figure 3 depict the concentration where double layer overlap is significant and, as evident from the plot, these lines also pretty effectively delineate the regime where begins to decrease.
To quantify the dramatic change in the electrophoretic mobility we use a Kuwabara cell model, first proposed by Levine and Neale (1974), to predict as a function of . We work in a spherical Wigner-Seitz cell of radius containing a single particle together with neutralizing co-ions and counterions. In the treatment detailed by Ohshima (1997), which is accurate for low surface potentials and for all values, the reduced electrophoretic mobility is a function of the equilibrium electric potential (and its derivative) inside the cell. At low packing fractions, simulations have shownEverts, Boon, and van Roij (2016); Smallenburg et al. (2011) that the particle charge predicted by either of the CR1 and CR2 models can be accurately mimicked by assuming a constant potential boundary condition. Fixing the packing fraction , we solve the non-linear Poisson-Boltzmann equation varying the surface potential and the ionic strength of the reservoir and calculate (for details see Sec. III.3). The results of these calculations are plotted as the solid lines in Figure 3. The calculations are seen to be in excellent agreement with the experimental data and confirm that our dispersions are indeed charge regulated. The consequences of regulation are revealed in the inset plots of Fig. 3, where the dependence of on the volume fraction is plotted. We found a similar level of agreement between measured and calculated electrophoretic mobilities as the screening parameter was changed. The comparison between the experimental and numerical mobilities as was varied over almost an order of magnitude is presented in the supplementary information.
| Experimental system | Fitted parameters | |||
|---|---|---|---|---|
| Nanoparticle | [] | |||
| NP1 | 5.0 | 0.033 | 0.060 | |
| NP1 | 25 | 0.078 | 0.088 | |
| NP1 | 50 | 0.11 | 0.090 | |
| NP1 | 250 | 0.24 | 0.54 | |
| NP2 | 5.0 | 0.049 | 0.076 | |
| NP3 | 0.0 | 0.0 | 0.037 | |
IV.3 Charge at high concentrations
The low density mobility data of Fig. 3 suggest that the particles should continuously discharge with increasing particle concentration. Testing this prediction in concentrated dispersions is however tricky. Light scattering measurements of are limited to low concentrations by multiple scattering effects. At high , less direct methods must be used. To this end, we have recorded the positional correlations between nanoparticles, which arise as a result of both charge and excluded volume interactions between particles, using small-angle X-ray scattering (SAXS) techniques. As we demonstrate below, careful modelling of the measured structure factor yields a robust measure of the effective charge .
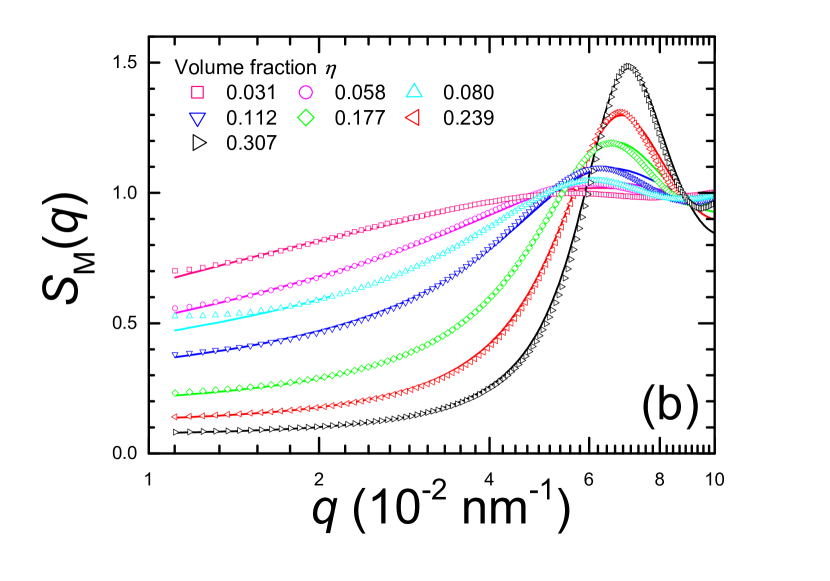
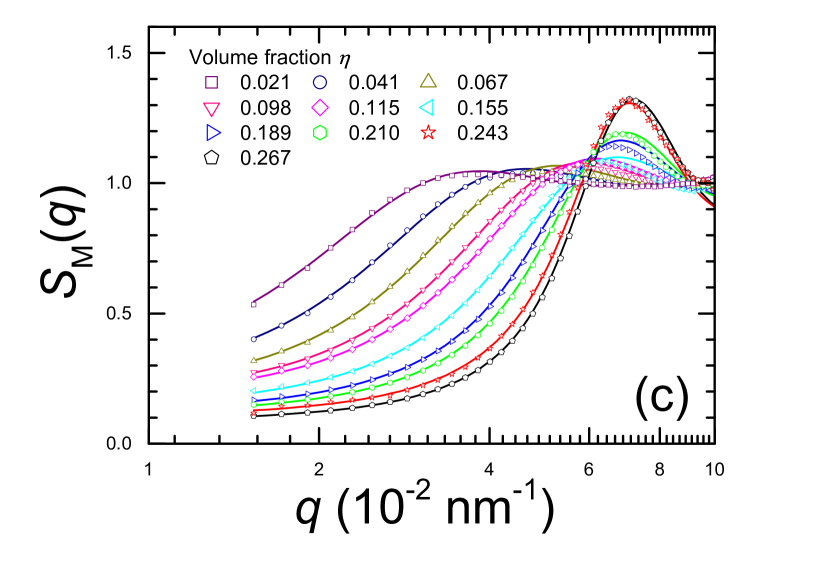
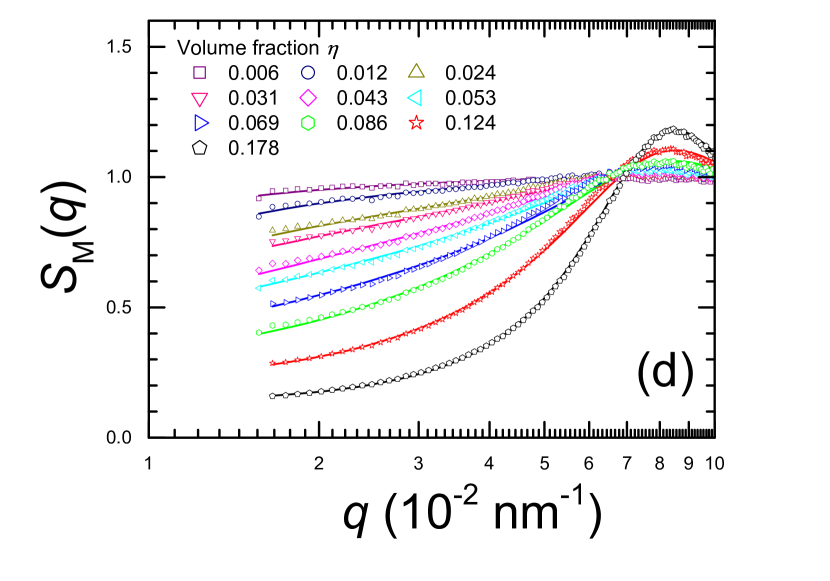
The microstructure of charge-regulating dispersions has been investigated as a function of packing fraction. The symbols in figure 4(a)-(d) summarizes the measured structure factor for four different charged systems. With increasing , interparticle interactions start to dominate and the dispersions become more highly structured. This results in the emergence of a broad nearest neighbour peak at while at the same time, the structure factor at low decreases, behaviour that is characteristic of a purely repulsive fluid system. The lack of sharp correlation peaks in the structure factors indicates a fluid state of nanoparticles. We see no evidence for particle crystallization. Indeed since the strength of Coulombic repulsion scales linearly with size (at the same scaled charge , see Eq. 3), charge correlations are expected to be weak in a dispersion of nanoparticles with . To confirm charge interactions are not strong enough to drive crystallization at the densities studied here we refer to the phase transition data obtained recently on much larger charged colloidsKanai et al. (2015). In the case where the crystallization boundary was accurately modelled by the one-component plasma condition Kanai et al. (2015), where is defined as , with the typical spacing between particles. In scaled units, the coupling constant is . Using values of and we estimate for our nanoparticle system at , confirming the conclusion from the data that all of the suspensions studied here are disordered fluids.
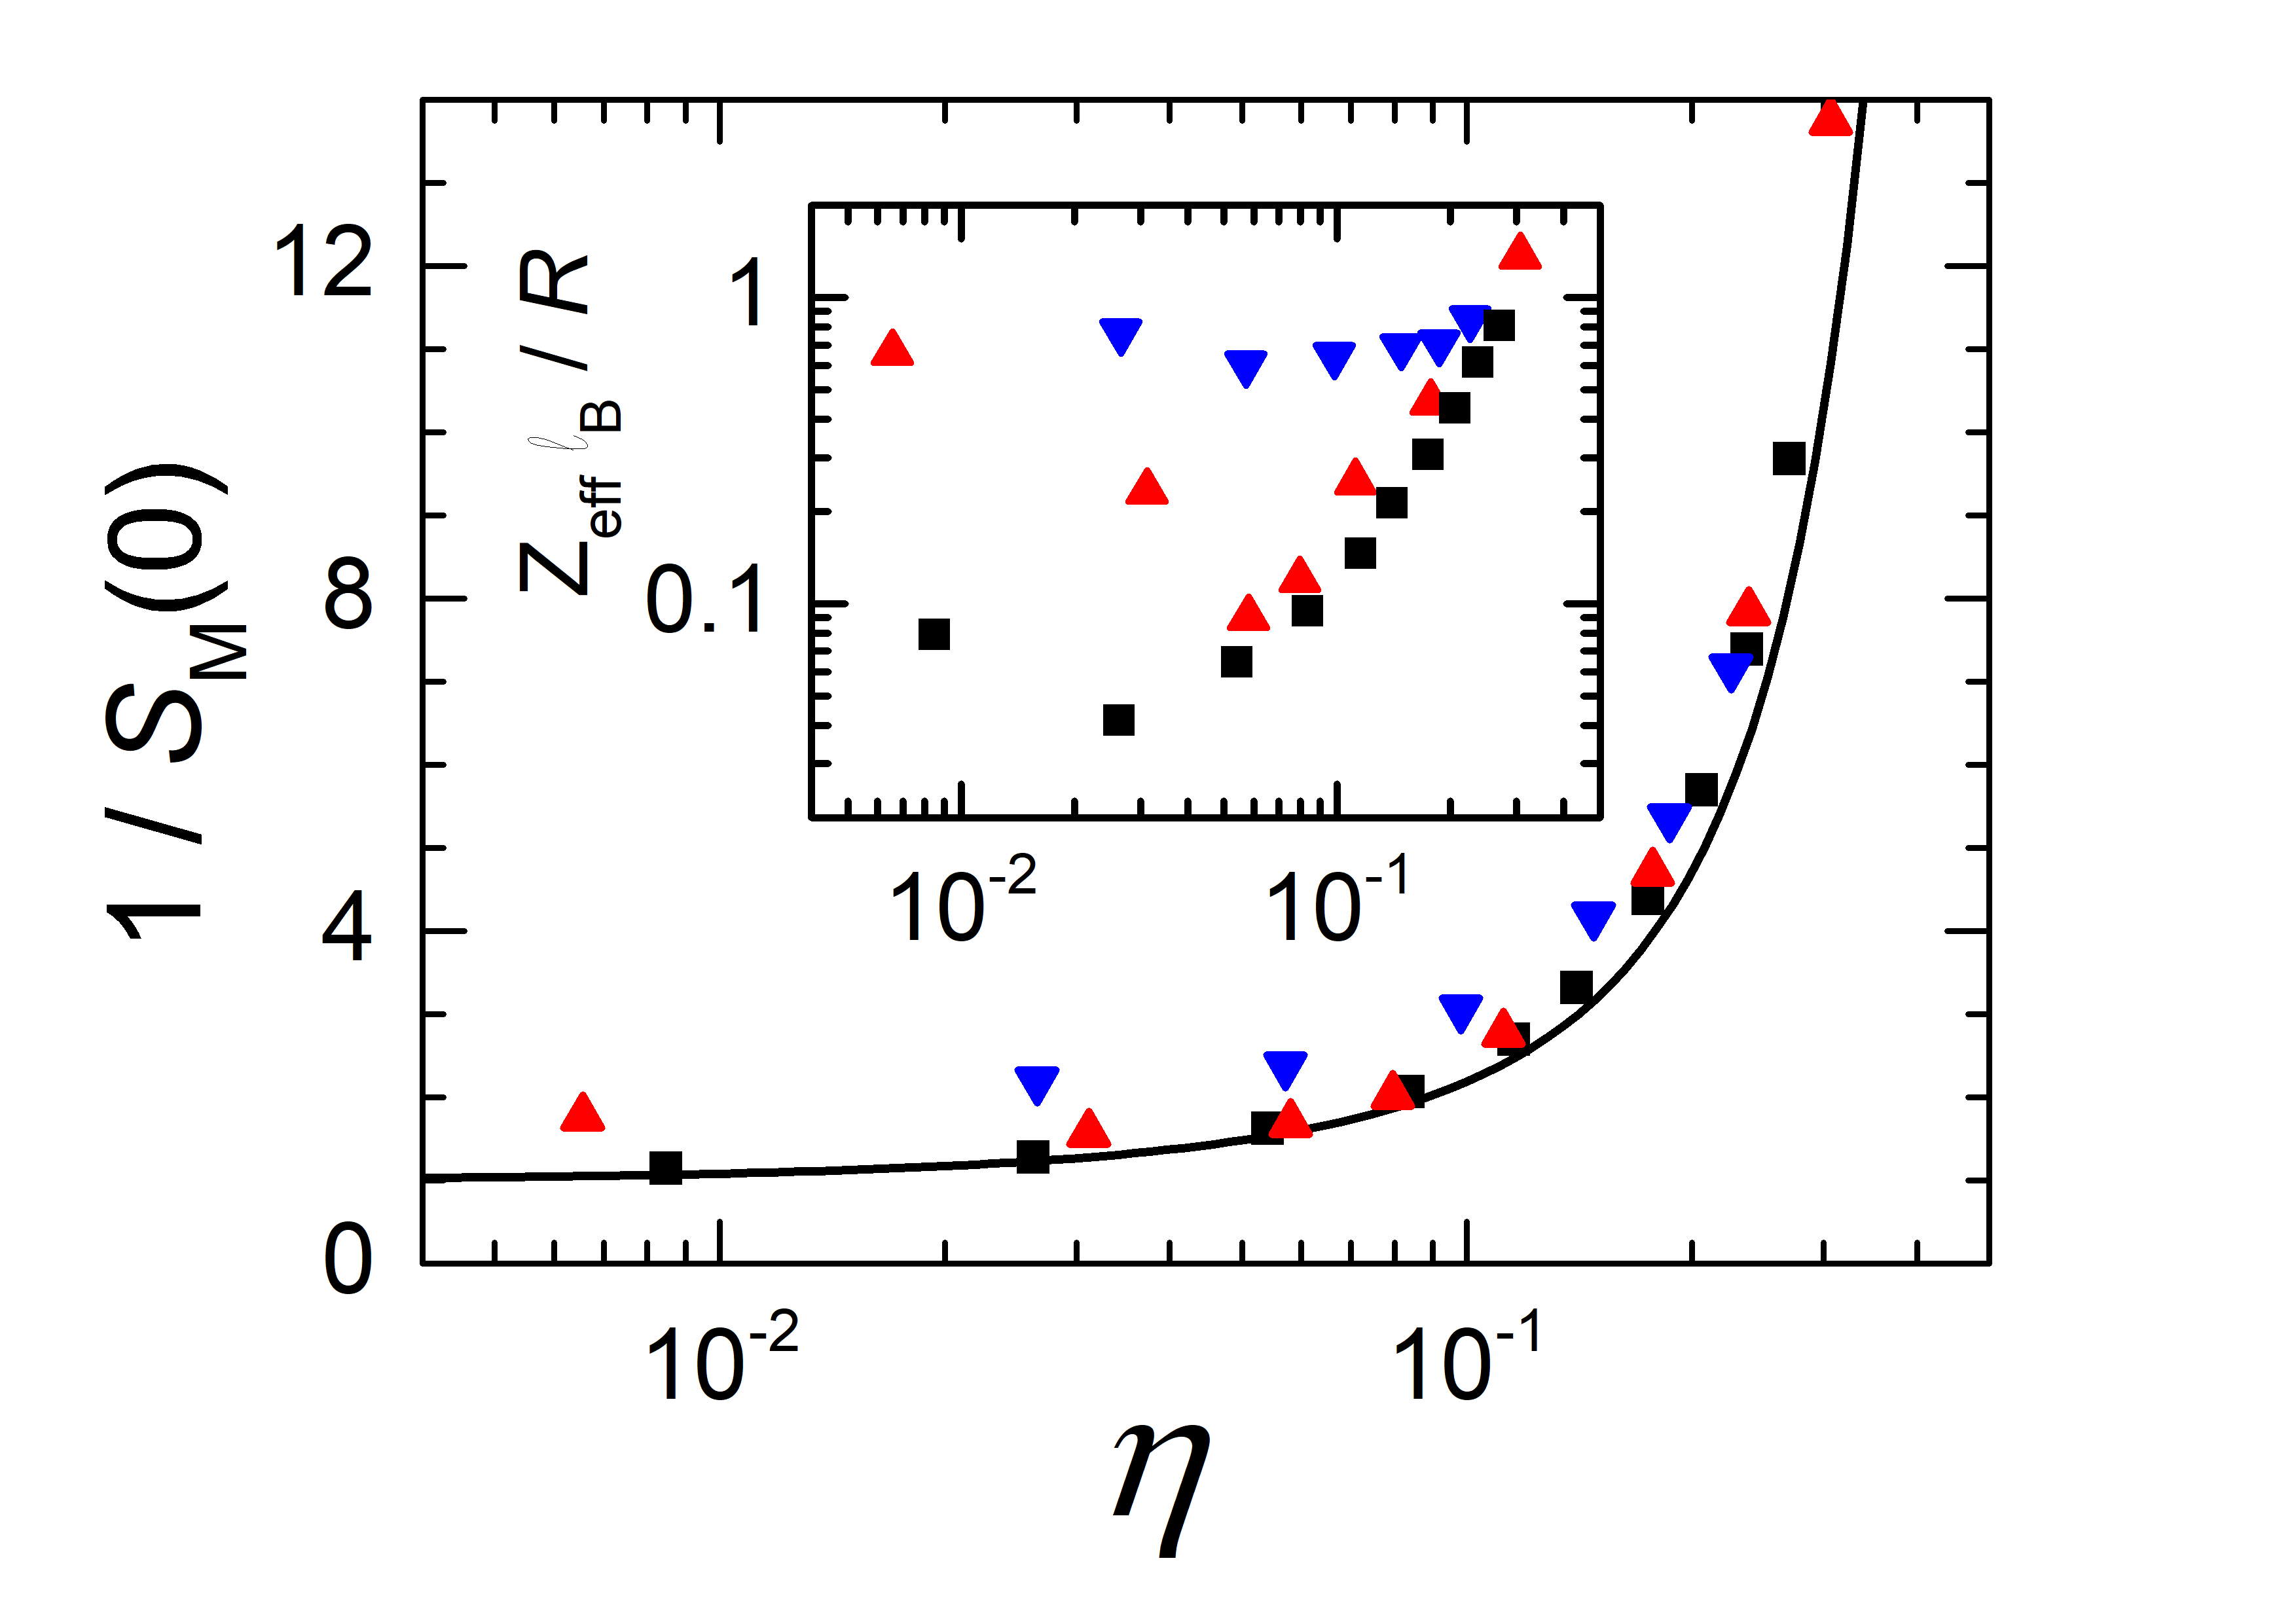
To begin our analysis of the scattering data, we determine the concentration dependence of the inverse isothermal osmotic compressibility . Here is the osmotic pressure of the suspension measured at a colloid number density of and the derivative is evaluated at a constant chemical potential of saltDobnikar et al. (2006). From the Kirkwood-Buff relationKirkwood and Buff (1951) the infinite-wavelength limit of the colloid-colloid structure factor, , is related to by the identity,
| (18) |
which is exact for a monodisperse suspension. Experimentally, we determined the low- limit by extrapolating a linear plot of versus to . The resulting estimates of the reduced inverse osmotic compressibility as a function of the packing fraction for dispersion NP1 with AOT concentrations of 5, 25 and are plotted in Figure 5. At each volume fraction and AOT concentration, the effective particle charge was determined using a mean spherical approximation (MSA) expression for the structure factor of a HSY fluid, recently derived by Vazquez-Rodriguez and Ruiz-Estrada (2016). The only free parameter in the computation is , since the screening length is fixed by (Eq. 14) and the self-ionization equilibrium constant is known from previous workRoberts et al. (2008).
The inset plot in Figure 5 shows the particle charges computed from the long-wavelength limit of the structure factor. Surprisingly, we see substantial disagreements at intermediate packing fractions from the CP predictions, as is evident from a quick comparison between Figures 1 and 5. The effective charge does not decrease smoothly with increasing but instead displays a minimum at before finally increasing in magnitude with particle density.
To confirm the validity of the trends identified above, we have determined the particle charge using a second independent technique. The full- dependence of the measured structure factor was compared to a calculated using the quasi-exact MPB-RMSA integral equation schemeHeinen et al. (2011), assuming a HSY effective pair potential. The effect of size polydispersity was neglected since polydispersity indices are small (see Table 2) and contains no sharp peaks. In all, two adjustable parameters were used in our theoretical modelling of : the scaled particle charge and the ratio , where is the experimentally assigned core volume fraction. The screening parameter was derived self-consistently from the fitted values for and using Eq. 14. To check the reliability of this analysis, we first fitted the structure factors measured in the uncharged system (without any added AOT). The fitted charge was, as expected, close to zero with an average of , validating our approach.
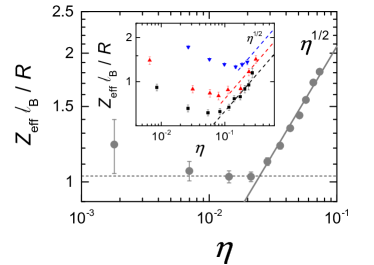
Reassured by the accuracy of our fitting strategy, was determined for the charged systems. The resulting particle charges as a function of , are reproduced in Fig. 6. The increase in the effective charge at high densities, evident in the compressibility data, is particularly clear for the counterion-only system (NP3, main body of Fig. 6). The inset plot confirms that the same qualitative trend persists when small amounts of salt are present (system NP1). Remarkably, we find that all of the experimental data is consistent with an asymptotic scaling of the particle charge, , at high packing fractions. The evidence for this expression is strongest from the data collected on the no-salt system (NP3) although a dependence is also clearly visible in the NP1 dataset, particularly at low . Finally, we note that the onset of the scaling regime moves to higher packing fractions with increasing background salt concentrations. So, for instance, in the no-salt system the charge starts to increase at , while at the scaling regime is delayed until , for , and for . Consistent with this picture, at the highest salt concentration () where , the charge decreases monotonically with increasing (data not shown) and there is no sign of any charge minimum.
IV.4 Origins of charge increase
We emphasise that the pronounced minimum in the effective charge seen in Fig. 6 is not caused by a change in the microstructural order of the suspension, such as crystallization. First, the height of the main peak in the structure factor is significantly smaller than the Hansen-Verlet criterion of for freezingHansen and Verlet (1969) even after allowing for polydispersityKesavamoorthy et al. (1989), second the structure factor contains no sharp peaks indicative of crystal formation, and finally comparison with the phase boundaries measured in suspensions of much larger-sized charged particlesKanai et al. (2015) suggest our samples lie deep within the fluid phase of charged particles. To rationalize the increase in at high densities we go back and reconsider the consequences of constant potential boundary conditions, recognizing that the CP model fairly accurately mimics charge regulation. The reduced particle charge is a dimensionless quantity, so it can depend only on combinations of dimensionless parameters. In the usual descriptionSmallenburg et al. (2011) of a dispersion of constant-potential spheres the set of dimensionless variables is chosen as the packing fraction , the screening parameter , and the scaled surface potential . However, a more intuitive picture emerges if we use the average separation between particles in units of the Debye length , in place of . The dimensionless ratio details the extent of the overlap between the electrical double layers surrounding neighbouring particles, with large corresponding to widely separated particles. dictates the curvature of the electrostatic potential between particles. From Gauss’s law, the charge on the surface of the nanoparticle is
| (19) |
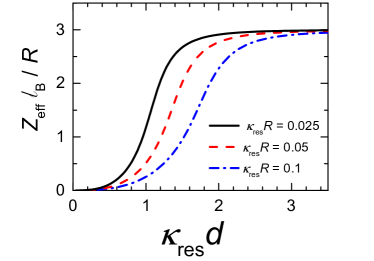
where the prime denotes a derivative with respect to the radial variable. So a smaller value of will correlate naturally with a smaller particle charge. Numerical solutions of the CP model for as a function of , plotted in Figure 7, confirm this picture. When particles are widely spaced the colloidal charge plateaus at an asymptotic value, which in linear-screening theory is
| (20) |
Moving the particles closer together results in progressive overlap of the counterion atmospheres around each particle and subsequent colloid discharge, with as . Furthermore, Figure 7 reveals that the charge dependence is only weakly dependent on , under the weak-screening conditions () appropriate to our experiments.
Before we compare directly the experimental results and cell model predictions we emphasise a key distinction between the two approaches. The cell model calculations, in common with most theory and simulation studies, utilize a grand-canonical treatment of the electrolyte in which the charged dispersion is assumed to be osmotically-coupled to an external ion reservoir with a constant chemical potential, so that calculations are performed at a fixed value of . By contrast, in experiments there is no ion reservoir. Measurements are conducted in a canonical ensemble, in which the equilibrium concentration of mobile ions and hence varies with both the packing fraction and charge . To estimate the density-dependent screening in experiments we assume all ions are univalent and use Eq. 4, or its equivalent in scaled units,
| (21) |
The dimensionless range is accordingly,
| (22) |
Inspection of Eq. 22 reveals a subtle dependence of on particle concentration. In the conventional salt-dominated regime, where the added electrolyte exceeds the number of counterions released from the surface of the particles, the overlap of the double layers between particles grows ( reduces) as the dispersion is concentrated. This behaviour is however reversed in the no-salt limit, where the right-hand term of Eq. 22 dominates. In this regime, so that, rather counter-intuitively, colloids become less strongly interacting at high packing fractions. The cross-over from a salt-dominated to a counterion-dominated screening regime occurs at a particle volume fraction which may be identified with the location of the turning point, where . Differentiation of Eq. 22 yields the estimate for the cross-over packing fraction ,
| (23) |
above which we enter the counterion-dominated regime. Since typically Eq. 23 reveals that the counterion-dominated regime will be accessible only if .
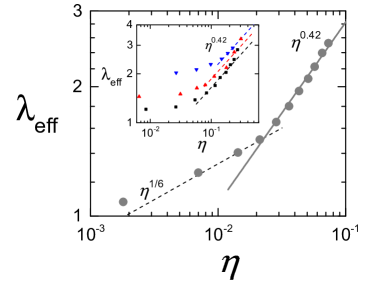
To quantify in which screening regime our experiments lie, we determine the dimensionless range as a function of using the particle charge measured by SAXS (Fig. 6), and the in-situ screening parameter calculated from Section III.5. Figure 8 shows the resulting packing fraction dependence for the no-salt system (NP3, circles), and for the NP1 system at AOT concentrations of 5 (squares), 25 (up-triangles) and (down-triangles) in the inset plot. We identify three interesting features. First, Fig. 8 reveals that increases with increasing , so our SAXS measurements all lie within the counterion-dominated screening regime. This conclusion agrees with the cross-over volume fractions estimated from Eq. 23. So, for instance, the minimum charge measured in the () system is and Eq. 23 predicts , while SAXS experiments were performed at concentrations of . Second, the low- data is consistent with the dependence expected for the counterion-only limit. This is particularly evident in the experimental data for the NP3 system, where the background ion concentration is close to zero. Finally, we note that this asymptotic dependence only holds for low : at intermediate and high volume fractions a new power-law regime with appears. This is most clearly seen in the counterion-only data. We note from Eq. 23 that a power-law of suggests that the particle charge must scale as for a no-salt system, consistent with Fig. 6.
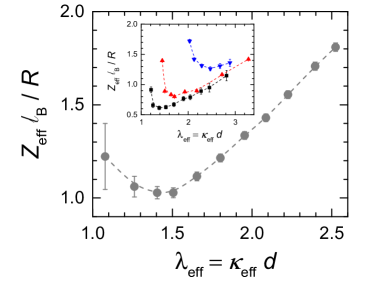
The observation that the SAXS data lie within the counterion-dominated screening regime rationalizes qualitatively why the measured particle charge increases with increasing particle density. Numerical solutions of the nonlinear Poisson-Boltzmann equation show that CP-particles should charge-up (see Fig. 7) as the range of the electrostatic interactions becomes significantly smaller than a typical particle spacing. In the no-salt limit, the thickness of the double layer shrinks faster with increasing colloid concentration () than the mean spacing between particles () so that as the packing fraction is increased, charged particles become less highly correlated, grows, and the particle charge should accordingly be boosted. To facilitate a direct comparison, we plot in Fig. 9 experimental values for the dimensionless particle charge as a function of the range of the interactions. The data are represented by the symbols and should be compared to the CP-model predictions plotted in Fig. 7. Fig. 9 confirms that is an increasing function of , at least at large , in broad agreement with CP predictions. However, a pronounced minimum appears in the experimental data at , which is not predicted by the cell model. This may be a consequence of the neglect of three-body and higher order correlationsKlein et al. (2002); Russ et al. (2002) in a spherical approximation. As is reduced, each charged particle interacts not only with its immediate shell of neighbours but increasingly with the next nearest neighbour shell. Three-body interactions between charged particles are attractive within Poisson-Boltzmann theoryRuss et al. (2002), a fact which has been interpreted in terms of electrostatic screening by macro-ionsKlein et al. (2002). We speculate that this many-body mechanism of charge screening, which will be strongest at small , could enhance the dissociation of surface charge groups and so increase the particle charge above the predictions of a simple spherical approximation.
V Conclusions
We have determined the density dependence of the structure factor in weakly-charged nonpolar colloidal dispersions using small-angle scattering techniques. An extended range of particle number densities was employed, with colloid packing fractions varying by a factor of approximately . By utilizing small radii nanoparticles and low ionic strengths, typical of nonpolar systems, we ensure measurements remain in the weak screening regime () even up to packing fractions approaching 30%. The effective charge of the particles was determined from a comparison between and structure factors calculated from the highly-accurate modified penetrating-background corrected rescaled mean spherical approximation (MPB-RMSA) introduced by Heinen et al. (2011). The Debye screening parameter was calculated self-consistently from the effective charges and the measured background ion concentrations. The resulting values are in near quantitative agreement with effective charges measured by electrophoresis, at least for low packing fractions where mobility measurements are feasible. Our results for cover a broader range of packing fractions than previous studies and allow us to scrutinize in great detail predictions for the density-dependence of electrostatic interactions in concentrated charged dispersions.
This work suggests that the Derjaguin-Landau-Verwey-Overbeek (DLVO) theory widely used to describe the interaction between two uniformly-charged particles, cannot describe nonpolar colloids. We test this conclusion by examining two different experimental systems, in which charge was generated by, either the dissociation of surface-bound groups or, alternatively by the adsorption of charged surfactant micelles. DLVO theory assumes a fixed spherically-uniform charge distribution. The results presented here clearly demonstrate that such an assumption does not hold in the case of nonpolar dispersions where colloids are charge-regulated and surface charge density varies as a function of packing fraction. We find that a charge regulating system is less repulsive than an equivalent dispersion with a fixed charge distribution. This is due to a reduction in the dissociation of weakly-ionizing groups as their separation decrease, driven by the need to avoid a local increase in the counterion density in the region between neighbouring colloids.
Theoretical models of charge regulationEverts, Boon, and van Roij (2016); Smallenburg et al. (2011) predict a strong decrease in the effective charge upon increasing particle concentration. While we find that does indeed decrease at low packing fractions, our data reveals unexpectedly a pronounced minimum in the effective charge at . For , the effective charge increases with particle concentration in apparent disagreement to existing models. We observe in all samples a near square-root scaling of the measured effective charge, , at high densities. The packing fraction at the charge minimum is in the case of a no-salt system and shifts to progressively higher volume fractions (reaching at ) as the salt concentration in the system is increased.
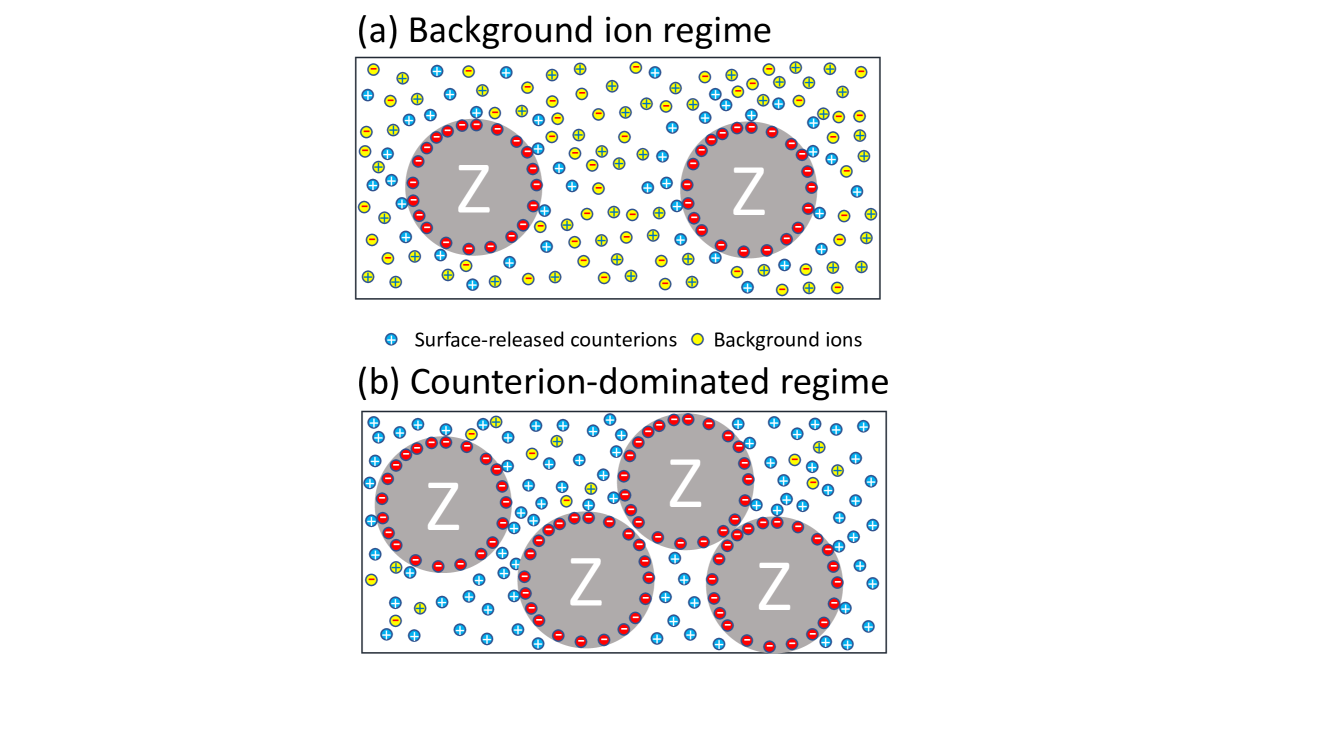
Our findings can be explained in terms of a crossover from background-ion to counterion-dominated screening as the colloid concentration is increased. The ideas are illustrated in Fig. 10. At low , background salt ions dominate the screening (since ions from the dissociation of surface groups on the particles are negligible - see Fig. 10(a)) so is independent of the colloid concentration. The predictions of charge regulation models (which assume constant ) apply directly, and the effective charge reduces with increasing . By contrast, at high packing fractions, ions from the particles outnumber the bulk salt ions (see Fig. 10(b)). As the number of ions released from the surface of the particles depends on the number of colloids the screening parameter becomes -dependent. Electrostatic screening then increases as the particle volume fraction grows. The increased screening at high reduces the coupling between charge-regulated particles, which allows the particle charge to grow. The non-monotonic density dependence of seen in experiments is therefore a consequence of a crossover from a salt-dominated to a counterion-dominated screening regime at high . Finally, we note that the enhanced charge repulsion at high particle concentration evident in our data may account for the unusual high colloidal stability of nanoparticle dispersions which has been reportedBatista, Larson, and Kotov (2015).
Acknowledgments
JEH was supported by EPSRC CDT grant EP/G036780/1 and DAJG by a studentship from Merck Chemicals. We thank Marco Heinen for his MPB-RMSA code. Finally, the authors would like to thank the ESRF and the Diamond Light Source for X-ray beam time (experiments SC-3655 and SM8982).
References
- Batista, Larson, and Kotov (2015) C. A. S. Batista, R. G. Larson, and N. A. Kotov, Science 350, 1242477 (2015).
- Derjaguin and Landau (1941) B. V. Derjaguin and L. Landau, Acta Phys. Chim. URSS 14, 633 (1941).
- Verwey and Overbeek (1948) E. Verwey and J. T. G. Overbeek, Theory of the stability of lyophobic colloids (Elsevier, New York, 1948).
- Siber, Losdorfer Bozoic, and Podgornik (2012) A. Siber, A. Losdorfer Bozoic, and R. Podgornik, Phys. Chem. Chem. Phys. 14, 3746 (2012).
- Ninham and Parsegian (1971) B. W. Ninham and V. A. Parsegian, J. Theor. Biol. 31, 405 (1971).
- Behrens and Borkovec (1999) S. H. Behrens and M. Borkovec, J. Phys. Chem. B 103, 2918 (1999).
- Dan (2002) N. Dan, Langmuir 18, 3524 (2002).
- Trefalt, Behrens, and Borkovec (2016) G. Trefalt, S. H. Behrens, and M. Borkovec, Langmuir 32, 380 (2016).
- Kirkwood and Shumaker (1952) J. G. Kirkwood and J. B. Shumaker, Proc. Natl. Acad. Sci. U.S.A. 38, 863 (1952).
- Lund and Jonsson (2013) M. Lund and B. Jonsson, Q. Rev. Biophys. 46, 265 (2013).
- Adzic and Podgornik (2015) N. Adzic and R. Podgornik, Phys. Rev. E 91, 022715 (2015).
- Popa et al. (2010) I. Popa, P. Sinha, M. Finessi, P. Maroni, G. Papastavrou, and M. Borkovec, Physical Review Letters 104, 228301 (2010), 22.
- Cao et al. (2017) T. Cao, T. Sugimoto, I. Szilagyi, G. Trefalt, and M. Borkovec, Physical Chemistry Chemical Physics 19, 15160 (2017).
- Lee, Zhou, and Behrens (2016) J. Lee, Z.-L. Zhou, and S. H. Behrens, Langmuir 32, 4827 (2016).
- Everts, Boon, and van Roij (2016) J. C. Everts, N. Boon, and R. van Roij, Phys. Chem. Chem. Phys. 18, 5211 (2016).
- Smallenburg et al. (2011) F. Smallenburg, N. Boon, M. Kater, M. Dijkstra, and R. van Roij, J. Chem. Phys. 134, 074505 (2011).
- Andelman (1995) D. Andelman, in Handbook of Biological Physics, Vol. Volume 1, edited by R. Lipowski and E. Sackmann (Elsevier, New York, 1995).
- Markovich, Andelman, and Podgornik (2016) T. Markovich, D. Andelman, and R. Podgornik, Europhys. Lett. 113, 26004 (2016).
- Royall et al. (2006) C. P. Royall, M. E. Leunissen, A.-P. Hynninen, M. Dijkstra, and A. v. Blaaderen, J. Chem. Phys. 124, 244706 (2006).
- Kanai et al. (2015) T. Kanai, N. Boon, P. J. Lu, E. Sloutskin, A. B. Schofield, F. Smallenburg, R. van Roij, M. Dijkstra, and D. A. Weitz, Phys. Rev. E 91, 030301(R) (2015).
- Vissers et al. (2011) T. Vissers, A. Imhof, F. Carrique, A. V. Delgado, and A. van Blaaderen, J. Colloid Interface Sci. 361, 443 (2011).
- Lin and Wiesner (2012) S. Lin and M. R. Wiesner, Langmuir 28, 11032 (2012).
- Albers and Overbeek (1959a) W. Albers and J. T. G. Overbeek, J. Colloid Sci. 14, 501 (1959a).
- Albers and Overbeek (1959b) W. Albers and J. T. G. Overbeek, J. Colloid Sci. 14, 510 (1959b).
- Mishchuk, Sanfeld, and Steinchen (2004) N. A. Mishchuk, A. Sanfeld, and A. Steinchen, Adv. Colloid Interface Sci. 112, 129 (2004).
- Bensley and Hunter (1983) C. N. Bensley and R. J. Hunter, J. Colloid Interface Sci. 92, 436 (1983).
- van Mil, Crommelin, and Wiersema (1984) P. J. J. M. van Mil, D. J. A. Crommelin, and P. H. Wiersema, J. Colloid Interface Sci. 98, 61 (1984).
- Green and Parfitt (1988) J. H. Green and G. D. Parfitt, Colloids Surf. 29, 391 (1988).
- Wang et al. (2013) Q. Wang, G. Luo, J. Niu, J. Jin, and H. Wang, Energy Sources Part A 35, 2033 (2013).
- Klein et al. (2002) R. Klein, H. H. von Grunberg, C. Bechinger, M. Brunner, and V. Lobaskin, J. Phys.:Cond. Mater. 14, 7631 (2002).
- Russ et al. (2002) C. Russ, H. H. von Grunberg, M. Dijkstra, and R. van Roij, Phys. Rev. E 66, 011402 (2002).
- Löwen and Kramposthuber (1993) H. Löwen and G. Kramposthuber, Europhys. Lett. 23, 673 (1993).
- Dobnikar et al. (2006) J. Dobnikar, R. Castaneda-Priego, H. H. von Grunberg, and E. Trizac, New J. Phys. 8, 277 (2006).
- Denton (2000) A. R. Denton, Phys. Rev. E 62, 3855 (2000).
- Trizac et al. (2003) E. Trizac, L. Bocquet, M. Aubouy, and H. H. von Grunberg, Langmuir 19, 4027 (2003).
- Roberts et al. (2008) G. S. Roberts, R. Sanchez, R. Kemp, T. Wood, and P. Bartlett, Langmuir 24, 6530 (2008).
- Hsu, Dufresne, and Weitz (2005) M. F. Hsu, E. R. Dufresne, and D. A. Weitz, Langmuir 21, 4881 (2005).
- Antl et al. (1986) L. Antl, J. W. Goodwin, R. D. Hill, R. H. Ottewill, S. M. Owens, S. Papworth, and J. A. Waters, Colloids Surf. 17, 67 (1986).
- Hussain, Robinson, and Bartlett (2013) G. Hussain, A. Robinson, and P. Bartlett, Langmuir 29, 4204 (2013).
- Gillespie et al. (2013) D. A. J. Gillespie, J. E. Hallett, O. Elujoba, A. F. C. Hamzah, R. M. Richardson, and P. Bartlett, Soft Matter 10, 566 (2013).
- Smith et al. (2013) G. N. Smith, P. Brown, S. E. Rogers, and J. Eastoe, Langmuir 29, 3252 (2013).
- Eicke, Borkovec, and Das-Gupta (1989) H. F. Eicke, M. Borkovec, and B. Das-Gupta, J. Phys. Chem. 93, 314 (1989).
- Lobaskin et al. (2007) V. Lobaskin, B. Duenweg, M. Medebach, T. Palberg, and C. Holm, Phys. Rev. Lett. 98, 176105 (2007).
- Levine and Neale (1974) S. Levine and G. H. Neale, J. Colloid Interface Sci. 47, 520 (1974).
- Ohshima (1997) H. Ohshima, J. Colloid Interface Sci. 188, 481 (1997).
- Narayanan (2007) T. Narayanan, in Soft Matter: Scattering, Imaging and Manipulation, edited by R. Pecora and R. Borsali (Springer, 2007).
- Di Cola et al. (2009) E. Di Cola, A. Moussa d, M. Sztucki, T. Narayanan, and E. Zaccarelli, J. Chem. Phys. 131, 144903 (2009).
- Liddle, Narayanan, and Poon (2011) S. M. Liddle, T. Narayanan, and W. C. K. Poon, J. Phys.: Condens. Matter 23, 194116 (2011).
- Anderson (1989) J. L. Anderson, Annu. Rev. Fluid Mech. 21, 61 (1989).
- Kirkwood and Buff (1951) J. G. Kirkwood and F. P. Buff, J. Chem. Phys. 19, 774 (1951).
- Vazquez-Rodriguez and Ruiz-Estrada (2016) O. Vazquez-Rodriguez and H. Ruiz-Estrada, Phys. Chem. Liq. 54, 632 (2016).
- Heinen et al. (2011) M. Heinen, P. Holmqvist, A. J. Banchio, and G. Nagele, J. Chem. Phys. 134, 044532 (2011).
- Hansen and Verlet (1969) J.-P. Hansen and L. Verlet, Phys. Rev. 184, 151 (1969).
- Kesavamoorthy et al. (1989) R. Kesavamoorthy, B. V. R. Tata, A. K. Arora, and A. K. Sood, Phys. Lett. A 138, 208 (1989).