Simulation of plasma loading of high-pressure RF cavities
Abstract
Muon beam-induced plasma loading of radio-frequency (RF) cavities filled with high pressure hydrogen gas with 1% dry air dopant has been studied via numerical simulations. The electromagnetic code SPACE, that resolves relevant atomic physics processes, including ionization by the muon beam, electron attachment to dopant molecules, and electron-ion and ion-ion recombination, has been used. Simulations studies have been performed in the range of parameters typical for practical muon cooling channels.
keywords:
muon cooling; HPRF cavity; plasma loading; electromagnetic PIC1 Introduction
Muon cooling is a challenging problem, critical for the successful design of a muon collider or a neutrino factory. Ionization cooling is the only viable method to quickly cool the beam temperature within the muon lifetime [1]. As muons propagate through a material with strong magnetic focusing, their kinetic energy is reduced via ionization processes and then recovered by RF cavities. Better cooling efficiency is obtained with higher RF gradient. However, the achievable RF gradient is limited by the presence of a static magnetic field in a vacuum cavity because the density of dark current, which is a seed of electric breakdown in an RF cavity, is increased by magnetic focusing [2]. A high-pressure hydrogen gas-filled RF (HPRF) cavity [3] has the potential to resolve this problem. Hydrogen gas in the cavity serves a dual role: it buffers the dark current and serves as the ionization material for the cooling process. A novel ionization cooling channel using the dual function cavity was proposed and its high cooling efficiency has been demonstrated via simulations [4, 5].
A parallel particle-in-cell (PIC) code SPACE, designed for simulations of electromagnetic fields, relativistic particle beams, and plasma chemistry [9] has been used in this work for the simulation of HPRF cavities interacting with muon beams. The atomic physics module of SPACE was validated in our previous work [11]. The validation data were provided by a series of experiments performed in the Mucool Test Area (MTA) at Fermilab [6, 7, 8] using the HPRF cavity interacting with intense proton beams. In particular, the plasma loading effect has been investigated [8]. Plasma loading takes place when a beam-induced plasma in the HPRF cavity absorbs the stored energy of the electromagnetic field in the cavity and causes a reduction of the electric field. The plasma loading depends on the amount and mobility of charged particles in the gas. To decrease the plasma loading effect, adding a small amount of electronegative dopant to the hydrogen gas was proposed and successfully tested experimentally. Simulations achieved very good agreement with experiments. Comparison of simulations and experiments has also led to the calibration of some parameters characterizing atomic processes, in particular recombination and attachment rates, which could not be reliably measured in experiments.
In this work, we report simulation results of the interaction of muon beams with two HPRF cavities filled with hydrogen gas at pressures of 100 atm and 160 atm, and containing 1 % dry air dopant. Simulations support the design of a practical muon ionization cooling channels.
2 Governing equations and numerical algorithms
2.1 Plasma formation
As an intense proton or muon beam propagates in the HPRF cavity, plasma is created by ionization of hydrogen gas molecules due to collisions with beam particles. Some generated electrons have enough kinetic energy to cause secondary ionization. The process is described as
| (1) |
where , , and are a beam particle (proton or muon), hydrogen molecule, and electron, respectively.
The number of electron-ion pairs , produced in an elementary volume of the cavity during time , is estimated based on the stopping power of the beam in hydrogen gas
| (2) |
Here () is the normalized stopping power of a beam particle per unit density of the absorber material, , , , and denote the gas mass density, length of the volume along the beam path, average ionization energy, and the number of beam particles that traverse in time , respectively. In Eq. (2), accounts for both processes described in (2.1). The Bethe-Bloch formula [1] is used for calculating the stopping power.
At high pressures over atm, typical for the HPRF cavity, the ions quickly form other clusters of hydrogen:
| (3) |
2.2 Recombination
In the HPRF cavity filled with pure hydrogen gas, electrons created by ionization recombine with hydrogen clusters through either binary or ternary recombination processes:
| (4) |
where . At the HPRF conditions, ternary recombination is dominant [6]. The time evolution of the electron number density is given by the following equation
| (5) |
where , and , , , and denote the number density of electrons, the number density of hydrogen ion clusters, the production rate of electrons, and the recombination rate of electrons and , respectively. Relative populations of hydrogen clusters were not measured in the MTA experiments, and therefore an effective recombination rate for an averaged hydrogen ion cluster was used in our models and simulations. The averaged hydrogen ion cluster that represents the sum is denoted as . The effective recombination rate was measured in the MTA experiments at the equilibrium state of plasma (i.e. ). In our model, we use the following fit for the effective recombination rate, applicable to transient processes in the plasma,
| (6) |
where is the ratio of electric field magnitude to the gas pressure. Values for the parameters and were obtained via comparison of HPRF simulations to various experimentally measured quantities, in particular, the plasma loading [8], and extrapolated to the range of parameters used in this work.
2.3 Attachment and ion - ion recombination
When an electronegative gas such as oxygen is added to the hydrogen gas, a three-body attachment process takes place in the plasma, which is significantly faster than the electron - ion recombination [7]. The negative ions produced by the attachment process recombine with hydrogen ions. The governing equations are
| (7) | ||||
where , , and are the attachment time, effective ion - ion recombination rate, and the number density of dopant gas ions, respectively.
As the recombination and attachment rates depend on the electric field, they are functions of spatial coordinates and time. The attachment time and the ion - ion recombination rate have been measured experimentally, but only over a narrow range of RF field amplitudes. Parameters for current simulations were obtained by extrapolation of experimental data and previous simulations.
2.4 Numerical algorithms and their implementation
Simulations of processes in the HPRF cavity have been performed using a parallel particle-in-cell (PIC) code SPACE that resolves electromagnetic fields, relativistic particle beams, and plasma chemistry [9]. For electrostatic problems, SPACE uses a highly adaptive Particle-in-Cloud method [12]. A set of verification test problems for SPACE is described in [10]. The main feature of SPACE, relevant to HPRF simulations, is its ability to support complex atomic physics transformations such as those described in the previous section. Details of plasma chemistry algorithms as well as a time stepping algorithm that maintains different time scales for the particle beam and plasma can be found in [11].
While the dynamics of the proton beam and plasma were explicitly resolved in simulations, a direct simulation of plasma loading was not feasible due to its non-local nature. In simulations, the change of the RF field due to plasma loading can be approximated by an RLC resonant circuit formula [8]. In particular, the RF power dissipation can be described as
| (8) |
where , , , , are the RF field power, the shunt impedance, the cavity capacitance, the magnitude of the RF voltage, and the instantaneous voltage value, respectively [6]. In the simulations, the total power of plasma loading is computed at each time step as a sum over all computational nodes of the PIC mesh
| (9) |
where
| (10) |
is the average energy loss by plasma particle pairs per computational node during one RF cycle [11]. Here , and denote the local amplitude and the angular frequency of the RF field, respectively, is a fraction of electron in an effective electron-ion pair, and , , and denote mobilities of electrons, and positive and negative ions. An effective electron-ion pair contains one positive ion, a fraction of an electron , and the corresponding fraction of a negative ion . In pure hydrogen gas, . The value of is used to compute the RF field voltage by integrating the following ordinary differential equation
| (11) |
Another factor contributing to the plasma loading simulations is the distribution of the RF field () in the cavity, studied in [7]. The RF field amplitude significantly changes in the longitudinal direction, while the change in the radial direction is negligibly small across the plasma column. Therefore, the RF field amplitude was approximated in the SPACE code as a quadratic polynomial in the longitudinal coordinate, using data from global electromagnetic simulations of the cavity.
3 Simulation results
3.1 Summary of validation studies
The SPACE code atomic physics module has been validated in [11] using results of the Fermilab MTA experiments [8] on the interaction of proton beams with high-pressure gas in the HPRF cavity. Dominant effects of the plasma dynamics in the HPRF cavity have been quantified in numerical simulations and previous analytical studies. They showed that ionization electrons are immediately thermalized by interacting with neutral particles and follow the conventional electron transport model. As reported in the experimental paper [6], electron mobility is significantly reduced by a pressure effect. Electron capture by an electronegative dopant is also explained by the conventional three body model. It concludes that the electron capture time can be much shorter than a nanosecond.
Simulations show a very strong reduction of the RF field magnitude in equilibrium for pure hydrogen plasma: the field is reduced by a factor of 7 at the pressure of 100 atm, and by the factor of 44 at 20.4 atm. The larger reduction of the electric field at low pressure is due to smaller recombination rates and, therefore, higher electron density. If a 1 % dry air dopant is added to the hydrogen gas, the reduction of the RF field is greatly mitigated: the reduction factor at 20.4 atm is only 1.7. Simulations have achieved very good agreement with experiments on plasma loading and related processes.
Simulations also contributed to a better understanding of plasma properties. In a series of simulations and their comparison with experimentally measured quantities characterizing the plasma loading process, several uncertain properties of the plasma, such as effective recombination rates and the attachment time of electrons to dopant molecules, have been quantified and accurate fit functions for these quantities, valid over a wide range of electric field values and the same pressure values, have been found.
3.2 Plasma loading of HPRF cavities by muon beams
In this section, we discuss simulations of the muon beam interaction with HPRF cavities in the parameter space of practical ionization cooling channels using the validated code SPACE. The main physics parameters are described in Table 1.
| Parameters | Regime I | Regime II |
|---|---|---|
| Beam kinetic energy | 120 MeV | |
| Bunch length | 3 cm | |
| Bunch radius | 1 cm | 0.1 cm |
| Population per bunch | ||
| Bunch spacing | 3 ns | |
| Number of bunches | 20 | |
| dE / dx | 4.49 | |
| Average ionization energy | 36.2 eV | |
| Cavity length | 10 cm | 5 cm |
| gas pressure | 100 atm and 160 atm with 1% dry air | |
| RF field magnitude | 20 MV/m | |
| Frequency | 325 MHz | 650 MHz |
Simulations model two HPRF cavities: the first one is 10 cm long, with 20 MV/m, 325 MHz RF field, and the second cavity is 5 cm long, with 20 MV/m, 650 MHz RF field. Both cavities are filled with hydrogen gas containing 1% of dry air dopant. Each cavity was studied at 100 atm and 160 atm of gas pressure. HPRF cavities interact with muon beams consisting of 20 bunches with the length of 3 cm, arriving with the interval of 3 ns. The muon beam in the first cavity is very wide in the transverse direction, with the radius of 1 cm. In the second cavity, it is focused to the radius of 0.1 cm. For simulations reported in this paper, we use the following approximations for coefficients determining the rate of atomic processes: the effective electron-ion recombination rate , the ion-ion recombination rate , and the electron attachment time to dopant molecule , where the ratio of the electric field magnitude to the gas pressure, , is computed in units of .
Evolution of the total number of electrons in the first cavity is shown in Figure 1. During first 20 ns, the number of electrons rapidly increases due to ionization, reaching maximum values of and at the gas pressures of 100 atm and 160 atm, respectively. With the increase of the electron density, the electron-ion recombination and electron attachment rate to dopant molecules intensifies, overpowers the gas ionization rate by the muon beam, and the number of electrons gradually reduces to for both hydrogen gas pressures after the arrival of the last muon bunch. After that, the electron density drops to zero within 10 ns. Evolution of the average power stored in the plasma is shown in Figure 2a. It reaches maximum values of and at the peak of the electron density, slightly reduces towards the end of the beam time, and then rapidly desreases with the decline of the electron density. However, it does not go to zero at 80 ns because of energy stored in positive hydrogen ions and negative dopant ions. As the density of ions slowly deceases by recombination processes, the averaged stored power slowly changes with microsecond characteristic time scales. The average power stored in plasma at 160 atm is smaller compared to that at 100 atm despite a slightly larger total number of electrons and ions. This is mostly due to the reduction of electron mobility at higher gas pressure: the electron mobility is approximately 40 % smaller at 160 atm compared to 100 atm.
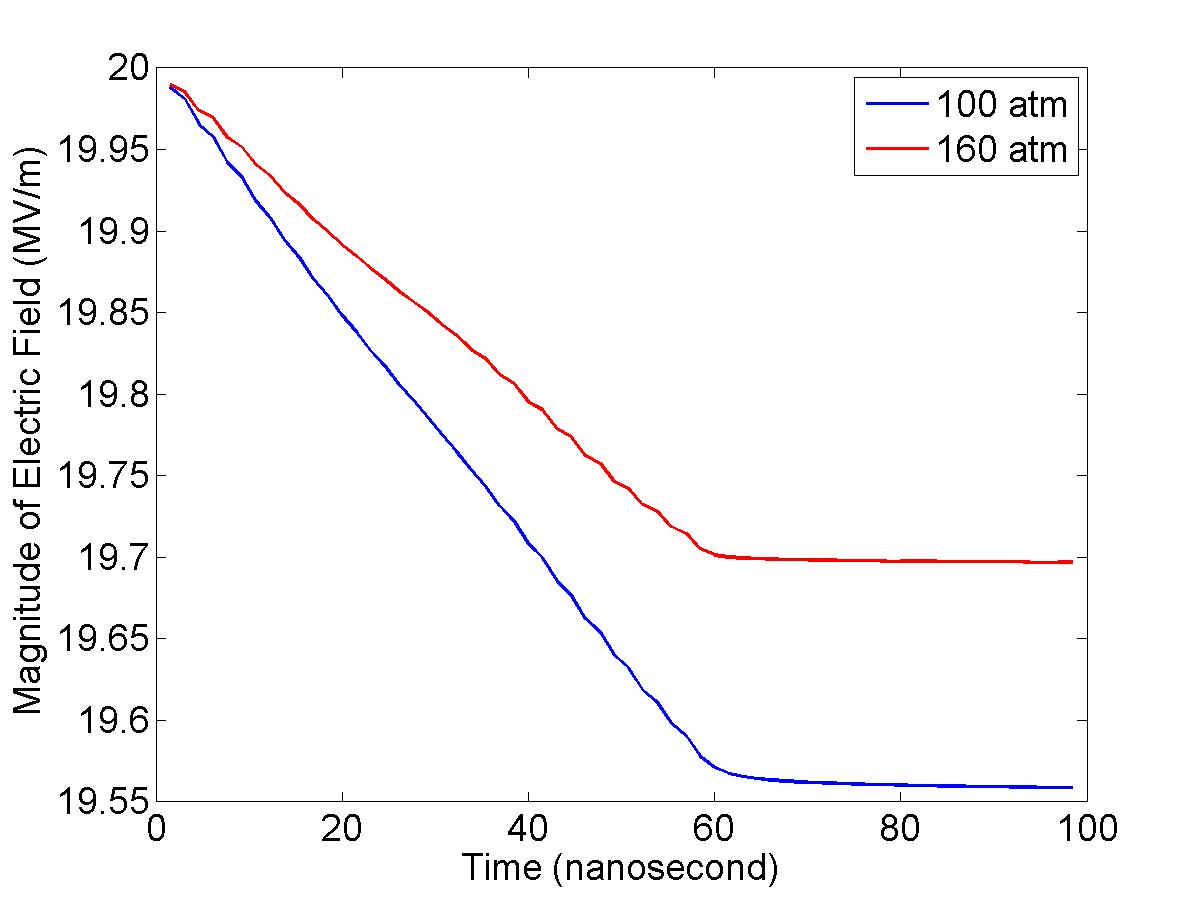
The power stored in plasma explains the behaviors of the RF field magnitude, depicted in Figure 2b. The RF field magnitude drops almost linearly during the beam time, and then continues to decrease slightly because of the energy stored in ions. The total decrease of the RF field magnitude is very small - less than 1 %, which is significantly different compared to large values due to plasma loading of HPRF cavities interacting with proton beams, observed in Fermilab MTF experiments [8] and simulations [11].
The overall time-averaged dynamics of the number of electrons, averaged power stored in plasma, and the RF field magnitude is qualitatively similar for the second HPRF cavity. The short-time evolution, however, is different, and needs to be explained.
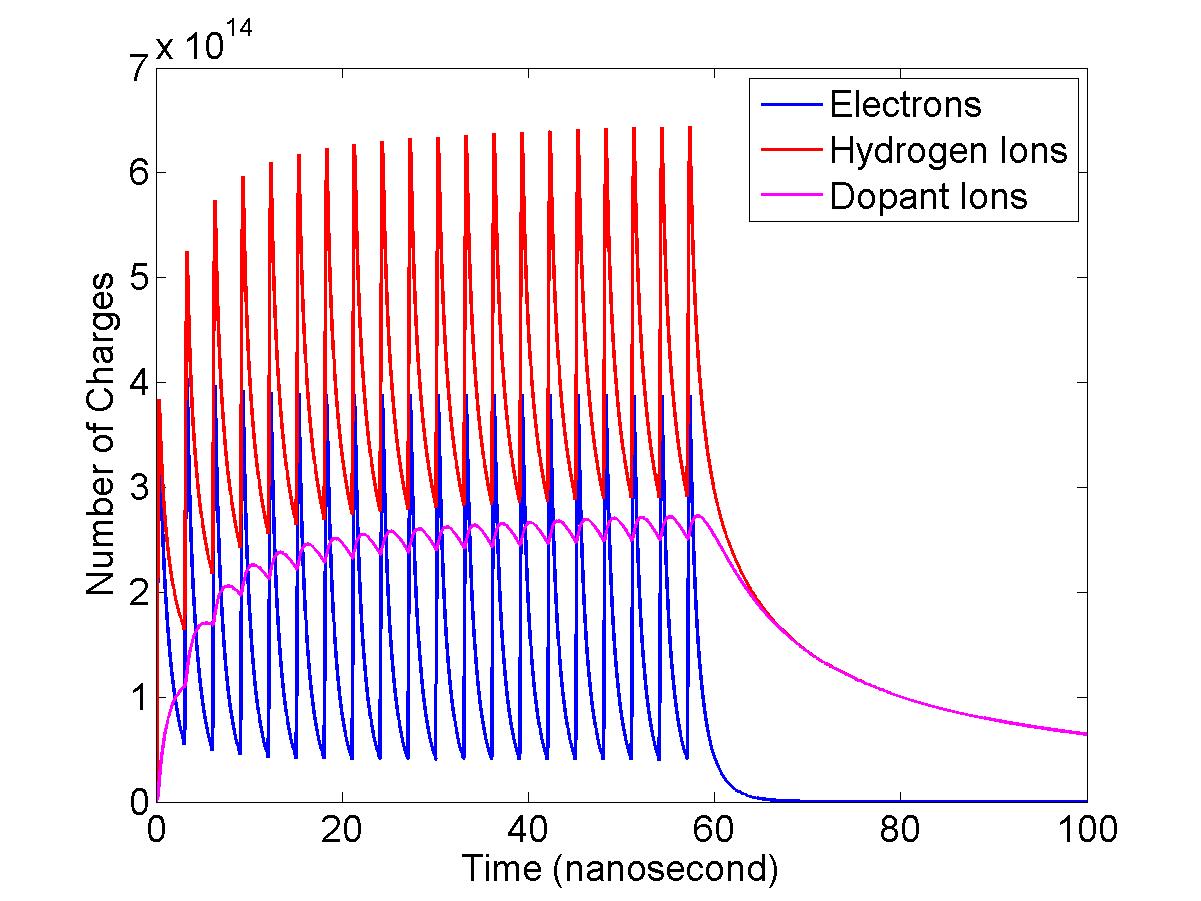
Evolution of the total number of electrons, and positive and negative ions at 100 atm and 160 atm pressure values in the second cavity is shown in Figure 3. As the muon beam is strongly focused to the radius of 0.1 cm, the number density of electrons is almost two orders of magnitude higher along the beam axis compared to the first cavity. Such a high number density of electrons significantly increases the electron recombination and attachment rates. Significant fractions of electrons recombine with hydrogen ions and become attached to dopant molecules within nanosecond time intervals between muon bunches. This explains the highly oscillatory behavior of the number of electrons and, correspondingly, positive and negative ions. Because of fast recombination / attachment processes, the maximum number of electrons is much smaller compared to the previous cavity.
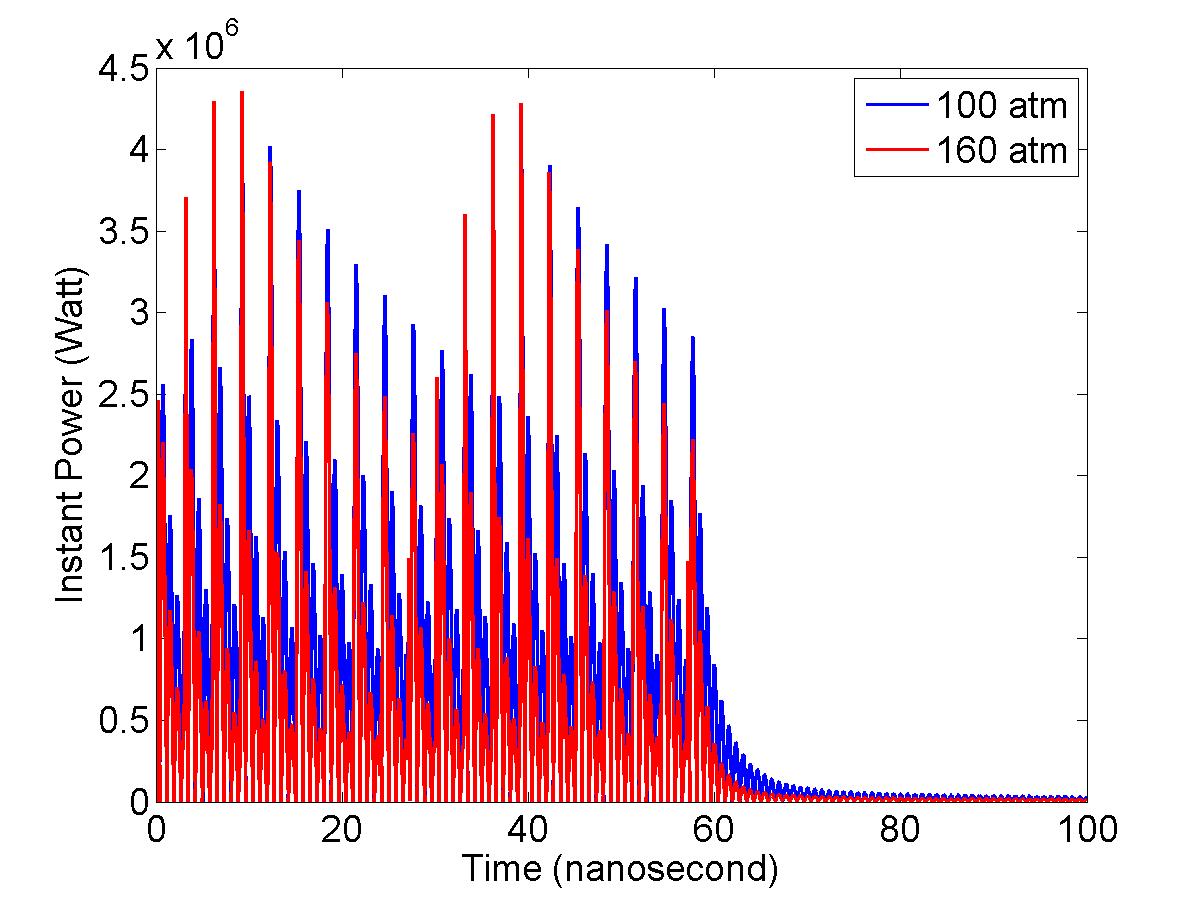
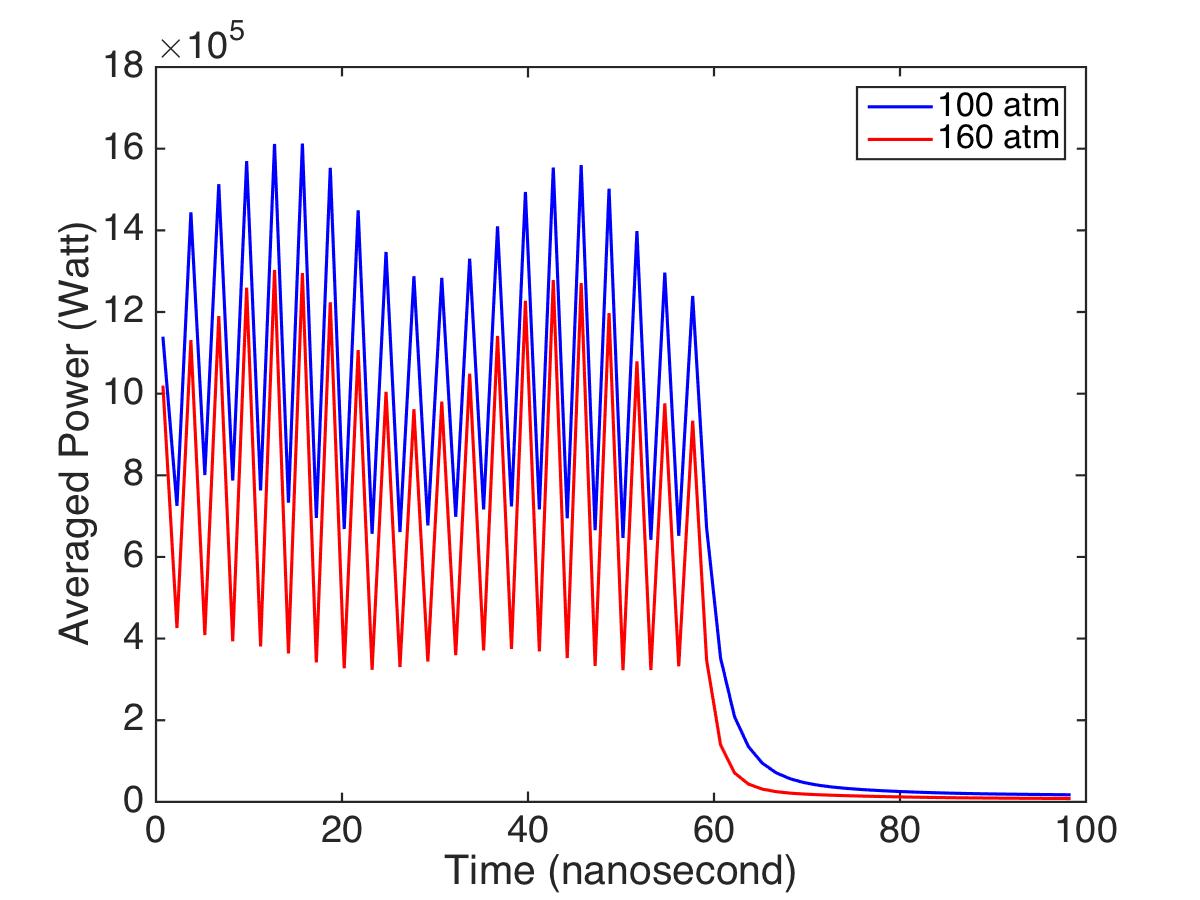
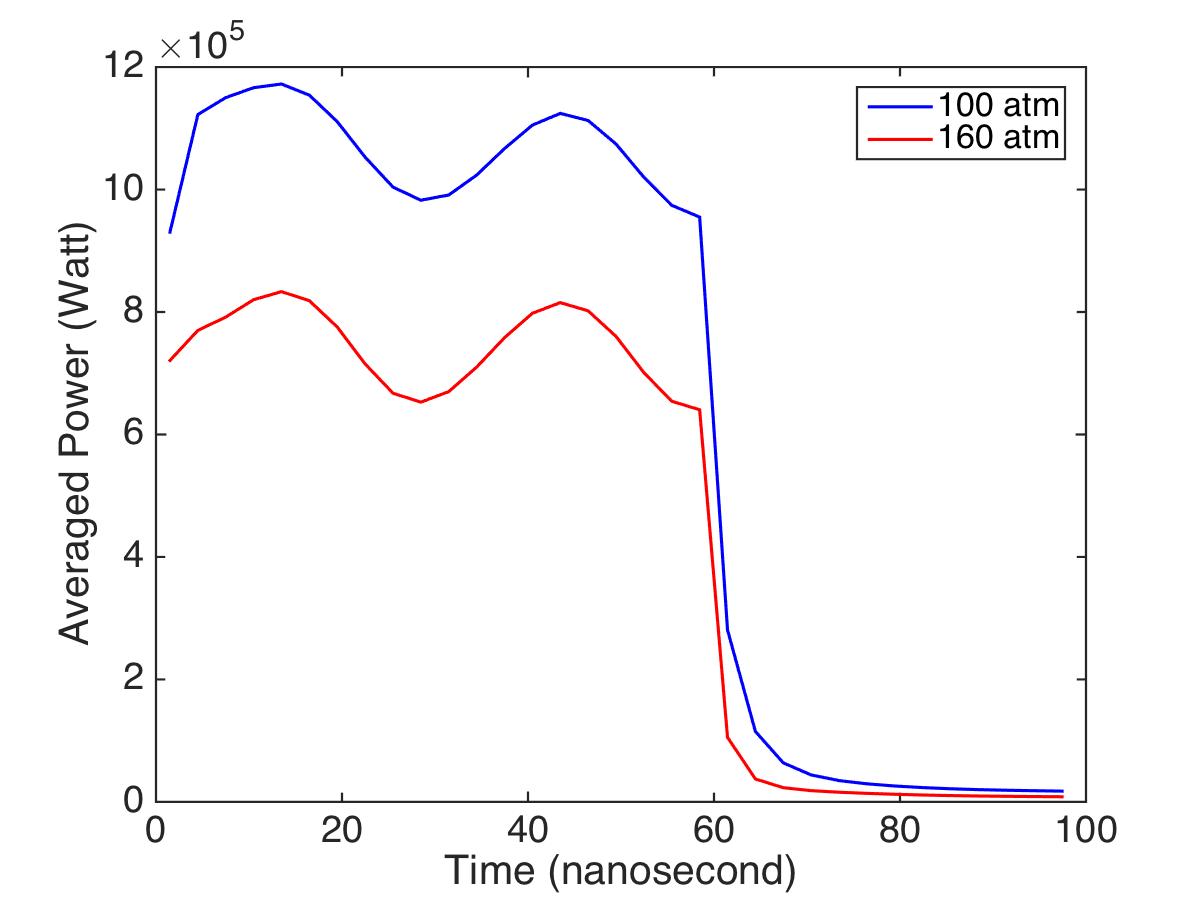
Similar oscillatory behavior is also evident for the power stored in plasma particles and depicted in Figure 4. For better explanation of the behavior of plasma power, we present the evolution of its instantaneous value in Figure 4a, the evolution of plasma power averaged over the RF field period in Figure 4b, and the evolution of plasma power averaged over the muon bunch period in Figure 4c. The fastest oscillatory behavior of instantaneous plasma power values is caused by fast oscillations of the number density of charges and approximately twice faster oscillations of the RF field. Averaged over the RF period, the plasma power oscillates with the frequency of muon bunches. Finally, the averaging of plasma power over the muon bunch period results in a smooth variation of plasma power. Lower values of the plasma power at 28 - 30 (see Figure 4c) is the result of small details in the evolution of plasma particles. In particular, the highest values of the electron number density for both values of gas pressures (see Figure 3) are obtained after the arrival of only the second and third muon bunches. The number of dopant ions at this time is still low. But as the electron mobility is significantly larger compared to the mobilities of positive and negative ions, the plasma power is close to its maximum value (see Figure 4c). After that, the averaged number of negative and positive ions continues to slightly increase while the averaged number of electrons slightly reduces as attachment processes intensify. The more rapid increase of ions is responsible for the increase of the plasma power until approximately 7 ns. After that, further reduction of electrons causes the reduction of the plasma power despite further increase of the number of positive and negative ions: plasma power is much more sensitive to the number electrons as their mobility is approximately 43 times larger than the mobility of positive hydrogen ions and approximately 71 times larger compared to the mobility of negative ion dopants. The local minimum of plasma power is achieved at 28 - 30 ns. At this time, the number of electrons, averaged over the muon beam period, reaches a steady state due to the balance of ionization, recombination and electron attachment processes. With a constant averaged number of electrons, further increase of the number of ions causes a slight increase in the plasma power, and a second local maximum is reached at about 42 ns. It then reduces again because of a slight reduction of the electron number. The reduction of the RF field magnitude due to plasma loading, that causes a decrease of mobilities of plasma particles, and a 3D spatial dependence of all quantities add extra complications to the analysis.
The reduction of the RF field amplitude, shown in Figure 4d, is not sensitive to such small scale oscillations. While the reduction of the RF field magnitude is very small in both cases, it is larger in the second cavity despite smaller power stored in plasma compared to the first cavity: the RF power in the second cavity is reduced by 2.2 % in 100 atm hydrogen gas at 80 ns compared to 0.8 % in the first cavity. This difference is due to the geometry and parameters of each cavity: the capacitance and resistance of the 10 cm long, 325 MHz cavity are F and 8.7 MOhm, respectively, while these parameters for the 5 cm long, 650 MHz cavity are F and 3.1 MOhm.
4 Conclusions
Numerical simulations of the interaction of intense muon beams with two HPRF cavities filled with hydrogen gas at the pressures of 100 and 160 atm and containing 1% of dry air dopant have been performed using code SPACE. The atomic physics module of SPACE is designed to resolve all relevant processes occurring in the HPRF cavity. They include ionization by muon impact, electron attachment to dopant molecules, formation of cascades of heavier hydrogen ions, electron-ion and ion-ion recombination processes, as well as experimental data-based models of electron and ion mobilities in the dense gas. The atomic physics module has been validated in our previous work [11] by comparing simulations with experiments in the Fermilab MTA facility which operated HPRF cavities filled with pure hydrogen gas and hydrogen gas containing dry air dopant interacting with intense proton beams. Simulations showed a very strong reduction of the RF field magnitude in equilibrium for pure hydrogen plasma, much smaller reduction in the presence of dry air dopant, and achieved very good agreement with experiments.
The validated SPACE code has been used in this work for the study of atomic processes in HPRF cavities and their plasma loading by intense muon beams. The parameter set of numerical simulations is relevant to the design of practical muon cooling channels. We have analyzed the evolution of atomic processes in HPRF cavities, power stored in plasma, and their influence on the reduction of the RF field magnitude. We show that the plasma dynamics strongly depends on the muon beam focusing: tightly focused beams create high electron number density which in turn intensifies the electron attachment to dopant molecules and causes a rapid reduction of the number of free electrons and its oscillation with the frequency of muon bunches. The reduction of the RF field amplitude, however, is not sensitive to these fast oscillations. The reduction of the RF field amplitude was negligibly small for all cases studied in this work. Several other issues, not unique to muon calling channels, affect the HPRF cavity performance. One of them is the beam loading which significantly affects the HPRF cavity accelerating mode for high intensity muon beams [16].
Acknowledgement. This research has been partially supported by the DOE Muon Accelerator Program. This manuscript has been authored in part by Brookhaven Science Associates, LLC, under Contract No. DE-SC0012704 with the US Department of Energy.
Appendix A Derivation of RLC Circuit Formula for HPRF Cavity Plasma Loading
The plasma generated by a beam ionizing the gas within the cavity is an additional current path, and therefore acts as an additional resistance. The cavity will transfer stored energy to the plasma, where the power delivered is the time rate of change of the stored energy in the cavity:
| (12) |
The cavity continues to receive power from the generator, in this case a klystron, given by:
| (13) |
At resonance, , and Equation 13 reduces to:
| (14) |
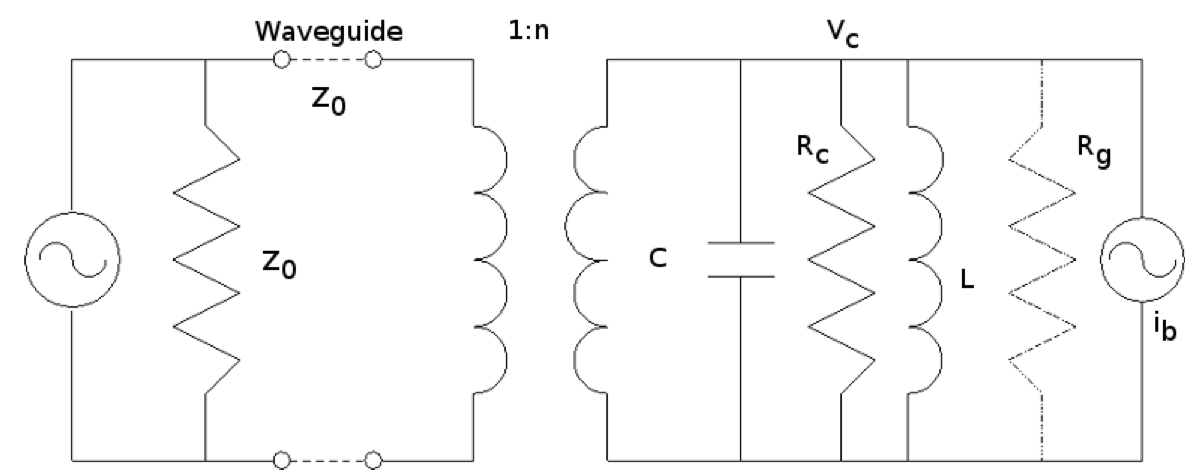
For a matched load (cavity) and generator, Z0 = Rc in Figure 5. The power coming from the source (klystron) is as a function of time is:
| (15) |
The power being delivered to the gas is then the difference between what the source is supplying the cavity, and what the cavity is feeding the gas:
| (16) |
Note that at early times, V, and the majority of power delivered to the gas comes from the stored energy of the cavity, i.e. the second term in Equation 16 is larger than the first term. As the cavity discharges and become small, and the majority of power delivered to the gas comes directly from the klystron, i.e. the first term is larger than the second.
References
- [1] D. Neuffer, Introduction to muon cooling, Nuclear Instruments and Methods in Physics Research, A 532 (2004), 26-31.
- [2] A. Moretti, Z. Qian, J. Norem, Y. Torun, D. Li, M. Zisman, Effects of high solenoidal magnetic fields on RF accelerating cavities, Phys. Rev. ST Accel. Beams, 8 (2005) 072001.
- [3] R. P. Johnson et al., High pressure, high gradient RF cavities for muon beam cooling in proceedings of LINAC 2004 (DESY/GSI), Lubeck, Germany, 2004, p. 266.
- [4] Ya.S. Derbenev and R. P. Johnson, Six-dimensional muon beam cooling using a homogeneous absorber: Concepts, beam dynamics, cooling decrements, and equilibrium emittances in a helical dipole channe, Phys. Rev. ST - Accelerators and Beams, 8 (2005) 041002
- [5] K. Yonehara, D. Kaplan, K. Beard, S.A. Bogacz, Y.S. Derbenev, R.P. Johnson, K. Paul, T.J. Roberts, Simulations of a Gas-Filled Helical Muon Beam Cooling Channel, in proceedings of PAC 2005, TPPP052.
- [6] M. Chung, M. G. Collura, G. Flanagan, B. Freemire, P. M. Hanlet, M. R. Jana, R. P. Johnson, D. M. Kaplan, M. Leonova, A. Moretti, M. Popovic, T. Schwarz, A. Tollestrup, Y. Torun, and K. Yonehara, Pressurized RF cavities in ionizing beams and magnetic fields, Phys. Rev. Lett. 111, 184802 (2013).
- [7] B. Freemire, High pressure gas filled RF cavity beam test at the fermilab mucool test area, Doctoral Thesis at IIT, 2013.
- [8] B. Freemire, A.V. Tollestrup, K. Yonehara, M. Chung, Y. Torun, R.P. Johnson, G. Flanagan, P.M. Hanlet, M.G. Collura, M.R. Jana, M. Leonova, A. Moretti, and T. Schwarz, Pressurized rf cavities in ionizing beams, Phys. Rev. Accelerators and Beams, 19 (2016) 062004.
- [9] K. Yu, R. Samulyak, SPACE code for beam-plasma interaction, in proceedings of IPAC 2015, MOPMN012.
- [10] K. Yu, Computational Relativistic Electrodynamics: New Algorithms, Parallel Software, and Applications to Accelerator Design, Ph.D. Thesis, State University of New York at Stony Brook, ProQuest Dissertations Publishing, 2016. 10138332.
- [11] K. Yu, R. Samulyak, K. Yonehara, B. Freemire, Simulation of beam-induced plasma in gas-filled rf cavities, PRAB, 032002 (2017).
- [12] X. Wang, R. Samulyak, J. Jiao, K. Yu, Adaptive Particle-in-Cloud method for optimal solutions to Vlasov-Poisson equation, J. Comput. Phys., 316 (2016), 682 - 699.
- [13] R. Grünberg, Z. Physik, 204(2) (1967)
- [14] J.J. Lowke, The drift velocity of electrons in hydrogen and nitrogen, Aust. J. Phys., 16 (1962) 115-135
- [15] E. W. McDaniel and H. R. Crane, Measurements of the mobilities of the negative ions in oxygen and in mixtures of oxygen with the noble gases, hydrogen, nitrogen, and carbon dioxide, Rev. Sci. Instrum., 28 (1957) 684-689
- [16] M. Chung, A. Tollestrup, K. Tonehara, B. Freemire, Transient beam loading effect in gas-filled RF cavities for a muon collider, in proceedings of IPAC 2013, TUPFI053.