X-ray to gamma-ray virial shock signal from the Coma cluster
Abstract
Following evidence for an east–west elongated virial ring around the Coma galaxy cluster in a GeV VERITAS mosaic, we search for corresponding signatures in GeV -rays from Fermi-LAT, and in soft, keV X-rays from ROSAT. For the ring elongation and orientation inferred from VERITAS, we find a LAT excess, and detect () the expected signature in ROSAT bands R1 and R1+R2. The significances of both LAT and ROSAT signals are maximal near the VERITAS ring parameters. The intensities of the ROSAT, Fermi, and VERITAS signals are consistent with the virial shock depositing (with an uncertainty factor of ) of its energy over a Hubble time in a nearly flat, – spectrum of cosmic-ray electrons. The sharp radial profiles of the LAT and ROSAT signals suggest preferential accretion in the plane of the sky, as indicated by the distribution of neighboring large-scale structure. The X-ray signal gauges the compression of cosmic-rays as they are advected deeper into the cluster.
Subject headings:
galaxies: clusters: individual (Coma) — gamma rays: galaxies: clusters — X-rays: galaxies: clusters — acceleration of particles – shock waves1. Introduction
As a galaxy cluster grows, by accreting matter from its surrounding, a strong, collisionless, virial shock is thought to form at the so-called virial shock radius, . By analogy with supernova remnant (SNR) shocks, virial shocks too should accelerate charged particles to highly relativistic, energies. These particles, known as cosmic ray (CR) electrons (CREs) and ions (CRIs), should thus form a nearly flat, spectrum (equal energy per logarithmic CR energy bin), radiating a distinctive non-thermal signature which stands out at the extreme ends of the electromagnetic spectrum.
High-energy CREs cool rapidly, on timescales much shorter than the Hubble time , by Compton-scattering cosmic microwave-background (CMB) photons (Loeb & Waxman, 2000; Totani & Kitayama, 2000; Keshet et al., 2003). These up-scattered photons should then produce -ray emission in a thin shell around the galaxy cluster, as anticipated analytically (Waxman & Loeb, 2000; Totani & Kitayama, 2000) and calibrated using cosmological simulations (Keshet et al., 2003; Miniati, 2002). The projected -ray signal typically shows an elliptic morphology, elongated towards the large-scale filaments feeding the cluster (Keshet et al., 2003, 2004a). The same -ray emitting CREs are also expected to generate an inverse-Compton ring in the optical band (Yamazaki & Loeb, 2015) and in hard X-rays (Kushnir & Waxman, 2010), and a synchrotron ring in radio frequencies (Waxman & Loeb, 2000; Keshet et al., 2004a, b). Interestingly, the inverse-Compton signature in soft X-rays, which can stand out above the thermal background, was not previously explored in detail, to our knowledge.
By stacking Fermi Large Area Telescope (LAT; henceforth) data around 112 massive clusters, and by utilizing the predicted spatial and spectral dependence of the anticipated virial shock signal, the cumulative -ray emission from many virial shocks was detected recently at a high () significance (Reiss et al., 2017, henceforth R17). The signal was found to be spectrally flat, with a photon spectral index , and peaked upon radial binning around a radius , in agreement with predictions. Here, and are the photon density and energy, and subscripts and designate an enclosed mass density times above the critical mass density of the Universe. The signal indicates that the stacked shocks deposit on average of the thermal energy in CREs over a Hubble time. As these results were obtained by radial binning, they sample only the radial component of the virial shocks, necessarily diluting the signal by picking up only those parts of the shocks favorably seen in such a projection.
It is interesting to study the signal from individual nearby clusters, where the signal may be picked up directly, without stacking. The Coma cluster (Abell 1656), in particular, is one of the richest nearby clusters. With mass , temperature , and richness class 2, it lies only away (Gavazzi et al., 2009), at a redshift . The cluster resides near the north Galactic pole (latitude ), in a sky patch remarkably low on Galactic foreground. These considerations, and indications for accretion as discussed below, render Coma exceptionally suitable for the search for virial shock signatures.
The virial radius of Coma, often defined as (Reiprich & Böhringer, 2002)111A wide range of estimates for Coma may be found in the literature, ranging from (self-similar extrapolation from the of Piffaretti et al., 2011), to (Geller et al., 1999), (Brilenkov et al., 2015), and (Kubo et al., 2007). , corresponds to an angular radius . The cluster is somewhat elongated in the east–west direction, in coincidence with the western large scale structure (LSS) filament (West et al., 1995) that connects it with the cluster Abell 1367. There is X-ray (Simionescu et al., 2013; Uchida et al., 2016), optical, weak lensing (Okabe et al., 2010, 2014), radio (Brown & Rudnick, 2011), and SZ (Planck Collaboration, 2012) evidence that the cluster is accreting clumpy matter and experiencing weak shocks towards the filament well within the virial radius, at angular radii.
An analysis (Keshet et al., 2017, henceforth K17) of a VERITAS mosaic of Coma (Arlen et al., 2012) found evidence for a large-scale, extended -ray feature surrounding the cluster. The apparent signal is best described as an elongated, thick, elliptical ring, with semiminor axis coincident with the cluster’s virial radius, oriented toward the western LSS filament; the best fit was obtained for a ratio of semimajor axis to semiminor axis . The signal presents at a nominal confidence level, but there is substantial evidence supporting its presence and association with the virial shock. This includes a higher, significance found when correcting for the observational and background-removal modes, indications that an extended signal was indeed removed by the background model, correlations with synchrotron and SZ tracers, good agreement () with the simulated -ray ring of the cluster, and the absence of such extended signal tracers in VERITAS mosaics of other fields. Interpreting the signal as a virial shock would imply , to within a systematic uncertainty factor of a few.
Other -rays studies of Coma failed to detect a signal, largely because it is difficult to reach the combined high sensitivity, controlled foreground, good resolution, and high - yet not too high - photon energy, set by VERITAS. For example, broad band, analyses (Zandanel & Ando, 2014; Prokhorov, 2014) of LAT data found no excess emission from Coma, placing upper limits on CRI acceleration and , and questioning spectrally flat emission matching the VERITAS signal. However, at such low energies, the point spread function (PSF) is prohibitively large (Atwood et al., 2013), with () containment exceeding , far beyond (exceeding , an order of magnitude above) the virial radius. LAT analyses of Coma thus rely on higher, GeV energies, where the photon statistics becomes increasingly challenging. Moreover, the above upper limits are sensitive (Ackermann et al., 2016) to the assumed foreground, which is not accurately known at these energies, and to the morphology of the modeled signal. Nevertheless, an extended LAT signal around Coma was eventually reported (Ackermann et al., 2016), partly overlapping the virial radius. This signal, still below the threshold needed to claim LAT detection, is consistent with the VERITAS signal when correcting for the larger extent of the latter (K17).
Here we use the signal identified in the VERITAS mosaic, to search for the counterparts of such inverse-Compton emission from the virial shock in other bands. In §2 we study the expected energy-dependent morphology of the virial shock signal, in galaxy clusters and groups in general, and in Coma in particular. We point out that at high, -ray energies, the signal is expected to be spatially very narrow, due to the fast CRE cooling. Furthermore, the ring in Coma may be even thinner than expected in a spherically (or triaxially) symmetric shock, as the distribution of LSS around Coma is approximately confined to a plane perpendicular to the line of sight, and such a planar configuration may manifest also in the accretion through the virial shock. This does not contradict the thick VERITAS ring, which may have been considerably broadened by instrumental effects (on-region integration over a diameter region, ring background subtraction, and a wobble).
The LAT data, which is marginally sensitive to a signal at the level inferred from VERITAS, is analyzed in §3. We reproduce previously reported, LAT-based upper limits, in particular for a thick ring matching the VERITAS mosaic. However, allowing for a thin signature, we find a high significance, elongated ring at the anticipated shock position and morphology. We then analyze soft X-rays from ROSAT, where the virial shock signature can surface above the thermal signal, in §4. Here too, we find the expected signature, in the form of a thicker, smaller scale, elongated ring, as anticipated from the evolution of the low-energy CREs accelerated by the shock. We then combine the signals from VERITAS, LAT, and ROSAT, and measure the overall spectrum, in §5. The three bands show a comparable logarithmic brightness, indicating an injected CRE spectral index , consistent with a strong virial shock, and . Finally, the results are summarized and discussed in §6.
We adopt a flat CDM cosmological model with a Hubble constant and a mass fraction . Assuming a hydrogen mass fraction gives a mean particle mass . Confidence intervals quoted are for one parameter; multi-parameter intervals are specified when used. The results are primarily quantified in terms of an overdensity ; in Coma, , , and (Piffaretti et al., 2011). Accordingly, we define a normalized angular distance from the center (defined as the X-ray peak) of Coma; (and ) is subsequently generalized to the (dimensionless) semiminor axis of an ellipse.
2. Energy-dependent virial signature
2.1. CRE evolution
CREs of high energy cool rapidly by Compton up-scattering CMB photons, leading to a radiative signature in the form of a thin ring at photon energy . At low energies, the CRE cooling time becomes long, so these CREs are able to propagate farther from the shock before radiating away their energy. The resulting broadening of the virial shock signal with decreasing photon energy can be attributed to several effects, in particular the CRE (i) advection downstream, toward the center of the cluster; (ii) diffusion downstream; and (iii) escape upstream. Of these three processes, only downstream advection is reasonably well constrained on theoretical grounds.
The signal is not only broadened by the evolution of the CRE distribution, but is also distorted by it. As CREs are advected deeper into the cluster, adiabatic compression raises both their density and their energy. This locally boosts the brightness of the radiative signature, and shifts it toward higher energies.
If CRE diffusion were sufficiently strong, at low energies the virial shock signal would be greatly broadened, encompassing the entire cluster. In addition, such diffusion would stem the adiabatic compression of the CREs. The resulting smooth, faint radiative signal would be difficult to distinguish from the foreground, and may eventually be rendered undetectable. As we show below in §4, we do identify a localized signal inward of the virial shock even in soft X-rays. Therefore, diffusion cannot be too strong. In the following, we thus neglect CRE diffusion, and revisit it by imposing an upper limit on the diffusion function in §6.
If both downstream advection and upstream escape are sufficiently strong, one may see two signals arising from low energy CREs. The first would be an inner, compression-enhanced signal, peaked at , associated with cooling-limited inward advection. The second would be an outer signal, peaked outside the shock radius , associated with the escaping CREs. The present data lack the sensitivity needed to detect the latter, putative, upstream component, so here we analyze only the former, inner signal. The following discussion thus takes into account downstream advection only.
2.2. Downstream advection
To compute the radiative signature of the cooling, advected, CREs, one needs to evolve the CRE distribution. This, in turn, requires an estimate of the time that elapsed since each mass element crossed the shock. One way to do so is to approximate the accretion parameter as constant throughout the evolution of the cluster, and to adopt some mass-radius relation such as the linear, profile of an isothermal sphere. Here, subscript designates baryons. Then the radius of a shell that crossed the shock at an earlier time, ago, is given by
| (1) |
where for simplicity we approximated the Hubble parameter by its present-day value, , and similarly took . The dimensionless factor accounts for deviations from the linear relation, from constant , and , and from a spherical geometry.
Consider an injected power-law CRE spectrum of index , and in particular CREs that emit photons of typical energy . The emissivity of these CREs, at times much shorter than their cooling time,
| (2) |
scales as . Here, is the electron mass, is the speed of light, is the Thompson cross section, and are the CMB temperature and energy density, and is the Boltzmann constant.
For a nearly flat, spectrum, we may approximate the emission from each CRE as constant during its cooling time, so its time-integrated contribution to the brightness becomes . The brightness observed at a projected normalized distance from the center of the cluster, where is the distance in the plane of the sky, is then found by the line of sight integration through a shell of radial range given by .
We first consider a model in which the CREs are injected uniformly across a spherical shock. This model, referred to as the shell model, is discussed in §2.3. An alternative, planar model, which may be more appropriate in the case of Coma, is motivated and discussed in §2.4. Both models are subsequently generalized for a triaxial shock surface in §2.5.
2.3. Shell model
In the shell model, integration over the radiating layer of CREs is equivalent to taking the difference between the radiation due to the volume inside , and the radiation from the volume inside . This yields the logarithmic brightness
| (3) |
where , and is the dimensionless brightness at due to a globe of radius , assuming unit emissivity at radius . Here we defined the (-independent) normalization
| (4) |
as the (non-cooled) emissivity at the shock surface, weighted by the shock radius.
In the absence of brightening due to CRE compression, integration over the homogeneous volume of the shell gives the geometrical factor
| (5) |
Here, is the Heaviside step function. Incorporating a power-law compression of the CRE energy, of the form , gives instead
| (6) |
where is the hypergeometric function. One may crudely approximate the compression using the projected radius,
| (7) |
where the brightening factor is not allowed to exceed in order to avoid excessive compression and nonphysical divergence at small radii. The approximate Eq. (7), although useful for , is not utilized in what follows.
To estimate the compression index , we first consider an isothermal sphere distribution, where the gas number density scales as , and assume for simplicity that all mass elements were shocked to the same density and temperature (e.g., Kushnir & Waxman, 2009). Hence, , such that q=8/3, where we assumed adiabatic compression of CRs with an adiabatic index . Such a model is consistent with the profile of Coma’s -model when extrapolated to large radii. It can be directly generalized for the steeper profile expected at the cluster periphery. For example, the steep, profile found at large radii in the Hernquist model (Hernquist, 1990) yields . Note that due to the compression, the energy of each CRE increases as for an isothermal sphere, and as for an profile.
The resulting brightness profile from the virial shock is illustrated in Figure 1 for different energy bands. For comparison with binned data, we also compute the signature binned onto projected radial annuli. Integration over both the line of sight and the projected radius in the bin yields a mean bin brightness
| (8) |
where is given by the RHS of Eq. (3), but with replaced by
| (9) |
The binned profile is illustrated in the right panel of Figure 1, for the same energy bands.
2.4. Expected signal in Coma: planar model
When focusing on a specific cluster such as Coma, rather than stacking data over many clusters, it is advantageous to investigate the large-scale environment of the cluster. This environment is likely to affect the accretion pattern of the cluster, which is directly reflected in the -rays from the virial shock, and, with some time delay, also in the nonthermal X-rays. This includes for example a brightening in localized regions with an enhanced accretion rate, leading to bright spots along the virial shock surface (Keshet et al., 2003).
We thus examine the galaxy clusters and groups in the nearby, vicinity of Coma, using the Meta-Catalog of X-ray Clusters (MCXC; Piffaretti et al., 2011). Let be the inclination of a LSS object with respect to Coma, defined as the angle between the Coma line of sight and the line connecting the object and Coma. As Figure 2 shows, all the large scale structure in the vicinity of Coma lies at inclination angles nearly perpendicular to the line of sight, most of it within the range . These objects are found at a typical proper distance from Coma. Massive clusters and have smaller, inclinations; however, at from Coma, these two clusters cannot be considered as part of its close environment.
Assuming that the accretion rate through the Coma virial shock correlates spatially with the distribution of surrounding galaxy clusters and groups, one would therefore expect the virial emission to be particularly strong in the plane of the sky, i.e., in the vicinity of the plane cutting through Coma perpendicular to the line of sight. The shell model, integrating over a spherically symmetric shell and shown as curves in Figure 1, would then overestimate the signal at small radii. For preferentially planar emission, the signal from the virial shock would drop rapidly as the projected radius decreases inward. Indeed, in the limit of emission confined to a plane, the signal would drop to zero within one cooling distance from the projected shock radius, at .
Consider the limit of a thin, planar emission layer of width , henceforth referred to as the planar model. The brightness here would still be given formally by Eq. (3), but with the normalization of Eq. (4) replaced by
| (10) |
and Eq. (6) replaced by
| (11) |
The binned brightness would similarly be given by Eq. (8), but using instead of , and with Eq. (9) replaced by
| (12) |
The brightness profile in the planar model is illustrated as shaded regions in Figure 1, for the LAT and ROSAT energy bands. The sharp drop in brightness inside reflects our assumption of a well-defined cooling time; in practice, this drop will be somewhat smoothed.
2.5. Elliptic generalization
When studying an individual cluster, one should also consider the morphology of the virial shock, in particular its projected elongation (i.e., the ratio of semimajor axis to semiminor axis) on the sky. The dark matter halos of galaxy clusters are thought to be nearly prolate, especially when the cluster is unrelaxed (Lemze et al., 2012), with a typical (three dimensional) elongation (e.g., Groener & Goldberg, 2014) that becomes larger for more massive clusters, reaching an average at the high mass end (Despali et al., 2014). The distribution of SDSS galaxies around Coma (K17) suggests an even more elongated structure, around . Indeed, is the minimal elongation for which the VERITAS signal reaches peak significance (K17); however, this signal remains strong for even more elongated templates, as large as the VERITAS mosaic allows (). In conclusions, elongation values in the range are expected in the virial shock of Coma.
Next, consider the orientation of the virial ring’s elongation. Based on numerical simulations, the major axis is typically expected to point in the direction of the main connecting galaxy filament, presumably related to the most massive LSS neighbor. In the case of Coma, this object is A1367 (shown in Figure 2 as the largest, darkest disk). With , this cluster is less massive than Coma, but times more massive than Coma’s second most massive neighbor, NGC 4104. The expected orientation of the virial ring, based on the distribution of SDSS galaxies toward A1367, is indeed consistent with the preliminary signal in the VERITAS mosaic, both found (K17) to peak at major axis angles , where is the azimuthal angle in equatorial coordinates (such that points due west).
The preceding discussion, invoking the distribution of LSS around Coma and the preliminary signal from VERITAS, motivates a search for an elliptic virial ring signature, of typical elongation with the major axis in the east–west direction, and suggests that the emission along the virial shock surface would be preferentially strong in the plane of the sky. According to the VERITAS data analysis (see figure 2 in K17), due to the elongation of the ring, searching for a purely circular feature is not expected to show any virial signal in Coma. Instead, one should consider an elliptical template. A simple approach is to adopt the spherical signature derived above, as illustrated in Figure 1, and simply stretch it uniformly along the major axis.
We therefore redefine (henceforth) as a projected elliptical radial coordinate, , where and are the projected coordinates along the minor and major axes, respectively. For comparison with other clusters and with the stacking analysis of R17, it is convenient to normalize scales with respect to overdensity parameters such as those evaluated at . A dimensionless elliptical coordinate is thus defined, by normalizing with respect to . Equivalently, in terms of the angular separation from the center of Coma, we may define , where . The coordinate may be regarded as the normalized semiminor axis of an ellipse. For a spherical shock, our definition of coincides with that of R17. The VERITAS analysis suggests that the shock should lie near .
3. Fermi-LAT analysis
3.1. Data preparation and analysis
\begin{overpic}[width=241.84842pt,trim=0.0pt 0.0pt 0.0pt 0.0pt]{ComaFermiMap2.eps} \put(8.0,78.0){\normalsize{\color[rgb]{1,1,1}(a)}} \end{overpic} \begin{overpic}[width=241.84842pt,trim=0.0pt 0.0pt 0.0pt 0.0pt]{ComaFermiMapMasked.eps} \put(8.0,78.0){\normalsize{\color[rgb]{1,1,1}(b)}} \end{overpic}
We use the archival, year, Pass-8 LAT data from the Fermi Science Support Center (FSSC)222http://fermi.gsfc.nasa.gov/ssc, and the Fermi Science Tools (version v10r0p5). Pre-generated weekly all-sky files are used, spanning weeks for a total of 414 weeks (), with SOURCE class photon events. A zenith angle cut of is applied to avoid CR-generated -rays originating from the Earth’s atmospheric limb, according to the appropriate FSSC Data Preparation recommendations. Good time intervals are identified using the recommended selection expression (DATA_QUAL==1) and (LAT_CONGIF==1).
Sky maps are discretized using a HEALPix scheme (Górski et al., 2005) of order , providing a mean pixel separation. This is sufficient for analyzing the anticipated virial shock in the Coma cluster, and is smaller than the high-energy PSF of the LAT ( containment angle at GeV; Atwood et al., 2013).
Event energies are logarithmically binned onto energy bands in the (1–100) GeV range. Unlike the all-sky analysis of R17, here we do not rely on the highest energy band, due to the poor statistics in the small region around a single cluster; we subsequently confirm that incorporating this band does not modify our conclusions. Point source contamination is minimized by masking pixels within the containment area of each point source in the LAT 4-year point source catalog (3FGL; Acero et al., 2015). The LAT data around Coma and the masking of point sources are presented in Figure 3, on both large () and small () scales.
The foreground, after point sources were masked, varies mainly on scales much larger than the sub-degree width of the anticipated signal. Therefore, this remaining foreground can be accurately approximated using a polynomial fit on large scales. We thus consider a large, (equivalently, ) elliptical disk region around Coma, and fit the corresponding LAT data by an order polynomial in the normalized angular coordinates and . To minimize the effect of the central diffuse signal (discussed below), we use only the () data for foreground estimation. The foreground is evaluated separately in each of the three energy bands.
Sensitivity tests, presented in part in R17 for the purpose of stacking analyses, and established here for the analysis of Coma, indicate that the results do not strongly depend on the precise choice of analysis variants and parameters, as discussed in §3.4 below.
We bin the LAT data into concentric elliptical rings about the center of Coma, assuming a ring morphology defined by an elongation and a major axis orientation . For each photon energy band , and each radial bin centered on with width , we define the excess emission as the difference between the number of detected photons, and the number of photons estimated from the fitted foreground. The significance of the excess emission in a given energy band and radial bin can then be estimated, assuming Poisson statistics with , as
| (13) |
3.2. Ring signal
Figure 4 shows the fluxes corresponding to (solid lines), (dashed) and (dash-dotted), for the three energy bands used. Here, we adopt the nominal ring parameters inferred in §2.4, namely and , and an angular bin size , small enough to capture the anticipated thin -ray ring. The excess flux inferred from the three energy bands combined (black x-marks) shows a tentative signal in the bin. This bin is highlighted by dashed contours in panel (b) of Figure 3. This signal is resolved by splitting the bin further, as demonstrated in the figure for (magenta crosses). The location of this signal, corresponding to the semiminor axis range , agrees with the location of the VERITAS signal ().
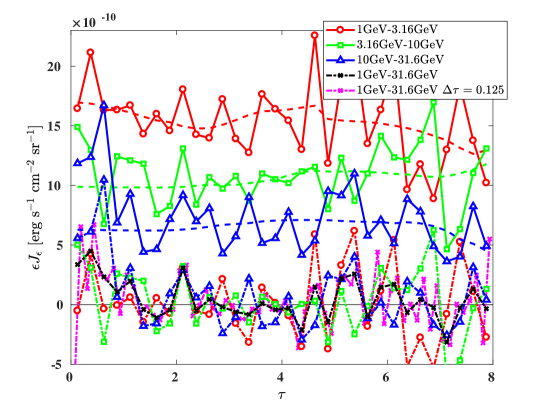
The significance of the flux excess above the foreground is shown in Figure 5 for the nominal ring morphology. Some significant diffuse excess can be seen in the central , the nature of which is beyond the scope of the present analysis, and is deferred to a future paper. The narrow, elliptical ring-like signal in the bin presents at a confidence level for the nominal, bin width. This excess can be resolved. For narrower, binning, it is resolved into two, and confidence level, sub-bins. The excess is more significant on the western side of the cluster.
Figures 4 and 5 pertain to the nominal, VERITAS-motivaed ring morphology, and . Next, we examine different ring morphologies, by varying the values of and of . Figure 6 shows the significance of the signal for a wide range of plausible and values. It indicates that the nominal parameters approximately maximize the significance of the emission in this bin, in resemblance of the VERITAS signal. The maximal bin significance is , with and encompassing the nominal parameters.
We find no such pronounced maximum in other bins in the relevant () range, for any values. We do find a broad, maximum in the bin, but this corresponds to a signal which partly overlaps with the same ring signature found, with a higher significance, in the bin. Figure 6 pertains to the masking of containment around 3FGL sources, but we obtain nearly identical results for containment, indicating that the conclusions are independent of the masking pattern.
The dependence of the signal upon the assumed ring morphology is further illustrated in Figure 7. Here, we show the significance of the LAT excess counts as a function of , , and , by keeping or fixed and scanning the other parameters, and using a polar plot to demonstrate the -dependence. This figure too indicates that the signal is particularly strong for the nominal ring parameters inferred from VERITAS and for .
In conclusion, we find a significant, LAT excess at the same location and morphology as indicated by the VERITAS signal. The values of the three ring morphology parameters (, , and ) that maximize the significance of the LAT signal are similar to those that maximize the significance of the VERITAS signal, although in the latter only a lower limit on could be established.
\begin{overpic}[width=256.0748pt,trim=0.0pt 0.0pt 0.0pt 0.0pt]{ComaRing1.eps} \put(8.0,73.0){\normalsize{\color[rgb]{0,0,0}(a)}} \end{overpic} \begin{overpic}[angle={0},width=113.81102pt,trim=0.0pt 0.0pt 0.0pt 0.0pt,clip]{Polar_plot.eps} \put(48.0,88.0){\normalsize{\color[rgb]{0,0,0}(b)}} \end{overpic}
3.3. Signal modelling
To model the signal and better quantify its significance, we use a maximal likelihood (minimal ) analysis. First, for given band and bin, we compute the contribution of the excess counts with respect to the model prediction ,
| (14) |
The likelihood is then related to the sum over all spatial bins and energy bands, as
| (15) |
The test statistics (Mattox et al., 1996) TS, defined as
| (16) |
can now be computed. Here, subscript (subscript ) refers to the likelihood without (with) the modelled signal, maximized over any free parameters.
We examine both the shell model and the planar model for CRE injection, as discussed in §2. For -rays, where the extent of the emission layer is negligible with respect to the bin size, each model has two free parameters, determining the location of the shock and the efficiency of CRE injection. We choose these parameters as the semiminor axis of the projected shock surface, , and the logarithmic brightness in the elliptical bin.
It is useful to parameterize the injection efficiency also in terms of the logarithmic flux from the entire virial shock. Using estimates based on the -model, found in equations (A10) and (A14) of R17, this flux is given by
| (17) | |||||
This result holds for both shell and planar models, providing an estimate of .
For both models, the likelihood is estimated in the range, to avoid spurious contamination from the poorly modeled central region and from interfering structure at large radii. We use all three energy bands, implicitly assuming a flat, injected CRE spectrum. Changing to slightly softer, values, or incorporating also the fourth, photon-deprived high-energy band, introduces only a mild change in the resulting model parameters.
The best fit profiles of both models are shown in Figure 5. In the first, shell model, we obtain , corresponding to a signal. The best fit parameters here are , and , or equivalently . In terms of CRE injection rate, this may be written (using Eq. 17) as .
The second, planar model presents with , corresponding to a detection. This is higher than in the shell model, because the planar model better captures the narrow (in ) signature. The best fit parameters here are , and , or equivalently . The acceleration efficiency can be determined from Eq. (17) in this model too; this yields .
3.4. Robustness and comparison with previous studies
Convergence and sensitivity tests for the foreground estimation and binning procedures were demonstrated in R17. Overall, here we find that our results are robust even under significant changes to the polynomial fit order and to the angular extent of foreground estimation, are converged for HEALPix order and under splitting the energy range to various bands, and are well-behaved for modest variations in , , and .
Ackermann et al. (2016) reported residual (background subtracted) emission from an area that overlaps partly with the Coma virial radius. They placed one-sided (henceforth) upper limits in the range , depending on the template and spectrum assumed, on the flux of extended emission. Zandanel & Ando (2014) placed upper limits in the range on using virial ring templates (ring, disc, and east–west ellipse). Using a thick () elliptic () ring template, Prokhorov (2014) placed upper limits in the range on .
In order to compare our results with these studies, we compute the photon flux integrated over the entire virial shock. In the shell model, we obtain , whereas in the planar model, which provides a better fit to the data, . Our results are therefore comparable, and in some variants quite consistent, with these previous upper limits. Moreover, such upper limits are sensitive to the precise template assumed, as demonstrated by the scatter among these studies and within each study; they are also quite sensitive to the modeled foreground (Ackermann et al., 2016). In particular, none of the previous studies modelled a thin ring, as we identify in LAT data.
To demonstrate this, we repeat the thick ring analysis of Prokhorov (2014), centered on with width . We do not identify a signal here, despite having a few more years of data and using our robust foreground removal method. This imposes a one-sided upper limit of , consistent, and even somewhat stronger, than the upper limit imposed by Prokhorov (2014) using the same template. Hence, allowing for narrow structures in our analysis, as anticipated in §2, is instrumental in detecting the signal. This allows the flux of the narrow ring to exceed the flux upper limit based on a thick ring, by a factor of for the planar model.
Foreground removal can have an important effect on our results. The signal we report constitutes about one third of the total coincident flux (see Figure 4). Our analysis removes all but the sharpest features (with the designated elliptical morphology), attributing weak gradients to the foreground. It is likely that our analysis — as well as the previous upper limits mentioned above — attribute part of the signal, in particular its smoother parts, to the foreground, which is primarily Galactic and not precisely known (e.g., Keshet et al., 2004c).
This effect is obfuscated by template misalignment and model uncertainties. Our purely elliptic ring template cannot be assumed to precisely capture the full pattern of the shock. As the template is thin, a small misalignment with respect to the projected shock would suffice for a substantial loss of flux, being attributed to the foreground rather than to the signal. Due to this effect, the above flux estimates may somewhat underestimate the actual signal.
4. ROSAT analysis
4.1. Data preparation and analysis
We use the ROSAT all sky survey (RASS; Snowden et al., 1997), with the Position Sensitive Proportional Counter (PSPC) of the X-ray telescope (XRT). The provided333http://hea-www.harvard.edu/rosat/rsdc.html PSPC maps were binned onto pixels, well above the native radius for energy containment. Point sources were removed to a uniform source flux threshold for which their catalog is complete over of the sky (Snowden et al., 1997). The exposure time in the Coma region is .
The spectrum of the thermal bremsstrahlung X-ray emission is harder than the spectrum of the virial shock signal, so it is advantageous to search for the latter at low energies. In addition, for a steep density profile at the cluster outskirts, where adiabatic compression is substantial, the anticipated, binned virial signal is more pronounced at lower energies (see Figure 1). Therefore, to pick up the virial shock signal while minimizing the thermal contamination from the cluster and nearby structure, we focus on the lowest energy band, R1, spanning the energy range . To test the signal, we also examine the next, R2 band, spanning the range .
Maps centered upon the X-ray peak in Coma were retrieved from SkyView (McGlynn et al., 1998). The maps span with a resolution in declination, with a rectangular (CAR) projection, so the solid angle per pixel is . This ensures a proper sampling of the binned map without approaching the instrumental resolution. Next, we bin the X-ray counts in elliptic concentric annuli around Coma, following the preliminary signal from VERITAS and the aforementioned results from the LAT. Zoomed in, maps of the brightness in the R1 and R1+R2 bands are shown in Figure 8, along with contours illustrating the elliptic binning. Here, we define the R1+R2 band as the co-addition of bands R1 and R2 after normalizing each band to the same mean flux level, to allow equally weighted contributions from each band.
4.2. Results
Figure 9 shows the radial profile of the brightness in the R1 band for the nominal, east–west () elongated () binning. The central region of the cluster is dominated by diffuse thermal emission. One can crudely model this component by fitting the binned profile as the combination of a uniform foreground and a thermal component with a radial power-law, . The best fit (shown as a dot-dashed green curve) indicates a projected power-law index (in band R1; in the combined bands R1+R2), which corresponds to a non-projected emissivity profile. This is somewhat flatter than anticipated by extrapolating the -model to large radii, in part due to the known substructure southwest of the cluster’s center, and in part due to the virial ring signal, as we show below.
At , corresponding to a projected semiminor axis length , or equivalently a semiminor separation angle , some additional diffuse excess emission can be seen, in particular in the western side of the cluster. This excess can be modelled as the emission from virial shock-accelerated CREs according to the binned analysis of §2. We consider both the shell model (Eqs. 8–9) and the planar model (Eqs. 11–12). We first adopt the (normalized, semiminor) shock radius , as inferred from the LAT analysis of §3, and the nominal compression index corresponding to the isothermal sphere or extrapolated -model gas distributions. This leaves two free parameters, pertaining to the injection of CREs in the shock and to their evolution downstream. The former constitutes an overall normalization factor, which can be chosen as the parameter of Eq. (4) or of Eq. (10). The latter parameter can be chosen as , the (projected, semiminor) radius where the virial shock-accelerated CREs emitting in the ROSAT band typically cool.
We thus fit the data with a two-parameter model, considering the shell model and the planar model separately, and quantify the likelihood of each model using the two-parameter confidence level corresponding to its TS statistics. The resulting fit for the shell model, shown in Figure 9 as a dashed red curve, presents at the confidence level, with . Fitting the planar model, instead, gives a higher significance, signal (blue solid curve), with . These results are not sensitive to small changes in , and vary smoothly with changes in . When allowing for the virial emission, the estimated slope of the inner profile steepens slightly, to .
The same analysis is next applied to the R2 band, and to the combined, R1+R2 band, as shown in Figure 10. Band R2 shows essentially the same features as the R1 band, but as expected, the virial signal is weaker; it presents at a ( confidence level for the shell (planar) model, and the uncertainty in the model parameters is substantial. The combined, R1+R2 analysis shows a significant signal for the shell model, at the confidence level, with . The planar model shows a higher significance, signal, with . The higher energy ROSAT bands, R4 () and R5–R7 (), do not show a similar signal.
4.3. Ring morphology
The ring morphology parameters and can be determined based on the X-ray signature alone. Consider the planar model, which provides a better fit to the ROSAT data (as well as to the LAT data). Figure 11 shows the TS-based significance of the virial signal in the R1+R2 band, as a function of and . The signal is noticeably localized near the nominal ring morphology. The maximal significance is , with and encompassing the nominal parameters.
Here we assumed that the shock lies at , but the results remain nearly unchanged throughout the relevant, range. This renders the evaluation of the ring morphology robust, but precludes a determination of the shock position based on the X-ray data alone unless the flow is accurately modelled. A similar maximum near the nominal ring parameters is also found using band R1 alone, but this maximum is only local, with small other maxima emerging, including a narrow peak around .
In Figure 11 we imposed a threshold, where is the number of degrees of freedom, to avoid contamination by poor likelihood models for the central signal. Lowering this threshold down to leaves a pronounced global maximum near the nominal ring parameters, but lowering it much further would leave no viable solution. Raising the threshold much beyond 3 would introduce spurious local maxima.
The ring morphology is also illustrated using polar plots, in Figure 12. Both R1 and R1+R2 bands show a strong signal maximized at the nominal ring parameters. In band R1, this maximum is only local, and would not have been uniquely identified in the absence of the VERITAS prior. However, it becomes a pronounced global maximum in the combined R1+R2 bands.
The emergence of the nominal ring parameters as a pronounced (and global, in the R1+R2 band) maximum of significance in X-rays alone, like it did in the VERITAS data and in the LAT data, indicates that the three signals reflect the same phenomenon. The good agreement of the data with the model supports the interpretation of the signal as arising from virial shock-accelerated CREs, perceptibly advected downstream in the X-ray emitting regime. The better agreement of the ROSAT data with the planar model than with the shell model, as found also for the LAT data in §3, provides additional evidence for preferential accretion in the plane of the sky.
5. Broadband analysis
We may now combine the virial signals outlined above and in K17 in order to measure the spectrum of CREs injected at the shock. This spectrum is assumed to be a power-law, . The CREs emitting -rays cool rapidly, before they can travel far from the shock, so the VERITAS and LAT signals directly trace the cooled CRE spectrum, . However, these two -ray telescopes do not span a sufficiently wide range of photon energies to permit a good spectral measurement, considering the substantial uncertainties in flux determination, and the different systematics of each telescope. In contrast, the wide energy range spanned by a combination of -ray and X-ray measurements is sufficient for a spectral measurement. However, X-ray emitting CREs do travel far from the shock, so one needs to take into account their propagation and compression.
Therefore, we evaluate the spectrum by first extrapolating each signal to the corresponding emissivity at the shock, before the radiating CREs can propagate and evolve, using the analysis of §2. The shock emissivity then directly yields the flux of CREs injected at the shock. We carry out the analysis separately for the shell model and for the planar model; recall that the latter fits better both the LAT data and the ROSAT data.
For the shell model, we quantify the emissivity at the shock using the parameter , where the normalization of Eq. (4) is inferred from the binned analysis of Eqs. (8) and (9). Here, is a reference photon energy, which we arbitrarily choose as . Similarly, for the planar model we use the parameter , where the latter term is defined in Eq. (10) and is derived from the binned analysis of Eq. (12). The two parameters scale in the models as a power law in photon energy, , where . Their definition is convenient, because they are energy independent for a flat () CRE spectrum. Fitting their values as inferred from the data, as an power-law, yields an estimate of the CRE spectrum injected at the shock: .
Figure 13 shows the CRE injection estimates based separately on ROSAT, on Fermi-LAT, and on VERITAS. The left panel depicts the values of inferred from the shell model, whereas the right panel shows the values of derived from the planar model. To obtain more reliable estimates, we use the locally measured brightness , rather than the integrated flux .
In the VERITAS mosaic (Arlen et al., 2012), a thick ring spanning the semiminor axis range shows an excess signal of counts (K17). Taking into account the observation duration and the estimated effective area along with its energy dependence (Maier, 2008), and assuming a flat, spectrum, this corresponds to a flux . Notice that this flux is about half that of the rough estimate in K17, where a constant value was adopted for the typical effective area. This corrected flux corresponds in the shell model, according to Eqs. (8) and (9), to an injected CRE normalization . In the planar model, it corresponds to .
For the LAT, the shell model indicates a flux in the bin, in which the signal is significant. This corresponds to an injected . In the better fitting, planar model, the flux in this bin becomes , corresponding to .
For ROSAT, the inferred values of and are sensitive to the level of adiabatic compression experienced by the CREs, and to the column density of absorbing gas, estimated as (Dickey & Lockman, 1990; Kalberla et al., 2005). Here we use the R1 band. For , we obtain, using the unabsorbed flux according to the PIMMS (v4.8d; Mukai, 1993) tool, for the shell model, and for the planar model. For , we find and .
Fitting these X-ray through -ray estimates as a single power-law, we find that in the shell model for ( for ), shown as a dashed (dotted) curve in the left panel of Figure 13. In the planar model, we find for ( for ), shown in the right panel. These results demonstrate how correcting for the rise in CRE energy density due to the adiabatic compression slightly hardens the reconstructed spectrum. The boost in CRE energy due to adiabatic compression does not appreciably change the results.
The CRE spectrum injected at the shock, found to lie in the range , is consistent with the nearly flat spectrum anticipated in a strong shock. It is similarly consistent with the spectrum derived from the LAT stacking analysis (R17). Conversely, this result supports the interpretation of the three signals as not only arising from the same mechanism, but also as inverse-Compton emission from CREs injected by the virial shock.
The CRE injection rate , estimated above for the few GeV LAT range by adopting the planar model and assuming , changes only slightly, to (with an uncertainty factor of ), for . Here, we took into account CRE Lorentz factors in the range (the same result is obtained, e.g., for ).
As Figure 13 shows, the injection rate corresponding to the LAT signal is noticeably lower then that inferred from the VERITAS mosaic. The two are inconsistent at the () level in the shell (planar) model, suggesting some systematic error in the analysis. Some of the LAT signal may have been attributed to the stronger foreground, and some of it must have been missed due to the narrow template, as discussed in §3.4; correcting for such a putative effect would somewhat flatten the inferred spectrum, toward . Alternatively, the VERITAS analysis (K17) may be affected by systematic errors associated with the observational mode, which was not intended for observing a diffuse signal; a fainter VERITAS signal would imply a softer spectrum, . Further research is needed to resolve the discrepancy and facilitate a more accurate measurement of the spectrum.
6. Summary and Discussion
Following preliminary evidence (K17) for an elongated virial ring in a VERITAS mosaic, we examine if there are coincident signals in -rays from Fermi-LAT (see Figure 3), and in soft, X-rays from ROSAT (Figure 8). Such emission is expected from the CREs accelerated by the virial shock, as they inverse-Compton scatter CMB photons. The anticipated signature is approximately an ellipse, with a ratio of semimajor axis to semiminor axis, a semiminor axis in the range , and an approximately east-west, major axis orientation.
We analyze the broad-band signature of CREs injected by the virial shock (see Figure 1). The radius, thickness, and spectrum of the resulting, so-called virial ring emission, depend on the energy of the photon (or equivalently, of the emitting CRE). In high, in particular LAT and VERITAS, energies, a maximally thin (bin- or PSF-limited) photon excess with a nearly flat spectrum () is expected. In low, in particular soft X-ray, energies, the ring should become smaller and thicker due to advection downstream. Adiabatic compression amplifies this signal, leading to an apparent spectral softening. The corresponding ROSAT signal is expected to surface above the foreground only at the lowest energy bands.
The broad-band signature is derived for non-binned (Eqs. 3–6) and binned (Eqs. 8–9) analyses, under the assumption of homogeneous CRE injection along the shock surface, in the so-called shell model. However, the distribution of known LSS surrounding Coma (Figure 2) suggests that accretion through the virial shock may be particularly strong in the plane of the sky, motivating the introduction of a planar model (Eqs. 10–12). Here, the rings are thinner than in the shell model, and the signal vanishes at small radii.
In both LAT and ROSAT data, we find signals at the expected ring elongation , orientation , approximate shock position , and brightness . Each of these signals is not, on its own accord, and ignoring prior information, highly significant. The LAT signal presents locally as a thin (PSF-broadened), elliptical ring, at the confidence level (Figures 4 and 5). However, fitting our model (with TS statistics, taking into account trial factors) indicates only a detection (for the planar model; for the shell model). The ROSAT signal presents as a smaller-scale, , extended excess (Figures 9 and 10), at the confidence level (TS statistics in band R1+R2 for the planar model; for the shell model). However, in band R1 alone, a comparably good fit can be found at a few other combinations of and (Figure 12).
Nevertheless, these signals, combined, indicate a virial shock signal at a high confidence level, because (i) the VERITAS analysis has already pinpointed the ring parameters , , and, with some uncertainty, also and ; (ii) the combined significance of the three signals is very high, although they cannot be simply co-added due to the different analysis techniques and their systematics; (iii) the LAT excess is maximized at approximately the ring parameters inferred from VERITAS (Figures 6 and 7); (iv) the ROSAT significance too is maximized at the same parameters (Figures 11 and 12), globally (band R1+R2) or at least locally (R1); (v) the brightness of the three signals agrees well with the expected flat, injected CRE spectrum (Figure 13); (vi) the inferred CRE acceleration efficiency qualitatively agrees with a previous independent estimate (R17); and (vii) anecdotal evidence that the shock tracers (ROSAT, LAT, VERITAS, synchrotron and SZ; see K17) are related, for example their similarly dominant western part.
The broadband signal corresponds to a CRE injection rate over a Hubble time. Due to the unknown three-dimensional morphology, the differences between the models, the dependence upon additional processes such as CRE advection and diffusion, and the systematics inherent to each model and analysis pipeline, this can only be determined to within a factor of . This result compares favorably with the (with a systematic uncertainty factor of ) estimate derived from a stacking analysis (R17) that combined LAT data around 112 other galaxy cluster.
We find that the planar model, in which CRE injection is assumed to preferentially take place in the plane of the sky, provides a better fit to both the LAT data and the ROSAT data, with respect to the shell model, in which injection is assumed to be uniform along a triaxial shock surface. If substantiated, this would demonstrate how the leptonic virial shock signal can gauge the large scale environment of the cluster. If such a planar signature is furthermore found to be typical of cluster virial shocks, then this may explain why the stacked LAT ring (R17) appeared to be slightly (but not significantly) narrower than expected. Indeed, after the smooth gradients have been filtered out, there is a bias for preferentially picking out the sharper, face-on signature of planar emission.
Our LAT results are consistent with previous upper limits imposed on the -ray emission from Coma (e.g., Zandanel & Ando, 2014; Prokhorov, 2014; Ackermann et al., 2016). Although our flux estimate slightly exceeds some of these limits, this can be traced to different template and background removal methods; see §3.4. The elliptic ring-like signal appears considerably narrower in the LAT than it does in the VERITAS mosaic, where is presents with a (FWHM) thickness of (K17). However, this is probably due to the observational mode used by VERITAS, in particular the integration diameter of the on-region. The comparison is further complicated by the wobble mode and ring background model used to produce the VERITAS mosaic, which are not intended for observing a diffuse signal.
CREs that radiate in the X-ray band have a considerable time to travel away from the shock, by advection and by diffusion; the latter could in principle smear and effectively remove a detectable signal. The detection of a localized ROSAT signal thus places an upper limit on the CRE diffusion coefficient, . The best fit to the ROSAT signal indicates a (semiminor) radius of cooling. This corresponds to an upper limit , consistent with typical estimates for the ICM (Keshet, 2010, and references therein; note that typically increases with energy).
The brightness of the X-ray signal depends on the level of adiabatic compression, which competes with diffusion and thus can provide some measure of , but this would require better data than presently available. The distribution of low-energy CREs should gradually approach the distribution of the X-ray gas, so one may expect less elongated and less planar emission in soft X-rays with respect to the -ray signal. We cannot establish or rule out such an effect with the present data.
References
- Acero et al. (2015) Acero, F., Ackermann, M., Ajello, M., et al. 2015, ApJS, 218, 23
- Ackermann et al. (2016) Ackermann, M., Ajello, M., Albert, A., et al. 2016, ApJ, 819, 149
- Arlen et al. (2012) Arlen, T., Aune, T., Beilicke, M., et al. 2012, ApJ, 757, 123
- Atwood et al. (2013) Atwood, W., Albert, A., Baldini, L., et al. 2013, ArXiv e-prints, arXiv:1303.3514
- Brilenkov et al. (2015) Brilenkov, R., Eingorn, M., & Zhuk, A. 2015, ArXiv e-prints, arXiv:1507.07234
- Brown & Rudnick (2011) Brown, S., & Rudnick, L. 2011, MNRAS, 412, 2
- Despali et al. (2014) Despali, G., Giocoli, C., & Tormen, G. 2014, MNRAS, 443, 3208
- Dickey & Lockman (1990) Dickey, J. M., & Lockman, F. J. 1990, ARA&A, 28, 215
- Gavazzi et al. (2009) Gavazzi, R., Adami, C., Durret, F., et al. 2009, A&A, 498, L33
- Geller et al. (1999) Geller, M. J., Diaferio, A., & Kurtz, M. J. 1999, ApJ, 517, L23
- Górski et al. (2005) Górski, K. M., Hivon, E., Banday, A. J., et al. 2005, ApJ, 622, 759
- Green (2011) Green, D. A. 2011, Bulletin of the Astronomical Society of India, 39, 289
- Groener & Goldberg (2014) Groener, A. M., & Goldberg, D. M. 2014, ApJ, 795, 153
- Hernquist (1990) Hernquist, L. 1990, ApJ, 356, 359
- Kalberla et al. (2005) Kalberla, P. M. W., Burton, W. B., Hartmann, D., et al. 2005, A&A, 440, 775
- Keshet (2010) Keshet, U. 2010, ArXiv e-prints, arXiv:1011.0729
- Keshet et al. (2017) Keshet, U., Kushnir, D., Loeb, A., & Waxman, E. 2017, ApJ, accepted, arXiv:1210.1574
- Keshet et al. (2004a) Keshet, U., Waxman, E., & Loeb, A. 2004a, ApJ, 617, 281
- Keshet et al. (2004b) —. 2004b, New A Rev., 48, 1119
- Keshet et al. (2004c) —. 2004c, J. Cosmology Astropart. Phys, 4, 6
- Keshet et al. (2003) Keshet, U., Waxman, E., Loeb, A., Springel, V., & Hernquist, L. 2003, ApJ, 585, 128
- Kubo et al. (2007) Kubo, J. M., Stebbins, A., Annis, J., et al. 2007, ApJ, 671, 1466
- Kushnir & Waxman (2009) Kushnir, D., & Waxman, E. 2009, Journal of Cosmology and Astro-Particle Physics, 8, 2
- Kushnir & Waxman (2010) —. 2010, Journal of Cosmology and Astro-Particle Physics, 2, 25
- Lemze et al. (2012) Lemze, D., Wagner, R., Rephaeli, Y., et al. 2012, ApJ, 752, 141
- Loeb & Waxman (2000) Loeb, A., & Waxman, E. 2000, Nature, 405, 156
- Maier (2008) Maier, G. 2008, in International Cosmic Ray Conference, Vol. 3, International Cosmic Ray Conference, 1413–1416
- Mattox et al. (1996) Mattox, J. R., Bertsch, D. L., Chiang, J., et al. 1996, ApJ, 461, 396
- McGlynn et al. (1998) McGlynn, T., Scollick, K., & White, N. 1998, in IAU Symposium, Vol. 179, New Horizons from Multi-Wavelength Sky Surveys, ed. B. J. McLean, D. A. Golombek, J. J. E. Hayes, & H. E. Payne, 465
- Miniati (2002) Miniati, F. 2002, MNRAS, 337, 199
- Mukai (1993) Mukai, K. 1993, Legacy, vol. 3, p.21-31, 3, 21
- Okabe et al. (2014) Okabe, N., Futamase, T., Kajisawa, M., & Kuroshima, R. 2014, ApJ, 784, 90
- Okabe et al. (2010) Okabe, N., Okura, Y., & Futamase, T. 2010, ApJ, 713, 291
- Piffaretti et al. (2011) Piffaretti, R., Arnaud, M., Pratt, G. W., Pointecouteau, E., & Melin, J.-B. 2011, A&A, 534, A109
- Planck Collaboration (2012) Planck Collaboration. 2012, ArXiv e-prints, arXiv:1208.3611
- Prokhorov (2014) Prokhorov, D. A. 2014, MNRAS, 441, 2309
- Reiprich & Böhringer (2002) Reiprich, T. H., & Böhringer, H. 2002, ApJ, 567, 716
- Reiss et al. (2017) Reiss, I., Mushkin, J., & Keshet, U. 2017, ArXiv e-prints, arXiv:1705.05376
- Simionescu et al. (2013) Simionescu, A., Werner, N., Urban, O., et al. 2013, ApJ, 775, 4
- Snowden et al. (1997) Snowden, S. L., Egger, R., Freyberg, M. J., et al. 1997, ApJ, 485, 125
- Totani & Kitayama (2000) Totani, T., & Kitayama, T. 2000, ApJ, 545, 572
- Uchida et al. (2016) Uchida, Y., Simionescu, A., Takahashi, T., et al. 2016, PASJ, 68, S20
- Waxman & Loeb (2000) Waxman, E., & Loeb, A. 2000, ApJ, 545, L11
- West et al. (1995) West, M. J., Jones, C., & Forman, W. 1995, ApJ, 451, L5
- Yamazaki & Loeb (2015) Yamazaki, R., & Loeb, A. 2015, MNRAS, 453, 1990
- Zandanel & Ando (2014) Zandanel, F., & Ando, S. 2014, MNRAS, 440, 663