Most pseudo-bulges can be formed at later stages of major mergers
Abstract
Most giant spiral galaxies have pseudo or disk-like bulges that are considered to be the result of purely secular processes. This may challenge the hierarchical scenario predicting about one major merger per massive galaxy () since the last 9 billion years. Here we verify whether or not the association between pseudo-bulges and secular processes is irrevocable. Using GADGET2 N-body/SPH simulations, we have conducted a systematic study of remnants of major mergers which progenitors have been selected (1) to follow the gas richness-look back time relationship, and (2) with a representative distribution of orbits and spins in a cosmological frame. Analyzing the surface-mass density profile of both nearby galaxies and merger remnants with two components, we find that most of them show pseudo-bulges or bar dominated centers. Even if some orbits lead to classical bulges just after the fusion, the contamination by the additional gas that gradually accumulates to the center and forming stars later on, leads to remnants apparently dominated by pseudo-bulges. We also found that simple SPH simulations should be sufficient to form realistic spiral galaxies as remnants of ancient gas-rich mergers without need for specifically tuned feedback conditions. We then conclude that pseudo-bulges and bars in spiral galaxies are natural consequences of major mergers when they are realized in a cosmological context, i.e., with gas-rich progenitors as expected when selected in the distant Universe.
keywords:
evolution - spiral galaxies - formation - bulges - pseudo-bulges - merger.1 Introduction
In the local universe, 80% of galaxies more massive than show a significant bulge in their central parts (i.e., assumed with a Bulge-to-Total flux ratios 0.05, Fisher & Drory, 2011; see also Kormendy et al., 2010). Bulges can be separated into two broad types: classical bulges and pseudo-bulges. Classical bulges exhibit properties resembling elliptical galaxies, while pseudo-bulges are distinguished by their more disk-like features including bars (Kormendy et al.,, 2013; Andredakis & Sanders,, 1994; Fisher & Drory,, 2016). A variety of observational morphological and kinematic characteristics allow to classify bulges into these two types (Kormendy & Kennicutt,, 2004; Athanassoula,, 2005; Fisher & Drory,, 2016). Classical bulges are show a smooth distribution of stars, are supported by velocity dispersion, and are strongly dominated by an old stellar population. They also have a photometric radial profile similar to mass surface density profile of elliptical galaxies with Sersic indices close to 4 (see definition in Sect. 2). Pseudo-bulges may show younger stars, even active star formation, and their dynamics is less supported by velocity dispersion than classical bulges. Pseudo-bulges can result from the evolution of bars, which translate into boxy/peanut isophotal shapes when viewed edge-on. Gas accumulated at the center of a galaxy as a result of the bar gravitational torques can also result in inner disk structures called disc-like pseudo-bulges. These share many properties of disk photometric profiles close to exponential with possible substructures such as spirals, star-forming knots or dust lanes (Athanassoula,, 2005). All pseudo-bulges share the properties that they can be identified as extra light in the central part above the exponential profile of the outer disk. In this paper, we will simply refer as ”pseudo-bulges” all such structures in central parts of spiral galaxies that are non-classical bulges.
Classical bulges are considered to be the result of galaxy mergers, while pseudo-bulges and bulgeless galaxies are believed to be the product of secular evolution (Kormendy & Kennicutt,, 2004; Athanassoula,, 2005). Indeed, when there is a limited amount of gas in the progenitors of major mergers, the violent relaxation of stars in the central parts of the remnant results in a density profile with a high Sersic index (Lynden-Bell,, 1967). Conversely, secular processes correspond to smoother dynamical processes in which gas is brought gradually to the center, resulting in pseudo-bulges (Athanassoula,, 2005; Debattista et al.,, 2006; Heller et al.,, 2007; Athanassoula et al.,, 2013).
The fact that pseudo-bulges or bulgeless galaxies are present in two thirds of large nearby spiral galaxies (Weinzirl et al.,, 2009; Kormendy et al.,, 2010), seems to be in tension with the CDM cosmological model predicting several merger episodes per such galaxy (Stewart et al.,, 2008; Hopkins et al.,, 2010). Indeed, is has been shown that more than 50% of present-day galaxies with stellar masses larger than have experienced one major merger since (Hammer et al.,, 2005, 2009; Puech et al.,, 2012; Rodrigues et al.,, 2017) leading often to a disk-dominated remnant. In this context, it might seem difficult to explain how a majority of local spiral galaxies could be devoid of classical bulges.
Perhaps spiral galaxies could be merger remnants of sufficiently ancient events implying that their progenitors are high redshift galaxies, the latter being gas-rich galaxies (Erb,, 2008; Rodrigues et al.,, 2012). During gas-rich mergers (gas fractions in the progenitors at the fusion time), the large amount of gas involved in the process can dampen down the violent relaxation process otherwise taking place at the center of the remnant, and result in much reduced classical bulge fraction (Hammer et al.,, 2005; Robertson et al.,, 2006; Hopkins et al.,, 2009; Hammer et al.,, 2009). At larger scales, the gas inherits its angular momentum from the orbital momentum of the merger and can then be redistributed into a thin disk (Barnes,, 2002; Hopkins et al.,, 2010; Athanassoula et al.,, 2016). The subsequent virialization phase of the rebuilt disk can last several Gyr (Hopkins et al.,, 2009; Puech et al.,, 2012) during which instabilities could develop and play a role in the formation of pseudo-bulges, especially in presence of bars that can redistribute gas towards the center.
The goal of this paper is to investigate how pseudo-bulges could form in the centers of disks rebuilt after gas-rich major mergers. It also extends previous studies using N-body/SPH simulations of gas-rich major mergers. Hopkins et al., (2010) investigated how the remnant scales as a function of the progenitor masses, gas fractions, mass ratio using a large library of binary gas-rich mergers between spiral progenitors. They found that major mergers are a dominant channel for bulge formation, and that (at first order) decreases when the gas fraction increases. Keselman et al., (2012) presented seven simulations of gas-pure major mergers sampling a restricted range of orbits and spin orientation between the progenitors, and found that the inner structures formed are consistent with expectations from pseudo-bulges.
Athanassoula et al., (2016) included a hot gaseous component in the progenitor models and showed that the two types of bulges can coexist in the remnants, with, on average, only 10 - 20% of the stellar mass of the remnants ending in the classical bulge. Their study also highlight that contrary to what is generally assumed in simulations of isolated bar-forming galaxies, the bar is formed before the thin disk is completely formed. In this paper, we present a more systematic study of pseudo-bulge formation using a library of 12 gas-rich major mergers hydrodynamical simulations sampling all possible relative orientations (see §3). In §4, we discuss the results in term of pseudo-bulge formation and impact of bars, and compare observations and simulations. We begin this study by revisiting the fraction of pseudo-bulges in local galaxies using two complementary samples in §2.
Throughout this paper, magnitudes are quoted in the system and stellar masses are estimated using a diet Salpeter IMF.
2 pseudo-bulges in local spiral galaxies
In this section we revisit the fraction of pseudo-bulge galaxies in the local Universe using two complementary samples. The Kormendy et al., (2010) is based on a very local Volume, within 8 Mpc. One one hand, it therefore offers the finest spatial resolution, particularly well-suited to distinguish pseudo from classical bulges. On the other hand, it is limited by small statistics (only 16 spiral galaxies in total, see §2.2), and it is likely not representative of the galaxy mass function since the Kormendy et al., (2010) restrict themselves to a nearest volume that contains small groups of galaxies but not any denser environments. We therefore also investigated the fraction of pseudo-bulges using the sample of 66 spiral and S0 galaxies from Delgado et al., (2010), who studied the morphology of a representative sample of nearby galaxies selected in a much larger volume (at , i.e., within 85 to 125 Mpc) from using bulge-to-disk morphological decomposition (see §2.3).
2.1 Distinguishing pseudo from classical bulges
The stellar distribution in the central parts can be characterized using the Sersic index (Sersic,, 1963, 1968), which is defined as follows :
| (1) |
in which is the stellar luminosity profile, is the half-light radius of the bulge ( with , the scale length of the bulge, Fisher & Drory, 2008, 2010), and is the luminosity at . It is generally accepted that pseudo-bulges can be identified as those having 2, while classical bulges show 2 (Fisher & Drory,, 2008). Pure disks can be described by exponential disks with , in the following we call the scale length of the stellar disk and is the luminosity at radius .
Other criteria have been used to distinguish both types of bulges such as, e.g., the velocity to velocity dispersion ratio of stars (Athanassoula,, 2005; Kormendy et al.,, 2010; Fisher & Drory,, 2016). However these require more expensive hence rarer kinematic data, and Fabricius et al., (2012) demonstrated a good correlation between Sersic index and kinematics. Following this, we chose in this paper to identify pseudo-bulges using the above criterion on to allow simpler comparison between observations and simulations (see §4).
2.2 The Kormendy sample
Kormendy et al., (2010) studied a volume limited sample in a sphere of 8 Mpc around the Sun. They considered all giant galaxies within this volume with 150 250 , including the Milky Way (MW) and M31. Using the local Tully-Fisher relation (Hammer et al.,, 2007; Pizagno,, 2007), this translates into a stellar mass range 1.3.
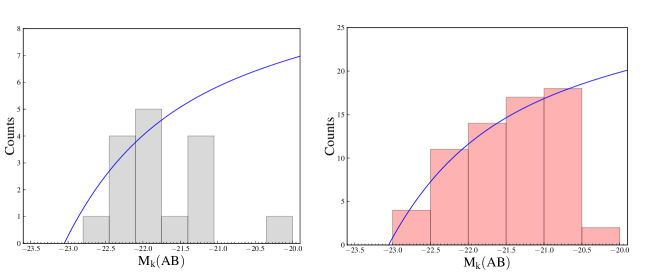
We checked for completeness using the local volume catalogue of Karachentsev et al., (2013), using the same Kormendy et al., (2010) criteria on distance and velocity (using stellar mass as a substitute). One spiral galaxy (Circinus) was removed from the sample because Kormendy et al., (2010) used a rotation velocity of 155 , while this value actually corresponds to rather than , which is 100 (Curran et al.,, 2008). We also updated the 2MASS -band magnitude of M31 and the MW used by Kormendy et al., (2010), 2MASS images being affected by sky subtraction residuals, to the more accurate values of -24.51 (Vega) and -24.02 respectively, as described in Hammer et al., (2007). The resulting revisited sample of 16 spiral galaxies111We note that in this sample, Maffei 2 is a barred spiral with a much lower surface brigthness which probably results in less accurate photometry compared to the other galaxies., including one SB0/a (NGC 2787), is listed in Table 1. Figure 1 shows the -band magnitude histogram of the revisited sample.
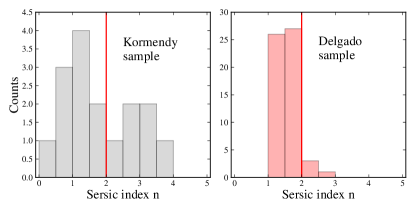
Kormendy et al., (2010) classified the bulges using a combination of different criteria : Sersic index, , stellar formation from molecular gas observations, and identification of disky structures in the center of galaxies such as nuclear rings, bars, or nuclear disk. Amongst the 16 spiral galaxies listed in Table 1, they found 62 of pseudo-bulges (10/16), and 38 of classical bulges (6/16). The distribution of Sersic indices is shown in Figure 2. The fraction of galaxies with non-classical bulges is 62% 25% for a 1- Poisson fluctuations in the parent sample.
| Name | (AB) | V () | n | Ref for n value | Bulge type | ||
|---|---|---|---|---|---|---|---|
| NGC6946 | -21.77 | 210 | 10 | 0.72 | 0.18 | Kormendy et al., (2010) | Pseudo |
| NGC5457 | -21.88 | 210 | 15 | 1.91 | – | Kormendy et al., (2010) | Pseudo |
| IC342 | -21.39 | 192 | 3 | 1.80 | – | Fisher & Drory, (2010) | Pseudo |
| NGC4945 | -21.37 | 174 | 10 | 1.30 | – | Kormendy et al., (2010) | Pseudo |
| NGC5236 | -21.85 | 180 | 15 | 0.40 | – | Fisher & Drory, (2010) | Pseudo |
| NGC5194 | -22.10 | 240 | 20 | 0.50 | 0.14 | Fisher & Drory, (2008, 2010) | Pseudo |
| NGC253 | -22.19 | 210 | 5 | 0.53 | – | Simien & De Vaucouleurs, (2006) | Pseudo |
| Maffei2 | -21.16 | 168 | 20 | 3.00 | 0.50 | Kormendy et al., (2010) | Pseudo |
| Galaxy | -22.17 | 220 | 20 | – | – | Kormendy et al., (2010) | Pseudo |
| NGC4736 | -21.52 | 181 | 10 | 1.30 | 0.20 | Fisher & Drory, (2008, 2010) | Pseudo |
| NGC2683 | -21.28 | 152 | 5 | 2.50 | 0.40 | Kormendy et al., (2010) | Classical |
| NGC2787 | -20.32 | 220 | 10 | 1.24 | 0.33 | Fisher & Drory, (2008) | Classical |
| NGC4826 | -21.87 | 155 | 5 | 3.00 | 1.00 | Kormendy et al., (2010) | Classical |
| NGC4258 | -22.01 | 208 | 6 | 2.80 | 0.50 | Fisher & Drory, (2008, 2010) | Classical |
| M31 | -22.66 | 250 | 20 | 2.20 | 0.30 | Courteau et al., (2011) | Classical |
| M81 | -22.16 | 240 | 10 | 3.80 | 0.10 | Fisher & Drory, (2008, 2010) | Classical |
2.3 The Delgado-Serrano sample
Delgado et al., (2010) studied the morphology of a mass-selected sample of 116 galaxies with at from the Sloan Digital Sky Survey (henceforth SDSS). This sample is representative of the K-band luminosity function at these redshifts in this range of mass (see Delgado et al., 2010), as shown in Figure 1. From a two-dimensional bulge+disk morphological decomposition in band using GALFIT (Peng et al.,, 2010), they identified 101 spiral and S0 galaxies in this sample. To avoid extremely edge-on galaxies and avoid any bias in analyzing the inner regions, we considered in the following only the 66 spiral and S0 galaxies with a axis ratio larger than 0.35. Fisher & Drory, (2016) argued that samples using SDSS images should not lie beyond 120 Mpc, which translates into z = 0.03 for a seeing of 1.4 arcsec. Due to its selection from the SDSS, the Delgado et al., (2010) sample provides a good representation of the galaxy mass function, as well as a significantly larger sample than that of the Local Volume. Retrieving the bulge properties is however altered by the spatial resolution. Delgado et al., (2010) objective was to study the evolution of the Hubble sequence as a function of redshift, but not to look in detail to the inner structures.
We therefore visually inspected the two-dimensional fits in these regions and found occurrences of bars, rings, warps or tiny bulges not accounted for by the original fits. Because of the limited spatial resolution and signal-to-noise ratio (S/N) in these structures, we repeated the disk+bulge morphological decomposition (see Figures in Appendix A) using 1D average flux profiles constructed using the ellipse task from IRAF. For keeping an homogeneous treatment of both observations and simulations, we only fit two components per galaxy, assumed to be the bulge (with estimated Sersic n index) and the disk (with exponential profile). It implies that the fitted bulge often contains a contribution from the bar, and the B/T ratio is more equivalent to a (bulge+bar)/total ratio. There are several motivations in doing so :
-
•
For both observations and simulations the spatial resolution definitively limits attempts of segregating the bar from the bulge;
-
•
In observed galaxies the bar signature may range from purely boxy bulges to large face-on viewed bars, depending on the inclination;
-
•
The flattening of the mass profile due to the softening is currently 0.2 kpc (2.8 times the softening radius, see Section 3.2), which can be compared to FWHM/2=1.4 arcsec resolution, i.e., from 0.29 to 0.41 kpc for the observations.
These similar spatial-resolution limitations may warrant a fair comparison between observations and simulations.
Using the Sersic index criterion, bulges were then classified into classical (n 2) vs. pseudo-bulges (n 2, see Table 3), and found 88 12 of pseudo-bulges or bulge-less galaxies (58/66), and 12 of classical bulges (8/66). We find that classical bulge galaxies are mostly S0 galaxies in this analysis. Besides this, dust effects may potentially impact the morphological classification. To verify this, we further limit our sample to galaxies with 0.5 and 0.65, leading a fraction of 13 of classical bulges in the spiral population. It suggests that our result is not strongly biased by dust effects.
2.4 Distribution of Sersic index in local spirals
While the fractions of spiral galaxies with no classical bulges are found to be consistent within 1- uncertainties in both the Delgado et al., (2010) and the Kormendy et al., (2010) samples, there might be several reasons why this fraction might be significantly higher in the former. While in the Delgado et al., (2010) sample bulges were classified only on the basis of the Sersic index, Kormendy et al., (2010) used additional criteria (see §2.2). A more restrictive selection might naturally explain a smaller fraction of non-classical bulges. In addition, the Kormendy et al., (2010) study sampled more massive galaxies (compare the two panels in Figure 1) for which the fraction of classical bulges likely increases (Kormendy et al.,, 2010; Zahid et al.,, 2017). While the Local Volume sample is by construction complete (at least down to relatively bright magnitudes) it is not necessarily representative of the local luminosity function as the Delgado et al., (2010) sample does. However, the discrepancy between the two samples does not exceed the 1- Poisson fluctuations associated to the limited size of the two samples. Considering such uncertainties, we can robustly conclude that significantly more than half of nearby massive spirals are bulge-less or pseudo-bulged galaxies, i.e., do no show classical bulges.
3 Simulations of gas-rich major mergers
We used a modified version of the public N-body/SPH code GADGET2 (Springel,, 2005), in which star formation, SN feedback, and cooling were modeled following Cox et al., (2006) as implemented by Wang et al., (2012, 2015). We adopted a constant feedback level 5 larger that median conditions as defined by Cox et al., (2006) in order to preserve a large enough gas reservoir at fusion time. We verified that changing the feedback value does not impact the profiles of the remnants significantly. A fiducial softening radius of 73 pc (for the baryonic mass) was adopted along with a resolution of 500 000 particles. The core study of 12 gas-rich major mergers sampling the different possible geometric and spin orientations between the two progenitors is described in §3.1. Mass profiles and disk+bulge morphological decompositions are detailed in §3.2. We checked that the resulting mass profiles are sufficiently robust by repeating the same core study at high resolution (2 millions particles) as described in Appendix B, in which we also checked the impact of a different softening radius (150 pc). All these parameters were found to result in slight variations that do not impact significantly the results presented in §4.
3.1 Gas-rich major merger models
The two progenitors were modeled following Barnes, (2002). Briefly, the stellar mass of the main progenitor (2.75) was scaled to approximately match the mass ranges in the observed samples described in §2. We adopted a mass ratio between both progenitors of 3:1, which is the typical mass ratio observed in distant galaxy gas-rich major mergers (Hammer et al.,, 2009). Gas fractions in the progenitors were scaled to typical values observed at (Rodrigues et al.,, 2012). This corresponds to a look-back time of 9 Gyr, which matches the time after which the remnant morphology was studied (see below). Both gas and stars were distributed into pure thin exponential disks with a gas extension 5 times more extended than the stellar disk. The stellar disk sizes correspond to the typical disks at (Barden et al.,, 2005; Trujillo,, 2006; Van der Wel et al.,, 2014). A total of 20 in baryonic mass (stars and cold gas) was assumed to approximately match the average cosmological baryon density. Dark matter haloes were modelled using a constant-density core profile as in Barnes, (2002). All components were initiated at rotation velocities determined from the Tully-Fisher relation determined in similar range of redshift and mass (Puech et al.,, 2010). All model parameters are summarized in Table 2.
| Parameter | Value |
|---|---|
| Stellar disk scale length of the first progenitor | 3 kpc |
| Stellar disk thickness of the first progenitor | 0.2 kpc |
| Gas disk scale length of the first progenitor | 15 kpc |
| Stellar disk scale length of the second progenitor | 1.73 kpc |
| Stellar disk thickness of the second progenitor | 0.115 kpc |
| Gas disk scale length of the second progenitor | 8.5 kpc |
| of the first progenitor | 4 kpc |
| of the second progenitor | 2.86 kpc |
| Total stellar mass of the first progenitor | 2.75 |
| Baryons fraction (bf) | 0.20 |
| Masses ratio (mr) | 3:1 |
| Gas fraction of the first progenitor (cold gas) | 0.52 |
| Gas fraction of the second progenitor (cold gas) | 0.72 |
| Temperature of gas at the beginning | K |
| Rotation velocity of the first progenitor | 218 |
| Rotation velocity of the second progenitor | 145 |
| Feedback | constant (5 x median) |
| Pericenter (rp) | 16 kpc |
| Merger orbit | parabolic |
| Number of particles | 500 000 to 2 millions |
| Mass of star particles | 4 to |
| Mass of gas particles | 1 x |
| Mass of dark matter particles | 2 x |
| Softening for star particles | 0.073 kpc |
| Softening for gas particles | 0.073 kpc |
| Softening for dark matter particles | 0.091 kpc |
| Stellar mass range of remnants within 15kpc | - |
| Orbit | ||||
|---|---|---|---|---|
| DIR-PROPRO | ||||
| DIR-PRORET | ||||
| DIR-RETPRO | ||||
| DIR-RETRET | ||||
| INC-PROPRO | ||||
| INC-PRORET | ||||
| INC-RETPRO | ||||
| INC-RETRET | ||||
| POLAR-PROPRO | ||||
| POLAR-PRORET | ||||
| POLAR-RETPRO | ||||
| POLAR-RETRET |
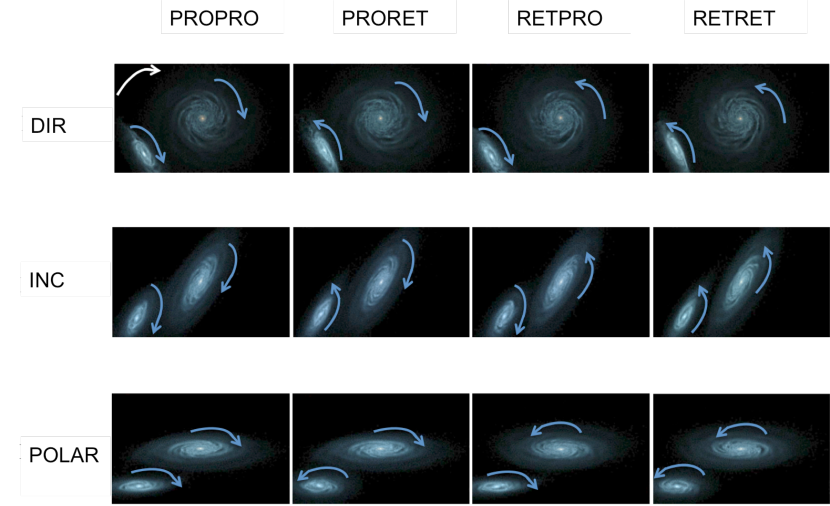
The two progenitors were initiated on parabolic relative trajectories following Barnes, (1992); Barnes & Hernquist, (1996); Barnes, (2002) (see Figure 3). These sample the three general possible cases describing the relative orientations between the main progenitor and the orbital planes : direct orbits, in which the inclination between the main progenitor disk and orbital planes , inclined, in which this angle , and polar, with . To simplify the parameter space, the secondary progenitor was chosen to have polar orbits but we checked that this as no significant impact on the results. Conversely, spin orientations were found to have significant impact so that we conducted a complete study of relative spin orientations by sampling the 4 possible cases between the two progenitors, i.e., prograde-prograde (PROPRO), prograde-retrograde (PRORET), retrograde-prograde (RETPRO), and retrograde-retrograde (RETRET). In this nomenclature, prograde means that the progenitor rotation axis is aligned with the merger orbit, while retrograde means an opposite rotation. This leads to a core study of 12 orbits (see Figure 3). We note that these limited cases are nevertheless representative in term of orientation of the main progenitor and relative spins (Barnes,, 1992). Indeed, this paper does not seek to model specific observations but rather aims to construct a library covering typical orbits that have significant probability to happen in reality.
3.2 Fitting bulges in merger remnants
Simulations were run over about 12 Gyr to ensure that the remnants are sufficiently virialized. Results were visually inspected to measure characteristic times. The first passage and fusion times were found to occur on average 1.5 and 3 Gyr after the beginning of the simulation, respectively. It is broadly consistent with other simulations producing disk-like remnants (Cox et al.,, 2006, 2008; Brook et al.,, 2007; Lotz et al.,, 2008; Dutton & Van Den Bosch,, 2009), with similar masses and gas fractions. We extracted snapshots after 9.3 Gyr of simulation, which place the beginning of the simulations at , matching the lookback-time at which gas fractions in the progenitors were adopted from observations (see §3.1), and providing self-consistent simulations. This implies that remnants galaxies have virialized over 6.3 Gyr after fusion, therefore reaching sufficient equilibrium while letting enough time for subsequent processes to develop during the latest stages of the merging.
From these snapshots, we centered (using the stellar barycenter within 30 kpc) and aligned the remnants to build face-on, stellar-mass surface density maps. These profiles were then constructed (in units) within rings of 0.1 kpc and 1 kpc beyond a radius of 5 kpc to enhance signal-to-noise ratio. They were compared to the profiles obtained using the ellipse task within IRAF, which gives similar results. The 1D profiles were used to decompose the remnants into an exponential disk and an inner Sersic profile as described in §2. Results are listed in Appendix 5.
Several difficulties could arise during such profile fitting. First, one
has to deal with a global degeneracy between the bulge and disk
parameters. Indeed, different sets of [, , , , ]
values can adjust the profile with similar resulting , which
results in uncertainties on all fitted parameters. In particular, the
transition region between the bulge and the disk is often
degenerated between the two profiles (see Figure 4), in particular in presence of a
faint bar. The way to put the disk in relation to the
bulge could change the Sersic index of the bulge, resulting in
uncertainties of in , kpc in , kpc in , and in . Since we used the same method of 1D fitting than done for the Delgado sample analysis,
we expect similar uncertainties for the latter than those estimated above.
In parallel to the fit, we used the 2D stellar mass density maps
using both face-on and edge-on projections to correctly identify the
different structures as illustrated in Figure 4. The finite softening radius in the simulations result in a flattening
of the structures in the central regions below 2.8 times this radius in
the center (Springel,, 2005), just as the seeing does for observations.
To avoid this problem, we have adjusted all the mass density profiles by excluding the
central parts affected by the softening radius.
4 Simulation Results
4.1 Remnant galaxies are all spirals in the core study
We observe in the simulations a behavior broadly consistent with previous simulation studies (see references in Introduction). The two progenitors orbits intersect at least two times (first and second passage), while a bar often forms in the main progenitor at the beginning of the simulation as a result of resonances between the orbit of the secondary and the internal rotation (Hopkins et al.,, 2009). After a 3rd and in some cases a 4th passage, the fusion of the two nuclei takes place, on average 3 Gyr after the beginning of the simulations. All along the interaction gas and stellar particles are ejected into tidal tails in which tidal dwarf galaxies may form. Many old stars end up in the central parts due to the violent relaxation, a small fraction of them in the thick disk and in the halo, while young stars converted from the gas form the thin disk and disky structures as bars or rings. In particular, we confirmed that gas-poor progenitors may result in elliptical galaxies (see §4.2), while gas-rich major mergers reform thin disks.
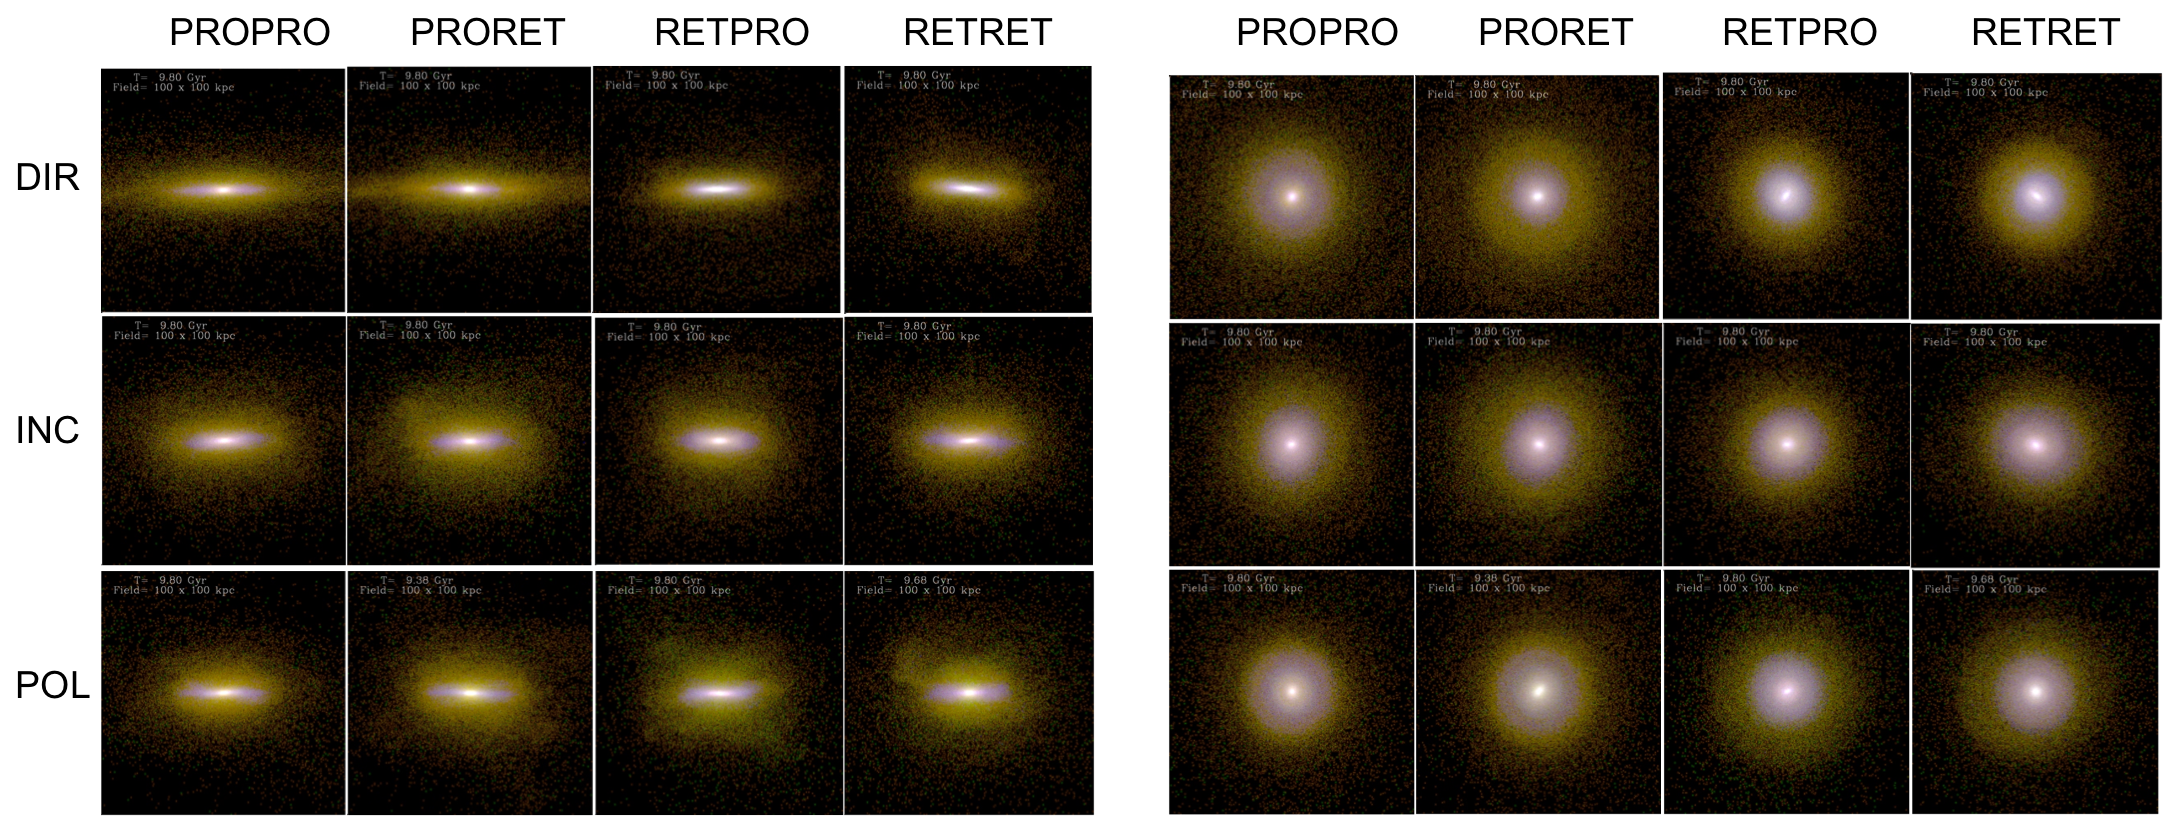
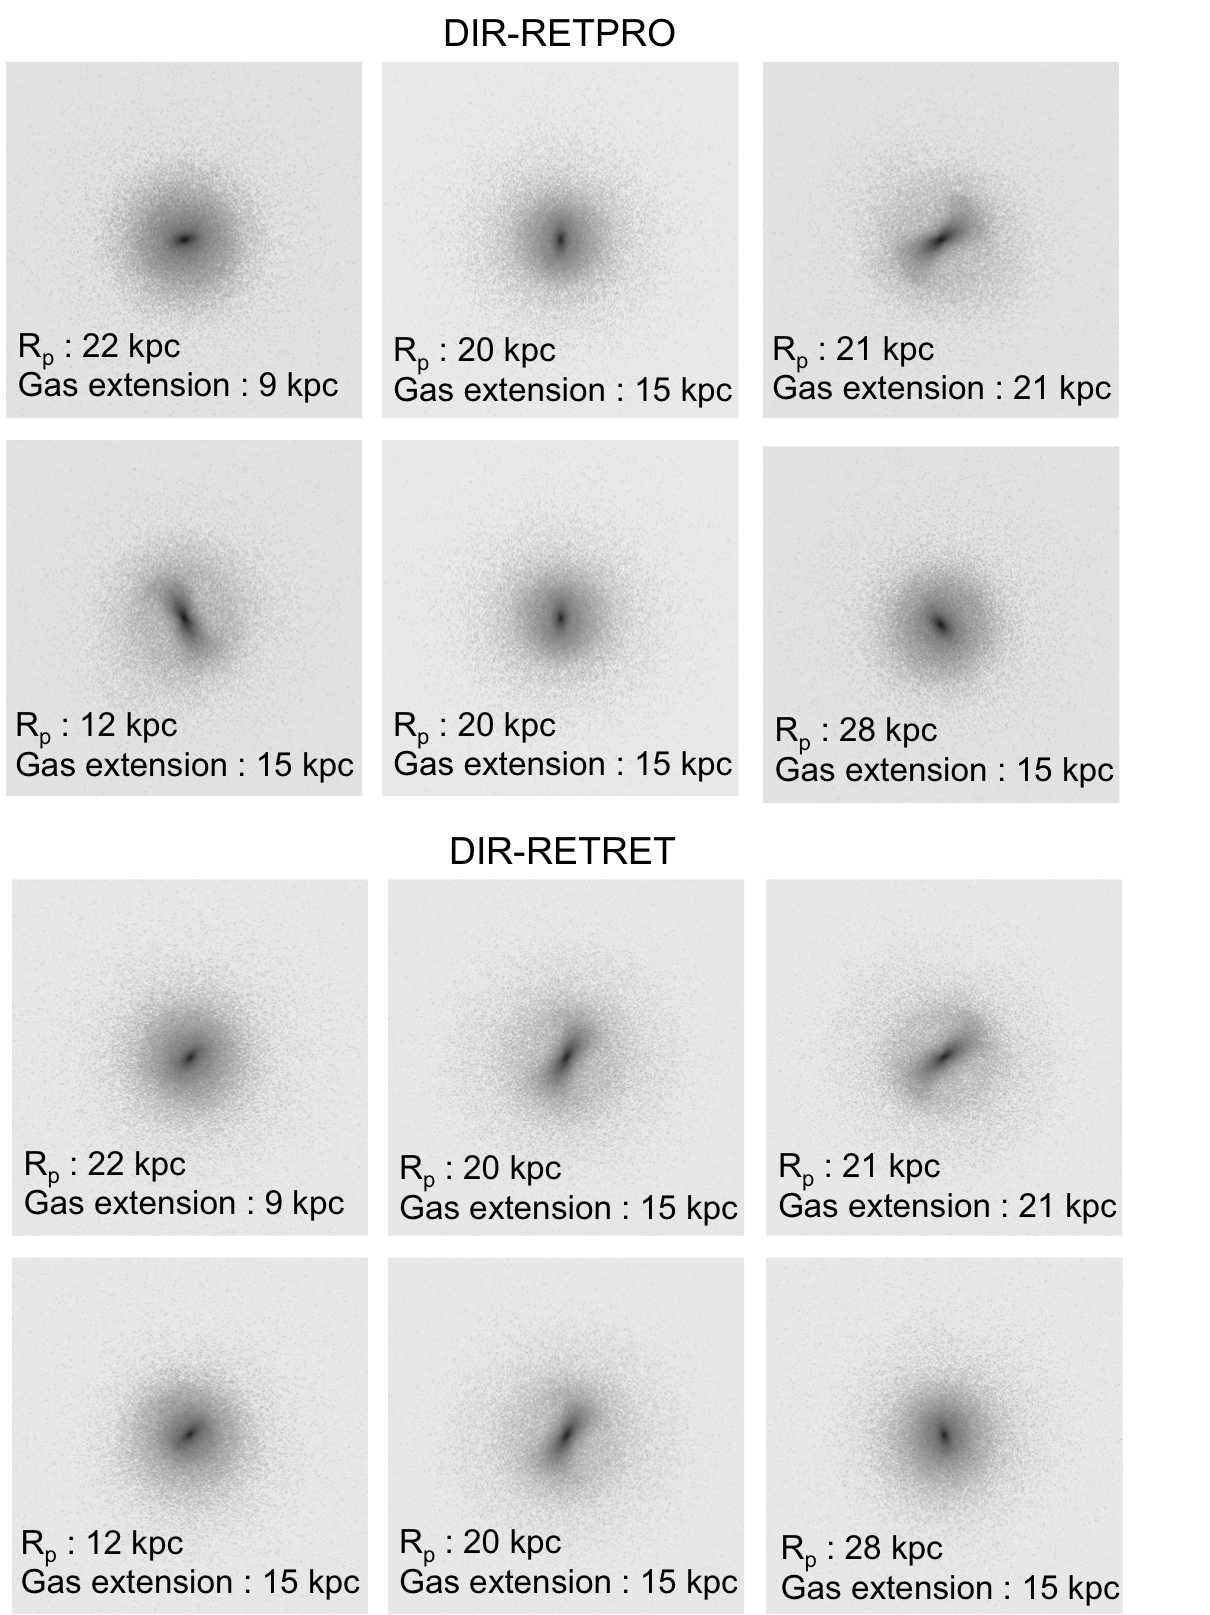
Figure 5 shows an atlas of face-on and edge-on views of the 12 remnant galaxies part of the core study, Gyr after the first passage and Gyr after fusion. The remnants are all spiral galaxies with several structures such as bulges, large disks, bars, or rings. It emphasizes that no specific needs are required to rebuild disks after realistic gas-rich mergers expected to occur at moderate to high-redshift. It has been often proposed that disk rebuilding only occurs in the presence of extreme or peculiar feedback conditions in the central regions, for, e.g., preserving the gas before fusion. We verified that decreasing our feedback to the median value adopted by Cox et al., (2006) would not change drastically our conclusions : for realistic values of the gas fractions in progenitors taken before the first passage at z 1.5, major mergers produce only spiral galaxies. They were found to have stellar masses (within r = 15 kpc) in the range , which is in agreement with the mass range of the observational samples (see §2). Resulting are given in Table 5 (see the 12 first entries and also compare with the next set of 12 similar simulations with 2 M particles) showing that all remnants in the core study have B/T 0.45. Since in the two components decomposition, bar is assumed to be part of the central region (see §2.3), these B/T values correspond to upper limits of the bulge-to-total fraction.
4.2 Properties of bulges & bars in the core study
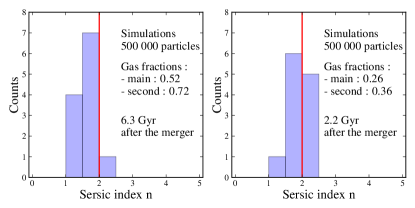
Figure 6 shows the distribution of the Sersic indices (), which are almost all characteristic of pseudo-bulges. We attribute the fact that we have very few classical bulges in the remnants to the large gas fractions adopted in the core study, which are representative of conditions in progenitors at z 1.5 (see §3.1). Indeed, high gas fractions dump the violent relaxation during the fusion. Later on, the gas may accumulate in the center and can form new stars in the surroundings of the newly formed bulge (Hopkins et al.,, 2009, 2010). This phenomenon of gas feeding the center may resemble a secular process, while instead, it is actually a direct consequence of the merger.
Does it mean that mergers are only producing pseudo-bulges? In Section 4.3 we will show that higher gas mass fractions expected for mergers occurring at higher redshifts than those in the core study, would unavoidably lead to more numerous pseudo-bulges. However some mergers may have occurred more recently, and from progenitors having smaller gas fractions. To test this, we simulate similar mergers than those of the core study but with main and secondary progenitors having gas fractions of only 26% and 36%, respectively. The latter corresponds to gas fractions representative of galaxies (Rodrigues et al.,, 2012), and the morphological analysis was repeated only 2.2 Gyr after fusion (or 5.2 Gyr after the beginning of the simulation) to keep these mergers representative of the cosmic epoch - gas fraction relationship. Figure 6 evidences significant larger values for the Sersic indices, with 40% of classical bulges instead of a few percents. We attribute such a large change to the combination of two factors, one being the decreased gas fraction, the other because later-on gas feeding the central regions would have less time to proceed. However the observed evolution of the merger rate highly favors merger events occurring between high-redshift gas-rich galaxies. Then, the main result of the core study stands : major mergers occurred mostly at high redshifts and should mostly lead to form pseudo-bulges.
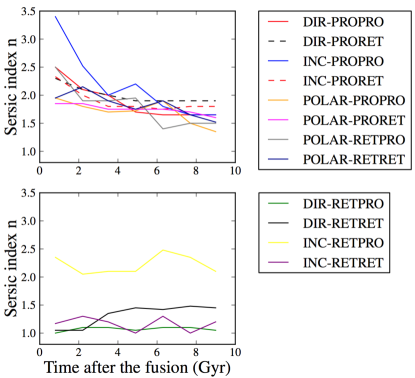
We repeated the morphological decomposition at 0.8, 2.2, 3.5, 4.9, 6.3, 7.7, and 9.0 Gyr after fusion. Figure 7 shows the resulting time evolution of the Sersic index for the core study. Every simulation presents a bar at some time in the simulation, except the simulation with the orbit DIR-PROPRO. For eight simulations (see Figure 7, top panel), the Sersic index decreases with time, in contrast with most other parameters that remained unchanged (see Figure 8). This behavior suggests that gas is accumulating towards the central regions often driven by bars, resulting in the formation of an increasingly disk-like mass profile characterizing pseudo-bulges. Figure 7 indicates that even if a classical bulge ( 2) is formed 1 Gyr after the fusion, a pseudo-bulge component is progressively superimposed, leading to smaller Sersic index (see also Athanassoula et al., 2016). Four orbits (see Figure 7, bottom panel) however show no evolution with time of the Sersic index that remains constant, including the INC-RETPRO orbit, which kept a permanent classical bulge. The orbital parameters of this specific simulation influence the gas distribution and prevent significant amount of gas to be brought into the center. We conclude that gas-rich major mergers can form classical and pseudo-bulges, with an increasing contribution of the later with time, both coexisting as it has been suggested for the Milky Way bulge (Babusiaux,, 2016).
Almost two thirds of local spiral galaxies have bars in their central parts (Eskridge et al.,, 2000; Knapen et al.,, 2000; Laurikainen et al.,, 2004; Menendez et al.,, 2007; Barazza,, 2008; Aguerri et al.,, 2009; Gadotti,, 2009), which result from disk instabilities (Binney et al.,, 2008). During a major merger, it is also common to form bar-like structures at the beginning of the merger during the first passage resulting from resonances between the main progenitor and the orbit (Hopkins et al.,, 2009; Athanassoula et al.,, 2016). At these stages, bars may have a high angular momentum and rotate relatively fast. If the resonance is strong the bar can survive after the fusion and bring gas into the central parts of the remnant. It can then evolve and change in orientation, spin, shape, and length. Bars have Sersic index between 0.5 and 1, as expected since they are density fluctuations of the disk with which they share similar properties (see Gadotti, 2011).
In the core study, we obtained orbits forming bars, whose 2 with large bars (size kpc for DIR-RETPRO and DIR-RETRET), 2 other with medium size bars ( size kpc for INC-RETPRO and INC-RETRET). The last 5 bars have size kpc. For the two simulations with large bars, we explored the impact of the pericenter (12, 20 and 28 kpc) and gas extension (9, 15 and 21 kpc) on the bar formation. Figure 9 shows that for both orbits, a stronger bar is obtained when the extension of gas is equal or less than the pericenter value, probably because of more favorable resonances. Note that these configurations imply that when the secondary progenitor is at pericenter, both progenitor gas disks are in contact. More tests on different orbits would be necessary to conclude on the resonance between the gas extension and pericenter.
4.3 Influence of gas fraction & mass ratio
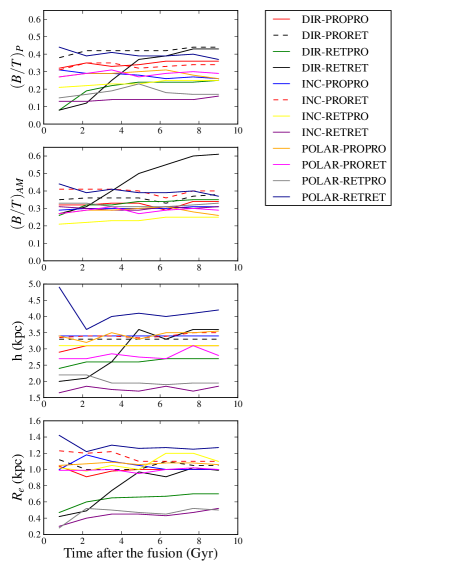
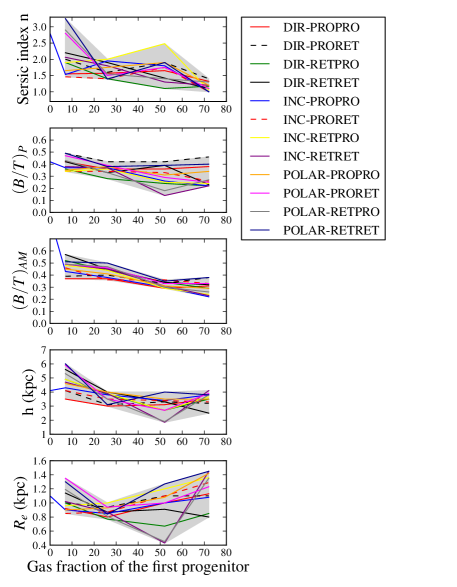
We tested three additional gas fractions for the main and secondary progenitors : -, -, and -, respectively. Figure 10 shows the resulting Sersic indices, 1D-fitting morphological ratios, alternative ratios measured using an angular momentum decomposition following Hammer et al., (2010), and disks scale lengths of the thin disks as a function of gas fraction. The calculated from the angular momentum (i.e., all particles that are lying in the bulge radius and showing no preferential angular momentum) is determined with a much higher accuracy that the photometric and corresponds to a more physical parameter to characterize merger remnants. This is why it is interesting to see that almost all models show very similar ratio (see also Figure 8) and that this ratio is decreasing with increasing gas fraction. However cannot be properly estimated in most observations, so in this paper it serves us as a guidance to control possible effects linked to the estimates that show much larger scatter (see a comparison between the two ratios in Appendix C).
Figure 10 shows that in general all parameters are decreasing with increasing gas fraction, but the bulge effective radius that shows a decrease and then an increase for gas fraction larger than 30%. We suspect that the later behavior is associated to the large bars, whose formations are favored by large gas fractions. The same mechanism probably explains why the Sersic index of all remnants is close to 1 for gas fractions -.
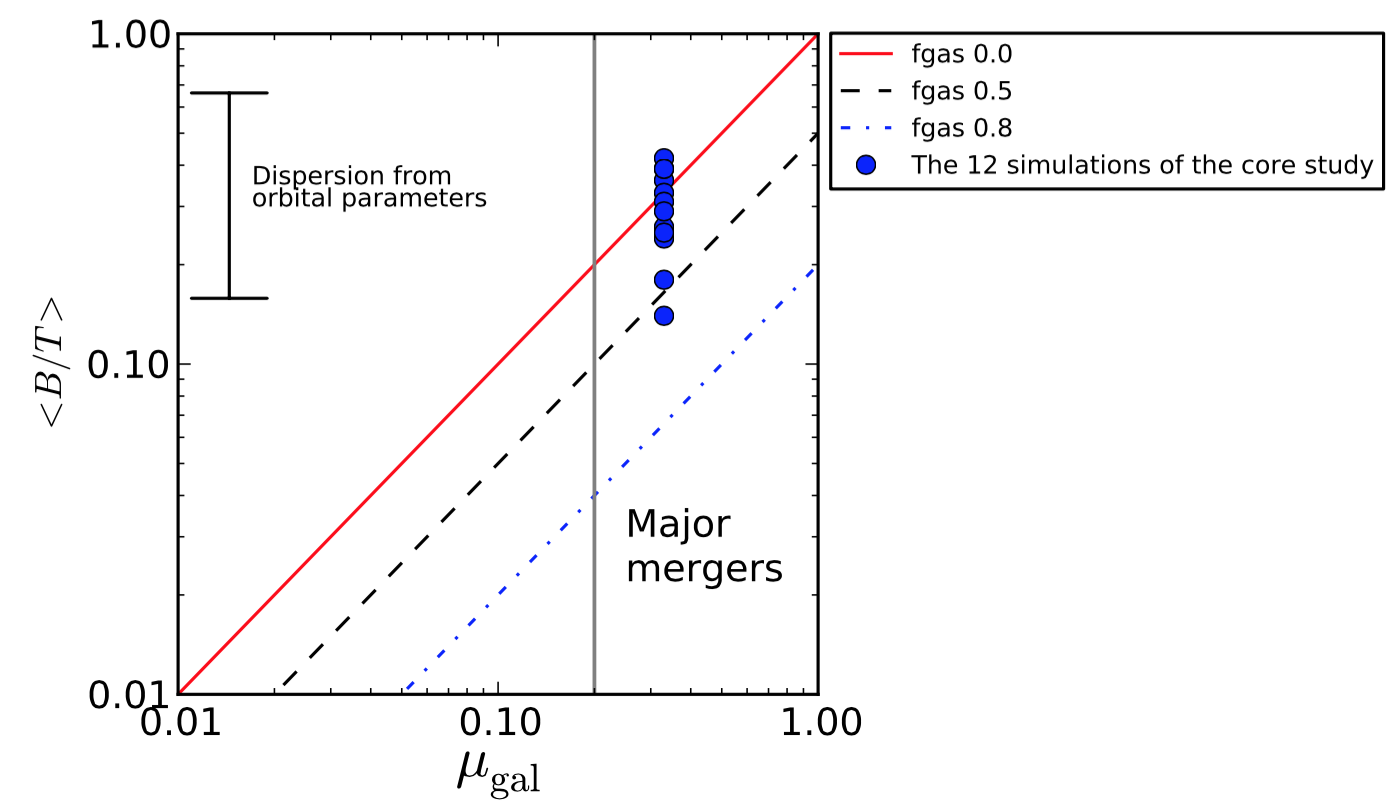
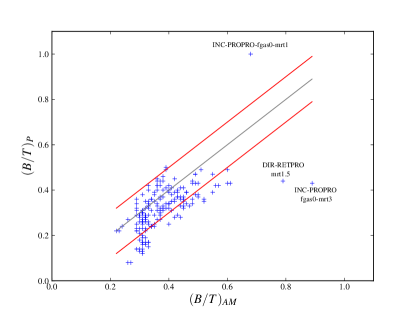
Figure 11 shows the resulting morphological superimposed on the results from the study of Hopkins et al., (2010). The mean over all orbits is 0.30 with a standard deviation of 0.08. The scatter in associated to a change of orbital parameters is found to be similar to the scatter associated to the change of gas fraction in the progenitors as determined by Hopkins et al., (2010). We however notice that our B/T estimates are systematically larger than those theoretically calculated by Hopkins et al., (2010) since the later correspond to the sole classical bulge component conversely to our estimates that include contribution from bars.
We found that the higher the gas fraction, the larger the bars are. Table 5 shows that we obtain no large bars (size kpc) with gas fractions of and of , while 2 large bars are obtained for gas fraction of and 5 for gas fractions of .
For verifying the ability of SPH merger models to form bulge-dominated galaxies, we also conducted simulations with gas fraction as small as in the main progenitor and for the secondary, and for a mass ratio of 3:1 and 1:1. In both cases we obtain a high Sersic index (), while a bar form in the center. A thick disk is formed in the first case, while an elliptical galaxy is obtained in the second.
Finally, we also tested two other different mass ratios for three particular orbits, i.e., 1.5:1 and 4.5:1. We note that for the orbit favorable to bar formation (DIR-RETPRO), the bar is larger when the mass ratio is 4.5:1 than when the mass ratio is 1.5:1.
5 DISCUSSION & CONCLUSION
We have presented a systematic study of gas-rich major merger remnants to verify whether or not there is a tension between the low fraction of nearby galaxies with classical bulges and the hierarchical scenario of galaxy formation. The main result of this study is that mergers of galaxies conducted in realistic cosmological conditions are producing mostly pseudo-bulges and only few classical ones. Indeed most mergers are expected to occur in the distant Universe where galaxies are gas-rich, and our study shows that the residual gas after the fusion gradually falls into the center forming bars and pseudo-bulges for most of the orbital parameters. Forming a significant fraction of classical bulges requires mergers to occur in the nearby Universe with fusion times a few billion years ago, but these events are unlikely to be dominant in the hierarchical scenario (Le Fevre et al.,, 2000; Rawat et al.,, 2008). Formation of bulge-dominated galaxies with Milky Way masses requires event more stringent conditions, i.e., extremely small gas fractions and preferentially 1:1 mergers.
We argue that our study is rather representative of expectations from cosmological conditions, because (1) progenitor gas fractions are adapted from their epoch of involvement into a merger; (2) the orbital parameters are representative of cosmological simulations presenting the whole range of angles expected for parabolic encountering. Our choice of mass ratio to 3:1 (from Hammer et al., 2009) of 16 kpc pericenter and of high feedback is not affecting our main result since variations of these parameters do not change our conclusions. Perhaps a significant progress in sampling properties of mergers remnants would be to allow variance in the orientation of the secondary (assumed to be polar), which would let us with 24 additional simulations in the core study. Otherwise we may conclude that our approach is useful when compared to cosmological simulations since it allows to characterize remnants with a large number of particles and with a rather realistic treatment of the gas hydrodynamics.
All remnants of our core study have been analyzed using a two-component (disk+bulge) method for fitting their surface mass-density profiles, in a very similar way to what has been done for observed galaxies, and with similar limitations on spatial resolutions. It results that all remnants of our core study are spiral galaxies, with their centers dominated by pseudo-bulges and bars, instead of classical bulges. This leads to another important result of this study, since no specific recipe on feedback has been required, and we have verified that reducing feedback to the mean value of Cox et al., (2006) does not significantly affect it. A significant improvement of our modeling and comparison with observations may be to include realistic dust and stellar populations, even if we have shown that dust effects could not have strongly biased our statistics (see Section 2.3).
Further tests could be done to characterize even more realistic hydrodynamics conditions with, e.g., an hydrodynamical solver such as GIZMO (Hopkins,, 2015). Higher number of particles would be also useful to compare the properties of the remnants with those of Local galaxies such those studied by Kormendy et al., (2010).
This study is also bringing a data basis of how should be realistic merger remnants for, e.g., verify whether their properties resemble that of today spiral galaxies. For example, one may study the double disk properties (as done by Peschken et al., 2017) to verify if the observed fractions of Type I, II and III are consistent with our results. Figures 8 and 10 evidence that orbits provide a large variance in B/T, disk scale-length, and bulge effective radius, which could represent qualitatively well most of the present-day spirals : in fact we reproduce most of their structures, such as thin and thick disks, halo, bulges, bars and rings.
Finally we conclude that the dichotomous picture for which pseudo-bulges form secularly while classical bulges form in mergers, has been perhaps pushed too much, and we hope this study may help to clarify that at least pseudo-bulge may form in another way. An important follow up of this paper will be to compare the overall properties (including luminosity profiles and kinematics) of galaxies with the results of a grid of realistic merger remnants, at different epochs.
Acknowledgments
We acknowledge the financial support of T.S. PhD grant from PSL (Paris Sciences et Lettres - France). This work was granted access to the HPC resources of MesoPSL financed by the Region Ile de France and the project Equip@Meso (reference ANR-10-EQPX-29-01) of the program ’Investissements d’Avenir’ supervised by the Agence Nationale pour la Recherche. We wish to thank Jianling Wang for helpful comments, discussions and carefully reading this manuscript. We wish also to thank Karen Disseau for her help in programming and discussions on galaxies morphology. We are grateful to the referee for useful comments and suggestions, which have greatly improve the content of this manuscript.
References
- Aguerri et al., (2009) Aguerri J. A. L., M␣́endez-Abreu J., Corsini E. M., 2009, A&A, 495, 491
- Andredakis & Sanders, (1994) Andredakis Y. C., Sanders R. H., 1994, MNRAS, 267, 283
- Athanassoula, (2005) Athanassoula E., 2005, MNRAS, 358, 1477
- Athanassoula et al., (2013) Athanassoula E., Machado R. E. G., Rodionov S. A., 2013, MNRAS, 429, 1949
- Athanassoula et al., (2016) Athanassoula E., Rodionov S. A., Peschken N., Lambert J. C., 2016, ApJ, 821, 90
- Babusiaux, (2016) Babusiaux C., 2016, Publ. Astron. Soc. Australia, 33, e026
- Barazza, (2008) Barazza F. D., Jogee S., Marinova I., 2008, ApJ, 675, 1194
- Barden et al., (2005) Barden M., et al., 2005, ApJ, 635, 959
- Barnes, (1992) Barnes J. E., 1992, ApJ, 393, 484
- Barnes, (2002) Barnes J. E., 2002, MNRAS, 333, 481
- Barnes & Hernquist, (1996) Barnes J. E., Hernquist L., 1996, ApJ, 471, 115
- Binney et al., (2008) Binney J., Tremaine S., 2008, Galactic Dynamics: Second Edition. Princeton University Press
- Brook et al., (2007) Brook C., Richard S., Kawata D., Martel H., Gibson B. K., 2007, ApJ, 658, 60
- Courteau et al., (2011) Courteau S., Widrow L. M., McDonald M., Guhathakurta P., Gilbert K. M., Zhu Y., Beaton R. L., Majewski S. R., 2011, ApJ, 739, 20
- Cox et al., (2006) Cox T. J., Jonsson P., Primack J. R., Somerville R. S., 2006, MNRAS, 373, 1013
- Cox et al., (2008) Cox T. J., Jonsson P., Somerville R. S., Primack J. R., Dekel A., 2008, MNRAS, 384, 386
- Curran et al., (2008) Curran S. J., Koribalski B. S., Bains I., 2008, MNRAS, 389, 63
- Debattista et al., (2006) Debattista V. P., Mayer L., Carollo C. M., Moore B., Wadsley J., Quinn T., 2006, ApJ, 645, 209
- Delgado et al., (2010) Delgado-Serrano R., Hammer F., Yang Y. B., Puech M., Flores H., Rodrigues M., 2010, A&A, 509, A78
- Dutton & Van Den Bosch, (2009) Dutton A. A., van den Bosch F. C., 2009, MNRAS, 396, 141
- Erb, (2008) Erb D. K., 2008, ApJ, 674, 151
- Eskridge et al., (2000) Eskridge P. B., et al., 2000, AJ, 119, 536
- Fabricius et al., (2012) Fabricius M. H., Saglia R. P., Fisher D. B., Drory N., Bender R., Hopp U., 2012, ApJ, 754, 67
- Fisher & Drory, (2008) Fisher D. B., Drory N., 2008, AJ, 136, 773
- Fisher & Drory, (2010) Fisher D. B., Drory N., 2010, ApJ, 716, 942
- Fisher & Drory, (2011) Fisher D. B., Drory N., 2011, ApJ, 733, L47
- Fisher & Drory, (2016) Fisher D. B., Drory N., 2016, Galactic Bulges, 418, 41
- Gadotti, (2009) Gadotti D. A., 2009, MNRAS, 393, 1531
- Gadotti, (2011) Gadotti D. A., 2011, MNRAS, 415, 3308
- Hammer et al., (2005) Hammer F., Flores H., Elbaz D., Zheng X. Z., Liang Y. C., Cesarsky C., 2005, A&A, 430, 115
- Hammer et al., (2007) Hammer F., Puech M., Chemin L., Flores H., Lehnert M. D., 2007, ApJ, 662, 322
- Hammer et al., (2009) Hammer F., Flores H., Puech M., Yang Y. B., Athanassoula E., Rodrigues M., Delgado R., 2009, A&A, 507, 1313
- Hammer et al., (2010) Hammer F., Yang Y. B., Wang J. L., Puech M., Flores H., Fouquet S., 2010, ApJ, 725, 542
- Heller et al., (2007) Heller C. H., Shlosman I., Athanassoula E., 2007, ApJ, 671, 226
- Hopkins et al., (2009) Hopkins P. F., 2009, in Jogee S., Marinova I., Hao L., Blanc G. A., eds, Astronomical Society of the Pacific Conference Series Vol. 419, Galaxy Evolution: Emerging Insights and Future Challenges. p. 228
- Hopkins, (2015) Hopkins P. F., 2015, MNRAS, 450, 53
- Hopkins et al., (2010) Hopkins P. F., et al., 2010, ApJ, 715, 202
- Jones et al., (2006) Jones D. H., Peterson B. A., Colless M., Saunders W., 2006, MNRAS, 369, 25
- Karachentsev et al., (2013) Karachentsev I. D., Makarov D. I., Kaisina E. I., 2013, AJ, 145, 101
- Keselman et al., (2012) Keselman J. A., Nusser A., 2012, MNRAS, 424, 1232
- Knapen et al., (2000) Knapen J. H., Shlosman I., Peletier R. F., 2000, ApJ, 529, 93
- Kormendy et al., (2013) Kormendy J., 1993, in Dejonghe H., Habing H. J., eds, IAU Symposium Vol. 153, Galactic Bulges. p. 209
- Kormendy & Kennicutt, (2004) Kormendy J., Kennicutt Jr. R. C., 2004, ARA&A, 42, 603
- Kormendy et al., (2010) Kormendy J., Drory N., Bender R., Cornell M. E., 2010, ApJ, 723, 54
- Laurikainen et al., (2004) Laurikainen E., Salo H., Buta R., 2004, ApJ, 607, 103
- Le Fevre et al., (2000) Le Fèvre O., et al., 2000, MNRAS, 311, 565
- Lotz et al., (2008) Lotz J. M., Jonsson P., Cox T. J., Primack J. R., 2008, MNRAS, 391, 1137
- Lynden-Bell, (1967) Lynden-Bell D., 1967, MNRAS, 136, 101
- Menendez et al., (2007) Menéndez-Delmestre K., Sheth K., Schinnerer E., Jarrett T. H., Scoville N. Z., 2007, ApJ, 657, 790
- Peng et al., (2010) Peng C. Y., Ho L. C., Impey C. D., Rix H.-W., 2010, AJ, 139, 2097
- Peschken et al., (2017) Peschken N., Athanassoula E., Rodionov S. A., 2017, MNRAS, 468, 994
- Pizagno, (2007) Pizagno J., et al., 2007, AJ, 134, 945
- Puech et al., (2010) Puech M., Hammer F., Flores H., Delgado-Serrano R., Rodrigues M., Yang Y., 2010, A&A, 510, A68
- Puech et al., (2012) Puech M., Hammer F., Hopkins P. F., Athanassoula E., Flores H., Rodrigues M., Wang J. L., Yang Y. B., 2012, ApJ, 753, 128
- Rawat et al., (2008) Rawat A., Hammer F., Kembhavi A. K., Flores H., 2008, ApJ, 681, 1089
- Robertson et al., (2006) Robertson B., Bullock J. S., Cox T. J., Di Matteo T., Hernquist L., Springel V., Yoshida N., 2006, ApJ, 645, 986
- Rodrigues et al., (2012) Rodrigues M., Puech M., Hammer F., Rothberg B., Flores H., 2012, MNRAS, 421, 2888
- Rodrigues et al., (2017) Rodrigues M., Hammer F., Flores H., Puech M., Athanassoula E., 2017, MNRAS, 465, 1157
- Sersic, (1963) Sersic J. L., 1963, Boletin de la Asociacion Argentina de Astronomia La Plata Argentina, 6, 41
- Sersic, (1968) Sersic J. L., 1968, Atlas de galaxias australes
- Simien & De Vaucouleurs, (2006) Simien F., de Vaucouleurs G., 1986, ApJ, 302, 564
- Springel, (2005) Springel V., 2005, MNRAS, 364, 1105
- Stewart et al., (2008) Stewart K. R., Bullock J. S., Wechsler R. H., Maller A. H., Zentner A. R., 2008, ApJ, 683, 597
- Trujillo, (2006) Trujillo I., et al., 2006, ApJ, 650, 18
- Wang et al., (2012) Wang J., Hammer F., Athanassoula E., Puech M., Yang Y., Flores H., 2012, A&A, 538, A121
- Wang et al., (2015) Wang J., Hammer F., Puech M., Yang Y., Flores H., 2015, MNRAS, 452, 3551
- Weinzirl et al., (2009) Weinzirl T., Jogee S., Khochfar S., Burkert A., Kormendy J., 2009, ApJ, 696, 411
- Zahid et al., (2017) Zahid H. J., Geller M. J., 2017, ApJ, 841, 32
- Van der Wel et al., (2014) Van der Wel A., et al., 2014, ApJ, 788, 28
Appendix A Methodology of the morphological study on the Delgado-Serrano sample.
For each galaxy of the Delgado-Serrano et al. (2010) sample, we have revisited the estimation of the B/T. To fit the profile of the corresponding 66 objects, we have first recovered the profile of each galaxy using the Ellipse task within IRAF. The recovered isophotal profile was then fitted using an interactive program developed by our team that is based on a two components fit (bulge+disk). The central region of each profile was not used because the flattening in the central region is only due to the limited spatial resolution of the observations (seeing). All the fits were performed by TS. Each fit was validated independently by FH and MP, a final sampling verification was performed by HF.
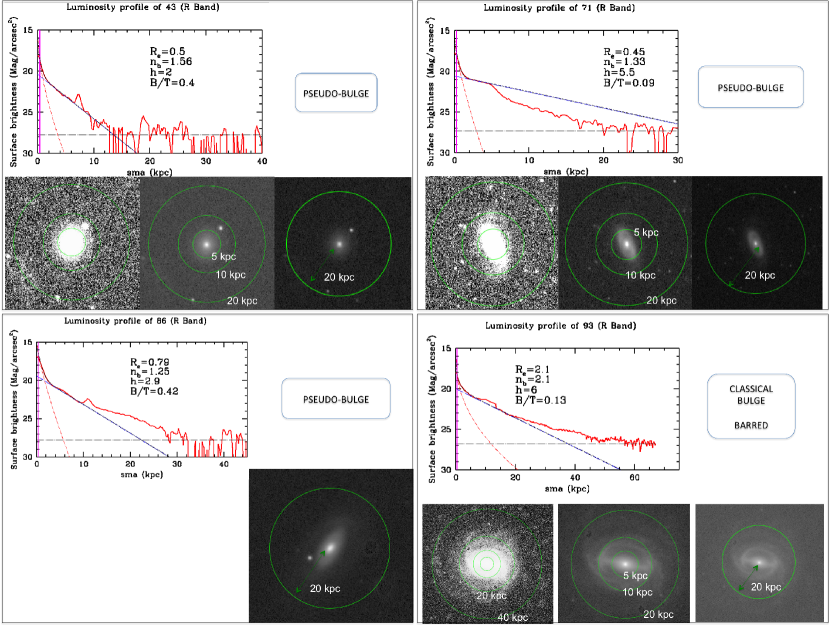
Figure 12 presents four examples of disk+bulge decompositions in 1D (see captions for details). Table 3 displays the parameters of the Delgado-Serrano et al. (2010) galaxies.
To have an estimation of how the flux profile in the central parts of the galaxies is affected by the spatial resolution,
we degraded HST images of a very nearby galaxy (NGC 3982) down to the SDSS PSF. We verified that for bulges with effective radius smaller than 3 to 7 times the HWHM, the peak at the center could be underestimated by up to one magnitude.
We circumvent this problem by avoiding any fit within the HWHM (see the magenta line in Figure 12), and after further tests in fitting bulges we estimate to 0.2 the error on the Sersic n index.
| Num | Name | RA (deg) | DEC (deg) | z | n | h | Bulge type | Bar? | ||
|---|---|---|---|---|---|---|---|---|---|---|
| 4 | 147.1958 | 1.0531 | 0.0273 | – | – | 1.03 | – | Bulgeless | ||
| 5 | 147.3042 | 1.1778 | 0.0251 | 1.35 | 0.35 | 1.70 | 0.10 | Pseudo | ||
| 8 | 157.8958 | -0.4753 | 0.0287 | 1.70 | 0.90 | 4.60 | 0.08 | Pseudo | Y | |
| 10 | 158.9139 | -0.3155 | 0.0293 | 1.05 | 0.45 | 1.50 | 0.28 | Pseudo | ||
| 11 | 159.0583 | -0.1589 | 0.0277 | 1.20 | 0.28 | 2.30 | 0.06 | Pseudo | ||
| 12 | 159.2375 | -0.2297 | 0.0292 | 1.25 | 0.45 | 4.80 | 0.05 | Pseudo | ||
| 16 | 167.1825 | 0.3142 | 0.0248 | 1.36 | 0.76 | 2.20 | 0.35 | Pseudo | ||
| 17 | 167.1708 | -0.3917 | 0.0253 | – | – | 1.80 | – | Bulgeless | Y | |
| 18 | 167.3322 | -0.9448 | 0.0288 | 2.00 | 1.75 | 7.00 | 0.72 | Classical | ||
| 20 | 168.0125 | -0.1750 | 0.0249 | 1.40 | 0.52 | 1.61 | 0.29 | Pseudo | ||
| 21 | 168.4167 | -0.8208 | 0.0286 | 1.50 | 0.60 | 1.90 | 0.15 | Pseudo | Y | |
| 23 | 169.0000 | -0.3497 | 0.0260 | 1.40 | 0.40 | 2.15 | 0.06 | Pseudo | Y | |
| 24 | 169.0375 | -0.5736 | 0.0290 | 1.00 | 0.37 | 3.80 | 0.04 | Pseudo | ||
| 27 | 169.7042 | -0.6192 | 0.0254 | – | – | 1.60 | – | Bulgeless | ||
| 31 | 171.0375 | -1.1578 | 0.0293 | 1.50 | 0.70 | 6.08 | 0.23 | Pseudo | ||
| 32 | 171.0375 | -0.7006 | 0.0260 | 1.50 | 0.80 | 6.70 | 0.03 | Pseudo | Y | |
| 33 | 171.0792 | -0.6436 | 0.0264 | 1.85 | 1.06 | 2.80 | 0.13 | Pseudo | Y | |
| 34 | 171.2241 | -0.9447 | 0.0256 | 2.00 | 2.25 | 6.70 | 0.62 | Classical | ||
| 35 | 171.389 | -0.7341 | 0.0253 | 2.75 | 7.00 | 21.00 | 0.78 | Classical | ||
| 37 | 171.9083 | -0.6642 | 0.0291 | 1.77 | 0.80 | 2.09 | 0.21 | Pseudo | ||
| 39 | 172.8208 | -0.2231 | 0.0297 | 1.32 | 0.50 | 1.80 | 0.20 | Pseudo | ||
| 40 | 173.0375 | -0.9425 | 0.0262 | 1.47 | 0.70 | 2.95 | 0.30 | Pseudo | Y | |
| 42 | 173.6190 | 0.3143 | 0.0289 | 2.00 | 1.70 | 8.00 | 0.62 | Classical | ||
| 43 | 173.6583 | -0.1886 | 0.0289 | 1.56 | 0.50 | 2.00 | 0.40 | Pseudo | ||
| 44 | 173.6625 | -0.1247 | 0.0288 | 1.75 | 0.74 | 3.10 | 0.02 | Pseudo | ||
| 46 | 173.7852 | 0.1051 | 0.0292 | 2.10 | 1.85 | 6.00 | 0.72 | Classical | ||
| 47 | 174.6375 | -1.1844 | 0.0208 | 1.65 | 0.45 | 2.97 | 0.03 | Pseudo | ||
| 48 | 175.0250 | -0.9014 | 0.0287 | 1.30 | 0.62 | 6.00 | 0.10 | Pseudo | ||
| 50 | 176.2208 | -0.9397 | 0.0280 | 1.20 | 0.44 | 2.00 | 0.24 | Pseudo | ||
| 52 | 180.1000 | -0.4906 | 0.0257 | 1.70 | 0.90 | 2.85 | 0.11 | Pseudo | ||
| 53 | 180.3667 | -0.7183 | 0.0207 | 1.84 | 0.90 | 4.76 | 0.07 | Pseudo | Y | |
| 54 | 183.5458 | -0.8317 | 0.0249 | 1.00 | 2.30 | 3.72 | 0.09 | Pseudo | Y | |
| 56 | 184.4708 | -0.6572 | 0.0296 | – | – | 2.50 | – | Bulgeless |
| Num | Name | RA (deg) | DEC (deg) | z | n | h | Bulge type | Bar? | ||
|---|---|---|---|---|---|---|---|---|---|---|
| 58 | 185.9042 | -0.4725 | 0.0256 | 1.00 | 0.2 | 2.02 | 0.00 | Pseudo | Y | |
| 60 | 186.0500 | 1.2131 | 0.0266 | 1.60 | 0.40 | 3.80 | 0.01 | Pseudo | ||
| 64 | 189.6958 | -0.3225 | 0.0228 | 1.90 | 1.33 | 3.50 | 0.13 | Pseudo | Y | |
| 71 | 202.2625 | -0.0436 | 0.0214 | 1.33 | 0.45 | 5.50 | 0.09 | Pseudo | ||
| 72 | 207.0958 | -0.7669 | 0.0261 | 1.25 | 0.30 | 1.20 | 0.04 | Pseudo | ||
| 73 | 207.7583 | -0.1542 | 0.0235 | 1.92 | 1.00 | 4.70 | 0.13 | Pseudo | Y | |
| 75 | 208.3883 | 0.1033 | 0.0299 | 2.15 | 3.00 | 12.00 | 0.82 | Classical | ||
| 77 | 209.5292 | -0.3925 | 0.0296 | 1.85 | 1.50 | 4.10 | 0.13 | Pseudo | ||
| 78 | 210.0542 | -0.9628 | 0.0249 | 1.30 | 0.57 | 1.95 | 0.32 | Pseudo | ||
| 80 | 210.8375 | -0.5581 | 0.0247 | 1.10 | 0.37 | 11.00 | 0.01 | Pseudo | ||
| 82 | 211.2167 | -0.6417 | 0.0244 | 1.57 | 0.80 | 4.00 | 0.16 | Pseudo | Y | |
| 83 | 211.2208 | -0.6111 | 0.0248 | 1.70 | 0.74 | 5.50 | 0.06 | Pseudo | ||
| 84 | 211.5042 | -0.3106 | 0.0246 | 1.60 | 1.70 | 7.00 | 0.13 | Pseudo | Y | |
| 85 | 212.1333 | -0.1269 | 0.0251 | 1.00 | 0.40 | 2.25 | 0.00 | Pseudo | Y | |
| 86 | 212.6125 | -0.8322 | 0.0255 | 1.25 | 0.79 | 2.90 | 0.42 | Pseudo | ||
| 92 | 214.5625 | -0.8911 | 0.0260 | 1.40 | 0.55 | 4.10 | 0.05 | Pseudo | ||
| 93 | 216.8333 | 1.0258 | 0.0257 | 2.10 | 2.10 | 6.00 | 0.13 | Classical | Y | |
| 94 | 217.0208 | 1.0064 | 0.0256 | – | – | 1.80 | – | Bulgeless | ||
| 96 | 217.7583 | 1.2428 | 0.0262 | 1.55 | 0.55 | 2.20 | 0.11 | Pseudo | ||
| 97 | 217.8059 | 1.1587 | 0.0300 | 1.45 | 1.20 | 2.70 | 0.36 | Pseudo | Y | |
| 98 | 218.5458 | -0.6158 | 0.0299 | 1.70 | 0.55 | 1.80 | 0.22 | Pseudo | Y | |
| 99 | 218.8292 | -0.4769 | 0.0295 | 1.00 | 0.35 | 1.32 | 0.00 | Pseudo | Y | |
| 100 | 218.8662 | 0.1043 | 0.0293 | 1.80 | 1.20 | 3.70 | 0.50 | Pseudo | Y | |
| 101 | 220.7721 | 0.3184 | 0.0291 | 1.30 | 0.65 | 1.78 | 0.43 | Pseudo | Y | |
| 105 | 221.2625 | -0.5269 | 0.0289 | 1.70 | 0.60 | 5.30 | 0.01 | Pseudo | ||
| 106 | 221.5542 | -0.8661 | 0.0289 | – | – | 1.76 | – | Bulgeless | ||
| 107 | 222.7167 | 1.1656 | 0.0272 | 1.50 | 0.67 | 1.30 | 0.20 | Pseudo | ||
| 108 | 226.7042 | -0.8569 | 0.0296 | – | – | 0.80 | – | Bulgeless | ||
| 109 | 229.8625 | -0.9239 | 0.0297 | – | – | 0.98 | – | Bulgeless | ||
| 110 | 230.1000 | -0.2253 | 0.0287 | – | – | 1.10 | – | Bulgeless | ||
| 112 | 230.7292 | -0.8953 | 0.0280 | 1.28 | 0.41 | 2.50 | 0.04 | Pseudo | Y | |
| 113 | 230.8905 | -1.2153 | 0.0277 | 2.00 | 2.17 | 5.20 | 0.33 | Classical | ||
| 116 | 232.8208 | -0.1264 | 0.0293 | 1.55 | 0.75 | 3.60 | 0.08 | Pseudo | Y |
Appendix B Impact of the softening value and of the resolution on results.
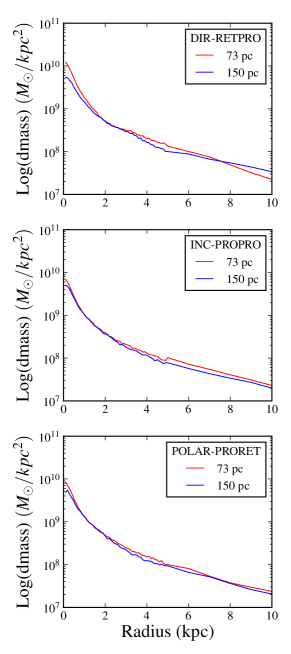
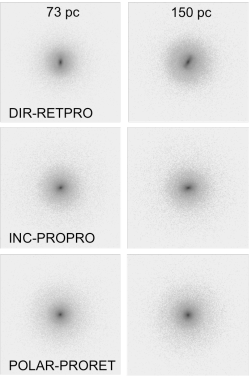
In this section, we describe the impact of the value of the softening radius and of the resolution on results for three different orbits.
The softening radius flattened the structures below 2.8 times this radius in the center (Springel,, 2005) and impacts the bar formation. However, the value of 73 pc is consistent with the values taken by Peschken et al., (2017), Athanassoula et al., (2016) or by Cox et al., (2006), i.e., between 25 and 100 pc. We have tested another value of softening : 150 pc. The effect of increasing the softening radius on the profiles of three different orbits can be seen in Figure 13. The first orbit (DIR-RETPRO) is an orbit favorable to resonances, and the change of softening may affect the profile center. For the other two cases without bars we can see the flattening at the center althought the mass profile is generally unaffected by the softening choice.
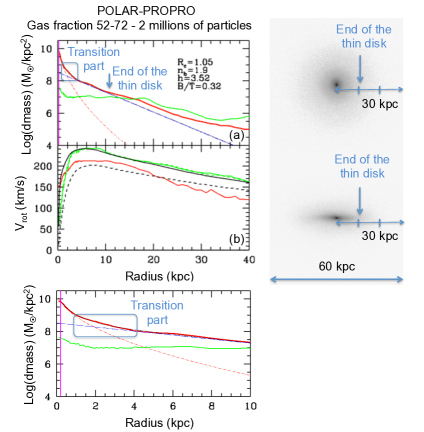
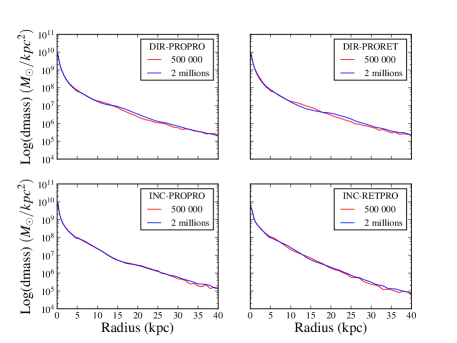
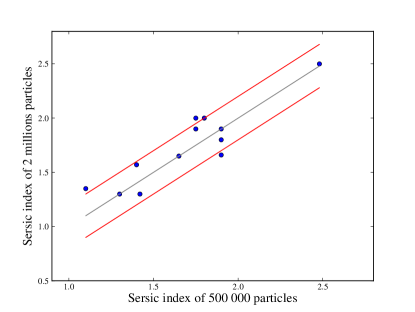
In Figure 14, we can see the superposition of mass profile for 4 simulations with 500 000 particles and 2 millions of particules. We conclude that the number of particles does not change much the mass profile and the analysis. We can see the comparison of Sersic index between 500 000 particles and 2 millions of particles on Figure 15. The only difference is that 2 millions of particules models help to generate resonance effects and we find 3 more bars than for 500 000 particules models (see Table 5).
Appendix C Comparison between photometric B/T ratio and B/T ratio from angular momentum decomposition.
Figure 16 shows the distribution of the photometric B/T ratio values in function to the B/T ratio from angular momentum decomposition. The error estimated for the photometric B/T ratio is . The only parameter involved in the measure of B/T ratio from angular momentum is the radius chosen to have velocity of stars inside this radius, this could also give a small error that we could add to the previous one. Consider this, only three points are really out of uncertainty, which are almost all elliptical or S0 galaxies :
-
•
INC-PROPRO-fgas0-mrt1 : the simulation INC-PROPRO without gas and with a mass ratio 1:1, which is an elliptical galaxy.
-
•
INC-PROPRO-fgas0-mrt3 : the simulation INC-PROPRO without gas and with a mass ratio 3:1, which is an object with a small bar and a large thick disk.
-
•
DIR-RETPRO-mrt1.5 : the simulation DIR-RETPRO with a mass ratio of 1.5:1, which has a large thick disk.
Appendix D Result of simulation fits.
The following Tables summarize all results of the disk+bulge decomposition from the simulations. The columns are : name of the orbit, bar size in kpc, 5 fitted parameters [, , , , ], (B/T) ratios (from photometry and from angular momentum, respectively), gas fraction of the remnant galaxy and mass in . The name of the simulation set is indicated at the top of each panel. Very compact bulges with similar or less than 0.20 kpc (which corresponds to 2.8 times the value of the softening) are unlikely reliable.
| Orbits | Bar size (kpc) | n | h | ( ) | Bulge type | ||||||
|---|---|---|---|---|---|---|---|---|---|---|---|
| and (comments) | |||||||||||
| DIR-PROPRO | 10.34 | 1.65 | 1.00 | 8.54 | 3.10 | 0.36 | 0.29 | 0.165 | 3.99 | Pseudo | |
| DIR-PRORET | 10.56 | 1.90 | 1.10 | 8.48 | 3.30 | 0.42 | 0.33 | 0.156 | 4.16 | Pseudo | |
| DIR-RETPRO | 4.0 | 10.30 | 1.10 | 0.67 | 8.95 | 2.70 | 0.24 | 0.34 | 0.048 | 5.47 | Pseudo (bar) |
| DIR-RETRET | 10.0 | 10.48 | 1.42 | 0.91 | 8.68 | 3.30 | 0.39 | 0.34 | 0.053 | 5.36 | Pseudo (bar, ring) |
| INC-PROPRO | 0.6 | 10.40 | 1.80 | 1.00 | 8.60 | 3.40 | 0.26 | 0.30 | 0.177 | 4.30 | Pseudo |
| INC-PRORET | 1.0 | 10.40 | 1.75 | 1.10 | 8.58 | 3.39 | 0.33 | 0.36 | 0.171 | 4.60 | Pseudo |
| INC-RETPRO | 2.0 | 10.81 | 2.48 | 1.20 | 8.70 | 3.10 | 0.25 | 0.29 | 0.172 | 4.58 | Classical |
| INC-RETRET | 2.8 | 10.40 | 1.30 | 0.43 | 9.11 | 1.85 | 0.14 | 0.31 | 0.174 | 4.76 | Pseudo (bar, ring) |
| POLAR-PROPRO | 0.4 | 10.50 | 1.90 | 1.08 | 8.56 | 3.50 | 0.31 | 0.31 | 0.167 | 4.57 | Pseudo |
| POLAR-PRORET | 0.9 | 10.42 | 1.75 | 1.00 | 8.80 | 2.70 | 0.29 | 0.33 | 0.157 | 4.95 | Pseudo |
| POLAR-RETPRO | 1.1 | 10.55 | 1.40 | 0.45 | 9.09 | 1.90 | 0.18 | 0.30 | 0.143 | 4.90 | Pseudo |
| POLAR-RETRET | 10.52 | 1.90 | 1.27 | 8.45 | 4.00 | 0.39 | 0.35 | 0.174 | 5.05 | Pseudo | |
| 2 millions of particles | |||||||||||
| DIR-PROPRO | 10.34 | 1.65 | 1.03 | 8.49 | 3.16 | 0.40 | 0.33 | 0.146 | 3.82 | Pseudo | |
| DIR-PRORET | 2.0 | 10.50 | 1.80 | 1.15 | 8.47 | 3.40 | 0.45 | 0.36 | 0.126 | 4.16 | Pseudo |
| DIR-RETPRO | 4.3 | 10.40 | 1.35 | 0.65 | 8.91 | 2.80 | 0.20 | 0.31 | 0.080 | 5.28 | Pseudo (bar) |
| DIR-RETRET | 4.0 | 10.37 | 1.30 | 0.60 | 8.98 | 2.60 | 0.17 | 0.31 | 0.072 | 5.15 | Pseudo (bar, ring) |
| INC-PROPRO | 1.7 | 10.72 | 2.00 | 0.89 | 8.55 | 3.60 | 0.29 | 0.31 | 0.156 | 4.33 | Classical |
| INC-PRORET | 0.6 | 10.54 | 1.90 | 1.05 | 8.53 | 3.60 | 0.32 | 0.39 | 0.160 | 4.48 | Pseudo |
| INC-RETPRO | 1.7 | 10.90 | 2.50 | 1.22 | 8.60 | 3.50 | 0.29 | 0.29 | 0.153 | 4.55 | Classical |
| INC-RETRET | 2.6 | 10.32 | 1.30 | 0.52 | 9.05 | 2.00 | 0.17 | 0.31 | 0.151 | 4.60 | Pseudo |
| POLAR-PROPRO | 0.7 | 10.52 | 1.90 | 1.05 | 8.52 | 3.52 | 0.32 | 0.33 | 0.154 | 4.31 | Pseudo |
| POLAR-PRORET | 1.6 | 10.56 | 2.00 | 1.30 | 8.49 | 3.60 | 0.41 | 0.39 | 0.142 | 4.62 | Classical |
| POLAR-RETPRO | 2.5 | 10.56 | 1.57 | 0.55 | 8.95 | 2.50 | 0.16 | 0.32 | 0.148 | 4.95 | Pseudo (bar) |
| POLAR-RETRET | 10.46 | 1.66 | 0.87 | 8.84 | 2.60 | 0.28 | 0.42 | 0.147 | 4.90 | Pseudo | |
| fgas : 0.10 - 0.07 | |||||||||||
| DIR-PROPRO | 1.4 | 10.60 | 1.55 | 0.92 | 8.60 | 3.50 | 0.42 | 0.37 | 0.023 | 5.13 | Pseudo (S0) |
| DIR-PRORET | 1.4 | 11.00 | 2.00 | 1.00 | 8.44 | 4.10 | 0.49 | 0.39 | 0.026 | 5.21 | Classical (large thick disk) |
| DIR-RETPRO | 1.5 | 10.84 | 1.90 | 1.00 | 8.46 | 4.90 | 0.36 | 0.52 | 0.034 | 5.75 | Pseudo (large thick disk) |
| DIR-RETRET | 1.0 | 11.05 | 2.20 | 1.14 | 8.30 | 5.60 | 0.42 | 0.57 | 0.021 | 5.64 | Classical |
| INC-PROPRO | 1.8 | 10.61 | 1.53 | 0.90 | 8.53 | 4.30 | 0.37 | 0.43 | 0.030 | 5.53 | Pseudo (large thick disk) |
| INC-PRORET | 1.2 | 10.57 | 1.46 | 0.85 | 8.58 | 4.10 | 0.34 | 0.46 | 0.033 | 5.60 | Pseudo |
| INC-RETPRO | 1.2 | 10.85 | 1.90 | 0.96 | 8.53 | 4.50 | 0.34 | 0.48 | 0.026 | 5.63 | Pseudo (large thick disk) |
| INC-RETRET | 0.3 | 10.97 | 2.06 | 1.02 | 8.47 | 4.70 | 0.38 | 0.49 | 0.026 | 5.63 | Classical (large thick disk) |
| POLAR-PROPRO | 1.5 | 10.70 | 1.65 | 0.90 | 8.49 | 4.60 | 0.35 | 0.45 | 0.025 | 5.49 | Pseudo (large thick disk) |
| POLAR-PRORET | 1.0 | 11.47 | 2.80 | 1.35 | 8.23 | 5.90 | 0.47 | 0.49 | 0.027 | 5.53 | Classical (large thick disk) |
| POLAR-RETPRO | 1.8 | 11.63 | 2.90 | 1.19 | 8.35 | 5.30 | 0.43 | 0.49 | 0.034 | 5.66 | Classical (large thick disk) |
| POLAR-RETRET | 1.2 | 11.92 | 3.25 | 1.30 | 8.20 | 6.00 | 0.49 | 0.51 | 0.018 | 5.54 | Classical (large thick disk) |
| Orbits | Bar size (kpc) | n | h | ( ) | Bulge type | ||||||
|---|---|---|---|---|---|---|---|---|---|---|---|
| and (comments) | |||||||||||
| fgas : 0.36 - 0.26 | |||||||||||
| DIR-PROPRO | 1.7 | 10.59 | 1.57 | 0.80 | 8.69 | 3.00 | 0.36 | 0.37 | 0.101 | 4.79 | Pseudo (S0) |
| DIR-PRORET | 10.55 | 1.60 | 0.94 | 8.64 | 3.10 | 0.42 | 0.40 | 0.088 | 4.90 | Pseudo | |
| DIR-RETPRO | 1.3 | 10.50 | 1.40 | 0.77 | 8.65 | 3.85 | 0.28 | 0.44 | 0.085 | 5.57 | Pseudo |
| DIR-RETRET | 0.7 | 10.88 | 1.90 | 0.87 | 8.60 | 4.00 | 0.33 | 0.45 | 0.071 | 5.62 | Pseudo |
| INC-PROPRO | 1.7 | 10.92 | 1.95 | 0.85 | 8.54 | 3.80 | 0.37 | 0.38 | 0.108 | 5.14 | Pseudo |
| INC-PRORET | 1.7 | 10.43 | 1.40 | 0.87 | 8.65 | 3.50 | 0.34 | 0.36 | 0.171 | 4.60 | Pseudo |
| INC-RETPRO | 1.1 | 10.84 | 2.00 | 1.00 | 8.55 | 3.90 | 0.36 | 0.44 | 0.091 | 5.18 | Classical |
| INC-RETRET | 10.80 | 1.80 | 0.87 | 8.55 | 3.90 | 0.37 | 0.45 | 0.099 | 5.28 | Pseudo (thick disk) | |
| POLAR-PROPRO | 1.3 | 10.70 | 1.75 | 0.93 | 8.50 | 4.00 | 0.38 | 0.41 | 0.099 | 5.14 | Pseudo (S0) |
| POLAR-PRORET | 2.5 | 10.50 | 1.50 | 0.94 | 8.61 | 3.50 | 0.39 | 0.46 | 0.091 | 5.41 | Pseudo (bar) |
| POLAR-RETPRO | 1.1 | 10.61 | 1.55 | 0.81 | 8.67 | 3.50 | 0.33 | 0.47 | 0.104 | 5.45 | Pseudo |
| POLAR-RETRET | 0.9 | 10.47 | 1.39 | 0.84 | 8.70 | 3.10 | 0.38 | 0.50 | 0.091 | 5.36 | Pseudo (thick disk) |
| fgas : 0.92 - 0.72 | |||||||||||
| DIR-PROPRO | 2.3 | 9.90 | 1.32 | 1.13 | 8.34 | 3.50 | 0.38 | 0.31 | 0.197 | 3.35 | Pseudo (bar) |
| DIR-PRORET | 5.0 | 10.10 | 1.40 | 1.10 | 8.40 | 3.20 | 0.46 | 0.38 | 0.161 | 3.54 | Pseudo (bar) |
| DIR-RETPRO | 8.2 | 10.15 | 1.17 | 0.85 | 8.80 | 3.50 | 0.22 | 0.29 | 0.047 | 5.19 | Pseudo (bar, ring) |
| DIR-RETRET | 4.3 | 10.10 | 1.10 | 0.80 | 9.00 | 2.50 | 0.23 | 0.32 | 0.068 | 5.35 | Pseudo (bar) |
| INC-PROPRO | 3.5 | 9.47 | 1.00 | 1.08 | 8.38 | 3.80 | 0.22 | 0.22 | 0.232 | 3.69 | Pseudo (bar) |
| INC-PRORET | 1.3 | 9.45 | 1.00 | 1.29 | 8.55 | 3.30 | 0.26 | 0.33 | 0.218 | 3.99 | Pseudo |
| INC-RETPRO | 4.0 | 9.45 | 1.05 | 1.36 | 8.50 | 3.65 | 0.24 | 0.24 | 0.225 | 4.04 | Pseudo (bar, ring) |
| INC-RETRET | 3.1 | 9.50 | 1.20 | 1.45 | 8.44 | 4.10 | 0.22 | 0.23 | 0.217 | 4.19 | Pseudo (bar, ring) |
| POLAR-PROPRO | 3.9 | 9.64 | 1.20 | 1.42 | 8.44 | 3.50 | 0.34 | 0.29 | 0.201 | 3.90 | Pseudo (bar, ring) |
| POLAR-PRORET | 1.9 | 9.68 | 1.10 | 1.23 | 8.52 | 3.90 | 0.25 | 0.33 | 0.199 | 4.36 | Pseudo |
| POLAR-RETPRO | 4.0 | 9.74 | 1.30 | 1.35 | 8.50 | 3.80 | 0.27 | 0.26 | 0.199 | 4.67 | Pseudo (bar, ring) |
| POLAR-RETRET | 3.2 | 9.62 | 1.00 | 1.45 | 8.42 | 3.80 | 0.40 | 0.38 | 0.194 | 4.58 | Pseudo (S0, bar) |
| Mass progenitors : 0.5M | |||||||||||
| DIR-RETPRO | 7.0 | 10.31 | 1.40 | 0.86 | 8.38 | 3.00 | 0.49 | 0.60 | 0.016 | 2.60 | Pseudo (bar, ring) |
| INC-PROPRO | 9.70 | 1.40 | 1.15 | 8.25 | 3.30 | 0.32 | 0.37 | 0.241 | 2.22 | Pseudo | |
| POLAR-PRORET | 0.4 | 9.62 | 1.30 | 1.27 | 8.33 | 3.10 | 0.35 | 0.42 | 0.202 | 2.38 | Pseudo |
| Mass progenitors : 0.5M-2millions | |||||||||||
| DIR-RETPRO | 4.3 | 9.67 | 1.50 | 1.28 | 8.37 | 3.20 | 0.27 | 0.31 | 0.061 | 2.36 | Pseudo (bar, ring) |
| INC-PROPRO | 4.3 | 9.65 | 1.40 | 1.30 | 8.15 | 3.60 | 0.37 | 0.37 | 0.224 | 2.21 | Pseudo (bar) |
| POLAR-PRORET | 3.2 | 9.57 | 1.20 | 1.20 | 8.32 | 3.15 | 0.34 | 0.39 | 0.216 | 2.38 | Pseudo (bar) |
| Mass progenitors : 2M | |||||||||||
| DIR-RETPRO | 0.3 | 10.60 | 1.55 | 1.05 | 8.90 | 3.80 | 0.29 | 0.35 | 0.091 | 10.3 | Pseudo |
| INC-PROPRO | 1.9 | 10.40 | 1.30 | 1.00 | 8.77 | 4.00 | 0.31 | 0.36 | 0.106 | 8.63 | Pseudo |
| POLAR-PRORET | 0.4 | 10.85 | 2.10 | 1.60 | 8.56 | 4.80 | 0.45 | 0.42 | 0.099 | 9.42 | Classical (disk ring) |
| Orbits | Bar size (kpc) | n | h | ( ) | Bulge type | ||||||
|---|---|---|---|---|---|---|---|---|---|---|---|
| and (comments) | |||||||||||
| Mass ratio : 1.5:1 | |||||||||||
| DIR-RETPRO | 0.3 | 10.25 | 1.15 | 1.00 | 8.98 | 2.25 | 0.44 | 0.79 | 0.034 | 5.87 | Pseudo |
| INC-PROPRO | 10.73 | 2.00 | 1.05 | 8.77 | 2.80 | 0.36 | 0.42 | 0.137 | 5.19 | Classical | |
| POLAR-PRORET | 10.30 | 1.40 | 1.12 | 8.73 | 3.00 | 0.42 | 0.56 | 0.136 | 5.85 | Pseudo (S0) | |
| Mass ratio : 4.5:1 | |||||||||||
| DIR-RETPRO | 8.0 | 10.45 | 1.50 | 0.85 | 8.44 | 4.41 | 0.31 | 0.38 | 0.164 | 5.08 | Pseudo (bar, ring) |
| INC-PROPRO | 1.8 | 10.62 | 2.03 | 1.00 | 8.40 | 4.10 | 0.29 | 0.30 | 0.192 | 4.07 | Classical (bar) |
| POLAR-PRORET | 10.70 | 2.20 | 1.22 | 8.53 | 3.55 | 0.35 | 0.33 | 0.170 | 4.48 | Classical | |
| Gas extension : 9 kpc | |||||||||||
| DIR-RETPRO | 3.9 | 10.46 | 1.50 | 0.89 | 8.61 | 4.50 | 0.24 | 0.34 | 0.086 | 5.77 | Pseudo (bar, ring) |
| INC-PROPRO | 1.8 | 10.52 | 1.80 | 1.00 | 8.59 | 3.60 | 0.30 | 0.31 | 0.150 | 4.83 | Pseudo |
| POLAR-PRORET | 1.7 | 11.14 | 2.75 | 1.66 | 8.26 | 4.70 | 0.50 | 0.39 | 0.152 | 5.23 | Classical |
| Gas extension : 21 kpc | |||||||||||
| DIR-RETPRO | 10.7 | 10.57 | 1.55 | 1.00 | 8.49 | 3.80 | 0.47 | 0.55 | 0.038 | 5.15 | Pseudo (bar) |
| INC-PROPRO | 2.4 | 10.35 | 1.70 | 0.95 | 8.56 | 3.35 | 0.28 | 0.32 | 0.177 | 4.07 | Pseudo |
| POLAR-PRORET | 3.0 | 10.38 | 1.90 | 1.55 | 8.30 | 4.50 | 0.44 | 0.36 | 0.161 | 4.82 | Pseudo |
| Pericenter : 8 kpc | |||||||||||
| DIR-RETPRO | 10.5 | 10.57 | 1.60 | 1.02 | 8.51 | 3.90 | 0.43 | 0.50 | 0.098 | 5.61 | Pseudo (bar, ring) |
| INC-PROPRO | 1.7 | 10.18 | 1.70 | 1.32 | 8.45 | 4.00 | 0.32 | 0.29 | 0.171 | 4.51 | Pseudo |
| POLAR-PRORET | 3.4 | 11.20 | 2.80 | 1.30 | 8.65 | 3.50 | 0.31 | 0.31 | 0.152 | 5.16 | Classical |
| Pericenter : 24 kpc | |||||||||||
| DIR-RETPRO | 5.0 | 10.40 | 1.35 | 0.90 | 8.62 | 4.00 | 0.32 | 0.38 | 0.066 | 5.44 | Pseudo (bar, disk ring) |
| INC-PROPRO | 2.2 | 10.11 | 1.48 | 1.20 | 8.45 | 4.00 | 0.33 | 0.33 | 0.170 | 4.43 | Pseudo |
| POLAR-PRORET | 1.7 | 10.55 | 2.00 | 1.35 | 8.36 | 4.50 | 0.39 | 0.40 | 0.164 | 4.79 | Classical |
| Softening : 150 pc | |||||||||||
| DIR-RETPRO | 4.1 | 10.20 | 1.60 | 1.30 | 8.46 | 4.50 | 0.31 | 0.34 | 0.165 | 5.54 | Pseudo (bar, ring) |
| INC-PROPRO | 2.4 | 10.20 | 1.69 | 1.21 | 8.41 | 3.70 | 0.35 | 0.35 | 0.209 | 3.96 | Pseudo (bar) |
| POLAR-PRORET | 10.00 | 1.40 | 1.20 | 8.58 | 3.23 | 0.34 | 0.40 | 0.191 | 4.63 | Pseudo | |
| Feedback : median | |||||||||||
| DIR-RETPRO | 3.2 | 10.68 | 1.70 | 0.98 | 8.38 | 4.50 | 0.43 | 0.48 | 0.106 | 5.15 | Pseudo (bar, ring) |
| INC-PROPRO | 1.2 | 10.80 | 2.20 | 1.00 | 8.60 | 3.70 | 0.26 | 0.31 | 0.126 | 4.50 | Classical |
| POLAR-PRORET | 11.15 | 2.15 | 0.90 | 8.55 | 3.50 | 0.47 | 0.49 | 0.096 | 5.15 | Classical (S0) | |
| Feedback : 2.5*median | |||||||||||
| DIR-RETPRO | 3.2 | 10.48 | 1.54 | 0.85 | 8.60 | 3.50 | 0.32 | 0.35 | 0.114 | 5.08 | Pseudo (bar, ring) |
| INC-PROPRO | 10.70 | 2.15 | 1.05 | 8.51 | 4.10 | 0.25 | 0.31 | 0.154 | 4.46 | Classical | |
| POLAR-PRORET | 10.60 | 1.90 | 1.20 | 8.47 | 4.10 | 0.39 | 0.42 | 0.133 | 5.18 | Pseudo |
| Orbits | Bar size (kpc) | n | h | ( ) | Bulge type | ||||||
|---|---|---|---|---|---|---|---|---|---|---|---|
| and (comments) | |||||||||||
| Time evol : DIR-PROPRO | |||||||||||
| 0.8 Gyr | 10.93 | 2.50 | 1.04 | 8.58 | 2.90 | 0.32 | 0.32 | 0.251 | 4.02 | Classical | |
| 2.2 Gyr | 10.78 | 2.10 | 0.91 | 8.55 | 3.1 | 0.35 | 0.32 | 0.211 | 4.00 | Classical | |
| 3.5 Gyr | 10.60 | 2.00 | 0.98 | 8.55 | 3.10 | 0.33 | 0.33 | 0.186 | 3.99 | Classical | |
| 4.9 Gyr | 10.34 | 1.70 | 1.00 | 8.54 | 3.10 | 0.34 | 0.33 | 0.173 | 3.99 | Pseudo | |
| 6.3 Gyr | 10.34 | 1.65 | 1.00 | 8.54 | 3.10 | 0.36 | 0.29 | 0.165 | 3.99 | Pseudo | |
| 7.7 Gyr | 10.34 | 1.65 | 1.00 | 8.55 | 3.10 | 0.36 | 0.34 | 0.159 | 3.98 | Pseudo | |
| 9.0 Gyr | 10.34 | 1.65 | 1.00 | 8.54 | 3.10 | 0.36 | 0.34 | 0.156 | 3.98 | Pseudo | |
| Time evol : DIR-PRORET | |||||||||||
| 0.8 Gyr | 1.7 | 10.80 | 2.30 | 1.12 | 8.47 | 3.30 | 0.38 | 0.35 | 0.257 | 4.23 | Classical |
| 2.2 Gyr | 1.7 | 10.80 | 2.10 | 1.00 | 8.47 | 3.30 | 0.42 | 0.36 | 0.209 | 4.21 | Classical |
| 3.5 Gyr | 10.72 | 2.00 | 1.00 | 8.47 | 3.30 | 0.42 | 0.36 | 0.181 | 4.17 | Classical | |
| 4.9 Gyr | 10.63 | 1.90 | 1.00 | 8.47 | 3.30 | 0.42 | 0.36 | 0.165 | 4.17 | Pseudo | |
| 6.3 Gyr | 10.56 | 1.90 | 1.10 | 8.48 | 3.30 | 0.42 | 0.33 | 0.156 | 4.16 | Pseudo | |
| 7.7 Gyr | 10.62 | 1.90 | 1.05 | 8.47 | 3.30 | 0.44 | 0.37 | 0.149 | 4.15 | Pseudo | |
| 9.0 Gyr | 10.62 | 1.90 | 1.05 | 8.47 | 3.30 | 0.44 | 0.38 | 0.146 | 4.15 | Pseudo | |
| Time evol : DIR-RETPRO | |||||||||||
| 0.8 Gyr | 2.8 | 10.20 | 1.00 | 0.47 | 9.04 | 2.40 | 0.08 | 0.26 | 0.205 | 5.44 | Pseudo (bar) |
| 2.2 Gyr | 4.7 | 10.24 | 1.10 | 0.60 | 8.96 | 2.60 | 0.19 | 0.32 | 0.125 | 5.46 | Pseudo (bar) |
| 3.5 Gyr | 4.5 | 10.24 | 1.10 | 0.65 | 8.96 | 2.60 | 0.22 | 0.32 | 0.087 | 5.47 | Pseudo (bar) |
| 4.9 Gyr | 4.1 | 10.25 | 1.05 | 0.66 | 8.96 | 2.60 | 0.24 | 0.34 | 0.062 | 5.47 | Pseudo (bar) |
| 6.3 Gyr | 4.0 | 10.30 | 1.10 | 0.67 | 8.95 | 2.70 | 0.24 | 0.34 | 0.048 | 5.47 | Pseudo (bar) |
| 7.7 Gyr | 4.0 | 10.26 | 1.10 | 0.70 | 8.95 | 2.70 | 0.24 | 0.35 | 0.040 | 5.47 | Pseudo (bar) |
| 9.0 Gyr | 3.7 | 10.24 | 1.05 | 0.70 | 8.96 | 2.70 | 0.25 | 0.35 | 0.034 | 5.46 | Pseudo (bar) |
| Time evol : DIR-RETRET | |||||||||||
| 0.8 Gyr | 1.4 | 10.05 | 1.05 | 0.42 | 9.15 | 2.00 | 0.08 | 0.27 | 0.208 | 5.49 | Pseudo (bar) |
| 2.2 Gyr | 3.7 | 10.15 | 1.05 | 0.49 | 9.15 | 2.10 | 0.12 | 0.31 | 0.119 | 5.47 | Pseudo (bar) |
| 3.5 Gyr | 5.5 | 10.38 | 1.35 | 0.74 | 8.94 | 2.60 | 0.25 | 0.40 | 0.086 | 5.45 | Pseudo (bar) |
| 4.9 Gyr | 8.3 | 10.45 | 1.45 | 0.97 | 8.64 | 3.60 | 0.37 | 0.50 | 0.065 | 5.40 | Pseudo (bar) |
| 6.3 Gyr | 10.0 | 10.48 | 1.42 | 0.91 | 8.68 | 3.30 | 0.39 | 0.55 | 0.053 | 5.36 | Pseudo (bar) |
| 7.7 Gyr | 10.0 | 10.48 | 1.48 | 1.02 | 8.59 | 3.60 | 0.43 | 0.60 | 0.045 | 5.35 | Pseudo (bar) |
| 9.0 Gyr | 9.5 | 10.49 | 1.45 | 0.99 | 8.60 | 3.60 | 0.43 | 0.61 | 0.039 | 5.35 | Pseudo (bar) |
| Orbits | Bar size (kpc) | n | h | ( ) | Bulge type | ||||||
|---|---|---|---|---|---|---|---|---|---|---|---|
| and (comments) | |||||||||||
| Time evol : INC-PROPRO | |||||||||||
| 0.8 Gyr | 1.7 | 11.82 | 3.40 | 1.00 | 8.54 | 3.40 | 0.31 | 0.29 | 0.275 | 4.27 | Classical |
| 2.2 Gyr | 0.9 | 10.87 | 2.52 | 1.18 | 8.55 | 3.40 | 0.29 | 0.30 | 0.235 | 4.32 | Classical |
| 3.5 Gyr | 0.8 | 10.50 | 2.00 | 1.10 | 8.55 | 3.40 | 0.29 | 0.30 | 0.205 | 4.30 | Classical |
| 4.9 Gyr | 0.8 | 10.70 | 2.20 | 1.05 | 8.57 | 3.40 | 0.28 | 0.30 | 0.189 | 4.30 | Classical |
| 6.3 Gyr | 0.6 | 10.40 | 1.80 | 1.00 | 8.60 | 3.40 | 0.26 | 0.30 | 0.177 | 4.30 | Pseudo |
| 7.7 Gyr | 0.6 | 10.28 | 1.65 | 1.00 | 8.58 | 3.40 | 0.27 | 0.31 | 0.168 | 4.29 | Pseudo |
| 9.0 Gyr | 0.6 | 10.27 | 1.65 | 1.00 | 8.59 | 3.40 | 0.26 | 0.31 | 0.161 | 4.29 | Pseudo |
| Time evol : INC-PRORET | |||||||||||
| 0.8 Gyr | 2.7 | 10.70 | 2.33 | 1.23 | 8.54 | 3.35 | 0.31 | 0.41 | 0.302 | 4.51 | Classical |
| 2.2 Gyr | 1.7 | 10.50 | 2.00 | 1.20 | 8.52 | 3.40 | 0.35 | 0.41 | 0.241 | 4.58 | Pseudo |
| 3.5 Gyr | 1.8 | 10.35 | 1.80 | 1.22 | 8.54 | 3.40 | 0.35 | 0.41 | 0.205 | 4.58 | Pseudo |
| 4.9 Gyr | 1.5 | 10.42 | 1.80 | 1.10 | 8.59 | 3.34 | 0.32 | 0.40 | 0.189 | 4.62 | Pseudo |
| 6.3 Gyr | 1.0 | 10.40 | 1.75 | 1.10 | 8.58 | 3.39 | 0.33 | 0.36 | 0.171 | 4.60 | Pseudo |
| 7.7 Gyr | 1.3 | 10.45 | 1.80 | 1.10 | 8.55 | 3.50 | 0.34 | 0.40 | 0.158 | 4.59 | Pseudo |
| 9.0 Gyr | 1.5 | 10.45 | 1.80 | 1.10 | 8.55 | 3.50 | 0.34 | 0.40 | 0.149 | 4.58 | Pseudo |
| Time evol : INC-RETPRO | |||||||||||
| 0.8 Gyr | 1.7 | 10.70 | 2.35 | 1.02 | 8.66 | 3.10 | 0.21 | 0.30 | 0.278 | 4.58 | Classical |
| 2.2 Gyr | 1.7 | 10.54 | 2.05 | 0.98 | 8.68 | 3.10 | 0.22 | 0.29 | 0.239 | 4.64 | Classical |
| 3.5 Gyr | 1.7 | 10.55 | 2.10 | 1.05 | 8.70 | 3.10 | 0.23 | 0.29 | 0.208 | 4.62 | Classical |
| 4.9 Gyr | 2.5 | 10.60 | 2.10 | 1.00 | 8.70 | 3.10 | 0.23 | 0.30 | 0.188 | 4.60 | Classical |
| 6.3 Gyr | 2.3 | 10.81 | 2.48 | 1.20 | 8.70 | 3.10 | 0.25 | 0.29 | 0.172 | 4.58 | Classical |
| 7.7 Gyr | 2.0 | 10.69 | 2.35 | 1.20 | 8.70 | 3.10 | 0.25 | 0.29 | 0.165 | 4.59 | Classical |
| 9.0 Gyr | 2.4 | 10.55 | 2.10 | 1.10 | 8.70 | 3.10 | 0.25 | 0.29 | 0.157 | 4.59 | Classical |
| Time evol : INC-RETRET | |||||||||||
| 0.8 Gyr | 1.2 | 10.45 | 1.17 | 0.30 | 9.11 | 1.65 | 0.13 | 0.31 | 0.285 | 4.68 | Pseudo |
| 2.2 Gyr | 1.6 | 10.40 | 1.30 | 0.40 | 9.11 | 1.85 | 0.13 | 0.30 | 0.234 | 4.72 | Pseudo |
| 3.5 Gyr | 1.7 | 10.20 | 1.20 | 0.45 | 9.11 | 1.75 | 0.14 | 0.29 | 0.216 | 4.79 | Pseudo |
| 4.9 Gyr | 2.0 | 10.05 | 1.00 | 0.45 | 9.14 | 1.70 | 0.14 | 0.29 | 0.191 | 4.77 | Pseudo |
| 6.3 Gyr | 2.8 | 10.40 | 1.30 | 0.43 | 9.11 | 1.85 | 0.14 | 0.31 | 0.174 | 4.76 | Pseudo |
| 7.7 Gyr | 3.0 | 10.05 | 1.00 | 0.47 | 9.14 | 1.70 | 0.14 | 0.30 | 0.167 | 4.77 | Pseudo |
| 9.0 Gyr | 3.2 | 10.20 | 1.20 | 0.52 | 9.10 | 1.85 | 0.16 | 0.31 | 0.156 | 4.75 | Pseudo |
| Orbits | Bar size (kpc) | n | h | ( ) | Bulge type | ||||||
|---|---|---|---|---|---|---|---|---|---|---|---|
| and (comments) | |||||||||||
| Time evol : POL-PROPRO | |||||||||||
| 0.8 Gyr | 1.4 | 10.46 | 1.95 | 1.05 | 8.56 | 3.40 | 0.27 | 0.32 | 0.262 | 4.56 | Pseudo |
| 2.2 Gyr | 1.1 | 10.35 | 1.80 | 1.07 | 8.60 | 3.20 | 0.29 | 0.32 | 0.220 | 4.58 | Pseudo |
| 3.5 Gyr | 0.9 | 10.28 | 1.70 | 1.09 | 8.55 | 3.50 | 0.29 | 0.32 | 0.194 | 4.57 | Pseudo |
| 4.9 Gyr | 10.33 | 1.72 | 1.06 | 8.60 | 3.30 | 0.30 | 0.31 | 0.181 | 4.58 | Pseudo | |
| 6.3 Gyr | 10.50 | 1.90 | 1.08 | 8.56 | 3.50 | 0.31 | 0.31 | 0.167 | 4.57 | Pseudo | |
| 7.7 Gyr | 10.14 | 1.50 | 1.08 | 8.58 | 3.50 | 0.28 | 0.32 | 0.158 | 4.55 | Pseudo | |
| 9.0 Gyr | 10.00 | 1.35 | 1.06 | 8.58 | 3.55 | 0.26 | 0.32 | 0.149 | 4.54 | Pseudo | |
| Time evol : POL-PRORET | |||||||||||
| 0.8 Gyr | 0.8 | 10.44 | 1.85 | 0.99 | 8.77 | 2.70 | 0.27 | 0.37 | 0.253 | 4.96 | Pseudo |
| 2.2 Gyr | 0.8 | 10.50 | 1.85 | 0.99 | 8.78 | 2.70 | 0.29 | 0.37 | 0.206 | 4.95 | Pseudo |
| 3.5 Gyr | 0.7 | 10.45 | 1.75 | 1.00 | 8.75 | 2.85 | 0.31 | 0.37 | 0.180 | 4.95 | Pseudo |
| 4.9 Gyr | 0.7 | 10.45 | 1.75 | 0.95 | 8.80 | 2.75 | 0.27 | 0.36 | 0.168 | 4.95 | Pseudo |
| 6.3 Gyr | 0.9 | 10.42 | 1.75 | 1.00 | 8.80 | 2.70 | 0.29 | 0.33 | 0.157 | 4.95 | Pseudo |
| 7.7 Gyr | 0.6 | 10.40 | 1.70 | 1.02 | 8.69 | 3.10 | 0.30 | 0.37 | 0.147 | 4.93 | Pseudo |
| 9.0 Gyr | 0.0 | 10.30 | 1.60 | 1.00 | 8.77 | 2.80 | 0.29 | 0.37 | 0.138 | 4.91 | Pseudo |
| Time evol : POL-RETPRO | |||||||||||
| 0.8 Gyr | 3.0 | 12.22 | 2.50 | 0.28 | 8.93 | 2.20 | 0.15 | 0.33 | 0.298 | 4.87 | Classical |
| 2.2 Gyr | 1.7 | 10.85 | 1.90 | 0.52 | 8.99 | 2.20 | 0.17 | 0.33 | 0.227 | 4.99 | Pseudo |
| 3.5 Gyr | 1.2 | 10.93 | 1.90 | 0.50 | 9.09 | 1.95 | 0.19 | 0.31 | 0.191 | 4.99 | Pseudo |
| 4.9 Gyr | 0.7 | 11.10 | 1.95 | 0.47 | 9.07 | 1.95 | 0.23 | 0.31 | 0.160 | 4.94 | Pseudo |
| 6.3 Gyr | 1.1 | 10.55 | 1.40 | 0.45 | 9.09 | 1.90 | 0.18 | 0.30 | 0.143 | 4.90 | Pseudo |
| 7.7 Gyr | 2.1 | 10.50 | 1.50 | 0.52 | 9.10 | 1.95 | 0.17 | 0.32 | 0.139 | 4.91 | Pseudo |
| 9.0 Gyr | 2.9 | 10.55 | 1.50 | 0.50 | 9.09 | 1.95 | 0.17 | 0.33 | 0.136 | 4.92 | Pseudo |
| Time evol : POL-RETRET | |||||||||||
| 0.8 Gyr | 1.8 | 10.50 | 1.95 | 1.42 | 8.24 | 4.90 | 0.44 | 0.48 | 0.212 | 4.40 | Pseudo |
| 2.2 Gyr | 1.1 | 10.73 | 2.15 | 1.22 | 8.51 | 3.60 | 0.39 | 0.46 | 0.242 | 5.05 | Classical |
| 3.5 Gyr | 10.50 | 1.90 | 1.30 | 8.42 | 4.00 | 0.41 | 0.44 | 0.207 | 5.04 | Pseudo | |
| 4.9 Gyr | 10.40 | 1.75 | 1.26 | 8.43 | 4.10 | 0.39 | 0.43 | 0.180 | 5.01 | Pseudo | |
| 6.3 Gyr | 10.52 | 1.90 | 1.27 | 8.45 | 4.00 | 0.39 | 0.35 | 0.174 | 5.05 | Pseudo | |
| 7.7 Gyr | 10.35 | 1.65 | 1.25 | 8.43 | 4.10 | 0.40 | 0.43 | 0.165 | 5.05 | Pseudo | |
| 9.0 Gyr | 10.20 | 1.52 | 1.27 | 8.44 | 4.20 | 0.37 | 0.43 | 0.153 | 5.03 | Pseudo | |
| Mass ratio 1:1 - : 0.2%-0.2% | |||||||||||
| INC-PROPRO | 2.0 | 13.00 | 5.47 | 6.50 | 0.00 | 0.00 | 1.00 | 0.68 | 0.0004 | 7.51 | Classical |
| (elliptical) | |||||||||||
| Mass ratio 3:1 - : 0.2%-0.6% | |||||||||||
| INC-PROPRO | 1.7 | 11.60 | 2.80 | 1.10 | 8.55 | 4.10 | 0.43 | 0.89 | 0.0006 | 5.57 | Classical |
| (large thick disk) |
| Orbits | Bar size (kpc) | n | h | ( ) | Bulge type | ||||||
|---|---|---|---|---|---|---|---|---|---|---|---|
| and (comments) | |||||||||||
| fgas : 0.36 - 0.26 - 2.14 Gyr | |||||||||||
| after the first passage | |||||||||||
| DIR-PROPRO | 1.8 | 10.60 | 1.54 | 0.80 | 8.66 | 3.00 | 0.40 | 0.36 | 0.112 | 4.79 | Pseudo |
| DIR-PRORET | 1.5 | 10.80 | 1.82 | 0.86 | 8.65 | 3.10 | 0.40 | 0.40 | 0.107 | 4.91 | Pseudo |
| DIR-RETPRO | 1.5 | 10.35 | 1.30 | 0.83 | 8.60 | 4.00 | 0.29 | 0.43 | 0.130 | 5.65 | Pseudo |
| DIR-RETRET | 1.7 | 11.30 | 2.20 | 0.71 | 8.60 | 4.00 | 0.32 | 0.45 | 0.127 | 5.12 | Classical |
| INC-PROPRO | 2.7 | 10.75 | 1.80 | 0.85 | 8.54 | 3.90 | 0.33 | 0.38 | 0.106 | 5.15 | Pseudo |
| INC-PRORET | 2.0 | 10.57 | 1.50 | 0.80 | 8.65 | 3.50 | 0.33 | 0.44 | 0.099 | 5.28 | Pseudo |
| INC-RETPRO | 1.5 | 11.05 | 2.20 | 0.95 | 8.55 | 3.90 | 0.36 | 0.45 | 0.112 | 5.11 | Classical |
| INC-RETRET | 1.7 | 11.20 | 2.25 | 0.85 | 8.54 | 3.90 | 0.37 | 0.44 | 0.091 | 5.41 | Classical |
| POLAR-PROPRO | 2.3 | 11.15 | 2.20 | 0.89 | 8.48 | 4.00 | 0.41 | 0.41 | 0.132 | 5.42 | Classical (S0) |
| POLAR-PRORET | 2.9 | 10.95 | 1.95 | 0.88 | 8.60 | 3.51 | 0.41 | 0.45 | 0.113 | 5.33 | Pseudo |
| POLAR-RETPRO | 1.9 | 11.23 | 2.10 | 0.70 | 8.64 | 3.50 | 0.36 | 0.48 | 0.123 | 5.64 | Classical |
| POLAR-RETRET | 1.0 | 10.58 | 1.50 | 0.80 | 8.70 | 3.20 | 0.35 | 0.52 | 0.123 | 5.25 | Pseudo |