Progenitors of low-luminosity Type II-Plateau supernovae
Abstract
The progenitors of low-luminosity Type II-Plateau supernovae (SNe II-P) are believed to be red supergiant (RSG) stars, but there is much disparity in the literature concerning their mass at core collapse and therefore on the main sequence. Here, we model the SN radiation arising from the low-energy explosion of RSG stars of 12, 25, and 27 M⊙ on the main sequence and formed through single star evolution. Despite the narrow range in ejecta kinetic energy (2.54.21050 erg) in our model set, the SN observables from our three models are significantly distinct, reflecting the differences in progenitor structure (e.g., surface radius, H-rich envelope mass, He-core mass). Our higher mass RSG stars give rise to Type II SNe that tend to have bluer colors at early times, a shorter photospheric phase, and a faster declining -band light curve (LC) more typical of Type II-linear SNe, in conflict with the LC plateau observed for low-luminosity SNe II. The complete fallback of the CO core in the low-energy explosions of our high mass RSG stars prevents the ejection of any 56Ni (nor any core O or Si), in contrast to low-luminosity SNe II-P, which eject at least 0.001 M⊙ of 56Ni. In contrast to observations, type II SN models from higher mass RSGs tend to show an H absorption that remains broad at late times (due to a larger velocity at the base of the H-rich envelope). In agreement with the analyses of pre-explosion photometry, we conclude that low-luminosity SNe II-P likely arise from low-mass rather than high-mass RSG stars.
keywords:
supernovae: general — supernovae: individual: 1994N, 1997D, 1999br, 1999eu, 1999gn, 2001dc, 2002gd, 2003Z, 2004eg, 2005cs, 2006ov, 2008bk, 2008in, 2009N, 2009md, 2010id, 2013am, 1999em1 Introduction
Type II supernovae (SNe) are thought to arise from stars with an initial mass between 8 and 30 M⊙, that end their lives in the red-supergiant (RSG) stage with the collapse of their degenerate core (Woosley & Weaver, 1995; Heger et al., 2003; Limongi & Chieffi, 2003; Eldridge & Tout, 2004; Hirschi et al., 2004). Historically, Type II SNe have been divided into Type II-Plateau (II-P) and Type II-Linear (II-L) based on their light curve (LC) morphology (Barbon et al., 1979). More recent surveys that collected tens to hundreds of SNe II find a continuous distribution of decline rates in -band LCs, which suggests that the division between II-P and II-L is somewhat artificial (Anderson et al., 2014b; Sanders et al., 2015). RSG progenitors that kept a sufficient amount of hydrogen in the envelope yield a Type II SN with an optical-brightness plateau for 3–4 months and prominent H i lines in their spectra. The plateau duration is controlled by the mass of the H-rich envelope and the surface radius, as well as the explosion energy and the 56Ni mass (e.g., Grassberg et al., 1971; Falk & Arnett, 1977; Litvinova & Nadezhin, 1983; Swartz et al., 1991; Popov, 1993). Type II SNe that show a fast declining -band LC likely arise from RSG progenitors that have a lower H-rich envelope mass (Bartunov & Blinnikov 1992, Moriya et al. 2016; but see Nakar et al. 2016).
The class of Type II-P SNe is rather homogeneous in terms of plateau duration and spectral features, but the plateau luminosity may vary over a wide range. Indeed, over the last 20 years a number of faint Type II SNe have been observed. Spectroscopic and photometric observations for most of these objects have been presented and analyzed in Pastorello et al. (2004) and Spiro et al. (2014). These works emphasize the distinctive features of low-luminosity Type II SNe:
-
1.
a low expansion rate (approximately in the range from 1300 to 2500 km s-1 at 50 days after explosion);
-
2.
a small amount of 56Ni produced in the explosion ( to M⊙, which is 1–2 orders of magnitude less than in standard Type II SNe);
-
3.
a low luminosity (pseudo-bolometric luminosity ranges from to erg s-1);
-
4.
a low ejecta kinetic energy ( to erg; Pumo et al. 2017).
While Type II-P SNe represent about 50–60% of all core-collapse SNe (Smith et al., 2011; Graur et al., 2017), the rate of low-luminosity Type II-P SNe is currently estimated to be only 5% of all Type II SNe (Pastorello et al., 2004).
Two distinct mass ranges have been studied for the RSG progenitors of low-luminosity Type II-P SNe, corresponding to low-moderate mass massive stars in a domain close to the lower-mass limit for core collapse (Chugai & Utrobin 2000, Pignata 2013; Lisakov et al. 2017, hereafter L17; Pumo et al. 2017), or to more massive stars in a domain closer to the limit where the progenitor dies as a Wolf-Rayet instead of a RSG star (Turatto et al., 1998; Zampieri et al., 2003). The progenitors of low-luminosity SNe II-P have, however, been constrained from pre-explosion images. The progenitor of SN 2005cs has been identified as a RSG of spectral type K3–M4 with a main-sequence mass of 9–10 M⊙ (Maund et al., 2005; Li et al., 2006). For SN 2008bk, the main-sequence mass of the RSG progenitor is estimated to be 8–13 M⊙ (Van Dyk et al., 2012; Maund et al., 2014). For SN 2009md, the main-sequence mass of the RSG progenitor is estimated to be M⊙ (Fraser et al., 2011), though Maund et al. (2015) suggest that the disappearance of the progenitor cannot be confirmed. The alternative of a high progenitor mass is thus somewhat in tension with estimates from pre-explosion images.
In our previous work (L17), we performed a detailed study of the low-luminosity SN 2008bk. Guided by the inferred progenitor mass of 8–13 M⊙, based on pre-explosion photometry, we explored a variety of progenitor massive stars dying with a final mass of about 10 M⊙. In our set of seven models, the model (named X) that most closely matches the observations is characterized at the time of collapse by a total mass of 9.88 M⊙, log, and a surface radius of 502 R⊙. The model ejecta kinetic energy is erg, the ejecta mass is 8.29 M⊙, and the 56Ni mass is 0.009 M⊙. This model yields a fair match to the multi-band light curves and spectra of SN 2008bk, although it is somewhat too luminous and energetic.
In the present study, we consider all low-luminosity SNe II-P that we could identify in the literature. We model both low and high mass RSG star progenitors in order to test whether, from the SN radiation alone, one can find evidence for the progenitor mass. In practice, we compute low-energy explosions in high mass progenitors stemming from a main sequence star of 25 and 27 M⊙. As discussed below, we find that the properties of the SN radiation resulting from such massive progenitors have numerous points of tension with observations, in contrast to its low mass counterpart (a model for a 12 M⊙ progenitor).
The paper is organized as follows. In Section 2, we study the photometric and spectral properties of our sample of low-luminosity Type II SNe and compare them to those of a standard SN II. The observational data sources for this analysis are presented in Appendix A. In Section 3, we present our modeling approach and initial conditions, for the progenitor evolution, the star explosion, and the evolution of the ejecta and radiation until late times. In Section 4 and Section 5, we discuss our model results for the multi-band light curves and spectra, respectively, and confront these results to observations. In Section 6, we compare our results to other works. Finally, we summarize our results in Section 7.
2 Analysis of the observational data
The analysis presented in this section summarizes the properties of low-luminosity SNe II-P.
The observations for these SNe have been presented in Pastorello et al. (2004) (1994N, 1999br, 1999eu, 2001dc); Spiro et al. (2014) (1999gn, 2002gd, 2003Z, 2004eg, 2006ov); Benetti et al. (2001) (1997D); Pastorello et al. (2006), Dessart et al. (2008) and Pastorello et al. (2009) (2005cs); Pignata (2013) (2008bk); Roy et al. (2011) (2008in); Takáts et al. (2014) (2009N); Fraser et al. (2011) (2009md); Gal-Yam et al. (2011) (2010id); and Zhang & Wang (2014) (2013am).
From the sample, we extract statistical properties that we later compare to our model results for multi-band light curves and spectra. We consider the scatter in their properties, and thus go beyond our previous study on a single event (SN 2008bk; L17). In Appendix A, we present the sources of the observational data (see also the information given in Tables 6 and 7). In some cases, we revise the distance, the reddening and/or the recession velocity published in the literature.
Although considered low-luminosity events, we exclude Type II-peculiar SNe like 1987A since these events stem from the explosion of more compact stars like a blue supergiant rather than a RSG — their low luminosity stems primarily from the reduced progenitor radius.
2.1 Photometric properties
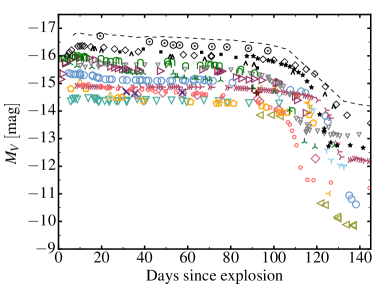
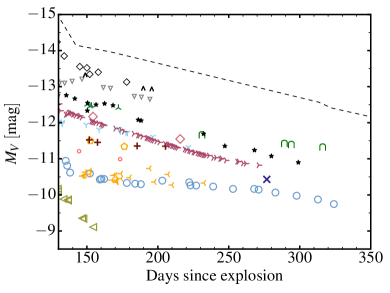
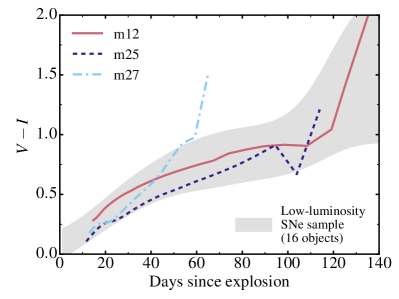
We present -band LCs for our sample in Fig. 1 (top row panels). All objects have a similar photometric evolution. The -band brightness appears as a plateau for the entire photospheric phase (i.e., before the sudden drop that starts the nebular phase). Our sample occupies the faint end of the SN II distribution. When combined with intermediate-luminosity events (e.g., SN 2011hg or 2003gd), there is no longer any luminosity/brightness gap between the faintest event (SN 1999br) and the standard SN II-P 1999em. Absolute -band magnitudes during the plateau phase lie between about and about mag (factor of in luminosity). A standard SN II-P has mag during the plateau phase (Table 1). The continuous distribution of SNe II-P -band brightness suggests that there is also a continuous distribution in progenitor and explosion properties rather than two separate classes.
In contrast to the scatter in plateau brightness, the plateau length is about 11010 d for the sample. The plateau ends with an abrupt brightness drop of 2.5–4.5 mag over 10–20 d and the SN enters the nebular stage. In the absence of external energy sources, the nebular-phase luminosity is powered by the radioactive decay of 56Co. While the standard Type II-P SN 1999em synthesized 0.04–0.06 M⊙ of 56Ni (Utrobin et al., 2007; Bersten et al., 2011), the least luminous SN at nebular times in our sample, SN 1999eu, synthesized only about 0.001 M⊙ (Spiro et al., 2014). Although all our SNe show systematically lower 56Ni masses than SN 1999em, they exhibit much scatter in nebular -band brightness, reflecting a sizeable scatter in 56Ni masses (this dispersion may partly stem from differences in bolometric correction or SN color).
Anderson et al. (2014b) studied the -band LCs for a sample of 116 Type II SNe. To provide some quantitative comparison with this work, we show the mean values and the standard deviation for the , , , and in Table 1. We adopt the same definition for these quantities (see their Fig. 1): is the magnitude at the initial peak, if observed, otherwise it corresponds to the first photometric point; is the band absolute magnitude measured 30 d before , where is the mid point of the transition from the plateau phase to the radioactive tail; is the band absolute magnitude 30 d after ; and is the decline rate in the band (given in magnitude per 100 days) during the plateau phase. Five SNe in our sample are also in the sample of Anderson et al. (2014b). The band decline rate is lower for our sample, indicating that low-luminosity SNe show a band ‘plateau’; none of these events are fast declining in the band during the photospheric phase.
| Low-luminosity SNe II-P | SNe II | |
| -band [mag] | -band [mag] | |
| -band [mag per 100 days] | -band [mag per 100 days] | |
| 0.25 (, 10 SNe) | 1.27 (, 113 SNe) |
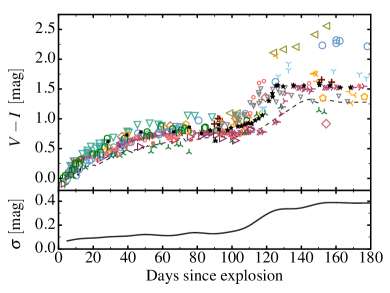
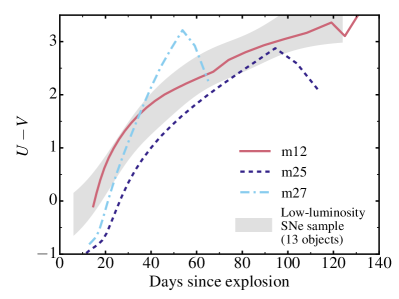
We present the color evolution for our set of SNe in the bottom-left panel of Fig. 1. The scatter is small during the photospheric phase and increases during the nebular phase. All the SNe from our sample evolve in a very similar way irrespective of the plateau brightness. At early times after explosion, the color continuously reddens until the SN enters the recombination phase, during which its optical color is roughly constant. At the end of the plateau phase, the ejecta become transparent and the value of rises rapidly, revealing also a large scatter. At nebular times, the flux is dominated by lines, whose wavelength distribution and relative strength control the color. If one includes moderate- and standard-luminosity SNe, such as 1992ba, 1999bg, 1999gi, 2001hg, 2002ca, 2003gd, 2005ay, or 2012ec, the dispersion in color is not affected.
In L17, we showed how the treatment and magnitude of 56Ni mixing has a strong impact on the nebular phase color. The observed scatter of data points suggests that the mixing process may differ amongst low-luminosity SNe II-P. In the bottom-right panel of Fig. 1 we compare the plateau and nebular phase luminosities. Although the scatter is significant, there is a strong correlation. It indirectly connects the explosion energy and the mass of ejected 56Ni. More energetic explosions tend to produce more 56Ni (Ugliano et al., 2012; Müller et al., 2017).
2.2 Spectral properties
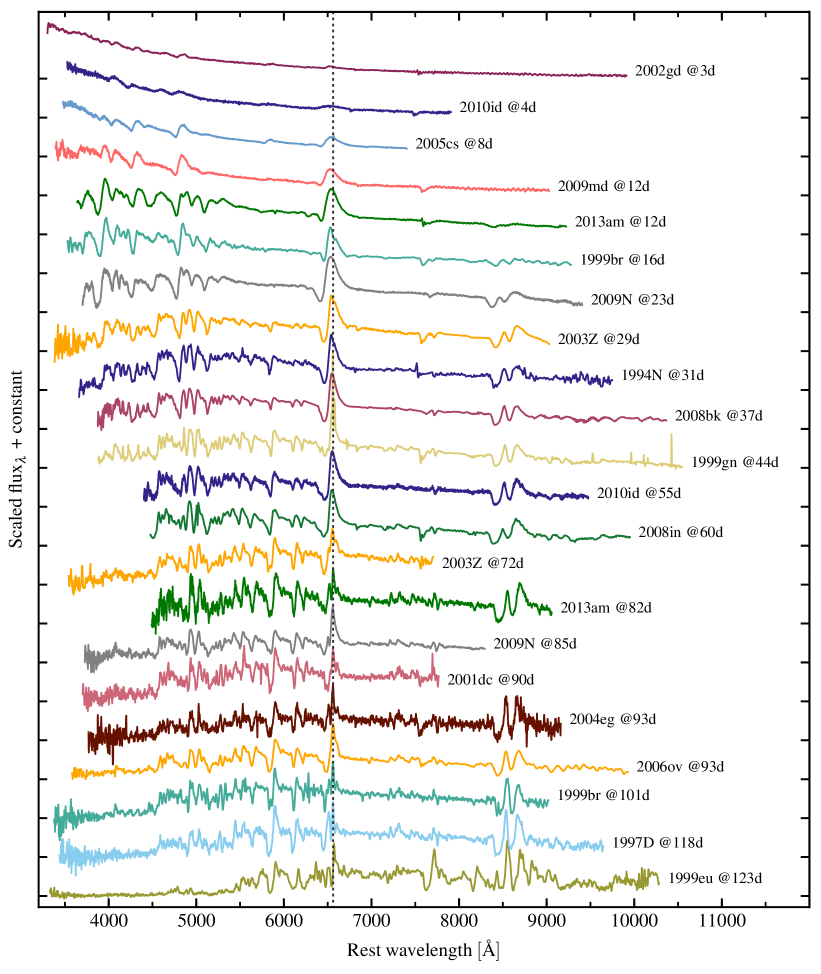
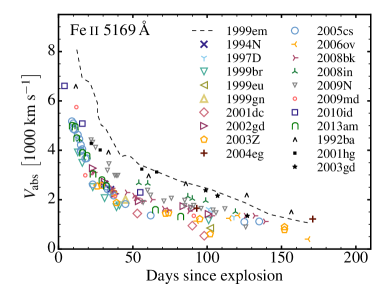
In Fig. 2, we show the spectral evolution for our set of SNe. All of them follow the same pattern and show very similar features in the spectra. Low-luminosity SNe II-P systematically exhibit much narrower lines than standard SNe II-P. Figure 3 shows that the Doppler velocity at maximum absorption in Fe ii 5169 Å is few tens of percent smaller than for standard SNe II-P, corresponding to a slower ejecta expansion rate. Consequently, their spectra suffer much less line overlap and individual lines are more easily identified.
Dessart & Hillier (2005) discussed the optical-depth effect at the origin of the blue-shifted emission peaks of P-Cygni profiles in SNe II (see also Anderson et al. 2014a for a discussion on alternative interpretations for the origin of this feature). This blue shift is observed in all Type II SN spectra irrespective of -band decline rate (Anderson et al., 2014a). In H, the peak blue shift is greatest at early times, decreases through the photospheric phase, and vanishes as the SN becomes nebular. The spectra for our sample of low-luminosity SNe show the same behavior.
The evolution of the spectral morphology of standard Type II-P SNe has been discussed numerous times, both from observational data and tailored models (see, e.g., Leonard et al. 2002; Dessart & Hillier 2011). This evolution is the same for low-luminosity SNe II-P. At very early times (5 days since explosion), the spectra have a color temperature greater than K, are very blue, and show weak lines of H i, He i– ii, and from neutral (and more rarely once ionized) species of C, N, or O. Metal lines (in particular Ti ii, Fe ii), which eventually cause line blanketing, start to develop as the photospheric layers recombine, which takes place after about two weeks. This is accompanied by the strengthening of the NIR Ca ii triplet at about 8500 Å, Na i D, lines of Sc ii and Ba ii. Many of these lines remain strong until the nebular phase, in part because they are tied to low lying levels which can be more easily excited (thermally or non-thermally).
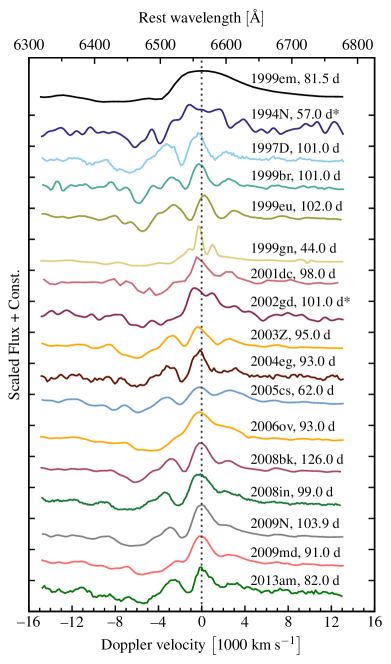
The H profile becomes structured at the end of the plateau phase in low-luminosity SNe II-P (Fig. 4; Pastorello et al. 2004; Roy et al. 2011; Spiro et al. 2014). Standard Type II SNe rarely show a complex H profile because their higher expansion rates cause a stronger Doppler broadening and line overlap. In L17, we computed a radiative-transfer model that suggests that Ba ii 6496.9 Å causes the structure seen in H in low-luminosity SNe II-P — overlap with Sc ii causes additional structure in the red part of H (See Fig. 9 in L17). Ejecta asymmetry may also contribute, but it does not appear essential.
2.3 Visual brightness versus expansion rate
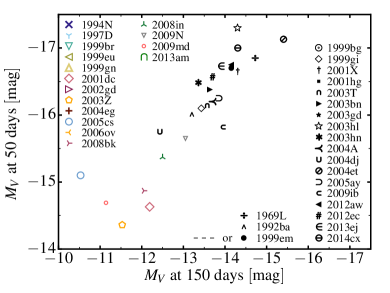
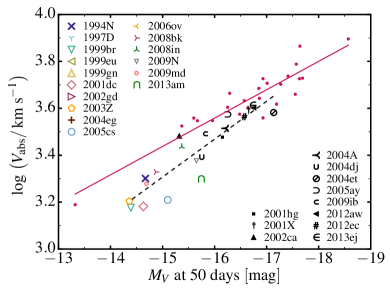
Observations indicate that intrinsically brighter Type II-P SNe have higher photospheric velocities half-way through the photospheric phase (Hamuy, 2003). Numerical simulations of RSG star explosions naturally predict such a correlation (Popov, 1993; Kasen & Woosley, 2009; Dessart et al., 2010b). Using the information from Fig. 3, we extend the sample of Hamuy (2003) and include our measurements for low-luminosity SNe II-P (Fig. 5).
The correlation identified by Hamuy (2003) extends to low-luminosity SNe II-P, although the slope is altered slightly and the scatter is significantly larger at the low brightness end. While uncertainties in distance might play a role, this scatter may reflect differences in progenitor/explosion properties. For example, for the same explosion energy and progenitor H-rich envelope mass, a larger radius would produce a brighter plateau and a lower expansion rate (Dessart et al., 2013).
3 Modelling
The numerical approach followed in this work is identical to the one presented in Dessart et al. (2013). It consists of simulations for the progenitor star from main sequence to core collapse with mesa (Paxton et al., 2011; Paxton et al., 2013, 2015), its subsequent explosion with the radiation-hydrodynamics code v1d (Livne, 1993; Dessart et al., 2010a, b), and the evolution until late times with the time-dependent radiative-transfer code cmfgen (Hillier & Miller, 1998; Dessart & Hillier, 2005, 2008; Hillier & Dessart, 2012; Dessart et al., 2013). We briefly review each step in the forthcoming sections.
By modeling the observed SN II-P LCs and spectra, we aim to constrain the ejecta and progenitor properties. Doppler-broadened spectral lines can be used to infer the expansion rate. The Type II SN plateau duration correlates with the progenitor radius and H-rich envelope mass, as well as the explosion energy (Arnett, 1980; Litvinova & Nadezhin, 1983, 1985; Popov, 1993; Young et al., 2004; Kasen & Woosley, 2009; Dessart et al., 2013). The SN color evolution correlates with the progenitor radius (Dessart et al., 2013). In this paper, we investigate how the different properties of low- and high-mass RSG stars impact the SN II-P observables. For example, the He-core mass increases with main sequence mass (Woosley et al., 2002). This then impacts the stellar luminosity, which affects both the envelope mass (through the effect of mass loss) and the envelope radius (through the constraint of radiative diffusion).
3.1 Pre-SN evolution with mesa
Using mesa, we evolve three massive star models with an initial mass of 12, 25 and 27 M⊙ (named m12, m25 and m27) from the main sequence until core collapse. We do not consider binary star evolution, which can alter the relation between the mass on the zero-age-main-sequence and the mass of the SN progenitor at the time of explosion. We use the same parameters as in L17. Model m12 is the same as model X from L17. For the new models m25 and m27, we use rather than 0.02. Models m12, m25 and m27 end their lives with final masses of 9.9, 15.6 and 12.8 M⊙, and surface radii of 502, 872 and 643 R⊙. A summary of model properties is given in Table 3. We adopt the same prescriptions for the convection, mass loss, core overshooting etc. in all models. While the processes controlling massive star evolution are not accurately known or described, the trends that emerge from our study should be robust. Our progenitor models are in good agreement with those of Woosley et al. (2002).
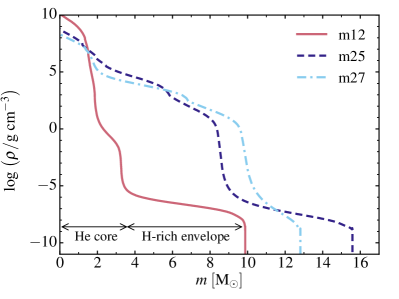
Figure 6 shows the density profile for the three models at the onset of core collapse. In this figure, the extended H-rich envelope corresponds to the region with , which is exterior to the He core (its outer edge coincides with the large density jump at the base of the H-rich envelope). We take the location where the H mass fraction suddenly drops from its surface value (the whole convective envelope is homogeneous) as the interface between the H-rich envelope and the He core. With this definition, the H-rich envelope mass is 6.6–7.0 M⊙ for the m12 and m25 models, but it is only 3 M⊙ in the m27 model due to the greater mass lost during the RSG phase. In single stars, the H-rich envelope mass depends on the adopted wind mass loss rate, which is uncertain, but the trend is robust. In particular, while models m12 and m25 have a similar H-rich envelope mass, they have a very different He core mass of about 3.3 and 8.6 M⊙. The core/envelope mass ratio in model m12 () is reversed in model m27 (). This reversal in core/envelope mass ratio is fundamental for understanding the difference in SN properties resulting from the explosion of low- and high-mass RSG stars.
| [km s-1] | [km s-1] | [km s-1] | |
|---|---|---|---|
| m12 | 1550 | 1800 | 800 |
| m25 | 1900 | 2200 | 1320 |
| m27 | 2200 | 3150 | 2200 |
3.2 Piston-driven explosion with v1d
At the onset of core collapse, the mesa models are exploded with the radiation hydrodynamics code v1d by moving a piston at 10,000 km s-1. The mass cut for the piston location is where the progenitor entropy rises outward from the centre to 4 baryon-1 (see, e.g., Ugliano et al. 2012). This location is at a lagrangian mass coordinate of 1.51, 1.93, and 1.78 M⊙ in models m12, m25, and m27.
To produce our models of low-luminosity SNe II-P, the piston is kept at 10000 km s-1 until the deposited energy exceeds the binding energy of the material above the piston by an amount , where is the ejecta kinetic energy at infinity. The binding energy of the material above the piston mass cut is 1.14, 7.47, and erg in models m12, m25, and m27, while we aim to produce an ejecta with erg (which is the inferred for the prototypical low-luminosity SN 2008bk; Pignata 2013; L17). This value of is therefore of the order or smaller than the binding energy above the piston. To prevent the hydrodynamical simulation from going on hold because of a Courant-time limitation, we set a minimum piston velocity of 100 km s-1 (rather than zero) in these simulations. This prevents the growth of a hot and dense shell with negative velocities above the inner boundary. We consider as fallback material any material moving slower than 150200 km s-1 at 106 s after the piston trigger. With this assumption, our weak explosions produce significant fallback material in the inner layers, much more than in standard SNe II-P where the ejecta kinetic energy exceeds the binding energy of the material to expel (see., e.g., Dessart et al. 2010a). In models m12, m25, and m27, the fallback mass (i.e., envelope material moving within a factor of 1.52 of the asymptotic piston velocity) is 0.08, 3.69, and 4.0 M⊙. In m12, this means that most of the Si-rich layer falls back, while in models m25 and m27, it is the entire CO core that falls back, leading to the formation of a 5–6 M⊙ black hole. In models with fallback, it is not straightforward to predict the kinetic energy of the ejected material. Here, our ejecta have a kinetic energy of 2.5, 4.2, and 4.21050 erg in models m12, m25, and m27. While about 0.009 M⊙ of 56Ni is expelled in model m12, the strong fallback in models m25 and m27 prevents any ejection of 56Ni. We have not tried to prevent this by additionally enhancing the mixing (we use the same mixing in models m12, m25, and m27; see L17 for details). Lacking a decay power source, the ejecta of models m25 and m27 produce a negligible luminosity at nebular times. Hence, most of our discussion will be focused on the photospheric phase, when the photosphere is located in the H-rich layers of the progenitor star.
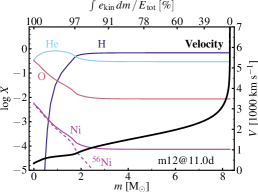
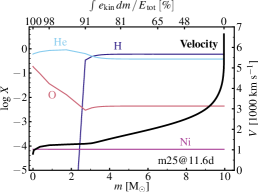
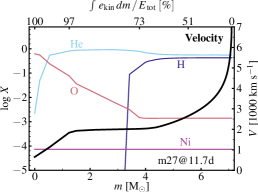
We show the composition profile for the ejecta for our models in mass and velocity space in Fig. 7. For model m12, about 50% of the total ejecta kinetic energy is contained in the outer 2 M⊙ of the ejecta, and only a few percent in the former He core (below 2000 km s-1). For models m25 and m27, the former He core contains 9% and 25% of the total ejecta kinetic energy, respectively. The mass-weighted mean velocity of the whole ejecta () and of the H-rich material () are given in Table 2, together with the velocity at the junction between H-poor/H-rich layers (corresponding to the former core/envelope transition; ). This value correlates with the minimum width of H in the Type II SN spectrum (Dessart et al., 2010b).
Because of variations in and/or and differences in the chemical/mass stratification, the and vary significantly between models. These variations will have a clear impact on the resulting SN observables, which are discussed in Sections 4 and 5. The value is, however, uncertain because it is not clear how much and how deep H will be mixed inwards. Wongwathanarat et al. (2015) have demonstrated that in a standard energy explosion of a 15 M⊙ progenitor, H may be mixed all the way to the innermost layers. No simulation has provided reliable constraints for H mixing in a low energy explosion of a higher mass star, in which the He core mass is much larger (and may exceed the H-rich envelope mass) and in which strong fallback occurs. We note that strong inward mixing of H is not guaranteed. Type IIb SNe are a notorious example since they show broad H typically for 1-2 weeks. H is absent in the nebular-phase spectra of SN 2011dh (Jerkstrand et al., 2015). H mixing is perhaps facilitated in progenitors with a small He core mass and a massive H-rich envelope, hence lower mass stars on the main sequence.
It is interesting to compare our model set to the simulations of Sukhbold et al. (2016), in particular those produced using a light bulb mimicking a neutrino-driven explosion, nicknamed P-HOTB. Model m12 properties correspond closely to the 912 M⊙ models of Sukhbold et al. (2016) exploded with the Z9.6 engine, which systematically yield low energy explosions, a low/moderate i mass, and a neutron star remnant. The 25 M⊙ progenitor models of Sukhbold et al. (2016) all explode with a 1051 erg ejecta kinetic energy with a large i mass, in contrast with our model m25. However, the model 27.3 of Sukhbold et al. (2016), exploded with P-HOTB using the W18 calibration yields an ejecta devoid of i, with a kinetic energy of erg, and leaves behind a black hole of 6.24 M⊙. These properties are similar to those of model m27. Hence, our models based on piston-driven explosions have counterparts in the more physically consistent explosion models of Sukhbold et al. (2016), although the latter depend significantly on the way the explosion engine is calibrated (engines N20 and W18 can yield drastically different outcomes for the same progenitor).
3.3 Radiative-transfer modeling with CMFGEN
At a post-explosion time of 11 d, the ejecta are close to being in homologous expansion. We then remap the v1d ejecta structure and composition into the non-Local-Thermodynamic-Equilibrium (nLTE) time-dependent radiative transfer code cmfgen and model the subsequent evolution of the gas and the radiation until nebular times. The code computes the gas and radiation properties by solving iteratively the statistical equilibrium equations, the gas-energy equation and the first two moments of the radiative transfer equation — time-dependent terms are accounted for in all equations. Our numerical setup (numerical grid, atomic data, model atoms) is identical to L17. We present the results of the radiative-transfer modeling in the next section.
SN 2008bk follows closely the average brightness, expansion rate, and color during the photospheric and nebular phases of our sample of low-luminosity SNe II-P (Figs. 1–3). SN 2008bk can therefore be used as a template for this class of events when confronting models to observations of low-luminosity SNe II-P.
| Model | H-rich | He-core | H | He | O | 56Ni | |||||||||
|---|---|---|---|---|---|---|---|---|---|---|---|---|---|---|---|
| [M⊙] | [M⊙] | [R⊙] | [K] | [L⊙] | [M⊙] | [M⊙] | [B] | [M⊙] | [M⊙] | [M⊙] | [M⊙] | [M⊙] | [M⊙] | [B] | |
| m12 | 12 | 9.9 | 502 | 3906 | 52733 | 6.6 | 3.3 | 0.11 | 8.29 | 1.59 | 4.54 | 3.24 | 0.22 | 8.57() | 0.25 |
| m25 | 25 | 15.6 | 872 | 4299 | 233050 | 7.0 | 8.6 | 0.75 | 9.98 | 5.62 | 4.34 | 5.17 | 0.13 | 0 | 0.42 |
| m27 | 27 | 12.8 | 643 | 5227 | 276761 | 3.0 | 9.8 | 0.52 | 7.02 | 5.78 | 1.37 | 4.72 | 0.4 | 0 | 0.42 |
| Model | [d] | [erg s-1] | [mag] | [mag] | [km s-1] | (H) [km s-1] | |||||
|---|---|---|---|---|---|---|---|---|---|---|---|
| (15d) | (50d) | (15d) | (50d) | (15d) | (50d) | (15d) | (50d) | (15d) | (50d) | ||
| m12 | 131 | 0.45(42) | 4.8(41) | –15.49 | –15.61 | –0.06 | 2.01 | 4833 | 2401 | 5290 | 3910 |
| m25 | 112 | 1.38(42) | 9.3(41) | –16.22 | –16.50 | –0.87 | 1.46 | 5065 | 3371 | 5724 | 4213 |
| m27 | 64 | 1.37(42) | 3.0(41) | –16.38 | –15.28 | –0.72 | 2.95 | 6251 | 2498 | 6706 | 6062 |
4 Bolometric and multi-band light curves
4.1 Results from simulations
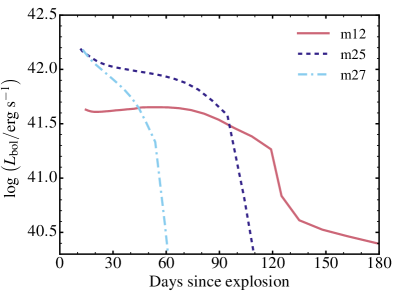
Figure 8 shows the cmfgen bolometric light curves for models m12, m25, and m27. In this order, the morphology of the bolometric light curve goes from a plateau to a fast declining one. The faster the decline rate, the greater the early-time luminosity, and also the earlier the transition to the nebular phase. These properties are a consequence of the progenitor structure. Here, the II-P/II-L morphology is largely a result of the high/low H-rich envelope mass in the progenitor (Bartunov & Blinnikov, 1992). The association of a faster-declining light curve with a higher brightness at early times and a shorter photospheric phase duration is a consequence of the greater in model m27 compared to model m12. This correlation is observed in the large sample of Type II SNe of Anderson et al. (2014b).
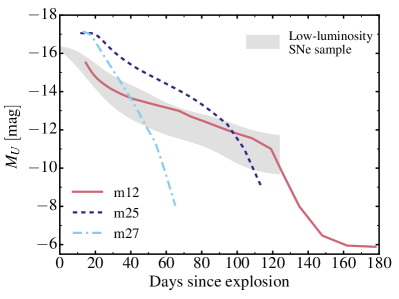
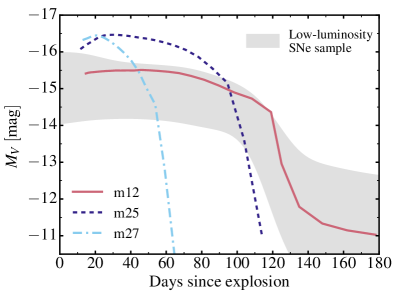
Figure 9 shows the evolution of the and band absolute magnitudes as well as the and colors for the models m12, m25, and m27. The morphology of the bolometric light curve discussed above is partly reflected by these curves but not exactly because of the different color evolution. The larger radius in models m25 and m27 (870 and 640 R⊙) cause bluer optical colors than in model m12 (500 R⊙). However, the higher cause a faster drop of the brightness in all optical bands for the two higher mass models. The effect is exacerbated in model m27 because of the low H-rich envelope mass in the progenitor. This produces a faster declining -band light curve in higher mass models (they start bluer but fade faster bolometrically). In model m25, the rise time to the brighter -band maximum is longer than in model m12 because of the bigger radius, as obtained by Dessart & Hillier (2011) and Dessart et al. (2013).
The -band LC for model m12 shows a long plateau of 120 d, which corresponds closely to the duration of the photospheric phase (i.e., when the ejecta electron-scattering optical depth is greater than ). For higher mass models, the LC first rises to a maximum at 20 d and then declines rapidly without showing a plateau. The duration of the photospheric phase for models m12, m25 and m27 is 131, 112, and 64 d. In the presence of 56Ni, the photospheric phase in models m25 and m27 would have been longer, although physically, the strong fallback in such ejecta likely inhibits the escape of 56Ni. The stark contrast between models at nebular times is thus a reflection of the difference in 56Ni mass between m12 (0.009 M⊙) and m25/m27 (zero).
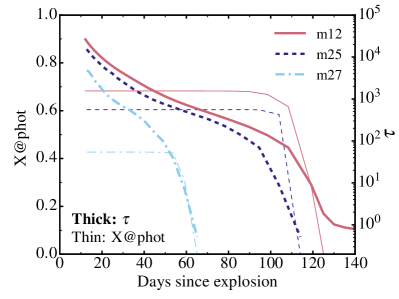
Figure 10 illustrates how the total ejecta electron-scattering optical-depth and the H mass fraction at the photosphere evolve with time. The photosphere remains in the H-rich layers until drops to a few tens, after which it decreases faster. In homologous ejecta, evolves as if the ionization is fixed. When the material recombines (at early times and also at the end of the plateau), drops much faster (see also Dessart & Hillier 2011). In model m12, follows a steady evolution at nebular times because the ionization changes little (we are in a steady state and the luminosity follows the 56Co decay rate). In models m25 and m27, the absence of 56Ni in the ejecta makes (or the ionization) and the luminosity plummet.
4.2 Comparison to observations
In Fig. 9, the shaded area in each panel contains the scatter of data points for the observed SNe II-P. Model m12 fits best the observed distribution, while model m25 gives a poor match, and model m27 does not fit the observations at all. The disagreement comes from the distinct properties of the m25/m27 models.
While all observed low-luminosity SNe II-P exhibit a 120-d long plateau in their -band light curve, this property is best matched by model m12 (Fig. 1). Model m25 shows roughly a -band plateau (but shorter). Model m27 has an even shorter high-brightness phase and a more pronounced declining -band light curve (model m27 shows a 0.7 mag drop in -band magnitude between 20 and 40 d after explosion, which is similar to the 0.6 mag drop that is observed in the Type II-L SN 1979C; de Vaucouleurs et al. 1981). The lack of fast decliners in the observed low-luminosity SNe II-P suggests that the progenitors have massive and dense H-rich envelopes, which excludes a high mass progenitor like m27.
At nebular times, the 56Ni-deficient models m25m27 do not match any low-luminosity SN II-P, which eject at least 0.001 M⊙ of 56Ni (Pastorello et al., 2004; Spiro et al., 2014). Mixing in 1-D piston-driven explosions is a parameter so it could be additionally enhanced in our high mass models to attempt to eject a small amount of 56Ni. However, this would be highly contrived. In model m12, the low production of 56Ni is a natural consequence of the weak SN shock and the progenitor density structure (i.e., little mass at high density). A low 56Ni mass production in a low-mass RSG is therefore expected (Kitaura et al., 2006; Ugliano et al., 2012; Sukhbold et al., 2016). Although not compelling evidence, the absence of low-luminosity SNe II-P that eject no 56Ni is suggestive that a low-mass progenitor is more suited for these events.
At early times, the high mass models m25 and m27 also exhibit bluer colors than the observed sample of low-luminosity SNe II-P. The effect is more striking when comparing blue and red filters in the optical, e.g., rather than , because the peak of the spectral energy distribution is around 6000 Å. The bluer colors of high mass progenitors stem primarily from their larger progenitor radius, which arises from their larger He-core luminosity. Although the early-time brightness can be reduced by lowering the explosion energy (or by reducing the progenitor mass loss to produce a more massive H-rich envelope), high-mass models will tend to be bluer and decline faster than both the lower-mass counterparts and the observations.
5 Spectra
5.1 Results from simulations
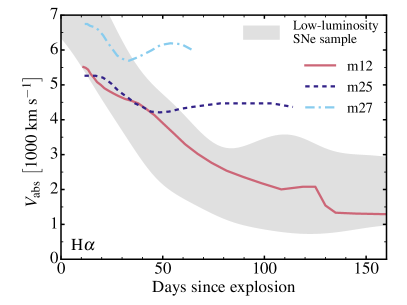
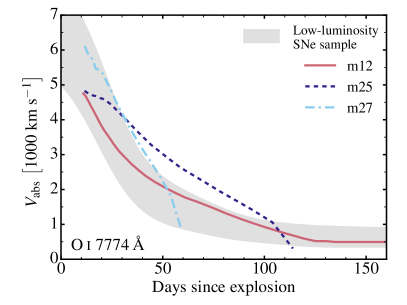
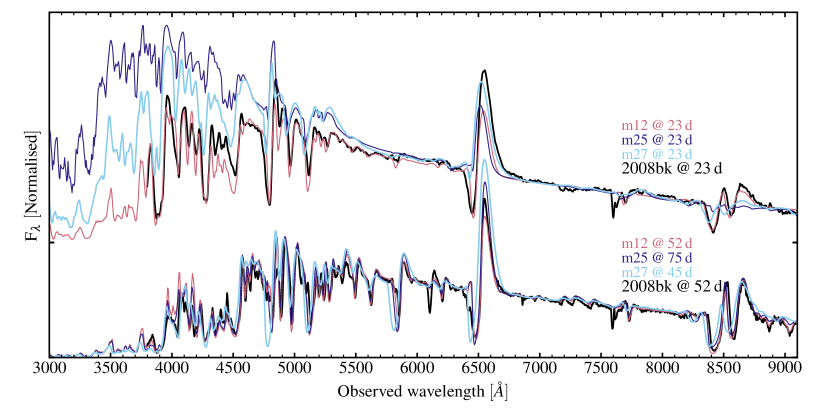
Figure 11 shows a spectral comparison for models m12, m25, and m27 at 23 d after explosion and when mag (which corresponds to post-explosion times of about d after explosion).
At early times, the color difference discussed above is reflected in the different spectral energy distribution. As we step from model m12, m27, to m25, the optical spectrum is bluer, shows weaker signs of line blanketing, and has broader lines. This directly reflects the trend in progenitor radius, which impacts the cooling from expansion. The spectral signatures are broader (with more line overlap) in model m27, something that arises from the similar amongst models but the much lower H-rich envelope progenitor mass in model m27. In model m12, the H and H line widths and strengths are somewhat underestimated, while the width and strength of Ca ii, Na i, Sc ii, or Fe ii lines are well matched. One possible origin for the mismatch of the Balmer lines is an inadequate treatment of the outermost layers of the progenitor. In model X we impose a very steep surface scale height of 0.01 that results in a steep drop in the ejecta density at 5500 km s-1. A more extended progenitor atmosphere would have produced a more gradual and continuous decrease in density at large velocities, perhaps resolving this conflict. The complexity of RSG atmospheres compromises an adequate description of these layers in our pre-explosion model. However, the fair agreement for all lines suggests the ejecta kinetic energy is adequate (L17).
At later times during the photospheric phase (when mag), the spectral properties are very similar between our three models. The difference is primarily from the width of the lines, which is somewhat greater in models m25 and m27 because of the greater relative to model m12. The broader lines in model m27 cause greater line overlap, in particular in the blue part of the optical where line blanketing is strongest in Type II SNe. The effect is present in H, but also in metal lines like O i 7774 Å (Fig. 12; the Doppler velocity at maximum absorption in this line matches closely the photospheric velocity during the high-brightness phase; L17). The comparison at this late epoch should be considered with caution. Models m25 and m27 have an ejecta optical depth of about 200, but this is about 1000 for model m12. Combined with the higher velocities, this implies lower photospheric densities in the higher mass models.
Overall, the synthetic spectra for our three models m12, m25, and m27, are very similar when compared at the same color. When considered with respect to the time of explosion, the offset between spectra is much greater because of the impact of differences in progenitor radius, mean expansion rate etc., which strongly affect the photometric (brightness and color) evolution.
The evolution of the H line width can be used to distinguish the models. Because of the different H-rich envelope to He-core mass ratio in the models m12, m25, and m27, the velocity at the base of the H-rich envelope is very different (despite the similar ejecta kinetic energy; Table 2; see also Dessart et al. 2010b). Although mixing was applied to all models, the big He-core in models m25 and m27 prevents much mixing of H deep inside the He core. As a result, the H line remains broad at late times. This is in contrast to the m12 model in which most lines progressively narrow as time progresses.
5.2 Comparison to observations and spectral line identifications
In L17, we demonstrated that model m12 (named model X in L17) gave a good match to the spectral evolution of SN 2008bk, which is a prototype for the sample of low-luminosity SNe II-P. The distinct spectral evolution of models m25 and m27 relative to model m12 implies that these high mass models fail to match the spectral evolution of SN 2008bk, and by extension that of the whole sample of low-luminosity SNe II-P (see Fig. 2). The mismatch at early times is tied to the different color evolution (which impacts the spectral index and ionization; Fig. 11). The evolution of the Doppler velocity at maximum absorption in H also shows a late plateau at a high value of 4000–6000 km s-1 in models m25 and m27, while the observations show a reduction of this Doppler velocity to very low values of 1000 km s-1, as obtained in model m12 (Fig. 12). Hence, we find that high mass models show numerous photometric and spectroscopic discrepancies with respect to observed low-luminosity SNe II-P, while the low mass model m12 fares better.
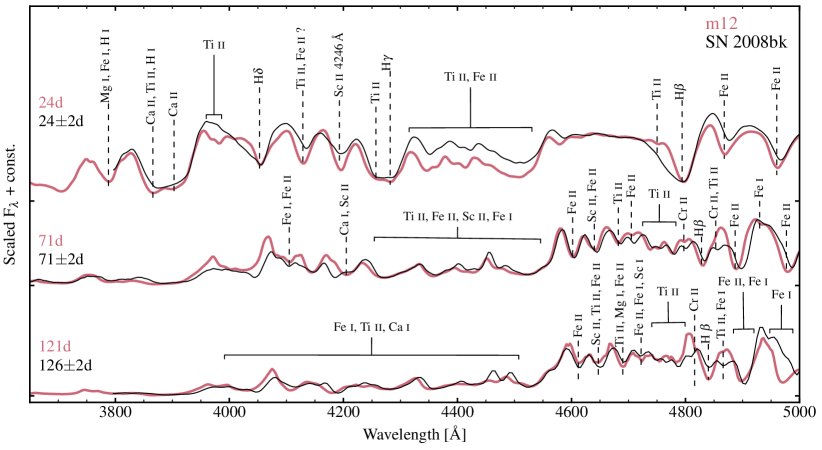
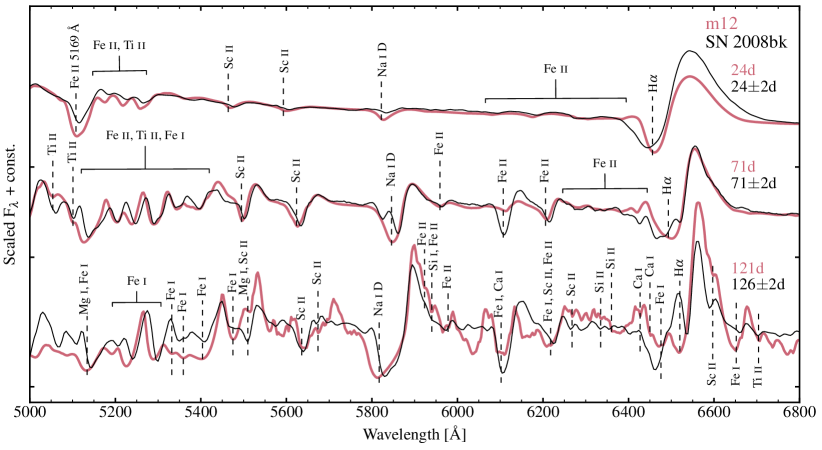
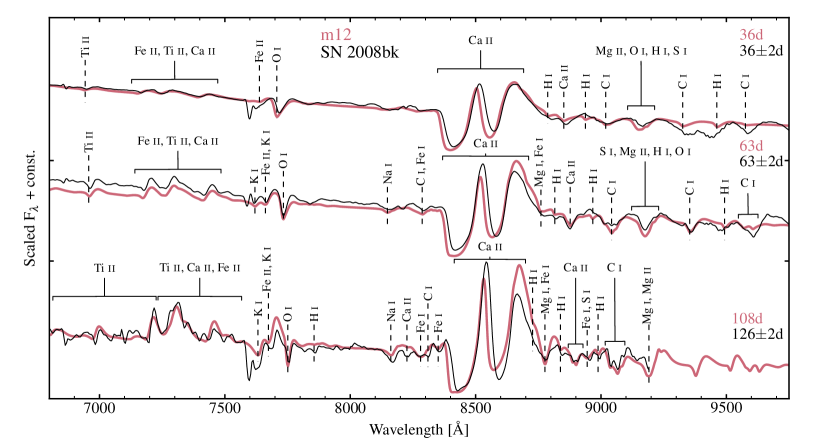
The lower expansion rate of low-luminosity SN II-P ejecta reduces the amount of line overlap and facilitates line identifications. In the remainder of this section, we discuss in more detail the spectral lines seen in our model m12 and the high quality observations of SN 2008bk.
Figures 13, 14 and 15 show a spectral comparison for model m12 and SN 2008bk in three consecutive spectral ranges spanning the optical from 3500 to 9750 Å, and covering the early photospheric phase, the plateau phase, and the beginning of the nebular phase. Lines that we could identify are labelled in these figures. We find that all lines observed are predicted by model m12, with just a few exceptions. First, as reported in L17, some features in the red part of the optical in SN 2008bk are absent in model m12 — this may be an instrumental artifact or an improper correction for atmospheric absorption. As discussed in L17, our simulations do not have Ba ii by default. Ba is an s-process element and is not treated in mesa. In L17, assuming a solar abundance for Ba, we were able to explain a few lines blueward of H as stemming from Ba ii (most notably 6141.7 and 6496.9 Å). A striking feature not predicted by model m12 is the double-dip in Na i D. This double dip fits within the Na i D P-Cygni trough in model m12. It may be caused by Ba ii 5853.7 Å, although our model with Ba ii in L17 predicts that line to be quite weak. This feature requires further study.
6 Comparison to other work
| SN | (56Ni) | Reference | |||||
| [M⊙] | [M⊙] | [M⊙] | [R⊙] | [M⊙] | [ erg] | ||
| 1997D | 102 | — | 61 | 8560 | 0.002 | 1.00.3 | Chugai & Utrobin 2000 |
| — | 26 | 24 | 300 | 0.00250.0015 | 4.0 | Turatto et al. 1998 | |
| — | — | 17 | 130 | 0.008 | 9.0 | Zampieri et al. 2003 | |
| 1999br | — | — | 14 | 108 | 0.002 | 6.0 | Zampieri et al. 2003 |
| 2003Z | 14.15 | 12.950.35 | 11.3 | 260 | 0.0050.003 | 1.6 | Pumo et al. 2017 |
| 15.9 | — | 141.2 | 22939 | 0.00630.0006 | 2.450.18 | Utrobin et al. 2007 | |
| 2005cs | — | — | 10.52.5 | 100 | 0.003 | 3.0 | Pastorello et al. 2009 |
| 18.21 | 17.31 | — | 600140 | 0.00820.0016 | 4.10.3 | Utrobin & Chugai 2008 | |
| 2008bk | 12 | 9.88 | 8.29 | 502 | 0.0086 | 2.5 | L17 |
| 12.15 | 11.650.35 | 10.0 | 503 | 0.0070.001 | 1.8 | Pumo et al. 2017 | |
| 2008in | 20 | — | 164 | — | 0.0250.01 | 8.62.5 | Gurugubelli et al. 2011 |
| — | 16.7 | 126 | 0.015 | 5.4 | Roy et al. 2011 | ||
| — | 15.52.2 | 13.61.9 | 570100 | 0.0150.005 | 5.053.4 | Utrobin & Chugai 2013 | |
| 2009N | — | 13.250.25 | 11.5 | 287 | 0.020.004 | 4.8 | Takáts et al. 2014 |
| 2009md | 12.15 | 11.650.35 | 10.0 | 287 | 0.0040.001 | 1.7 | Pumo et al. 2017 |
| — | 8.5 | — | 500 | 0.00540.003 | — | Fraser et al. 2011 |
Our results for the -band magnitude and the photospheric velocity at 50 d after explosion in model m12 (–15.61 mag, 2401 km s-1) are in rough agreement with those of Kasen & Woosley (2009) for their model M15_E0.3_Z1 of comparable ejecta energy and mass (–15.96 mag and 3125 km s-1). The plateau duration of 120 d in model m12 is, however, unmatched by any of the low energy models in Kasen & Woosley (2009), which are all longer than 150 d. This likely arises from the large 56Ni mass in their simulations, which exceeds 0.1 M⊙ in all cases. The 56Ni mass distribution of their model set is 1-2 orders of magnitude larger than the value inferred for low-luminosity SNe II-P.
Models m25 and m27 do not eject any 56Ni because of the strong fallback in those progenitors. In contrast, the models of Kasen & Woosley (2009) eject a significant amount of 56Ni even in the low energy explosions of high mass progenitors (e.g., 0.34 M⊙ in their model M25_E0.6_Z1). The reason for this difference is unclear. In the simulations of Dessart et al. (2010b), most of the CO core falls back if the progenitor mass is 20 M⊙ and the ejecta kinetic energy at infinity is 31050 erg. The smaller the piston power, the greater is the fallback. So, the large 56Ni mass obtained in Kasen & Woosley (2009), which is well above the inferred value for SNe II-P, may result partly from overestimating its power.
In Table 5 we present the ejecta/progenitor properties inferred from radiation-hydrodynamics modeling and/or pre-explosion photometry of low-luminosity SNe II-P. As discussed in the introduction, there is a large scatter in progenitor masses (but also surface radii etc.). In this work, we have studied the whole sample of low-luminosity SNe II-P and emphasized what a uniform set they form in terms of -band LC, color evolution, spectral evolution, or expansion rates (Section 2). It is hard to understand how a wide range of ejecta/progenitor properties can arise from such a uniform set of events.
Our studies favor low-mass massive stars as progenitors of SNe II-P, which is in agreement with Pastorello et al. (2004), Spiro et al. (2014), Pumo et al. (2017), or Fraser et al. (2011). In some studies, the progenitor radius is claimed to be as low as 85–130 R⊙ (Chugai & Utrobin 2000; Zampieri et al. 2003; Pastorello et al. 2009; Roy et al. 2011), which is more typical of BSG progenitors. Low-luminosity SNe II-P do not have a Type II-pec evolution like SN 1987A, and such small radii are also in strong disagreement with the constraints from pre-explosion images. Stellar evolution also predicts that the majority of low/moderate mass massive stars die as RSG stars, not BSG stars.
Our results are in conflict with the results of Turatto et al. (1998), who propose a 24 M⊙ ejecta for SN 1997D.
7 Conclusions
We have studied the properties of observed low-luminosity SNe II-P and confronted them to the radiation properties obtained numerically from the explosion of low- and high-mass RSG stars (12, 25 and 27 M⊙ on the main sequence).
Observations of low-luminosity SNe II-P reveal a very uniform class of objects, both photometrically and spectroscopically. All events show a plateau LC in the band during the photospheric phase – there are no fast decliners (II-L like) in this set. The plateau duration is tightly centered around 110 10 d. Their color evolution is also similar, showing a progressive and monotonic reddening during the photospheric phase. A larger scatter in color appears at nebular times, driven from differences in 56Ni mass and perhaps from chemical mixing in the He core (L17). All low-luminosity SN II-P ejecta contain some 56Ni, with a minimum inferred mass of 0.001 M⊙. Spectroscopically, low-luminosity SNe II-P systematically exhibit narrower lines than standard-luminosity SNe II-P, which implies lower ejecta expansion rate. It thus appears that low-luminosity SNe II-P are low energy explosions of RSG stars.
Using stellar evolution and explosion models for stars of initial mass of 12, 25, and 27 M⊙, we study the radiation properties of SNe arising from the explosion of low- and high-mass RSG stars. We find systematic differences in SN properties between these two mass domains, which arise from their distinct pre-SN structure.
RSG stars of greater initial mass produce heavier He cores and greater surface luminosities, giving rise to a greater mass loss. Consequently, the RSG radius increases with the main-sequence mass while the ratio of the H-rich envelope mass to the He-core mass decreases. For large enough mass loss, the envelope may shrink, as in our model m27. For models m12, m25, and m27, the surface radius is 502, 872, and 643 R⊙. As reported in Dessart & Hillier (2011); Dessart et al. (2013), we find that the larger the progenitor radius, the bluer the SN prior to the recombination phase. Only the explosion of more compact, i.e., lower mass RSG stars, matches the color evolution of low-luminosity SNe II-P.
Because the ratio of the H-rich envelope mass to the He-core mass decreases with increasing main-sequence mass, low- and high-mass RSG stars have a very different chemical stratification in mass space. This stratification is visible in velocity space after explosion, with the H-rich ejecta layers being confined to higher velocity regions in SNe II models from higher mass RSG stars. The smaller H-rich envelope mass in higher mass RSG stars tends to produce a shorter plateau (models m25 and m27). As the H-rich envelope drops to just a few solar masses, the -band light curve shows a faster decline rate, in contradiction to observations of low-luminosity SNe II-P. Furthermore, only in model m12 do H and Fe ii 5169 Å follow their observed counterparts. In model m25 and m27, H remains much too broad at late times, reflecting the large velocity of the H-rich layers (or the large velocity of the former He-core material).
Third, some difficulties with high-mass progenitors arise concerning the amount of 56Ni ejected in the explosions. This parameter is very well constrained from the observed LCs at nebular times (in the sense that it does not require radiative transfer modelling), and found to be at least 0.001 M⊙. SN 1999eu may have ejected even less i but the nebular phase photometric data is too sparse to say confidently. Admittedly, for very low i yields, it can become a challenge to extract the SN brightness from the image photometry, especially for SNe lying in relatively dense star clusters.
In our models m25 and m27, no 56Ni is ejected due to the highly bound He-core and the strength of the reverse shock. These models experience strong fallback, the entire CO core falling into the compact remnant and forming a 6 M⊙ black hole. The ejecta kinetic energy of erg in models m25 and m27, small enough to prevent 56Ni ejection in these ejecta, is likely overestimated as the line profiles are broader than observed during the photospheric phase. Reducing the discrepancy in line widths at early time would require reducing the explosion energy, which would enhance the amount of fallback, this time perhaps of the entire He core. In this context, observing narrow [O i] or [Ca ii] lines at nebular times in a low-luminosity SN II-P is unambiguous evidence that some i is ejected. If the power at nebular times comes instead from interaction with the progenitor wind, only a broad H line should be seen. This may help refine the interpretation for the origin of the faint brightness at nebular times.
According to the results of our modeling and the confrontation to observed LCs and multi-epoch spectra, we conclude that low-mass RSG stars are the preferred progenitor population for the observed low-luminosity SNe II-P. It is however unclear whether all low mass RSG stars produce low energy explosions. For a standard initial mass function with exponent 2.3, 42% of massive stars are born in the range M⊙, and 15% in the range M⊙. In contrast, only 5% of all Type II SNe are low energy explosions. So, either the mass range for these low-energy SNe II-P is very narrow (e.g., narrower than 8 to 9 M⊙), or M⊙ exhibit some diversity in explosion energy, or we are missing numerous low-energy Type II-SNe because of an observational bias. A combination of all three might hold in Nature. From the point of view of the explosion mechanism, low-energy explosions seem to naturally occur in massive star progenitors characterized by a steeply declining density profile above the degenerate core, which is a generic feature of the lowest mass massive stars (Kitaura et al., 2006). The low-energy SNe II-P may then arise from the collapse of the ONeMg core leading to electron-capture SNe (Poelarends et al., 2008).
8 Acknowledgements
Sergey Lisakov is supported by the Erasmus Mundus Joint Doctorate Program by Grants Number 2013-1471 from the agency EACEA of the European Commission. DJH acknowledges support from STScI theory grant HST-AR-12640.01 and NASA theory grant NNX14AB41G. Some of the data used in this work were downloaded from the Open Supernova Catalog (https://sne.space, Guillochon et al. 2017). This work used computing resources of the mesocentre SIGAMM, hosted by the Observatoire de la Côte d’Azur, Nice, France.
References
- Anderson et al. (2014a) Anderson J. P., et al., 2014a, MNRAS, 441, 671
- Anderson et al. (2014b) Anderson J. P., et al., 2014b, ApJ, 786, 67
- Arcavi et al. (2013) Arcavi I., Gal-Yam A., Sergeev S. G., 2013, AJ, 145, 99
- Arnett (1980) Arnett W. D., 1980, ApJ, 237, 541
- Arnett & Falk (1976) Arnett W. D., Falk S. W., 1976, ApJ, 210, 733
- Barbarino et al. (2015) Barbarino C., et al., 2015, MNRAS, 448, 2312
- Barbon et al. (1979) Barbon R., Ciatti F., Rosino L., 1979, A&A, 72, 287
- Bartunov & Blinnikov (1992) Bartunov O. S., Blinnikov S. I., 1992, Soviet Astronomy Letters, 18, 43
- Benetti et al. (2001) Benetti S., et al., 2001, MNRAS, 322, 361
- Bersten et al. (2011) Bersten M. C., Benvenuto O., Hamuy M., 2011, ApJ, 729, 61
- Blanton et al. (1995) Blanton E. L., Schmidt B. P., Kirshner R. P., Ford C. H., Chromey F. R., Herbst W., 1995, AJ, 110, 2868
- Boles et al. (2003) Boles T., Beutler B., Li W., Qiu Y. L., Hu J. Y., Schwartz M., 2003, IAU Circ., 8062
- Bose & Kumar (2014) Bose S., Kumar B., 2014, ApJ, 782, 98
- Bose et al. (2013) Bose S., et al., 2013, MNRAS, 433, 1871
- Cappellari et al. (2011) Cappellari M., et al., 2011, MNRAS, 413, 813
- Childress et al. (2016) Childress M. J., et al., 2016, Publ. Astron. Soc. Australia, 33, e055
- Chugai & Utrobin (2000) Chugai N. N., Utrobin V. P., 2000, A&A, 354, 557
- Chugai et al. (2005) Chugai N. N., Fabrika S. N., Sholukhova O. N., Goranskij V. P., Abolmasov P. K., Vlasyuk V. V., 2005, Astronomy Letters, 31, 792
- Ciatti et al. (1971) Ciatti F., Rosino L., Bertola F., 1971, Mem. Soc. Astron. Italiana, 42, 163
- Dall’Ora et al. (2014) Dall’Ora M., et al., 2014, ApJ, 787, 139
- Dessart & Hillier (2005) Dessart L., Hillier D. J., 2005, A&A, 437, 667
- Dessart & Hillier (2006) Dessart L., Hillier D. J., 2006, A&A, 447, 691
- Dessart & Hillier (2008) Dessart L., Hillier D. J., 2008, MNRAS, 383, 57
- Dessart & Hillier (2011) Dessart L., Hillier D. J., 2011, MNRAS, 410, 1739
- Dessart et al. (2008) Dessart L., et al., 2008, ApJ, 675, 644
- Dessart et al. (2010a) Dessart L., Livne E., Waldman R., 2010a, MNRAS, 405, 2113
- Dessart et al. (2010b) Dessart L., Livne E., Waldman R., 2010b, MNRAS, 408, 827
- Dessart et al. (2013) Dessart L., Hillier D. J., Waldman R., Livne E., 2013, MNRAS, 433, 1745
- Dimai & Li (1999) Dimai A., Li W., 1999, IAU Circ., 7335
- Eldridge & Tout (2004) Eldridge J. J., Tout C. A., 2004, MNRAS, 353, 87
- Epinat et al. (2008) Epinat B., et al., 2008, MNRAS, 388, 500
- Falk & Arnett (1977) Falk S. W., Arnett W. D., 1977, ApJS, 33, 515
- Faran et al. (2014) Faran T., et al., 2014, MNRAS, 442, 844
- Fixsen et al. (1996) Fixsen D. J., Cheng E. S., Gales J. M., Mather J. C., Shafer R. A., Wright E. L., 1996, ApJ, 473, 576
- Fraser et al. (2011) Fraser M., et al., 2011, MNRAS, 417, 1417
- Freedman et al. (2001) Freedman W. L., et al., 2001, ApJ, 553, 47
- Gal-Yam et al. (2008) Gal-Yam A., et al., 2008, ApJ, 685, L117
- Gal-Yam et al. (2011) Gal-Yam A., et al., 2011, ApJ, 736, 159
- Galbany et al. (2016) Galbany L., et al., 2016, AJ, 151, 33
- Grassberg et al. (1971) Grassberg E. K., Imshennik V. S., Nadyozhin D. K., 1971, Ap&SS, 10, 28
- Graur et al. (2017) Graur O., Bianco F. B., Modjaz M., Shivvers I., Filippenko A. V., Li W., Smith N., 2017, ApJ, 837, 121
- Guillochon et al. (2017) Guillochon J., Parrent J., Kelley L. Z., Margutti R., 2017, ApJ, 835, 64
- Gurugubelli et al. (2008) Gurugubelli U. K., Sahu D. K., Anupama G. C., Chakradhari N. K., 2008, Bulletin of the Astronomical Society of India, 36, 79
- Gurugubelli et al. (2011) Gurugubelli U. K., Sahu D. K., Anupama G. C., 2011, in Astronomical Society of India Conference Series. p. 128
- Hakobyan et al. (2012) Hakobyan A. A., Adibekyan V. Z., Aramyan L. S., Petrosian A. R., Gomes J. M., Mamon G. A., Kunth D., Turatto M., 2012, A&A, 544, A81
- Hamuy (2001) Hamuy M. A., 2001, PhD thesis, The University of Arizona
- Hamuy (2003) Hamuy M., 2003, ApJ, 582, 905
- Hamuy et al. (2001) Hamuy M., et al., 2001, ApJ, 558, 615
- Harutyunyan et al. (2008) Harutyunyan A. H., et al., 2008, A&A, 488, 383
- Haynes et al. (1998) Haynes M. P., van Zee L., Hogg D. E., Roberts M. S., Maddalena R. J., 1998, AJ, 115, 62
- Heger et al. (2003) Heger A., Fryer C. L., Woosley S. E., Langer N., Hartmann D. H., 2003, ApJ, 591, 288
- Hendry et al. (2006) Hendry M. A., et al., 2006, MNRAS, 369, 1303
- Hillier & Dessart (2012) Hillier D. J., Dessart L., 2012, MNRAS, 424, 252
- Hillier & Miller (1998) Hillier D. J., Miller D. L., 1998, ApJ, 496, 407
- Hirschi et al. (2004) Hirschi R., Meynet G., Maeder A., 2004, A&A, 425, 649
- Hurst et al. (2001) Hurst G. M., et al., 2001, IAU Circ., 7662
- Jerkstrand et al. (2015) Jerkstrand A., Ergon M., Smartt S. J., Fransson C., Sollerman J., Taubenberger S., Bersten M., Spyromilio J., 2015, A&A, 573, A12
- Jones et al. (2009) Jones M. I., et al., 2009, ApJ, 696, 1176
- Kasen & Woosley (2009) Kasen D., Woosley S. E., 2009, ApJ, 703, 2205
- Khazov et al. (2016) Khazov D., et al., 2016, ApJ, 818, 3
- King (1999) King J. Y., 1999, IAU Circ., 7141
- Kiss et al. (2000) Kiss L., Sarneczky K., Sziladi K., 2000, IAU Circ., 7347
- Kitaura et al. (2006) Kitaura F. S., Janka H.-T., Hillebrandt W., 2006, A&A, 450, 345
- Klotz et al. (2002) Klotz A., Puckett T., Langoussis A., Wood-Vasey W. M., Aldering G., Nugent P., Stephens R., 2002, IAU Circ., 7986
- Koribalski et al. (2004) Koribalski B. S., et al., 2004, AJ, 128, 16
- Lennarz et al. (2012) Lennarz D., Altmann D., Wiebusch C., 2012, A&A, 538, A120
- Leonard et al. (2002) Leonard D. C., et al., 2002, AJ, 124, 2490
- Leonard et al. (2003) Leonard D. C., Kanbur S. M., Ngeow C. C., Tanvir N. R., 2003, ApJ, 594, 247
- Leonard et al. (2012) Leonard D. C., Dessart L., Hillier D. J., Pignata G., 2012, in Hoffman J. L., Bjorkman J., Whitney B., eds, American Institute of Physics Conference Series Vol. 1429, American Institute of Physics Conference Series. pp 204–207 (arXiv:1109.5406), doi:10.1063/1.3701926
- Li (1999) Li W. D., 1999, IAU Circ., 7294
- Li et al. (2006) Li W., Van Dyk S. D., Filippenko A. V., Cuillandre J.-C., Jha S., Bloom J. S., Riess A. G., Livio M., 2006, ApJ, 641, 1060
- Limongi & Chieffi (2003) Limongi M., Chieffi A., 2003, ApJ, 592, 404
- Lin et al. (2010) Lin K., Cenko S. B., Li W., Filippenko A. V., 2010, Central Bureau Electronic Telegrams, 2467
- Lisakov et al. (2017) Lisakov S. M., Dessart L., Hillier D. J., Waldman R., Livne E., 2017, MNRAS, 466, 34
- Litvinova & Nadezhin (1983) Litvinova I. I., Nadezhin D. K., 1983, Ap&SS, 89, 89
- Litvinova & Nadezhin (1985) Litvinova I. Y., Nadezhin D. K., 1985, Soviet Astronomy Letters, 11, 145
- Livne (1993) Livne E., 1993, ApJ, 412, 634
- Lu et al. (1993) Lu N. Y., Hoffman G. L., Groff T., Roos T., Lamphier C., 1993, ApJS, 88, 383
- Mattila et al. (2008) Mattila S., Smartt S. J., Eldridge J. J., Maund J. R., Crockett R. M., Danziger I. J., 2008, ApJ, 688, L91
- Maund et al. (2005) Maund J. R., Smartt S. J., Danziger I. J., 2005, MNRAS, 364, L33
- Maund et al. (2013) Maund J. R., et al., 2013, MNRAS, 431, L102
- Maund et al. (2014) Maund J. R., Mattila S., Ramirez-Ruiz E., Eldridge J. J., 2014, MNRAS, 438, 1577
- Maund et al. (2015) Maund J. R., Fraser M., Reilly E., Ergon M., Mattila S., 2015, MNRAS, 447, 3207
- de Mello et al. (1997) de Mello D., Benetti S., Massone G., 1997, IAU Circ., 6537
- Modjaz et al. (2005) Modjaz M., Kirshner R., Challis P., Hutchins R., 2005, Central Bureau Electronic Telegrams, 174
- Monard (2008) Monard L. A. G., 2008, Central Bureau Electronic Telegrams, 1315
- Moriya et al. (2016) Moriya T. J., Pruzhinskaya M. V., Ergon M., Blinnikov S. I., 2016, MNRAS, 455, 423
- Müller et al. (2017) Müller T., Prieto J. L., Pejcha O., Clocchiatti A., 2017, ApJ, 841, 127
- Munari et al. (2013) Munari U., Henden A., Belligoli R., Castellani F., Cherini G., Righetti G. L., Vagnozzi A., 2013, New Astron., 20, 30
- Nakano & Aoki (1999) Nakano S., Aoki M., 1999, IAU Circ., 7304
- Nakano et al. (2006) Nakano S., Itagaki K., Kadota K., 2006, Central Bureau Electronic Telegrams, 756
- Nakano et al. (2008) Nakano S., Kadota K., Wells W., 2008, Central Bureau Electronic Telegrams, 1636
- Nakano et al. (2009a) Nakano S., Kadota K., Buzzi L., 2009a, Central Bureau Electronic Telegrams, 1670
- Nakano et al. (2009b) Nakano S., Yusa T., Kadota K., 2009b, Central Bureau Electronic Telegrams, 2065
- Nakar et al. (2016) Nakar E., Poznanski D., Katz B., 2016, ApJ, 823, 127
- Nasonova et al. (2011) Nasonova O. G., de Freitas Pacheco J. A., Karachentsev I. D., 2011, A&A, 532, A104
- Olivares E. et al. (2010) Olivares E. F., et al., 2010, ApJ, 715, 833
- Pastorello et al. (2004) Pastorello A., et al., 2004, MNRAS, 347, 74
- Pastorello et al. (2006) Pastorello A., et al., 2006, MNRAS, 370, 1752
- Pastorello et al. (2009) Pastorello A., et al., 2009, MNRAS, 394, 2266
- Paxton et al. (2011) Paxton B., Bildsten L., Dotter A., Herwig F., Lesaffre P., Timmes F., 2011, ApJS, 192, 3
- Paxton et al. (2013) Paxton B., et al., 2013, ApJS, 208, 4
- Paxton et al. (2015) Paxton B., et al., 2015, ApJS, 220, 15
- Pietrzyński et al. (2010) Pietrzyński G., et al., 2010, AJ, 140, 1475
- Pignata (2013) Pignata G., 2013, in Massive Stars: From alpha to Omega. p. 176
- Poelarends et al. (2008) Poelarends A. J. T., Herwig F., Langer N., Heger A., 2008, ApJ, 675, 614
- Popov (1993) Popov D. V., 1993, ApJ, 414, 712
- Poznanski et al. (2009) Poznanski D., et al., 2009, ApJ, 694, 1067
- Pumo et al. (2017) Pumo M. L., Zampieri L., Spiro S., Pastorello A., Benetti S., Cappellaro E., Manicò G., Turatto M., 2017, MNRAS, 464, 3013
- Rodríguez et al. (2014) Rodríguez Ó., Clocchiatti A., Hamuy M., 2014, AJ, 148, 107
- Roy et al. (2011) Roy R., et al., 2011, ApJ, 736, 76
- Sahu et al. (2006) Sahu D. K., Anupama G. C., Srividya S., Muneer S., 2006, MNRAS, 372, 1315
- Sanders et al. (2015) Sanders N. E., et al., 2015, ApJ, 799, 208
- Schlafly & Finkbeiner (2011) Schlafly E. F., Finkbeiner D. P., 2011, ApJ, 737, 103
- Schlegel et al. (1998) Schlegel D. J., Finkbeiner D. P., Davis M., 1998, ApJ, 500, 525
- Sellwood & Sánchez (2010) Sellwood J. A., Sánchez R. Z., 2010, MNRAS, 404, 1733
- Smartt et al. (2015) Smartt S. J., et al., 2015, A&A, 579, A40
- Smith et al. (2011) Smith N., Li W., Filippenko A. V., Chornock R., 2011, MNRAS, 412, 1522
- Sorce et al. (2014) Sorce J. G., Tully R. B., Courtois H. M., Jarrett T. H., Neill J. D., Shaya E. J., 2014, MNRAS, 444, 527
- Spiro et al. (2014) Spiro S., et al., 2014, MNRAS, 439, 2873
- Springob et al. (2009) Springob C. M., Masters K. L., Haynes M. P., Giovanelli R., Marinoni C., 2009, ApJS, 182, 474
- Strauss et al. (1992) Strauss M. A., Huchra J. P., Davis M., Yahil A., Fisher K. B., Tonry J., 1992, ApJS, 83, 29
- Sukhbold et al. (2016) Sukhbold T., Ertl T., Woosley S. E., Brown J. M., Janka H.-T., 2016, ApJ, 821, 38
- Swartz et al. (1991) Swartz D. A., Wheeler J. C., Harkness R. P., 1991, ApJ, 374, 266
- Takáts et al. (2014) Takáts K., et al., 2014, MNRAS, 438, 368
- Takáts et al. (2015) Takáts K., et al., 2015, MNRAS, 450, 3137
- Theureau et al. (2007) Theureau G., Hanski M. O., Coudreau N., Hallet N., Martin J.-M., 2007, A&A, 465, 71
- Tifft & Cocke (1988) Tifft W. G., Cocke W. J., 1988, ApJS, 67, 1
- Tsvetkov (2008) Tsvetkov D. Y., 2008, Peremennye Zvezdy, 28
- Tsvetkov et al. (2008) Tsvetkov D. Y., Goranskij V., Pavlyuk N., 2008, Peremennye Zvezdy, 28
- Turatto et al. (1994) Turatto M., Gouiffes C., Leibundgut B., 1994, IAU Circ., 5987, 1
- Turatto et al. (1998) Turatto M., et al., 1998, ApJ, 498, L129
- Ugliano et al. (2012) Ugliano M., Janka H.-T., Marek A., Arcones A., 2012, ApJ, 757, 69
- Utrobin & Chugai (2008) Utrobin V. P., Chugai N. N., 2008, A&A, 491, 507
- Utrobin & Chugai (2013) Utrobin V. P., Chugai N. N., 2013, A&A, 555, A145
- Utrobin et al. (2007) Utrobin V. P., Chugai N. N., Pastorello A., 2007, A&A, 475, 973
- Valenti et al. (2014) Valenti S., et al., 2014, MNRAS, 438, L101
- Valenti et al. (2016) Valenti S., et al., 2016, MNRAS, 459, 3939
- Van Dyk et al. (2012) Van Dyk S. D., et al., 2012, AJ, 143, 19
- de Vaucouleurs et al. (1981) de Vaucouleurs G., de Vaucouleurs A., Buta R., Ables H. D., Hewitt A. V., 1981, PASP, 93, 36
- de Vaucouleurs et al. (1991) de Vaucouleurs G., de Vaucouleurs A., Corwin Jr. H. G., Buta R. J., Paturel G., Fouqué P., 1991, Third Reference Catalogue of Bright Galaxies. Volume I: Explanations and references. Volume II: Data for galaxies between 0h and 12h. Volume III: Data for galaxies between 12h and 24h.
- Vinkó et al. (2006) Vinkó J., et al., 2006, MNRAS, 369, 1780
- Wei et al. (2010) Wei L. H., Kannappan S. J., Vogel S. N., Baker A. J., 2010, ApJ, 708, 841
- Wongwathanarat et al. (2015) Wongwathanarat A., Mueller E., Janka H.-T., 2015, A&A, 577, A48
- Woosley & Weaver (1995) Woosley S. E., Weaver T. A., 1995, ApJS, 101, 181
- Woosley et al. (2002) Woosley S. E., Heger A., Weaver T. A., 2002, Reviews of Modern Physics, 74, 1015
- Yaron et al. (2013) Yaron O., et al., 2013, The Astronomer’s Telegram, 4910
- Yoshida et al. (1999) Yoshida S., Kadota K., Hanzl D., 1999, IAU Circ., 7143
- Young et al. (2004) Young J., Boles T., Li W., 2004, IAU Circ., 8401
- Yuan et al. (2016) Yuan F., et al., 2016, MNRAS, 461, 2003
- Zampieri et al. (2003) Zampieri L., Pastorello A., Turatto M., Cappellaro E., Benetti S., Altavilla G., Mazzali P., Hamuy M., 2003, MNRAS, 338, 711
- Zhang & Wang (2014) Zhang J., Wang X., 2014, The Astronomer’s Telegram, 6192
- Zhang et al. (2006) Zhang T., Wang X., Li W., Zhou X., Ma J., Jiang Z., Chen J., 2006, AJ, 131, 2245
- Zheng & Filippenko (2014) Zheng W., Filippenko A. V., 2014, The Astronomer’s Telegram, 6190
Appendix A Observational data
Our sample consists of 17 SNe (Table 6): 1997D, 1999br, 1999gn, 2001dc, 2004eg, 2005cs, 2006ov, 2008bk, 2008in, 2009N, 2009md, 2010id, 2013am. Some of the objects from our sample, such as 2005cs and 2008bk, were followed spectroscopically and photometrically with a high cadence. Others have been observed just a few times, but all these SNe are confirmed as low-luminosity Type II-P SNe.
In Table 7, we summarize the main information for the SNe II used for comparison. The quoted extinction AV corresponds to the Galactic extinction (Schlafly & Finkbeiner, 2011). However, in some cases, the AV value includes the host galaxy extinction. Such cases are marked in the Table 7 and discussed explicitly in below. We adopt a visual extinction to reddening ratio R. All objects are associated with large spiral galaxies, and are generally located within their arms. Some relevant information not included in the Table 7 is presented below for each object.
| SN | Host galaxy | Galaxy Type | Explosion date | A | Referencesb | ||
|---|---|---|---|---|---|---|---|
| MJD | [mag] | [mag] | [km s-1] | ||||
| 1994N | UGC 5695 | Sb | 49451.010 | 0.103 | 33.090.31 | 2940 | P04 |
| 1997D | NGC 1536 | SBc, interacting galaxies | 50361.015 | 0.058 | 31.29 | 1461 | P04, S14 |
| 1999br | NGC 4900 | SBc | 51278.03 | 0.065 | 31.90∗∗ | 968 | P04, S14 |
| 1999eu | NGC 1097 | SBb, AGN | 51394.015 | 0.073 | 31.08 | 1273 | P04, S14 |
| 1999gn | M 61 | SBbc, Seyfert 2 galaxy | 51520.010 | 0.061 | 30.500.20 | 1616 | S14 |
| 2001dc | NGC 5777 | Sb | 52047.05 | 1.250∗ | 33.190.43 | 2140 | P04, S14, So14 |
| 2002gd | NGC 7537 | Sbc, interacting galaxies | 52552.02 | 0.184 | 32.870.35 | 2678 | S14, W10 |
| 2003Z | NGC 2742 | Sc | 52665.04 | 0.106 | 31.700.60 | 1280 | S14, H12 |
| 2004eg | UGC 3053 | Sc | 53170.030 | 1.237∗ | 32.640.38 | 2414 | S14, C11 |
| 2005cs | M 51 | SABb, Seyfert 2 galaxy | 53547.60.5 | 0.124∗ | 29.750.16 | 466 | D08 |
| 2006ov | M 61 | SBbc, Seyfert 2 galaxy | 53974.06 | 0.061 | 30.500.20 | 1616 | S14 |
| 2008bk | NGC 7793 | Scd | 54546.02 | 0.062∗ | 27.680.05 | 283 | L17, P10, P |
| 2008in | M 61 | SBbc, Seyfert 2 galaxy | 54825.01 | 0.305∗ | 30.500.20 | 1616 | R11 |
| 2009N | NGC 4487 | SBc | 54848.11.2 | 0.403∗ | 31.670.11 | 1050 | T14 |
| 2009md | NGC 3389 | Sc | 55170.04 | 0.380∗ | 31.640.21 | 1298 | F11, H12 |
| 2010id | NGC 7483 | SBa | 55452.02 | 0.167 | 33.150.45 | 4940 | G11, T07 |
| 2013am | M 65 | SBa, AGN | 56372.01 | 1.767∗ | 30.540.40 | 807 | Z14, N11 |
| 1999em | NGC 1637 | SAB(rs)c | 51474.32 | 0.31∗ | 30.300.17 | 800 | DH06, L03 |
a In most cases visual extinction AV corresponds to the Galactic extinction (Schlafly & Finkbeiner, 2011), but for some SNe AV also includes additional extinction (see Appendix A for details). In this case AV value is followed by an asterisk. In some cases AV is calculated from AB or , provided in the corresponding papers.
b P04: Pastorello et al. (2004); S14: Spiro et al. (2014); L03: Leonard et al. (2003); DH06: Dessart & Hillier (2006); D08: Dessart et al. (2008); L17: in L17 we adopted an explosion date of 54546.0 MJD for SN 2008bk basing on the explosion date estimation of 54548.02 MJD from Pignata (2013) and spectral evolution of model m12; P10: Pietrzyński et al. (2010); P: Pignata, private communication; R11: Roy et al. (2011); T14: Takáts et al. (2014); F11: Fraser et al. (2011); G11: Gal-Yam et al. (2011); Z14: Zhang & Wang (2014); So14: Sorce et al. (2014); W10: Wei et al. (2010); H12: Hakobyan et al. (2012); C11: Cappellari et al. (2011); T07: Theureau et al. (2007); N11: Nasonova et al. (2011).
** The distance to SN 1999br in Pastorello et al. (2004) is 17.3 Mpc (distance modulus ). Pignata (2013) supposes that the distance for the 1999br may be underestimated, basing on the similarities between SN 1999br and SN 2008bk. We use the mean result from the NED catalogue, derived from 7 distance estimations to the host galaxy NGC 4900.
| SN | Host galaxy | Galaxy type | Explosion date | A | Referencesb | ||
|---|---|---|---|---|---|---|---|
| MJD | [mag] | [mag] | [km s-1] | ||||
| 1969L | NGC 1058 | SA(rs)c | 405495 | 0.163 | 30.000.22 | 518 | C71, A76, L12, T88 |
| 1992ba | NGC 2082 | SB(r)b | 48888.58 | 0.156 | 31.340.53 | 1246 | H01, A14, O10, F96 |
| 1999bg | IC 758 | SB(rs)cd? | 5125114 | 0.052 | 32.410.18 | 1290 | F14, P09, V91 |
| 1999gi | NGC 3184 | SAB(rs)cd | 515184 | 0.651* | 30.340.14 | 592 | F14, J09, S92 |
| 2001X | NGC 5921 | SB(r)bc | 519635 | 0.106 | 31.850.22 | 1470 | F14, R14 |
| 2001hg | NGC 4162 | (R)SA(rs)bc | 5226020 | 0.1 | 33.070.50 | 2580 | S09, F14 |
| 2002ca | UGC 8521 | (R)SB(r)ab pec | 5235315 | 0.063 | 33.030.45 | 3264 | F14, T07 |
| 2003T | UGC 4864 | SA(r)ab | 52645c | 0.084 | 35.210.42 | 8373 | G16, A14, O10 |
| 2003bn | PGC 831618 | ? | 52694.53 | 0.174 | 33.670.42 | 3831 | A14, O10 |
| 2003gd | M 74 | SA(s)c | 5272030d | 0.187 | 29.760.29 | 657 | F14, G16, R14, L93 |
| 2003hl | NGC 0772 | SA(s)b | 52868.55 | 1.55* | 32.390.30 | 2475 | A14, F14 |
| 2003hn | NGC 1448 | SAcd? edge-on | 52866.510 | 0.408* | 31.140.40 | 1170 | A14, H08, O10 |
| 2004A | NGC 6207 | SA(s)c | 5301010 | 0.180* | 31.440.40 | 852 | T08a, H06, G08, S09, H98 |
| 2004dj | NGC 2403 | SAB(s)cd | 531708 | 0.107 | 27.540.24 | 133 | Z06, T08b, V06, C05, F01, S10 |
| 2004et | NGC 6946 | SAB(rs)cd | 532711 | 1.3* | 28.670.40 | 40 | S06, F14, B14, E08 |
| 2005ay | NGC 3938 | SA(s)c | 5345610e | 0.34* | 31.270.30 | 809 | GY08, F14, P09 |
| 2009ib | NGC 1559 | SB(s)cd | 55041.33.1 | 0.5* | 31.480.30 | 1304 | T15, K04 |
| 2012aw | M 95 | SB(r)b | 56003 | 0.23 | 30.000.22 | 778 | D14, M13, B13, V91 |
| 2012ec | NGC 1084 | SA(s)c | 561432 | 0.31* | 31.330.43 | 1407 | S15, B15, Ma13, So14, K04 |
| 2013ej | M 74 | SA(s)c | 56500 | 0.19 | 29.930.12 | 657 | Y16, V14, L93 |
| 2014cx | NGC 337 | SB(s)d | 569011.5 | 0.297 | 31.330.43 | 1698 | V16, C16, So14, V91 |
a: In most cases, the visual extinction AV corresponds to the Galactic extinction (Schlafly & Finkbeiner, 2011). When the quoted AV has a superscript *, its value corresponds to the total extinction, taken from the cited literature.
C71: Ciatti et al. (1971), A76: Arnett & Falk (1976), L12: Lennarz et al. (2012), T88: Tifft & Cocke (1988), H01: Hamuy (2001), A14: Anderson et al. (2014b), O10: Olivares E. et al. (2010), F96: Fixsen et al. (1996), F14: Faran et al. (2014), P09: Poznanski et al. (2009), V91: de Vaucouleurs et al. (1991),J09: Jones et al. (2009), S92: Strauss et al. (1992), R14: Rodríguez et al. (2014), S09: Springob et al. (2009), T07: Theureau et al. (2007), G16: Galbany et al. (2016), L93: Lu et al. (1993), H08: Harutyunyan et al. (2008), T08a: Tsvetkov (2008), H06: Hendry et al. (2006), G08: Gurugubelli et al. (2008), H98: Haynes et al. (1998), Z06: Zhang et al. (2006), T08b: Tsvetkov et al. (2008), V06: Vinkó et al. (2006), C05: Chugai et al. (2005), F01: Freedman et al. (2001), S10: Sellwood & Sánchez (2010), S06: Sahu et al. (2006), B14: Bose & Kumar (2014), E08: Epinat et al. (2008), GY08: Gal-Yam et al. (2008), T15: Takáts et al. (2015), So14: Sorce et al. (2014), K04: Koribalski et al. (2004), D14: Dall’Ora et al. (2014), M13: Munari et al. (2013), B13: Bose et al. (2013), B15: Barbarino et al. (2015), S15: Smartt et al. (2015), Ma13: Maund et al. (2013), Y16: Yuan et al. (2016), V14: Valenti et al. (2014), V16: Valenti et al. (2016), C16: Childress et al. (2016).
c: For 2003T, we adopt explosion epoch of MJD 52645 in contrast to MJD 52654.5 (A14), basing on the plateau length (around 100 days in our case) and colors of spectra.
d: For 2003gd, we adopt explosion epoch of MJD 5272030, basing on the plateau length. The SN was discovered on MJD 52802, so the explosion epoch is highly uncertain.
e: For 2005ay, we adopt explosion epoch of MJD 52645, basing on the plateau length and colors of spectra.
A.1 SN 1994N
A.2 SN 1997D
SN 1997D was discovered in NGC 1536 on 14 January 1997 about 100 days after maximum (de Mello et al., 1997), so the explosion epoch is not accurately constrained (MJD ; Spiro et al. 2014). The red spectra and narrow lines together with the LC indicate that this object was captured at the end of the plateau phase. In some works a short plateau of 40–50 d is proposed (Chugai & Utrobin, 2000). Given the high homogeneity of all the low-luminosity SNe II-P known to date, we adopt in this work a more conventional plateau length of days, following Zampieri et al. (2003); Pastorello et al. (2004) and Spiro et al. (2014). For SN 1997D, we use the photometric and spectroscopic data from Benetti et al. (2001).
A.3 SN 1999br
SN 1999br was discovered in NGC 4900 on 12 April 1999 (King, 1999). There is no evidence of the SN on frames taken on 4.4 April 1999 with a limiting magnitude 17 (Yoshida et al., 1999).
While (Pastorello et al., 2004) adopts a distance of 17.3 Mpc, Pignata (2013) argues that this value is probably underestimated based on the similarities between SN 1999br and SN 2008bk. In this paper, we use the distance of 24.0 Mpc — the mean result from the NED catalogue, derived from seven distance estimations to the host galaxy NGC 4900. With this distance, SN 1999br remains amongst the faintest in our sample of low-luminosity SNe II-P.
The SN is located on the periphery of NGC 4900. The spectra do not show any evidence for significant internal extinction (Pastorello et al., 2004).
For SN 1999br, we use the photometric and spectroscopic data from Pastorello et al. (2004).
A.4 SN 1999eu
A.5 SNe 1999gn, 2006ov and 2008in
The galaxy M 61 (NGC 4303) hosts 3 SNe from our sample.
SN 1999gn was discovered on 17 December 1999 (Dimai & Li, 1999), approximately 10 days after explosion. For SN 1999gn we use the spectroscopic data from Spiro et al. (2014). There are only two -band measurements reported in Dimai & Li (1999) and Kiss et al. (2000).
A.6 SN 2001dc
This SN was discovered on 30 May 2001 close to the nucleus of the edge-on Type Sbc galaxy NGC 5777 (Hurst et al., 2001). For SN 2001dc we use the photometric and spectroscopic data from Spiro et al. (2014).
The position of SN in the host galaxy and its color indicate significant reddening. We adopt the total extinction 1.25 (Spiro et al., 2014).
A.7 SN 2002gd
A.8 SN 2003Z
A.9 SN 2004eg
SN 2004eg was discovered in UGC 3053 on 1 September 2004 (Young et al., 2004). Only two spectra are available at 93 and 171 d after the inferred time of explosion. For SN 2004eg, we use the photometric and spectroscopic data from Spiro et al. (2014). The total extinction 1.237 mag (Spiro et al., 2014).
A.10 SN 2005cs
SN 2005cs was discovered in NGC 2742 on 30 June 2005 (Modjaz et al., 2005). For SN 2005cs, we use the photometric and spectroscopic data from Pastorello et al. (2009). We adopt the total extinction 0.124 mag as inferred from the multi-epoch photometric and spectroscopic modeling of Dessart et al. (2008).
A.11 SN 2008bk
SN 2008bk was discovered in the NGC 7793 on 26 March 2008 (Monard, 2008). A low-mass RSG was identified in archival images (Mattila et al., 2008; Van Dyk et al., 2012). Modeling of the SN radiation by L17 suggests that SN 2008bk likely arises from the low energy explosion of a low-mass RSG star.
For SN 2008bk, we use the photometric and spectroscopic data from Pignata (2013) and spectropolarimetric observations from Leonard et al. (2012). Following L17, we adopt an extinction 0.062 mag, which is within 0.01 mag of the value reported by Schlafly & Finkbeiner (2011) for the line-of-sight towards the host galaxy NGC 7793.
A.12 SN 2009N
A.13 SN 2009md
SN 2009md was discovered in NGC 3389 on 4.81 December 2009 (Nakano et al., 2009b). For SN 2009md, we use the photometric and spectroscopic data from Fraser et al. (2011), where the authors adopted an explosion epoch of MJD. With such a choice, the color evolution at early times strongly disagrees with other objects from our sample. We thus adopted an explosion epoch of MJD, which is the upper limit of the value adopted in Fraser et al. (2011).
A.14 SN 2010id
SN 2010id was discovered in NGC 7483 on 16.33 September 2010 (Lin et al., 2010). For SN 2010id, we use the photometric and spectroscopic data from Gal-Yam et al. (2011).
The -band photometry we use for this SN comes from the Katzman Automatic Imaging Telescope (KAIT). Its LCs are presented in Fig. 4 of Gal-Yam et al. (2011). The -band photometry does not seem to be in good agreement with other bands: while observations in the and bands with various instruments from 55480 to 55490 MJD do not show any change in the slope of the LC, there is an almost 0.5 mag rise in as recorded with KAIT. The photometry has probably some significant errors so we treat all results for SN 2010id in Section 2 with caution.
A.15 SN 2013am
A.16 Other candidates in low-luminosity SNe II-P
In addition to the SNe discussed in the preceding section, a few more events have been claimed as low-luminosity Type II-P SNe. However, after analysis of their observational properties, we decided to exclude them from our sample. These correspond to SNe 1991G, 2003ie and 2014bi. Below, we explain why they are not considered in the present study.
A.16.1 SN 1991G
Adopting a distance of 15.5 Mpc and an extinction 0.025 mag (which is lower than the extinction due to Milky Way alone according to Schlegel et al. 1998 and Schlafly & Finkbeiner 2011), for SN 1991G (Blanton et al., 1995), one would obtain a plateau brightness similar to that of SN 2002gd (which is the brightest in our low-luminosity sample). This seems incompatible with the expansion rate of 6450 km s-1 inferred from Fe ii 5169 Å at 21 days since explosion, which is a typical value for standard SNe Type II-P.
With such a low value of the extinction, the first available spectrum observed on 14 February 1991 ( 21 d after explosion) would be extremely red in comparison to the other SNe in our sample. On the contrary, if one adopts a high extinction of 2.0 mag, the spectrum has a similar color to those of SNe II-P and SN 1991G then becomes brighter than the standard Type II-P SN 1999em.
Due to these uncertainties with the extinction and/or with the calibration of the spectra, we do not include SN 1991G in the current study.
A.16.2 SN 2003ie
SN 2003ie was classified by Arcavi et al. (2013) as a faint Type II-P event. However, its intrinsic brightness at discovery is higher than for any SN in our sample. Moreover, the poor cadence of photometric observations and the availability of only one spectrum do not allow to estimate the explosion date. The spectrum is quite different from the spectra from our sample (e.g., the strength of H line is lower). We thus exclude this object from our study.
A.16.3 SN 2014bi
SN 2014bi has been classified as a faint SN II-P (Zhang & Wang, 2014). The observational data are very scarce, only one low-quality spectrum and few photometric points are available (Zheng & Filippenko, 2014; Zhang & Wang, 2014).
Since the inferred -band absolute magnitude is fainter than mag, the extinction should be very high (Khazov et al., 2016). The exact value of the extinction is unknown, therefore we cannot determine the SN luminosity. We thus exclude this object from our study.
A.17 Type II-P SN 1999em
SN 1999em was discovered in NGC 1637 on 30 October 1999 by Li (1999). SN 1999em is a standard Type II-P SN with mag during the plateau phase. It has a dense set of spectroscopic and photometric observational data. We use SN 1999em as a reference for a standard SN II-P to compare to our low-luminosity sample (this does not imply that all standard-luminosity Type II SNe are like SN 1999em; see Anderson et al. 2014b for a discussion on the observed diversity of Type II SNe).