Effects of interaction strength, doping, and frustration on the antiferromagnetic phase of the two-dimensional Hubbard model
Abstract
Recent quantum-gas microscopy of ultracold atoms and scanning tunneling microscopy of the cuprates reveal new detailed information about doped Mott antiferromagnets, which can be compared with calculations. Using cellular dynamical mean-field theory, we map out the antiferromagnetic (AF) phase of the two-dimensional Hubbard model as a function of interaction strength , hole doping and temperature . The Néel phase boundary is non-monotonic as a function of and . Frustration induced by second-neighbor hopping reduces Néel order more effectively at small . The doped AF is stabilized at large by kinetic energy and at small by potential energy. The transition between the AF insulator and the doped metallic AF is continuous. At large , we find in-gap states similar to those observed in scanning tunneling microscopy. We predict that, contrary to the Hubbard bands, these states are only slightly spin polarized.
The quantum mechanics of interacting electrons on a lattice can lead to complex many-body phase diagrams. For example, doping a layered Mott insulator can give rise to antiferromagnetism, pseudogap, unconventional superconductivity and multiple exotic phases Keimer et al. (2015). The Hubbard model is the simplest model of interacting electrons on a lattice. It can be used for both natural (e.g. cuprates) and artificial (e.g. ultracold atoms) systems Anderson (1987); Jaksch and Zoller (2005); Tremblay (2013); Georges and Giamarchi (2010). Therefore understanding the phases that appear in this model and the transitions between them is a central programme in condensed matter physics.
Here we study the regimes where antiferromagnetic (AF) correlations set in within the two dimensional (2D) Hubbard model on a square lattice as a function of interaction , doping and temperature , within cellular dynamical mean-field theory (CDMFT) Maier et al. (2005); Kotliar et al. (2006); Tremblay et al. (2006). The motivation for our work is threefold. First, recent advances in ultracold atom experiments can now reach temperatures low enough to detect AF correlations for repulsively interacting Fermi gases Greif et al. (2013); Hart et al. (2015); Parsons et al. (2016); Boll et al. (2016); Cheuk et al. (2016); Mazurenko et al. (2017); Drewes et al. (2017). Hence, a theoretical characterisation of the AF phase in the whole space might guide ultracold atom experiments that are exploring this uncharted territory. Second, recent tunneling spectroscopy studies Cai et al. (2016); Ye et al. (2013) reveal new details on the evolution of the AF Mott insulator upon doping, thus calling for theoretical explanations. Third, on the theory side we still know little about the detailed boundaries of the AF phase in the whole space of the 2D Hubbard model and the mechanism by which AF is stabilized. Most previous studies with this and other methods focused on Borejsza and Dupuis (2004); Sénéchal et al. (2005); Aichhorn, M. and Arrigoni, E. (2005); Aichhorn et al. (2007); Tocchio et al. (2016); Zheng and Chan (2016). The negative sign problem hampers the study of finite , large and finite doping Hirsch (1985); White et al. (1989); Lichtenstein and Katsnelson (2000); Paiva et al. (2001); Maier et al. (2005); Kyung et al. (2006); Paiva et al. (2010); Sato and Tsunetsugu (2016). Our results might serve as a stepping stone for new approaches directed towards including Mott physics and long wavelength fluctuations Ayral and Parcollet (2015, 2016a, 2016b); Rohringer et al. (2017).

Model and method. – We consider the 2D Hubbard model, , where is the (next) nearest-neighbor hopping, is the onsite Coulomb repulsion and is the chemical potential. Here () is the creation (destruction) operator on lattice site and spin , and is the number operator. We set as our energy unit. Within the cellular extension Maier et al. (2005); Kotliar et al. (2006); Tremblay et al. (2006) of dynamical mean-field theory Georges et al. (1996), a plaquette is embedded in a self-consistent bath. We have successfully benchmarked this approach Fratino et al. (2017) at , where reliable results are available.
We solve the cluster impurity problem using continuous time Quantum Monte Carlo based on the expansion of the hybridization between impurity and bath Gull et al. (2011); Sémon et al. (2014a). Symmetry breaking is allowed only in the bath. It is efficient to use of the group symmetry with mirrors along plaquette diagonals Fratino et al. (2017); Sémon and Tremblay (2012); Sémon et al. (2014b).
map of the AF phase. – Long-wavelength spin fluctuations lead, in two dimensions, to a vanishing staggered magnetization at finite temperature Mermin and Wagner (1966); Hohenberg (1967). Nevertheless, is non-zero in cold-atom experiments because of finite-size effects. For cuprates, the that we compute becomes non-vanishing at a dynamical mean-field Néel temperature where the antiferromagnetic correlation length of the infinite system would start to grow exponentially Fratino et al. (2017). Coupling in the third dimension leads to true long-range order at a lower temperature.
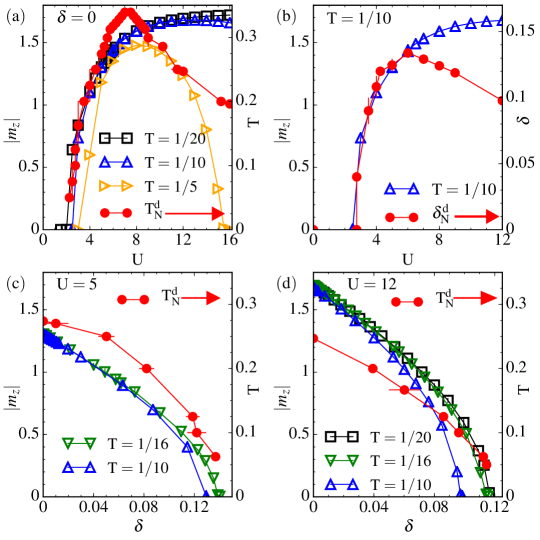
As a first step, is used to map out the AF phase in the space for . We consider hole doping only () and perform various cuts, i.e. (i) at ( plane in Fig. 1b), (ii) at fixed values of ( planes in Figs. 1c,d), (iii) and at fixed temperature ( plane at in Fig. 1e). These cuts are reported in the space in Fig. 1a, where one sees that has a global maximum at for . The sign problem prevents convergence below . The value of is color coded in Figs. 1b-e and shown in the Supplemental Material (SM) 111See Supplemental Material for the staggered magnetization curves as a function of and for few temperatures; complementary data for the local DOS..
The staggered magnetization is largest in the plane and saturates for large and low , as in mean field Schrieffer et al. (1989). Our analysis of the AF region in the space highlights two points. First, the overall behavior of differs from that of : For example, does not scale with either (phase boundary in Fig. 1b), or with (phase boundary in Fig. 1e). Physically even if large creates local moments, decreases with since it is the superexchange that aligns these moments at finite temperature. Second, the maxima Georges and Krauth (1993); Freericks and Jarrell (1995) of both and are correlated with the Mott transition that exists at in the unstable normal state below , suggesting that the hidden Mott transition [see Mott endpoint in Fig.1b,e] drives the qualitative changes in the AF state.
It is well known that the increase of at small is explained by the Slater physics of nesting and that the decrease of at large is explained by the Heisenberg physics of superexchange. Hence, the fact that the position of the maximum of at is controlled by the underlying Mott transition Fratino et al. (2017) reflects the underlying physics. As we saw above (cf. green line in Fig. 1e), this difference between small and large persists upon doping since the range of where AF exists first increases with and then decreases, with the crossover again controlled by the Mott transition at . In contrast, regardless of the strength of , monotonically decreases with increasing [phase boundaries in Figs. 1c,d].
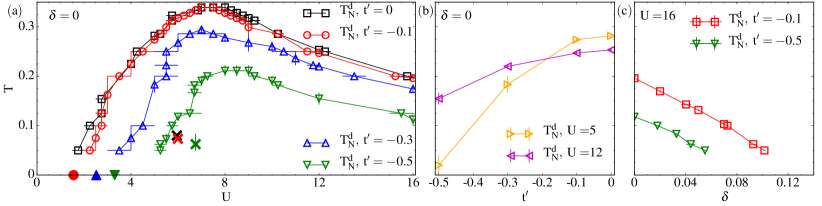
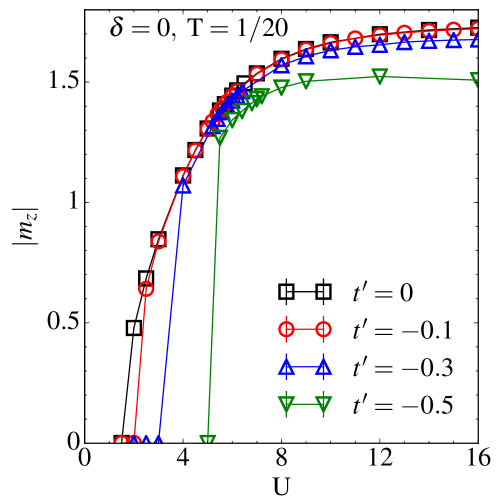
Effect of frustration on . – We can gain further insights by varying the next-nearest neighbor hopping , which frustrates AF order in varying degree depending on the value of , as we shall see. Having in mind the physics of hole doped cuprates, here we consider only negative values of , in the range .
Figure 2a shows at for different values of . AF now appears at a critical that shifts to higher values of upon increasing , in agreement with expectation from the physics of nesting and also from the , DMFT Chitra and Kotliar (1999); Zitzler et al. (2004) and Hartree-Fock (HF) results Hofstetter and Vollhardt (1998). The transition at is consistent with first order Hofstetter and Vollhardt (1998); Chitra and Kotliar (1999); Zitzler et al. (2004) for finite (see Fig. 2 in SM Note (1)). is larger than the HF result Hofstetter and Vollhardt (1998) because the vertex is renormalized downward compared to the bare by fluctuations in other channels Kanamori (1963); Brueckner et al. (1960); Vilk and Tremblay (1997); Yang et al. (2000). We find once again, that the position of max is correlated with the Mott transition in the underlying normal state.
Although frustration reduces as expected, the reduction of upon increasing at is stronger at small than at large , as shown in Fig. 2b. Indeed, although at small deviations from perfect nesting are first order in , at large the AF arises from localized spins and the correct quantities to compare are and whose ratio scale as . Figure 2c shows the doping-dependent at for different values of : at our lowest temperature, a fivefold increase of only approximately halves the critical doping at which the AF phase ends. The robustness of the AF phase at finite seems to reflect the robustness at since we observe a rigid downward shift of the whole line. The transition at the critical is consistent with second order (SM Note (1) Fig. 1d).
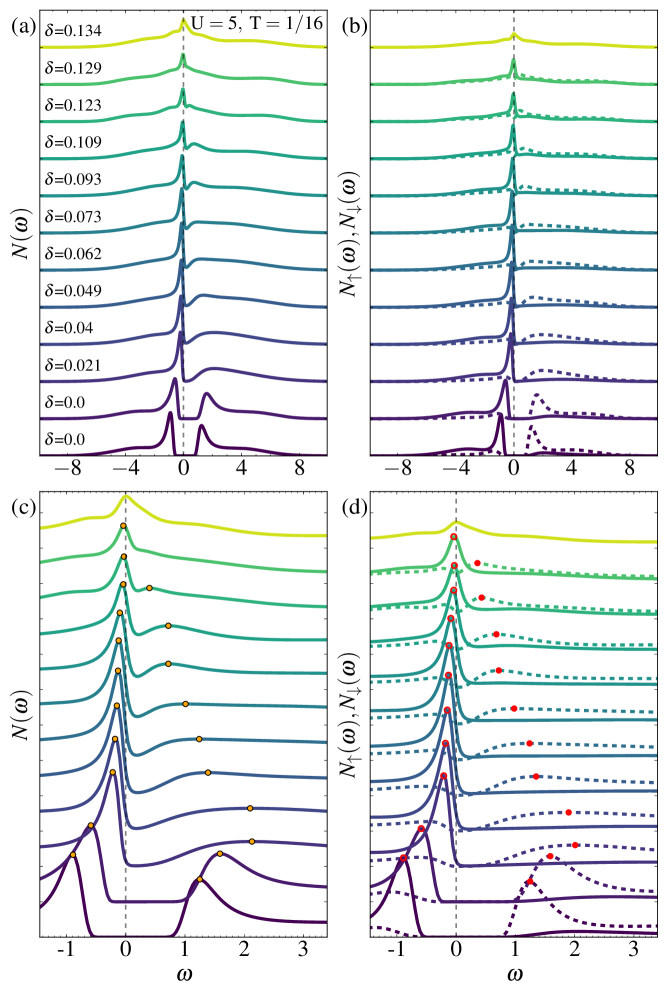
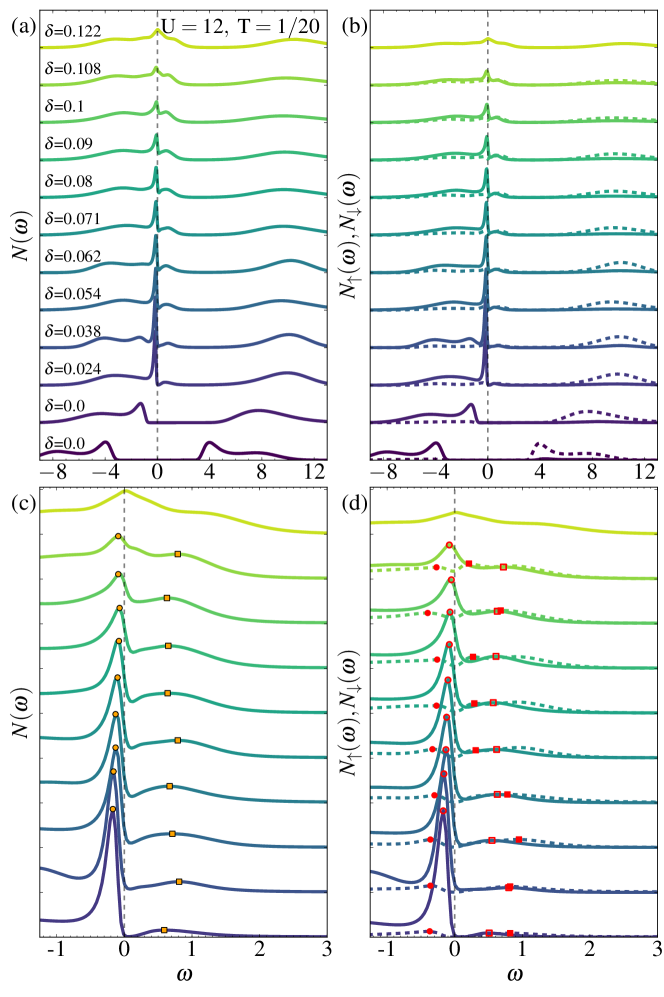
AF insulator to AF metal transition. – Having mapped out the Néel state, we next explore its nature by analyzing the local density of states (DOS) and the occupation .
First, consider the case. For we know that CDMFT recovers the AF insulating behavior Fratino et al. (2017). In principle, at small and large , the AF state can have both hole- and electron pockets at the Fermi surface. Then the AF state would be metallic even at Hofstetter and Vollhardt (1998); Yang et al. (2000). Here we find that the solution is insulating for all and we considered. This can be checked from the local DOS and from the occupation shown at for and in Fig. 3. More specifically, the plateau in the occupation at in Figs. 3c,g signals an incompressible insulator, i.e. the charge compressibility vanishes.
Second, consider the AF state at finite doping . In this case, has a finite slope, signalling a compressible metal, i.e. . In addition, Figs. 3a,e show that the local DOS has a small but finite spectral weight at the Fermi level, indicating a metallic state.
Therefore, at there is an AF insulator (AF-I), whereas at there is an AF metal (AF-M). This also holds in the limit Camjayi et al. (2006). What is the nature of the AF-I to AF-M transition driven by doping? Close to (), the occupation is continuous for all we have explored. As decreases, the curvature at the transition becomes sharper, suggesting a discontinuous change in slope in the limit, as expected for a second-order AF-I to AF-M transition. The transition is a crossover at finite .
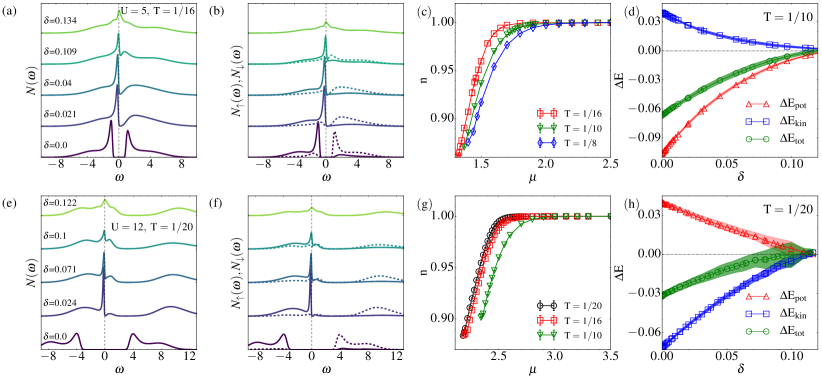
Density of states and “in-gap” states. – There are striking differences between the DOS of a doped Slater AF () vs a doped Mott AF ().
For , the spectra for in Fig. 3a shows two Bogoliubov peaks along with high frequency precursors of the Hubbard bands Moreo et al. (1995). When reaches the edge of the lower Bogoliubov peak, metallic behavior is recoverd since doped holes appear at . The rearrangement of the specral weight is not expected from the HF Slater solution. Upon doping, spectral weight transfers from high to low frequencies: the lower Bogoliubov peak decreases in intensity and moves close to the Fermi energy and, correspondingly, the upper Bogoliubov peak broadens. Fig. 3b shows that the upper and lower Bogoliubov peaks have sizeable spin polarization, as in the case Fratino et al. (2017).
By contrast, for , the spectra for in Fig. 3c,d have a clear four peak structure: two Bogoliubov peaks surrounded by Hubbard bands Vilk and Tremblay (1997); Moreo et al. (1995); Preuss et al. (1995); Fratino et al. (2017). In the doped case, there is a dramatic redistribution of spectral weight over a large frequency range across the AF gap, reminiscent of the Eskes-Meinders-Sawatzky picture Eskes et al. (1991): the lower Bogoliubov peak sharpens and a new spectral feature, “in-gap state”, appears between the upper Hubbard band and the Fermi level located at . In that picture, the lower Hubbard band comes mostly from removing electrons in singly-occupied sites, while the upper Hubbard band comes mostly from adding electrons to singly-occupied sites. Given the large local moment at this value of in the AF, this is consistent with the fact that these Hubbard bands are strongly spin polarized, as seen in Fig. 3f. On the other hand, the “in-gap states” come, in that same picture Eskes et al. (1991), from adding electrons in empty sites, which explains the near absence of spin polarization observed in Fig. 3f. Finally, with further doping, the lower Bogoliubov peak and the Hubbard bands decrease in intensity at the expense of the in-gap state above . These results are compatible with the variational approach in Ref. Wu and Lee, 2017.
Stability of the Néel phase. – To assess the origin of the stability of the AF phase, we compare the kinetic, potential and total energy differences between the AF phase and the underlying normal phase Taranto et al. (2012); Tocchio et al. (2016); Fratino et al. (2017) as a function of doping at low . Fig. 3d,h shows that the crossover in the source of stability of the AF phase that we identified earlier Fratino et al. (2017) at persists for all doping levels. Therefore the hidden Mott transition at reorganises the energetics both of the AF-I at and of the AF-M away from .
Discussion. – Our results are relevant for experiments with ultracold atoms and with cuprates. The first observation of the AF phase in a 2D square optical lattice appeared recently Mazurenko et al. (2017). Persistence of AF correlations was found up to for and . Consistency of this finding with our results is promising. Our map of the AF phase can be explored further with ultracold atom systems since , and can be tuned. Specifically the nonmonotonic behavior of , along with stronger reduction of with increasing at small , are testable predictions.
When comparing our map with experiments on hole-doped cuprates, one should focus on the multilayer case where interlayer magnetic exchange favors mean-field like behavior. In the CuO2 layer cuprates, AF persists up to and it decreases with decreasing Mukuda et al. (2008, 2012). Our predictions for could be compared with neutron scattering and muon spin rotation experiments in this regime. Other effects that we did not take into account and that can decrease are the development of incommensurate spin-density waves and competition with other phases.
The curve and the resulting charge compressibility that describes the continuous transition between an AF insulator and an AF metal as a function of doping is another prediction that can be tested with ultracold atoms. In principle, such measurements are also possible in cuprates Ino et al. (1997); Harima et al. (2003); Rietveld et al. (1992); van der Marel and Rietveld (1992).
The in-gap state feature that we found in the DOS has a position and a width that is compatible with recent scanning tunnelling microscopy experiments on lightly doped AF Mott insulators Cai et al. (2016); Ye et al. (2013). In addition, the observed transfer of spectral weight from high energy to low energy as a function of doping is consistent with our results. We predict that a spin-polarized STM probe will find that these states are essentially unpolarized, by contrast with the lower and upper Hubbard bands 222In these experiments, the DOS at vanishes while it in our case it is small. The inhomogeneity of the samples suggests that disorder can induce localisation effects at , as pointed out in Ref. Wu and Lee, 2017. The AF phase of cuprates at finite doping is generally considered metallic Ando et al. (2001)..
Our prediction that the doped AF state is stabilized by a gain in kinetic energy for large and by a gain in potential energy for small can in principle be tested by optical spectroscopy in cuprates Molegraaf et al. (2002); Deutscher et al. (2005); Carbone et al. (2006). If the correlation strength is lower in electron that in hole doped cuprates, as has been proposed Sénéchal and Tremblay (2004); Weber et al. (2010a), our data suggest a potential energy driven AF in electron doped cuprates and a kinetic energy driven AF in hole doped cuprates, similar to earlier findings on the Emery model Weber et al. (2010b).
Moving forwards, it will be important to study the interplay between antiferromagnetism, pseudogap and superconductivity Sordi et al. (2010, 2011, 2012, 2013); Fratino et al. (2016a, b).
Acknowledgements.
We acknowledge discussion with D. Sénéchal and K. Miyake. This work has been supported by the Natural Sciences and Engineering Research Council of Canada (NSERC) under grant RGPIN-2014-04584, the Canada First Research Excellence Fund and by the Research Chair in the Theory of Quantum Materials. Simulations were performed on computers provided by the Canadian Foundation for Innovation, the Ministère de l’Éducation des Loisirs et du Sport (Québec), Calcul Québec, and Compute Canada.References
- Keimer et al. (2015) B. Keimer, S. A. Kivelson, M. R. Norman, S. Uchida, and J. Zaanen, Nature 518, 179 (2015).
- Anderson (1987) P. W. Anderson, Science 235, 1196 (1987).
- Jaksch and Zoller (2005) D. Jaksch and P. Zoller, Ann. Phys. 315, 52 (2005).
- Tremblay (2013) A.-M. S. Tremblay, in Emergent Phenomena in Correlated Matter Modeling and Simulation, Vol. 3, edited by E. Pavarini, E. Koch, and U. Schollwöck (Verlag des Forschungszentrum, Jülich, 2013) Chap. 10.
- Georges and Giamarchi (2010) A. Georges and T. Giamarchi, in Many-body Physics with Ultracold Gases, Vol. 94, edited by C. Salomon, G. Shlyapnikov, and L. Cugliandolo (Oxford University Press, Les Houches, 2010) Chap. 1.
- Maier et al. (2005) T. Maier, M. Jarrell, T. Pruschke, and M. H. Hettler, Rev. Mod. Phys. 77, 1027 (2005).
- Kotliar et al. (2006) G. Kotliar, S. Y. Savrasov, K. Haule, V. S. Oudovenko, O. Parcollet, and C. A. Marianetti, Rev. Mod. Phys. 78, 865 (2006).
- Tremblay et al. (2006) A.-M. S. Tremblay, B. Kyung, and D. Sénéchal, Low Temp. Phys. 32, 424 (2006).
- Greif et al. (2013) D. Greif, T. Uehlinger, G. Jotzu, L. Tarruell, and T. Esslinger, Science 340, 1307 (2013).
- Hart et al. (2015) R. A. Hart, P. M. Duarte, T.-L. Yang, X. Liu, T. Paiva, E. Khatami, R. T. Scalettar, N. Trivedi, D. A. Huse, and R. G. Hulet, Nature 519, 211 (2015).
- Parsons et al. (2016) M. F. Parsons, A. Mazurenko, C. S. Chiu, G. Ji, D. Greif, and M. Greiner, Science 353, 1253 (2016).
- Boll et al. (2016) M. Boll, T. A. Hilker, G. Salomon, A. Omran, J. Nespolo, L. Pollet, I. Bloch, and C. Gross, Science 353, 1257 (2016).
- Cheuk et al. (2016) L. W. Cheuk, M. A. Nichols, K. R. Lawrence, M. Okan, H. Zhang, E. Khatami, N. Trivedi, T. Paiva, M. Rigol, and M. W. Zwierlein, Science 353, 1260 (2016).
- Mazurenko et al. (2017) A. Mazurenko, C. S. Chiu, G. Ji, M. F. Parsons, M. Kanász-Nagy, R. Schmidt, F. Grusdt, E. Demler, D. Greif, and M. Greiner, Nature 545, 462 (2017).
- Drewes et al. (2017) J. H. Drewes, L. A. Miller, E. Cocchi, C. F. Chan, N. Wurz, M. Gall, D. Pertot, F. Brennecke, and M. Köhl, Phys. Rev. Lett. 118, 170401 (2017).
- Cai et al. (2016) P. Cai, W. Ruan, Y. Peng, C. Ye, X. Li, Z. Hao, X. Zhou, D.-H. Lee, and Y. Wang, Nature Physics 12, 1047 (2016), arXiv:1508.05586 [cond-mat.supr-con] .
- Ye et al. (2013) C. Ye, P. Cai, R. Yu, X. Zhou, W. Ruan, Q. Liu, C. Jin, and Y. Wang, Nature Communications 4, 1365 (2013), arXiv:1201.0342 [cond-mat.str-el] .
- Borejsza and Dupuis (2004) K. Borejsza and N. Dupuis, Phys. Rev. B 69, 085119 (2004).
- Sénéchal et al. (2005) D. Sénéchal, P.-L. Lavertu, M.-A. Marois, and A.-M. S. Tremblay, Phys. Rev. Lett. 94, 156404 (2005).
- Aichhorn, M. and Arrigoni, E. (2005) Aichhorn, M. and Arrigoni, E., Europhys. Lett. 72, 117 (2005).
- Aichhorn et al. (2007) M. Aichhorn, E. Arrigoni, M. Potthoff, and W. Hanke, Phys. Rev. B 76, 224509 (2007).
- Tocchio et al. (2016) L. F. Tocchio, F. Becca, and S. Sorella, Phys. Rev. B 94, 195126 (2016).
- Zheng and Chan (2016) B.-X. Zheng and G. K.-L. Chan, Phys. Rev. B 93, 035126 (2016).
- Hirsch (1985) J. E. Hirsch, Phys. Rev. B 31, 4403 (1985).
- White et al. (1989) S. R. White, D. J. Scalapino, R. L. Sugar, E. Y. Loh, J. E. Gubernatis, and R. T. Scalettar, Phys. Rev. B 40, 506 (1989).
- Lichtenstein and Katsnelson (2000) A. I. Lichtenstein and M. I. Katsnelson, Phys. Rev. B 62, R9283 (2000).
- Paiva et al. (2001) T. Paiva, R. T. Scalettar, C. Huscroft, and A. K. McMahan, Phys. Rev. B 63, 125116 (2001).
- Kyung et al. (2006) B. Kyung, S. S. Kancharla, D. Sénéchal, A.-M. S. Tremblay, M. Civelli, and G. Kotliar, Phys. Rev. B 73, 165114 (2006).
- Paiva et al. (2010) T. Paiva, R. Scalettar, M. Randeria, and N. Trivedi, Phys. Rev. Lett. 104, 066406 (2010).
- Sato and Tsunetsugu (2016) T. Sato and H. Tsunetsugu, Phys. Rev. B 94, 085110 (2016).
- Ayral and Parcollet (2015) T. Ayral and O. Parcollet, Phys. Rev. B 92, 115109 (2015).
- Ayral and Parcollet (2016a) T. Ayral and O. Parcollet, Phys. Rev. B 93, 235124 (2016a).
- Ayral and Parcollet (2016b) T. Ayral and O. Parcollet, Phys. Rev. B 94, 075159 (2016b).
- Rohringer et al. (2017) G. Rohringer, H. Hafermann, A. Toschi, A. A. Katanin, A. E. Antipov, M. I. Katsnelson, A. I. Lichtenstein, A. N. Rubtsov, and K. Held, ArXiv e-prints (2017), arXiv:1705.00024 [cond-mat.str-el] .
- Note (1) See Supplemental Material for the staggered magnetization curves as a function of and for few temperatures; complementary data for the local DOS.
- Georges et al. (1996) A. Georges, G. Kotliar, W. Krauth, and M. J. Rozenberg, Rev. Mod. Phys. 68, 13 (1996).
- Fratino et al. (2017) L. Fratino, P. Sémon, M. Charlebois, G. Sordi, and A.-M. S. Tremblay, Phys. Rev. B 95, 235109 (2017).
- Gull et al. (2011) E. Gull, A. J. Millis, A. I. Lichtenstein, A. N. Rubtsov, M. Troyer, and P. Werner, Rev. Mod. Phys. 83, 349 (2011).
- Sémon et al. (2014a) P. Sémon, C.-H. Yee, K. Haule, and A.-M. S. Tremblay, Phys. Rev. B 90, 075149 (2014a).
- Sémon and Tremblay (2012) P. Sémon and A.-M. S. Tremblay, Phys. Rev. B 85, 201101 (2012).
- Sémon et al. (2014b) P. Sémon, G. Sordi, and A.-M. S. Tremblay, Phys. Rev. B 89, 165113 (2014b).
- Mermin and Wagner (1966) N. D. Mermin and H. Wagner, Phys. Rev. Lett. 17, 1133 (1966).
- Hohenberg (1967) P. C. Hohenberg, Phys. Rev. 158, 383 (1967).
- Schrieffer et al. (1989) J. R. Schrieffer, X. G. Wen, and S. C. Zhang, Phys. Rev. B 39, 11663 (1989).
- Georges and Krauth (1993) A. Georges and W. Krauth, Phys. Rev. B 48, 7167 (1993).
- Freericks and Jarrell (1995) J. K. Freericks and M. Jarrell, Phys. Rev. Lett. 74, 186 (1995).
- Hofstetter and Vollhardt (1998) W. Hofstetter and D. Vollhardt, Annalen der Physik 7, 48 (1998).
- Chitra and Kotliar (1999) R. Chitra and G. Kotliar, Phys. Rev. Lett. 83, 2386 (1999).
- Zitzler et al. (2004) R. Zitzler, N.-H. Tong, T. Pruschke, and R. Bulla, Phys. Rev. Lett. 93, 016406 (2004).
- Kanamori (1963) J. Kanamori, Progress of Theoretical Physics 30, 275 (1963).
- Brueckner et al. (1960) K. A. Brueckner, T. Soda, P. W. Anderson, and P. Morel, Phys. Rev. 118, 1442 (1960).
- Vilk and Tremblay (1997) Y. M. Vilk and A.-M. S. Tremblay, J. Phys I (France) 7, 1309 (1997).
- Yang et al. (2000) I. Yang, E. Lange, and G. Kotliar, Phys. Rev. B 61, 2521 (2000).
- Camjayi et al. (2006) A. Camjayi, R. Chitra, and M. J. Rozenberg, Phys. Rev. B 73, 041103 (2006).
- Bergeron and Tremblay (2016) D. Bergeron and A.-M. S. Tremblay, Phys. Rev. E 94, 023303 (2016).
- Moreo et al. (1995) A. Moreo, S. Haas, A. W. Sandvik, and E. Dagotto, Phys. Rev. B 51, 12045 (1995).
- Preuss et al. (1995) R. Preuss, W. Hanke, and W. von der Linden, Phys. Rev. Lett. 75, 1344 (1995).
- Eskes et al. (1991) H. Eskes, M. B. J. Meinders, and G. A. Sawatzky, Phys. Rev. Lett. 67, 1035 (1991).
- Wu and Lee (2017) H.-K. Wu and T.-K. Lee, Phys. Rev. B 95, 035133 (2017).
- Taranto et al. (2012) C. Taranto, G. Sangiovanni, K. Held, M. Capone, A. Georges, and A. Toschi, Phys. Rev. B 85, 085124 (2012).
- Mukuda et al. (2008) H. Mukuda, Y. Yamaguchi, S. Shimizu, Y. Kitaoka, P. Shirage, and A. Iyo, Journal of the Physical Society of Japan 77, 124706 (2008), http://dx.doi.org/10.1143/JPSJ.77.124706 .
- Mukuda et al. (2012) H. Mukuda, S. Shimizu, A. Iyo, and Y. Kitaoka, Journal of the Physical Society of Japan 81, 011008 (2012).
- Ino et al. (1997) A. Ino, T. Mizokawa, A. Fujimori, K. Tamasaku, H. Eisaki, S. Uchida, T. Kimura, T. Sasagawa, and K. Kishio, Phys. Rev. Lett. 79, 2101 (1997).
- Harima et al. (2003) N. Harima, A. Fujimori, T. Sugaya, and I. Terasaki, Phys. Rev. B 67, 172501 (2003).
- Rietveld et al. (1992) G. Rietveld, N. Y. Chen, and D. van der Marel, Phys. Rev. Lett. 69, 2578 (1992).
- van der Marel and Rietveld (1992) D. van der Marel and G. Rietveld, Phys. Rev. Lett. 69, 2575 (1992).
- Note (2) In these experiments, the DOS at vanishes while it in our case it is small. The inhomogeneity of the samples suggests that disorder can induce localisation effects at , as pointed out in Ref. \rev@citealpnumwuAFevolution. The AF phase of cuprates at finite doping is generally considered metallic Ando et al. (2001).
- Molegraaf et al. (2002) H. J. A. Molegraaf, C. Presura, D. van der Marel, P. H. Kes, and M. Li, Science 295, 2239 (2002).
- Deutscher et al. (2005) G. Deutscher, A. F. Santander-Syro, and N. Bontemps, Phys. Rev. B 72, 092504 (2005).
- Carbone et al. (2006) F. Carbone, A. B. Kuzmenko, H. J. A. Molegraaf, E. van Heumen, V. Lukovac, F. Marsiglio, D. van der Marel, K. Haule, G. Kotliar, H. Berger, S. Courjault, P. H. Kes, and M. Li, Phys. Rev. B 74, 064510 (2006).
- Sénéchal and Tremblay (2004) D. Sénéchal and A.-M. S. Tremblay, Phys. Rev. Lett. 92, 126401 (2004).
- Weber et al. (2010a) C. Weber, K. Haule, and G. Kotliar, Nature Physics 6, 574 (2010a).
- Weber et al. (2010b) C. Weber, K. Haule, and G. Kotliar, Phys. Rev. B 82, 125107 (2010b).
- Sordi et al. (2010) G. Sordi, K. Haule, and A.-M. S. Tremblay, Phys. Rev. Lett. 104, 226402 (2010).
- Sordi et al. (2011) G. Sordi, K. Haule, and A.-M. S. Tremblay, Phys. Rev. B 84, 075161 (2011).
- Sordi et al. (2012) G. Sordi, P. Sémon, K. Haule, and A.-M. S. Tremblay, Sci. Rep. 2, 547 (2012).
- Sordi et al. (2013) G. Sordi, P. Sémon, K. Haule, and A.-M. S. Tremblay, Phys. Rev. B 87, 041101 (2013).
- Fratino et al. (2016a) L. Fratino, P. Sémon, G. Sordi, and A.-M. S. Tremblay, Sci. Rep. 6, 22715 (2016a).
- Fratino et al. (2016b) L. Fratino, P. Sémon, G. Sordi, and A.-M. S. Tremblay, Phys. Rev. B 93, 245147 (2016b).
- Ando et al. (2001) Y. Ando, A. N. Lavrov, S. Komiya, K. Segawa, and X. F. Sun, Phys. Rev. Lett. 87, 017001 (2001).
Supplemental information:
Effects of interaction strength, doping, and frustration on the antiferromagnetic phase of the two-dimensional Hubbard model
L. Fratino, M. Charlebois, P. Sémon, G. Sordi, and A.-M. S. Tremblay
In this supplemental information, we first present in Fig. 1 the raw data of the staggered magnetization , to complement the colormaps in Figure 1 of the main text. We also show in Fig. 2 the raw data of to complement the antiferromagnetic boundaries of the Figure 2 of the main text. Finally, Fig. 3 and Fig. LABEL:fig4 display the density of states for different values of hole doping , to extend data shown in Figures 3(a), 3(b), 3(e), 3(f) of the main text.