First-principles study of MoS2 and MoSe2 nanoclusters in the framework of evolutionary algorithm and density functional theory
Abstract
Evolutionary algorithm is combined with full-potential ab-initio calculations to investigate conformational space of (MoS2)n and (MoSe2)n () nanoclusters and to identify the lowest energy structural isomers of these systems. It is argued that within both BLYP and PBE functionals, these nanoclusters favor sandwiched planar configurations, similar to their ideal planar sheets. The second order difference in total energy (E) of the lowest energy isomers are computed to estimate the abundance of the clusters at different sizes and to determine the magic sizes of (MoS2)n and (MoSe2)n nanoclusters. In order to investigate the electronic properties of nanoclusters, their energy gap is calculated by several methods, including hybrid functionals (B3LYP and PBE0), GW approach, and scf method. At the end, the vibrational modes of the lowest lying isomers are calculated by using the force constants method and the IR active modes of the systems are identified. The vibrational spectra are used to calculate the Helmholtz free energy of the systems and then to investigate abundance of the nanoclusters at finite temperatures.
I Introduction
Transition Metal Dichalcogenides (TMDCs) with chemical formula MX2 are semiconducting compounds made of hexagonal sheets, where inside a sheet one layer of metal atom M (Mo, W, Ga, V, Sn, Te) is sandwiched between two layers of chalcogen atom X (S, Se, Te). The weak Van der Waals interaction between MX2 sheets provides the opportunity to extract two dimensional (2D) semiconductors with fascinating applications in supercapacitors Muller et al. (2015); Huang et al. (2013), solar cells Ellmer (2008); Patel et al. (2011); Tsai et al. (2014); Gawale et al. (2010); Tributsch (1978), lithium batteries David, Bhandavat, and Singh (2014); Rouxel and Brec (1986); Bhandavat, David, and Singh (2012); Xiao et al. (2010), hydrogen evolution in fuel cells Kong et al. (2013); Chen et al. (2013), optoelectronics devices Mak et al. (2010); Ross et al. (2014); Lopez-Sanchez et al. (2013); Wang et al. (2012); Tian et al. (2014) and gas sensor Wang et al. (2012); Late, Doneux, and Bougouma (2014). Energy gap of these 2D semiconductors lies between 1-2 eV and compared with graphene, exhibit about 25% more resistance to pressure and strain He et al. (2013).
In addition to the 2D MX2 sheets, other forms of MX2 nanostructures have also attracted considerable attention Parsapour et al. (1996); Chikan et al. (2000). Nanoparticles of these materials exhibit great potential applications as catalysts in hydrogen evolution reaction and hydrogen desulfurization Lauritsen et al. (2003); Hinnemann et al. (2005); McBride and Head (2009); Lauritsen et al. (2004); Liu et al. (2016); Tang et al. (2014). For instance, MoS2 nanoparticles have been used as catalyst in desulfurization processes of raw oil Zhu (2013); Chianelli et al. (2006). MoSe2 nanofilms and nanosheets may also catalyze hydrogen evolution reaction and regeneration of I- species Lee et al. (2014). Very recently biosensor applications of MoS2 nanocomposites were also reported Zhang et al. (2015). Moreover, the high chemical stability of these nanostructures make them very proper lubricants in strongly oxidizing environments Cizaire et al. (2002); Gemming et al. (2006).
In this work we investigate structural and electronic properties of MoS2 and MoSe2 nanoclusters. Experimental observations show that these nanoclusters at large sizes prefer triangular flat plates shape Lauritsen et al. (2007a); Li and Galli (2007); Helveg et al. (2000); Bertram et al. (2006). However, the available experimental techniques may not be able to identify the atomic structure of very small clusters, hence accurate computational simulations are valuable complementary techniques for investigation of the atomic structure of very small atomic nanoclusters Seifert et al. (2000); Cizaire et al. (2002); Murugan et al. (2007, 2005). Recent proposed algorithm for theoretical structure search are found to be very powerful and reliable for identifying the most stable and metastable atomic configuration of crystals and nanostructures Chuang, Wang, and Ho (2006); Oganov and Glass (2008). We will use evolutionary algorithm and first-principles calculations to identify the lowest energy atomic configurations of (MoX2)n (X = S, Se) nanoclusters for . After finding the lowest energy configurations, the magic numbers, electronic properties, and vibrational spectra of these nanoclusters will be discussed in detail.
II Computational details
Our structure search was performed in the framework of evolutionary algorithm developed by Oganov et al. and featuring local optimization, real-space representation and flexible physically motivated variation operators Oganov and Glass (2006); Lyakhov et al. (2013); Oganov, Lyakhov, and Valle (2011). This approach starts with a generation of trial structures, which are randomly generated or taken from some seed structures, and utilizes an auxiliary total energy code to minimize the energy of the structures. Then a series of refining and production operators such as heredity and mutation are applied to the lowest energy structures of the previous generation to create an improved generation of trial structures. This process is repeated until achieving a stop criteria, which is persistence of a specific number of lowest lying (in energy) structures in a certain number of generations. In order to avoid algorithm to be trapped in the local valleys of the Born-Oppenheimer energy landscape Glass, Oganov, and Hansen (2006); Lyakhov et al. (2013), proper operators for detecting and deleting equivalent structures before structural optimization was applied. For bigger clusters, more diverse structures are possible, and more cases should be investigated. So, in order to ensure the reliability of the structure search, we increased the value of population size from 10 to 45, and used stricter stop criteria, meaning that the number of generations and lowest energy isomers in the stop criterion were increased from 15 to 55 and from 8 to 15, respectively. It should be noted that for generating a new population of trial structures, during the structure searches, 50% of the new structures were generated by heredity operator, 10% by random operator, 10% by permutation, and 20% by softmutation operator. Moreover, the structures obtained from Ref.Murugan et al. (2005) have been added to our structure search, as seed structures.
The total energy calculations and minimizations of structures were performed in the framework of Kohn-Sham density functional theory (DFT) by using the all-electron full-potential method implemented in FHI-aims packageBlum et al. (2009); Ren et al. (2012). This code employs numeric atom-centered orbital (NAO) basis functions which are very efficient for computation of non-periodic systems. In order to increase the computational performance, the geometrical relaxation of the clusters was done in four steps: initial relaxation with a light basis set, ignoring relativistic and spin-polarization effects, secondary relaxation by turning on the relativistic effects at scalar level and a tighter basis set, third step with addition of spin-polarization effect, and final relaxation with a higher number of basis functions (tight+tier2). The relaxation process of all structures was performed down to residual atomic forces of less than eV/Å, while for calculating vibrational frequencies and IR spectra of the lowest energy isomers, a maximum atomic force of eV/Å, was considered.
The structural relaxations were performed within Becke-Lee-Yang-Parr (BLYP)Becke (1988); Lee, Yang, and Parr (1988) functional, which, compared with Perdew-Burke-Ernzerhof (PBE) functional, sounds to be more accurate for studying molecular systems. Martin (2004); Koch and Holthausen (2015). It is argued that computational error of exchange energy within BLYP and PBE functionals are roughly equal, while correlation energy of molecular systems within BLYP is about 4 kcal/mol more accurate Kurth, Perdew, and Blaha (1999). For more accurate study of the electronic properties, the HOMO-LUMO gap of the lowest energy isomers was calculated within four functionals; two generalized gradient approximations (GGA), BLYP and PBE, and two hybrid functionals, namely B3LYP BecNe (1993) and PBE0 Ernzerhof and Scuseria (1999); Adamo and Barone (1999). Moreover, the many body based G0W0 and the total energy based SCF techniques were applied to increase the accuracy of the calculated energy gaps.
III Results and discussion
III.1 Stable and Metastable Isomers
The obtained lowest energy structural isomers of (MoS2)n and (MoSe2)n () clusters are shown in figures 1 and 2, respectively, sorted by their minimized energy within the BLYP functional.
In the size of , the equilibrium X-Mo-X angle in MoS2 and MoSe2 is 113o and the equilibrium Mo-X bond length is 2.13Å and 2.27Å, respectively. The larger length of Mo-Se bond is due to larger atomic radius of Se, compared with S. The Mo-S and Mo-Se bond lengths in the ideal MoX2 sheet are 2.45Å and 2.58Å respectively, which are approximately 12% longer than cluster values. Lower coordination number of atoms in the nanoclusters gives rise to compressed atomic bonds, compared with the corresponding periodic system. In contrast to Murugan et al. (2005), we found that linear configuration of these clusters are dynamically unstable.
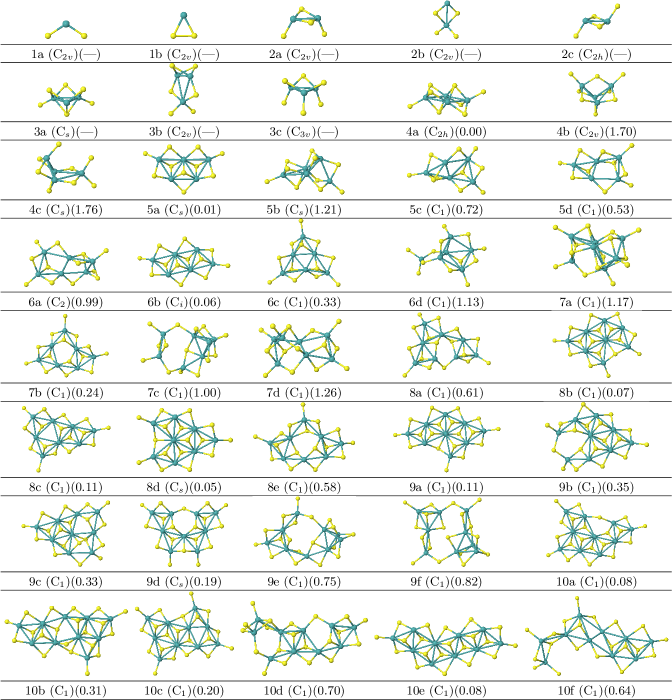
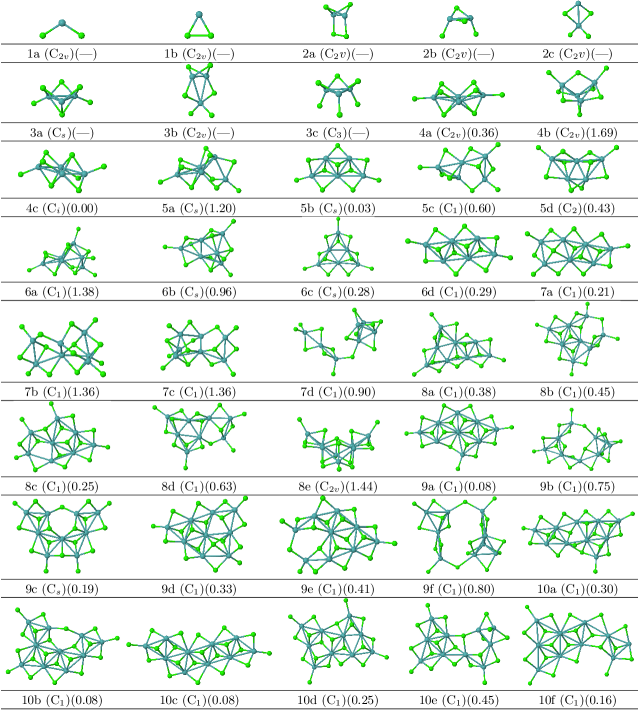
In the second size (), a direct Se-Se bond is seen in Mo2Se4, while the situation in Mo2S4 is different. It may be attributed to the lower electronegativity of Se (2.43, Allen scale), compared with S (2.58), which gives rise to less ionic charge transfer from Se to Mo and thus more chemical activity of Se ion, compared with S ion. It should be noted that the second isomer of Murugan et al. (2005) for Mo2X4 coincides with our sixth isomer, evidencing reliability of our structure search.
From the third size (), some sandwiched configurations start to appear in the lowest energy isomers. In these configurations, similar to an ideal MoX2 sheet, a plane of Mo atoms is sandwiched between layers of X atoms. The remarkable point is that with increasing the cluster size, their tendency to form two dimensional triangular structures increases. Some examples are 6b, 7b, 8b, and 8c isomers of MoS2, 6c, 6d, 7a, 8a, 8b, and 8c isomers of MoSe2, and stable and several metastable isomers of sizes 9 and 10.
For better understanding of the bonding properties of the systems, we follow the conventions of Murugan et al. (2005) to classify the X atoms of MoX2 clusters in three different groups: the X atom can bond to I. one Mo atom (terminal atom, XT), II. two Mo atoms (bridging atom, XB), and III. three Mo atoms (face capping atom, XC). Consequently, four kinds of atomic bonds may occur in the systems, Mo-Mo, Mo-XT, Mo-XB, and Mo-XC bonds. The Mo-XC bond happens at the central part of the clusters, while Mo-XB and Mo-XT bonds appear at the cluster edges and corners. Some bonding properties of MoS2 and MoSe2 clusters are presented in table 1. Generally, increment in the cluster size, increases the number of Mo-XC bonds. The average Mo-XC bond length in MoS2 and MoSe2 clusters is 2.37Å and 2.5Å, respectively, which is close to the corresponding values in the ideal sheets. It is seen that the shortest bond length in all clusters belongs to Mo-XT bonds. Lower coordination number of XT atoms enhances the strength of Mo-XT bonding, compared with Mo-XB and Mo-XC bondings.
| size | |||||
|---|---|---|---|---|---|
| 1 | — | 2.13 (2) | — | — | 1 |
| — | 2.27 (2) | — | — | 1 | |
| 2 | — | 2.14 (2) | 2.31 (2) | — | 1.5 |
| — | 2.52 (2) | 2.52 (2) | — | 1.5 | |
| 3 | 2.76 | 2.16 (2) | 2.33 (3) | 2.34 (1) | 1.8 |
| 2.78 | 2.30 (2) | 2.46 (3) | 2.50 (1) | 1.8 | |
| 4 | 2.85 | 2.15 (2) | 2.36 (4) | 2.35 (2) | 2.0 |
| 2.88 | 2.28 (2) | 2.50 (4) | 2.67 (2) | 2.0 | |
| 5 | 2.90 | 2.15 (2) | 2.36 (5) | 2.38 (3) | 2.1 |
| 2.83 | 2.28 (2) | 2.49 (7) | 2.64 (1) | 1.9 | |
| 6 | 2.96 | 2.14 (4) | 2.32 (6) | 2.37 (2) | 1.8 |
| 2.96 | 2.28 (4) | 2.49 (4) | 2.55 (4) | 2.9 | |
| 2.96 | 2.13 (5) | 2.34 (5) | 2.44 (4) | 1.9 | |
| 2.93 | 2.28 (3) | 2.53 (7) | 2.56 (4) | 2.1 | |
| 2.89 | 2.15 (3) | 2.35 (8) | 2.34 (5) | 2.1 | |
| 2.93 | 2.28 (3) | 2.53 (8) | 2.56 (5) | 2.1 | |
| 2.90 | 2.15 (3) | 2.37 (7) | 2.42 (8) | 2.2 | |
| 3.05 | 2.28 (3) | 2.51 (7) | 2.55 (8) | 2.3 | |
| 3.03 | 2.15 (3) | 2.38 (9) | 2.31 (8) | 2.6 | |
| 2.99 | 2.28 (3) | 2.51 (9) | 2.55 (8) | 2.2 |
For more accurate identification of the planar isomers, the Root Mean Square Deviation (RMSD) of Mo atoms from a perfect planar geometry for some lowest energy isomers of the clusters is calculated and listed in Figs. 1 and 2. It is generally concluded that, unlike the most stable isomers of MoS2 in previous studiesMurugan et al. (2005, 2007) which involve polyhedral core of Mo atoms covered with sulfur atoms, sandwiched planar configurations are favored by MoS2 and MoSe2 nanoclusters. Experimental observations in larger MoX2 nanoclusters () confirm favorability of flat triangular shapes in these systems Bertram et al. (2006). However, it should be noted that our predicted flat configurations are more similar to the 1T structure of TMDC sheets, which is metastable compared with the stable 2H structure of these 2D compounds. Observation of 1T configuration is attributed to the fixed stoichiometry of the investigated nanoclusters, while stabilizing 2H triangular clusters requires extra chalcogen atoms at the edges Lauritsen et al. (2007b). While direct structural observation of very small clusters is hardly feasible, our accurate structure search provides reliable evidence for favorability of flat triangular configurations even in very small MoS2 and MoSe2 nanoclusters. In contrast to carbon clusters which prefer cage-like or fullerene-like structures to saturate their surface dangling bonds, MoX2 nanoclusters tend to form planar structures with possible extra X atoms at the edges and corners to saturate dangling bonds Bertram et al. (2006).
Comparing the stable and metastable isomers of MoS2 and MoSe2 with those reported for WS2 nanoclusters Hafizi et al. (2016), clarifies that from structural point of view, MoS2 isomers are more similar to MoSe2 isomers, compared with WS2. This results reflects the importance role of transition metals in determining the stable geometry of TMDCs nanoclusters. We also noticed that, WS2 nanoclusters exhibit less tendency to planner configurations, because even at larger sizes, WS2 nanoclusters are not quite planner Hafizi et al. (2016).
| MoS2 | MoSe2 | |||
| BLYP | PBE | BLYP | PBE | |
| 2a | 2a | 2a | 2a | |
| 2b (0.31) | 2b (0.32) | 2b (0.32) | 2b (0.55) | |
| 2c (0.33) | 2c (0.34) | 2c (0.52) | 2c (0.71) | |
| 3a | 3a | 3a | 3a | |
| 3b (0.48) | 3b (0.79) | 3b (0.24) | 3b (0.55) | |
| 3c (0.66) | 3c (1.05) | 3c (0.47) | 3c (0.89) | |
| 4a | 4a | 4a | 4c | |
| 4b (0.07) | 4b (0.46) | 4b (0.01) | 4b (0.19) | |
| 4c (0.15) | 4c (0.80) | 4c (0.13) | 4a (0.19) | |
| 5a | 5a | 5a | 5b | |
| 5b (0.22) | 5b (0.64) | 5b (0.07) | 5a (0.32) | |
| 5c (0.26) | 5c (0.79) | 5c (0.28) | 5d (0.57) | |
| 5d (0.37) | 5d (1.01) | 5d (0.30) | 5c (0.81) | |
| 6a | 6b | 6a | 6a | |
| 6b (0.25) | 6c (0.73) | 6b (0.07) | 6b (0.04) | |
| 6c (0.40) | 6a (0.79) | 6c (0.09) | 6d (0.15) | |
| 6d (0.45) | 6e (0.90) | 6d (0.42) | 6c (0.10) | |
| 6e (0.47) | 6d (1.49) | |||
| 7a | 7b | 7a | 7a | |
| 7b (0.13) | 7a (0.39) | 7b (0.17) | 7e (0.71) | |
| 7c (0.25) | 7d (1.17) | 7c (0.18) | 7c (0.72) | |
| 7d (0.26) | 7c (1.23) | 7d (0.20) | 7b (0.72) | |
| 7e (0.50) | 7e (1.61) | 7e (0.21) | 7d (1.33) | |
| 8a | 8b | 8a | 8a | |
| 8b (0.01) | 8d (0.29) | 8b (0.14) | 8c (0.39) | |
| 8c (0.25) | 8a (0.54) | 8c (0.22) | 8b (0.49) | |
| 8d (0.30) | 8c (0.64) | 8d (0.26) | 8d (0.82) | |
| 8e (0.37) | 8e (1.270 | 8e (0.28) | 8e (1.05) | |
| 9a | 9a | 9a | 9a | |
| 9b (0.34) | 9c (0.55) | 9b (0.38) | 9d (0.51) | |
| 9c (0.39) | 9b (0.74) | 9c (0.39) | 9e (0.85) | |
| 9d (0.49) | 9d (1.01) | 9d (0.41) | 9c (0.97) | |
| 9e (0.59) | 9e (1.76) | 9e (0.41) | 9b (1.60) | |
| 10a | 10a | 10a | 10a | |
| 10b (0.22) | 10b (0.19) | 10b (0.09) | 10b (0.12) | |
| 10c (0.63) | 10e (0.66) | 10c (0.28) | 10c (0.25) | |
| 10d (0.70) | 10c (0.94) | 10d (0.33) | 10d (0.60) | |
| 10e (0.72) | 10d (1.74) | 10e (0.78) | 10e (1.48) | |
In order to check the effect of exchange-correlation functional on atomic configuration of MoX2 clusters, some lowest energy isomers of all nanoclusters were relaxed within the PBE and B3LYP functionals. The obtained new energy orders within these two functionals are compared with BLYP in table 2. In the case of MoS2, we observe that PBE displaces the first isomer of 6, 7 and 8 clusters, while in other sizes, most stable isomers are the same within PBE and BLYP. A more precise consideration show that the lowest energy isomers of 6, 7, and 8 clusters within BLYP are not quite flat and triangular, it seems that PBE is trying to stabilize more triangular structures. From another point of view, more flat isomers with more number of Mo-SC bonds are better favored within PBE. For example in the size of , PBE favors 6b isomer which has very small RMSD value (Figs. 1) and more number of Mo-SC bonds, compared with other isomers. Then the 6c, 6a, and 6d isomers with respectively 3, 2, and 1 Mo-SC bond, occupy the next places in the obtained energy order within PBE.
The same trend is observed in MoSe2 clusters (table 2). Compared with BLYP, PBE only displaces stable isomer of clusters 4 and 5. Some metastable structures are also displaced according to the above-mentioned trend. For example, in the size of , the first isomer is not changed within PBE, compared with BLYP, but the isomers 9d, 9e, and 9c with seven Mo-SeC bonds are more stable than 9b, within PBE. The isomer 9b has the lowest number of Mo-SeC bonds in this group. On the other hand, among the three isomers with the same number of Mo-SeC bonds, those with a more triangular shape are more stable.
Hence the general statement is that PBE, compared with BLYP, favors more flat triangular structures of MoX2 nanoclusters. It might be related to the better performance of PBE functional in description of periodic structures Martin (2004), because flat structures are closest cluster configurations to the arrangement of atoms in the ideal octahedral coordination of 1T-MoX2 sheets. We also re-calculated several isomers within the B3LYP hybrid functional and found that stability order of isomers with this functional is very similar to BLYP. The same feature has been observed for WS2 nanoclusters Hafizi et al. (2016).
It is already observed that nanoclusters of a non-magnetic material may exhibit magnetism Hafizi et al. (2016); Murugan et al. (2005). In order to find the stable magnetic state of the clusters, their total energy were minimized by considering different initial magnetization and then the lowest energy state was reported as the stable magnetic state. It was found that the lowest energy isomer of the first size () of MoS2 and MoSe2 clusters have a total spin moment of 2 , within both BLYP and PBE. The lowest energy isomer of MoSe2 clusters at all other investigated sizes are nonmagnetic, while those of MoS2 clusters at the second and sixth sizes exhibit a total spin moment of 2 , within both BLYP and PBE.
III.2 Relative Stability of Nanoclusters
In order to address the stability of the nanoclusters, their binding energy (BE) per MoX2 unit was calculated, as follows:
| (1) |
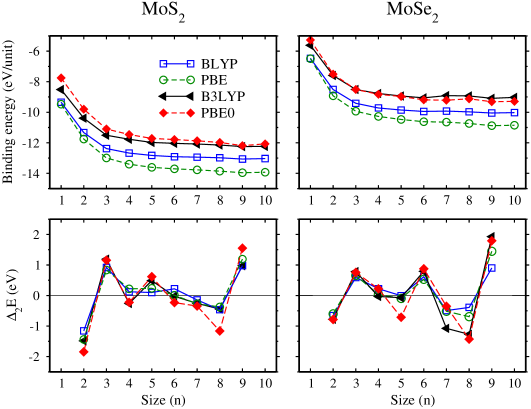
where is the minimized total energy of the most stable isomer of the cluster of size and (X) is the total energy of a free X atom. The binding energies were calculated within four different functionals and presented in Fig. 3. According to this diagram, the binding energy (BE) is a monotonic increment with size, that indicating more stability of larger clusters, which is due to the reduction of the relative number of surface dangling bonds. Taking into account the tendency of the lowest lying isomers to have planar/semi-planar configurations, it is expected that BE plots converge to the binding energy of ideal MoS2 and MoSe2 sheets, which were calculated 13.7 eV and 10.63 eV within BLYP and 15.11 eV and 11.91 eV within PBE, respectively. There is a local minimum at in all functionals, which indicates more relative stability of this size compared with neighboring sizes. In the case of MoSe2, another local minimum is visible at , while occur on a local bulge of the BE plot, indicating lower relative stability of the 7th and 8th clusters.
For more accurate description of the relative stability of the systems and identifying the small magic sizes of the nanoclusters, the second-order difference in energy is defined as follows:
| (2) |
This parameter is conventionally expected to be comparable with the mass spectrometry measurements on nanoclusters. The reason is that from a physical point of view, a positive value of indicates higher relative stability and consequently more abundance of the corresponding cluster, compared with the neighboring sizes. Hence the local peaks of the plot is expected to happen at the magic sizes of the clusters. The calculated values for MoX2 clusters within four functionals are shown in Fig. 3. It is seen that the sizes of MoS2 nanoclusters exhibit high abundance within all functionals, while the 5th cluster shows good relative stability only within hybrid functionals. On the other hand, the sizes of show very low abundance within all functionals. These findings contradict with previous reports on the magic sizes () of small MoS2 clusters Murugan et al. (2005). This is due to the different stable isomers found in this work. The lowest energy isomers in the work of Murugan et al. (2005) usually coincide with our high energy metastable isomers, found in our comprehensive systematic structure search. In the case of MoSe2 nanoclusters, all functionals predict magic sizes of , while the sizes of exhibit very low relative stability. The large value of at the 9th size of both systems along with the observed local minimum at this size in the binding energy plots, confirm that is an important magic size of MoS2 and MoSe2 nanoclusters. An interesting point is that, except for the lowest magic size (), other magic sizes occur on the systems with higher relative number of Mo-SeC bonds, compared to neighboring sizes (see table 1).
III.3 Energy Gap
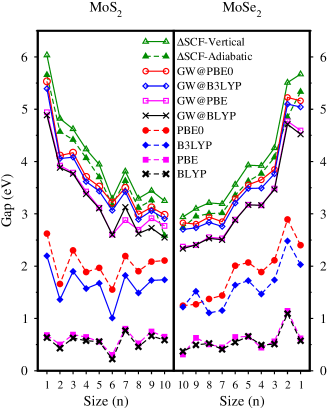
The HOMO-LUMO energy gap of the lowest energy isomers of MoX2 nanoclusters was calculated within the BLYP, PBE, B3LYP, and PBE0 functionals (Fig. 4). It is seen that PBE and BLYP give very similar and rather uniform energy gaps, while hybrid B3LYP and PBE0 functionals display significantly enhanced values. Despite the success of LDA/GGA functionals in predicting structural properties, presence of self-interaction error (SIE) gives rise to significantly underestimated energy gaps within these functionals Koch and Holthausen (2015); Ke (2011). On the other hand, hybrids functionals partially resolve the SIE problem through combination of Hartree-Fock exchange with the GGA one, thus enhancing the energy gap compared with GGA Koch and Holthausen (2015). One of the most effective methods for correcting the DFT HOMO-LUMO gap is the many-body based GW approximation Caruso et al. (2012); Marom et al. (2012); Friedrich and Schindlmayr (2006); Rinke et al. (2005); Körbel et al. (2014). In this method, a week screened coulomb interaction is switched on between the fictitious Kohn-Sham particles to perturbatively obtain the quasiparticle spectra of the system by using the Green’s function technique. We performed non-self-consistent G0W0 calculation, where the mean field Green’s function, G0, and the screened Coulomb interaction, W0, are determined from the Kohn-Sham eigenvalues and eigenvectors. Therefore, the accuracy of the non-self-consistent G0W0 calculation are sensitive to the starting point exchange-correlation functional. By proper selection of the starting point, the accuracy of the G0W0 results approaches that of the full-self-consistent GW Caruso et al. (2012). It is argued that hybrid functionals are better starting points, compared with LDA, GGA, and Hartree-Fock method for G0W0 calculation. Körbel et al. (2014); Bruneval and Marques (2012); Knight et al. (2016) However, it is observed that the calculated energy gaps of 4d and 5d materials by using the G0W0@PBE0 method show very small deviation from experiment Körbel et al. (2014).
Figure 4 displays the calculated energy gaps within different functionals after application of the many-body G0W0 correction. As expected, the G0W0 correction significantly enhances the value of the band gaps within all functionals. The enhancement is more pronounced in the smaller clusters, which is due to the lower electronic screening in these systems. As mentioned before, in the G0W0 method, a screened coulomb interaction is switched on between the Kohn-Sham particles. Therefore, lower screening in the smaller clusters enhances the effect of G0W0 correction in the energy gap. Moreover, it is seen that the G0W0 correction decreases the difference between the band gap within hybrid and GGA functionals, in such a way that after G0W0, PBE0 and B3LYP give very similar energy gaps. Hence, we deduced that B3LYP may also be a proper starting point for G0W0 calculations in the MoX2 clusters. It is observed that MoS2 nanoclusters have greater energy gap, compared with MoSe2 nanoclusters, which is due to the stronger M-X bonding in the MoS2 nanoclusters (table 1). The same trend is observed in the ideal MoS2 and MoSe2 sheets. From a qualitative point of view, energy gap is a measure of the chemical hardness of the system Kohn, Becke, and Parr (1996). The larger the band gap, the more energy required to disrupt the electronic structure of the system, and the lower chemical activity of the system.
An alternative approach for calculation of energy gap is SCF method. In this method, an electron is added to and subtracted from the neutral system, and then total energy of the ionized systems are computed to obtain the energy gap as follows:
| (3) |
If the energy of the ionized system is calculated without relaxation, (exactly at the relaxed geometry of the neutral cluster), the method is called vertical SCF, while in the adiabatic version of the method, the ionized systems are fully relaxed. This method gives very accurate energy gap for molecular systems Lee, Chai, and Lin (2015). We used adiabatic and vertical SCF technique along with the BLYP functional to calculate energy gap of MoX2 nanoclusters (Fig. 4). It is seen that adiabatic SCF gives energy gaps very close to the G0W0@PBE0 results, while vertical SCF predicts slightly larger energy gaps.
The obtained energy gap of nanoclusters displays a smooth decrease as a function of the cluster size, which may be explained by the quantum confinement effect. Quantum confinement in nanostructures enhances their energy gap with respect to the periodic structures. Since our flat stable isomers are approaching the 1T phase of the corresponding periodic systems, which is found to be metallic, the energy gap of the flat stable isomers is expected to converge to zero at large sizes.
III.4 Vibrational Frequency
The dynamical properties of the lowest lying isomers were investigated by identifying the vibrational modes of the systems in the framework of the force constant method. In this method, a finite displacement () is applied to the atomic positions of the fully relaxed structures and then the force set on the atoms is accurately computed with an error of less than 10-4 eV/Å. The obtained Hessian matrix is then diagonalized to obtain the vibrational modes and frequencies of the clusters. It should be noted that the vibrational properties are calculated within the BLYP functional. The absence of imaginary vibrational modes in the systems indicates dynamical stability of the lowest lying isomers. All presented meta-stable isomers are also expected to be dynamically stable, because these configurations are of very low symmetry, obtained through accurate structural relaxation. Generally, it is very unlikely that a low symmetry configuration of atoms traps on a saddle point of the potential energy surface after full atomic relaxation. The obtained vibrational modes are in the frequency range of and cm-1 for MoS2 and MoSe2 nanoclusters, respectively. The observed difference is due to the somewhat stronger/shorter average bonding in MoS2 with respect to MoSe2.
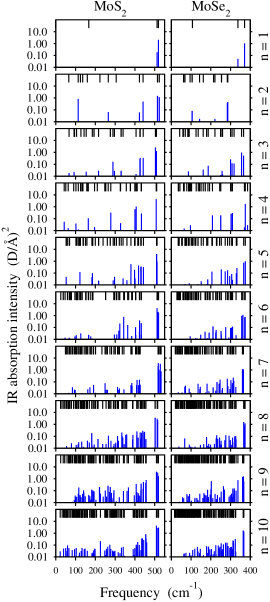
IR intensity of the lowest energy isomers at their vibrational modes are computed by considering the variation of cluster dipole moments along the vibrational modes. The obtained IR intensities, presented in Fig. 5, shows that in practice which IR photons are better absorbed and converted to thermal vibration in the systems. It is seen that the highest IR absorption happens at the high frequency modes, which corresponds to the strongest Mo-X bonds in the clusters. It was argued that among various Mo-X bonds, higher degree of hybridization happens between Mo and terminal XT atom, and hence terminal Mo-X bonds are stronger and shorter (table 1). As a result, these bonds are the origin of the hard vibrational modes of the clusters. Since these bonds are on the edges of the clusters, their dipole moment is more flexible and hence they have more IR absorption intensity. The obtained IR spectra indicate that the major part of the IR photons are thermally adsorbed by the hard edge bonds of the nanoclusters. (please note the vertical logarithmic scale in Fig. 5). The other vibrational modes, distributed below the high frequency mode, are mainly originated form the collective vibration of Mo-XB and Mo-XC bonds in the systems. Vibration of these bonds creates less polarization in the systems, compared with the terminal bonds, and hence their IR intensity is considerably lower. With increasing the cluster size, the number of Mo-XB and Mo-XC bonds is increased in the systems and hence more IR active modes are appeared in the IR spectra.
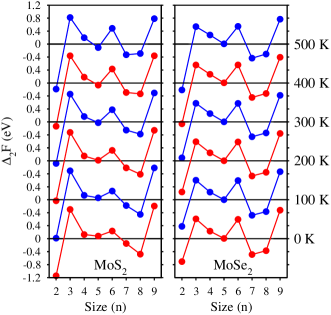
In order to investigate the influence of thermal vibrations on relative stability of the clusters at elevated temperatures, the vibrational Helmholtz free energy () of the clusters was calculated as follows:
| (4) |
where is the minimized total electronic energy of the lowest energy isomers, is the sum of the free atom energies of the system, runs over the number of vibrational modes, is the energy of the th mode, is the Boltzmann constant, is the Kelvin temperature. The second order difference in Helmholtz free energy () was calculated in different temperatures, ranging from zero to 500 K (Fig. 6). In the case of MoS2, we observe that thermal effects enhance of even clusters (except ), which is more pronounced in the 6th cluster. It is likely attributed to the more low-energy vibrational modes of the 6th cluster, compared with the neighboring systems (Fig. 5). With increasing temperature, these low-energy vibrational modes give rise to faster entropy increase and consequently faster free energy decrease of the system in such a way that above room temperature, becomes an important magic number of MoS2 nanoclusters. In the case of MoSe2 nanoclusters, slight thermal effects is seen up to 500 K and only cluster of size shows slightly enhanced relative stability at above room temperatures.
In addition to the relative stability of the isomers, thermal effects may also influence the lowest energy atomic configuration of the clusters. In other words, increasing temperature may change the stability order of the lowest energy isomers of a cluster and induce a structural transition from one isomer to another one, similar to structural transitions reported in MoX2 single layers Ambrosi, Sofer, and Pumera (2015); Duerloo, Li, and Reed (2014). In order to address this issue, we focus on the sizes of MoS2 and of MoSe2 nanoclusters, because in these systems the first metastable isomer has a very close energy to the lowest energy isomer (table 2) and hence thermal effects are expected to be more visible in these cases. The Helmholtz free energy difference between the stable and the first metastable configurations of these systems was calculated at three different temperatures, presented in table. 3. The results indicate absence of any structural transition in these systems up to 500 K, because the stable isomer remains lower in energy with respect to the first metastable isomer at temperatures below 500 K. Only in the 4th size of MoS2, we observe that the second isomer is getting very close to the first isomer at 500 K and hence one may expect a structural transition above this temperature. However, we did not continue our free energy calculations to the higher temperatures, because our vibrational studies are in the harmonic approximation limit, which might not be valid at very high temperatures.
| cluster | size | E | F | F | F |
|---|---|---|---|---|---|
| (0K) | (0K) | (300K) | (500K) | ||
| MoS2 | 4 | 73 | 49 | 29 | 5 |
| 8 | 11 | 18 | 73 | 115 | |
| MoSe2 | 4 | 7 | 3 | 9 | 45 |
| 5 | 71 | 79 | 99 | 163 | |
| 6 | 68 | 30 | 50 | 103 |
IV Conclusions
In this paper, we used evolutionary algorithm along with full potential density functional calculations to identify the stable and metastable structures of (MoS2)n and (MoSe2)n () nanoclusters. The structure search was done within the BLYP functional and then the energy order of the lower energy isomers was verified within PBE. It was argued that the clusters favor sandwiched planar triangular structures even in small sizes, similar to the ideal sheets of these systems. The results show that the lowest energy isomer is usually the same within BLYP and PBE, while PBE prefers more flat metastable structures with higher number of face capping bonds. The second-order difference in minimized energy of the systems indicate that the robust magic sizes of (MoS2)n and (MoSe2)n nanoclusters are and , respectively. It was argued that vibrational excitations at finite temperatures enhance relative stability of the 6th size of MoS2 nanoclusters to become a magic size at above room temperatures, while the magic sizes of MoS2 nanoclusters remain unchanged up to 500 K. The HOMO-LUMO energy gap of the lowest energy isomers was obtained by using the hybrid PBE0 and B3LYP functionals, the many body based G0W0 technique, and the total energy based SCF method. It was argued that G0W0@PBE0 is expected to give reliable energy gaps for the investigated nanoclusters. The energy gap of the systems was found to increase with decreasing the cluster size, because of the quantum confinement effect. Finally, we calculated the vibrational spectra and the IR active modes of the lowest energy isomers. It was revealed that the most IR absorption happens at a frequency of about 510 and 370 cm-1 in MoS2 and MoSe2 nanoclusters, respectively. These IR photons are mainly absorbed by the strong terminal Mo-S and Mo-Se bonds located at the corners of the nanoclusters.
Acknowledgements.
This work was jointly supported by the Vice Chancellor of Isfahan University of Technology (IUT) in Research Affairs and Centre of Excellence for Applied Nanotechnology. It should also be acknowledged that the first two authors have equal contributions in this paper.References
- Muller et al. (2015) G. A. Muller, J. B. Cook, H.-S. Kim, S. H. Tolbert, and B. Dunn, “High performance pseudocapacitor based on 2d layered metal chalcogenide nanocrystals,” Nano letters 15, 1911–1917 (2015).
- Huang et al. (2013) K.-J. Huang, L. Wang, Y.-J. Liu, H.-B. Wang, Y.-M. Liu, and L.-L. Wang, “Synthesis of polyaniline/2-dimensional graphene analog mos 2 composites for high-performance supercapacitor,” Electrochimica Acta 109, 587–594 (2013).
- Ellmer (2008) K. Ellmer, “Preparation routes based on magnetron sputtering for tungsten disulfide (ws2) films for thin-film solar cells,” Physica status solidi (b) 245, 1745–1760 (2008).
- Patel et al. (2011) H. Patel, J. Rathod, K. Patel, V. Pathak, and R. Srivastava, “Mose2/polyaniline solar cells,” Journal of Nano-and Electronic Physics 3, 741 (2011).
- Tsai et al. (2014) M.-L. Tsai, S.-H. Su, J.-K. Chang, D.-S. Tsai, C.-H. Chen, C.-I. Wu, L.-J. Li, L.-J. Chen, and J.-H. He, “Monolayer mos2 heterojunction solar cells,” Acs Nano 8, 8317–8322 (2014).
- Gawale et al. (2010) S. Gawale, R. Mane, S. Mane, R. Kharade, S. Patil, and P. Bhosale, “Optical and electrical transport properties of transition metal dichalcogenide mose2 thin films,” Archives of Physics Research 1, 72–80 (2010).
- Tributsch (1978) H. Tributsch, “The mose2 electrochemical solar cell: Anodic coupling of electron transfer to d→ d photo-transitions in layer crystals,” Berichte der Bunsengesellschaft für physikalische Chemie 82, 169–174 (1978).
- David, Bhandavat, and Singh (2014) L. David, R. Bhandavat, and G. Singh, “Mos2/graphene composite paper for sodium-ion battery electrodes,” ACS nano 8, 1759–1770 (2014).
- Rouxel and Brec (1986) J. Rouxel and R. Brec, “Low-dimensional chalcogenides as secondary cathodic materials: some geometric and electronic aspects,” Annual Review of Materials Science 16, 137–162 (1986).
- Bhandavat, David, and Singh (2012) R. Bhandavat, L. David, and G. Singh, “Synthesis of surface-functionalized ws2 nanosheets and performance as li-ion battery anodes,” The journal of physical chemistry letters 3, 1523–1530 (2012).
- Xiao et al. (2010) J. Xiao, D. Choi, L. Cosimbescu, P. Koech, J. Liu, and J. P. Lemmon, “Exfoliated mos2 nanocomposite as an anode material for lithium ion batteries,” Chemistry of Materials 22, 4522–4524 (2010).
- Kong et al. (2013) D. Kong, J. J. Cha, H. Wang, H. R. Lee, and Y. Cui, “First-row transition metal dichalcogenide catalysts for hydrogen evolution reaction,” Energy & Environmental Science 6, 3553–3558 (2013).
- Chen et al. (2013) T.-Y. Chen, Y.-H. Chang, C.-L. Hsu, K.-H. Wei, C.-Y. Chiang, and L.-J. Li, “Comparative study on mos 2 and ws 2 for electrocatalytic water splitting,” international journal of hydrogen energy 38, 12302–12309 (2013).
- Mak et al. (2010) K. F. Mak, C. Lee, J. Hone, J. Shan, and T. F. Heinz, “Atomically thin mos2: a new direct-gap semiconductor,” Physical Review Letters 105, 136805 (2010).
- Ross et al. (2014) J. S. Ross, P. Klement, A. M. Jones, N. J. Ghimire, J. Yan, D. Mandrus, T. Taniguchi, K. Watanabe, K. Kitamura, W. Yao, et al., “Electrically tunable excitonic light-emitting diodes based on monolayer wse2 pn junctions,” Nature nanotechnology 9, 268–272 (2014).
- Lopez-Sanchez et al. (2013) O. Lopez-Sanchez, D. Lembke, M. Kayci, A. Radenovic, and A. Kis, “Ultrasensitive photodetectors based on monolayer mos2,” Nature nanotechnology 8, 497–501 (2013).
- Wang et al. (2012) Q. H. Wang, K. Kalantar-Zadeh, A. Kis, J. N. Coleman, and M. S. Strano, “Electronics and optoelectronics of two-dimensional transition metal dichalcogenides,” Nature nanotechnology 7, 699–712 (2012).
- Tian et al. (2014) H. Tian, Z. Tan, C. Wu, X. Wang, M. A. Mohammad, D. Xie, Y. Yang, J. Wang, L.-J. Li, J. Xu, et al., “Novel field-effect schottky barrier transistors based on graphene-mos2 heterojunctions,” Scientific reports 4, 5951 (2014).
- Late, Doneux, and Bougouma (2014) D. J. Late, T. Doneux, and M. Bougouma, “Single-layer mose2 based nh3 gas sensor,” Applied physics letters 105, 233103 (2014).
- He et al. (2013) K. He, C. Poole, K. F. Mak, and J. Shan, “Experimental demonstration of continuous electronic structure tuning via strain in atomically thin mos2,” Nano letters 13, 2931–2936 (2013).
- Parsapour et al. (1996) F. Parsapour, D. Kelley, S. Craft, and J. Wilcoxon, “Electron transfer dynamics in mos2 nanoclusters: Normal and inverted behavior,” The Journal of chemical physics 104, 4978–4987 (1996).
- Chikan et al. (2000) V. Chikan, M. Waterland, J. Huang, and D. Kelley, “Relaxation and electron transfer dynamics in bare and dtdci sensitized mos 2 nanoclusters,” The Journal of Chemical Physics 113, 5448–5456 (2000).
- Lauritsen et al. (2003) J. V. Lauritsen, M. Nyberg, R. T. Vang, M. Bollinger, B. Clausen, H. Topsøe, K. W. Jacobsen, E. Lægsgaard, J. Nørskov, and F. Besenbacher, “Chemistry of one-dimensional metallic edge states in mos2 nanoclusters,” Nanotechnology 14, 385 (2003).
- Hinnemann et al. (2005) B. Hinnemann, P. G. Moses, J. Bonde, K. P. Jørgensen, J. H. Nielsen, S. Horch, I. Chorkendorff, and J. K. Nørskov, “Biomimetic hydrogen evolution: Mos2 nanoparticles as catalyst for hydrogen evolution,” Journal of the American Chemical Society 127, 5308–5309 (2005).
- McBride and Head (2009) K. L. McBride and J. D. Head, “Dft investigation of mos2 nanoclusters used as desulfurization catalysts,” International Journal of Quantum Chemistry 109, 3570–3582 (2009).
- Lauritsen et al. (2004) J. Lauritsen, M. Bollinger, E. Lægsgaard, K. W. Jacobsen, J. K. Nørskov, B. Clausen, H. Topsøe, and F. Besenbacher, “Atomic-scale insight into structure and morphology changes of mos2 nanoclusters in hydrotreating catalysts,” Journal of Catalysis 221, 510–522 (2004).
- Liu et al. (2016) Y. Liu, L. Ren, Z. Zhang, X. Qi, H. Li, and J. Zhong, “3d binder-free mose2 nanosheets/carbon cloth electrodes for efficient and stable hydrogen evolution prepared by simple electrophoresis deposition strategy,” Scientific reports 6 (2016).
- Tang et al. (2014) H. Tang, K. Dou, C.-C. Kaun, Q. Kuang, and S. Yang, “Mose2 nanosheets and their graphene hybrids: synthesis, characterization and hydrogen evolution reaction studies,” Journal of Materials Chemistry A 2, 360–364 (2014).
- Zhu (2013) Y. Q. Zhu, “Experimental study on unsupported nano-mos2 catalyst for deep desulfurization fuel oil,” in Advanced Materials Research, Vol. 739 (Trans Tech Publ, 2013) pp. 16–20.
- Chianelli et al. (2006) R. R. Chianelli, M. H. Siadati, M. P. De la Rosa, G. Berhault, J. P. Wilcoxon, R. Bearden Jr, and B. L. Abrams, “Catalytic properties of single layers of transition metal sulfide catalytic materials,” Catalysis Reviews 48, 1–41 (2006).
- Lee et al. (2014) L. T. L. Lee, J. He, B. Wang, Y. Ma, K. Y. Wong, Q. Li, X. Xiao, and T. Chen, “Few-layer mose2 possessing high catalytic activity towards iodide/tri-iodide redox shuttles,” Scientific reports 4, 4063 (2014).
- Zhang et al. (2015) W. Zhang, P. Zhang, Z. Su, and G. Wei, “Synthesis and sensor applications of mos2-based nanocomposites,” Nanoscale 7, 18364–18378 (2015).
- Cizaire et al. (2002) L. Cizaire, B. Vacher, T. Le Mogne, J. Martin, L. Rapoport, A. Margolin, and R. Tenne, “Mechanisms of ultra-low friction by hollow inorganic fullerene-like mos 2 nanoparticles,” Surface and Coatings Technology 160, 282–287 (2002).
- Gemming et al. (2006) S. Gemming, J. Tamuliene, G. Seifert, N. Bertram, Y. D. Kim, and G. Ganteför, “Electronic and geometric structures of moxsy and wxsy (x= 1, 2, 4; y= 1–12) clusters,” Applied Physics A: Materials Science & Processing 82, 161–166 (2006).
- Lauritsen et al. (2007a) J. V. Lauritsen, J. Kibsgaard, S. Helveg, H. Topsøe, B. S. Clausen, E. Lægsgaard, and F. Besenbacher, “Size-dependent structure of mos2 nanocrystals,” Nature nanotechnology 2, 53–58 (2007a).
- Li and Galli (2007) T. Li and G. Galli, “Electronic properties of mos2 nanoparticles,” The Journal of Physical Chemistry C 111, 16192–16196 (2007).
- Helveg et al. (2000) S. Helveg, J. V. Lauritsen, E. Lægsgaard, I. Stensgaard, J. K. Nørskov, B. Clausen, H. Topsøe, and F. Besenbacher, “Atomic-scale structure of single-layer mos 2 nanoclusters,” Physical review letters 84, 951 (2000).
- Bertram et al. (2006) N. Bertram, J. Cordes, Y. D. Kim, G. Ganteför, S. Gemming, and G. Seifert, “Nanoplatelets made from mos 2 and ws 2,” Chemical physics letters 418, 36–39 (2006).
- Seifert et al. (2000) G. Seifert, H. Terrones, M. Terrones, G. Jungnickel, and T. Frauenheim, “Structure and electronic properties of mos2 nanotubes,” Physical Review Letters 85, 146 (2000).
- Murugan et al. (2007) P. Murugan, V. Kumar, Y. Kawazoe, and N. Ota, “Understanding the structural stability of compound mo-s clusters at sub-nanometer level,” Materials transactions 48, 658–661 (2007).
- Murugan et al. (2005) P. Murugan, V. Kumar, Y. Kawazoe, and N. Ota, “Atomic structures and magnetism in small mos 2 and ws 2 clusters,” Physical Review A 71, 063203 (2005).
- Chuang, Wang, and Ho (2006) F.-c. Chuang, C. Wang, and K. Ho, “Structure of neutral aluminum clusters al n (2⩽ n⩽ 23): Genetic algorithm tight-binding calculations,” Physical Review B 73, 125431 (2006).
- Oganov and Glass (2008) A. R. Oganov and C. W. Glass, “Evolutionary crystal structure prediction as a tool in materials design,” Journal of Physics: Condensed Matter 20, 064210 (2008).
- Oganov and Glass (2006) A. R. Oganov and C. W. Glass, “Crystal structure prediction using ab initio evolutionary techniques: Principles and applications,” The Journal of chemical physics 124, 244704 (2006).
- Lyakhov et al. (2013) A. O. Lyakhov, A. R. Oganov, H. T. Stokes, and Q. Zhu, “New developments in evolutionary structure prediction algorithm uspex,” Computer Physics Communications 184, 1172–1182 (2013).
- Oganov, Lyakhov, and Valle (2011) A. R. Oganov, A. O. Lyakhov, and M. Valle, “How evolutionary crystal structure prediction works–and why,” Accounts of chemical research 44, 227–237 (2011).
- Glass, Oganov, and Hansen (2006) C. W. Glass, A. R. Oganov, and N. Hansen, “Uspex—evolutionary crystal structure prediction,” Computer Physics Communications 175, 713–720 (2006).
- Blum et al. (2009) V. Blum, R. Gehrke, F. Hanke, P. Havu, V. Havu, X. Ren, K. Reuter, and M. Scheffler, “Ab initio molecular simulations with numeric atom-centered orbitals,” Computer Physics Communications 180, 2175–2196 (2009).
- Ren et al. (2012) X. Ren, P. Rinke, V. Blum, J. Wieferink, A. Tkatchenko, A. Sanfilippo, K. Reuter, and M. Scheffler, “Resolution-of-identity approach to hartree–fock, hybrid density functionals, rpa, mp2 and gw with numeric atom-centered orbital basis functions,” New Journal of Physics 14, 053020 (2012).
- Becke (1988) A. D. Becke, “A multicenter numerical integration scheme for polyatomic molecules,” The Journal of chemical physics 88, 2547–2553 (1988).
- Lee, Yang, and Parr (1988) C. Lee, W. Yang, and R. G. Parr, “Development of the colle-salvetti correlation-energy formula into a functional of the electron density,” Physical review B 37, 785 (1988).
- Martin (2004) R. M. Martin, Electronic structure: basic theory and practical methods (Cambridge university press, 2004).
- Koch and Holthausen (2015) W. Koch and M. C. Holthausen, A chemist’s guide to density functional theory (John Wiley & Sons, 2015).
- Kurth, Perdew, and Blaha (1999) S. Kurth, J. P. Perdew, and P. Blaha, “Molecular and solid-state tests of density functional approximations: Lsd, ggas, and meta-ggas,” International journal of quantum chemistry 75, 889–909 (1999).
- BecNe (1993) A. BecNe, “Densityfunctional thermochemistry. iii. the role of exact exchange,” J. Chem. Phys 98, 5648–5652 (1993).
- Ernzerhof and Scuseria (1999) M. Ernzerhof and G. E. Scuseria, “Assessment of the perdew–burke–ernzerhof exchange-correlation functional,” The Journal of chemical physics 110, 5029–5036 (1999).
- Adamo and Barone (1999) C. Adamo and V. Barone, “Toward reliable density functional methods without adjustable parameters: The pbe0 model,” The Journal of chemical physics 110, 6158–6170 (1999).
- Bode and Gordon (1998) B. M. Bode and M. S. Gordon, “Macmolplt: a graphical user interface for gamess,” Journal of Molecular Graphics and Modelling 16, 133–138 (1998).
- Lauritsen et al. (2007b) J. V. Lauritsen, J. Kibsgaard, S. Helveg, H. Topsøe, B. S. Clausen, E. Lægsgaard, and F. Besenbacher, “Size-dependent structure of mos2 nanocrystals,” Nature nanotechnology 2, 53–58 (2007b).
- Hafizi et al. (2016) R. Hafizi, S. J. Hashemifar, M. Alaei, M. Jangrouei, and H. Akbarzadeh, “Stable isomers and electronic, vibrational, and optical properties of ws2 nano-clusters: A first-principles study,” The Journal of Chemical Physics 145, 214303 (2016).
- Ke (2011) S.-H. Ke, “All-electron gw methods implemented in molecular orbital space: Ionization energy and electron affinity of conjugated molecules,” Physical Review B 84, 205415 (2011).
- Caruso et al. (2012) F. Caruso, P. Rinke, X. Ren, M. Scheffler, and A. Rubio, “Unified description of ground and excited states of finite systems: The self-consistent gw approach,” Physical Review B 86, 081102 (2012).
- Marom et al. (2012) N. Marom, F. Caruso, X. Ren, O. T. Hofmann, T. Körzdörfer, J. R. Chelikowsky, A. Rubio, M. Scheffler, and P. Rinke, “Benchmark of g w methods for azabenzenes,” Physical Review B 86, 245127 (2012).
- Friedrich and Schindlmayr (2006) C. Friedrich and A. Schindlmayr, “Many-body perturbation theory: the gw approximation,” NIC Series 31, 335 (2006).
- Rinke et al. (2005) P. Rinke, A. Qteish, J. Neugebauer, C. Freysoldt, and M. Scheffler, “Combining gw calculations with exact-exchange density-functional theory: an analysis of valence-band photoemission for compound semiconductors,” New Journal of Physics 7, 126 (2005).
- Körbel et al. (2014) S. Körbel, P. Boulanger, I. Duchemin, X. Blase, M. A. Marques, and S. Botti, “Benchmark many-body gw and bethe–salpeter calculations for small transition metal molecules,” Journal of chemical theory and computation 10, 3934–3943 (2014).
- Bruneval and Marques (2012) F. Bruneval and M. A. Marques, “Benchmarking the starting points of the gw approximation for molecules,” Journal of chemical theory and computation 9, 324–329 (2012).
- Knight et al. (2016) J. W. Knight, X. Wang, L. Gallandi, O. Dolgounitcheva, X. Ren, J. V. Ortiz, P. Rinke, T. Körzdörfer, and N. Marom, “Accurate ionization potentials and electron affinities of acceptor molecules iii: A benchmark of gw methods,” Journal of chemical theory and computation 12, 615–626 (2016).
- Kohn, Becke, and Parr (1996) W. Kohn, A. D. Becke, and R. G. Parr, “Density functional theory of electronic structure,” The Journal of Physical Chemistry 100, 12974–12980 (1996).
- Lee, Chai, and Lin (2015) J.-C. Lee, J.-D. Chai, and S.-T. Lin, “Assessment of density functional methods for exciton binding energies and related optoelectronic properties,” RSC Advances 5, 101370–101376 (2015).
- Ambrosi, Sofer, and Pumera (2015) A. Ambrosi, Z. Sofer, and M. Pumera, “2h-1t phase transition and hydrogen evolution activity of mos2, mose2, ws2, and wse2 strongly depends on the mx2 composition,” Chemical Communications 51, 8450–8453 (2015).
- Duerloo, Li, and Reed (2014) K.-A. N. Duerloo, Y. Li, and E. J. Reed, “Structural phase transitions in two-dimensional mo-and w-dichalcogenide monolayers,” Nature communications 5 (2014).