Methanol formation in TW Hya and future prospects for detecting larger complex molecules in disks with ALMA
Abstract
Gas-phase methanol was recently detected in a protoplanetary disk for the first time with ALMA. The peak abundance and distribution of methanol observed in TW Hya differed from that predicted by chemical models. Here, the chemistry of methanol gas and ice is calculated using a physical model tailored for TW Hya with the aim to contrast the results with the recent detection in this source. New pathways for the formation of larger complex molecules (e.g., ethylene glycol) are included in an updated chemical model, as well as the fragmentation of methanol ice upon photodesorption. It is found that including fragmentation upon photodesorption improves the agreement between the peak abundance reached in the chemical models with that observed in TW Hya ( with respect to \ceH2); however, the model predicts that the peak in emission resides a factor of farther out in the disk than the ALMA images. Reasons for the persistent differences in the gas-phase methanol distribution between models and the observations of TW Hya are discussed. These include the location of the ice reservoir which may coincide with the compact mm-dust disk ( au) and sources of gas-phase methanol which have not yet been considered in models. The possibility of detecting larger molecules with ALMA is also explored. Calculations of the rotational spectra of complex molecules other than methanol using a parametric model constrained by the TW Hya observations suggest that the detection of individual emission lines of complex molecules with ALMA remains challenging. However, the signal-to-noise ratio can be enhanced via stacking of multiple transitions which have similar upper energy levels.
keywords:
astrochemistry, planetary systems: protoplanetary disks, molecular processes, stars: individual (TW Hya)1 Introduction
The detection of complex organic molecules (COMs) in protoplanetary disks has been considered a key science goal for the Atacama Large Millimeter/submillimeter Array (ALMA). In astrochemistry, a COM is loosely defined as a carbon-containing molecule containing six or more atoms (see, e.g., Herbst & van Dishoeck, 2009). Many families of COMs (e.g., amines, aldehydes, and carboxylic acids) are thought to be stepping stones towards prebiotic molecules such as amino acids and simple sugars. COMs typically possess a complex rotational spectrum; hence, emission from COMs is weak, especially from small astrophysical objects such as protoplanetary disks (). An additional challenge for protoplanetary disks in particular is that most of the disk material is cold ( K) and COMs are expected to reside on and within the water-dominated ice mantles on dust grains. However, the detection of cold gas-phase water and ammonia in the nearby disk around TW Hya has confirmed that non-thermal desorption of ice species into the gas phase does occur in disks. This helps to maintain a low, yet detectable, amount in the gas (Hogerheijde et al., 2011; Salinas et al., 2016).
The superior sensitivity and spatial resolution of ALMA has allowed, for the first time, the possibility to see relatively complex molecules in nearby protoplanetary disks (e.g., Öberg et al., 2015). Such detections are vital for probing the link between the chemical complexity observed towards the warm and dense gas in the immediate environment of forming stars (e.g., Herbst & van Dishoeck, 2009; Caselli & Ceccarelli, 2012) and that seen in comets in the Solar System (e.g., Mumma & Charnley, 2011; Le Roy et al., 2015). It remains unclear to what extent chemistry during disk formation and evolution shapes the chemical complexity of icy planetesimals. Recent theoretical models of complex chemistry during disk formation and over the disk lifetime have suggested that (i) chemical complexity in ices is enhanced en route into the disk (Drozdovskaya et al., 2014, 2016; Yoneda et al., 2016), and (ii) gas-phase COMs should be present in sufficiently detectable quantities in nearby protoplanetary disks (e.g., Furuya & Aikawa, 2014; Walsh et al., 2014; Parfenov et al., 2016). Methanol is an abundant interstellar ice (see, e.g., Boogert et al., 2015) which has been shown in the laboratory to be an important feedstock for larger and more complex molecules (e.g., Öberg et al., 2009; Modica & Palumbo, 2010; Chen et al., 2013); hence, gas-phase methanol is a key target for dedicated observational studies in nearby protoplanetary disks.
2 Detection of gas-phase methanol in TW Hya
Four rotational transitions of A-type methanol were targeted during ALMA Cycle 2 observations of TW Hya (Walsh et al., 2016). This spectral set-up, within which four strong lines could be simultaneously observed, was motivated by simulations of both the chemical structure and the emergent spectrum across the full ALMA frequency range (Walsh et al., 2014). This work predicted that methanol emission from the cold, outer disk would dominate, arising from photodesorption of the ice reservoir. Hence, the targeted lines possessed relatively low-lying upper level energies ranging from K to K.
Data reduction and imaging was conducted as described in Walsh et al. (2016). The individual lines were not detected in the synthesised images; however, a detection was made possible through stacking of the three transitions at 304.208 GHz ( K), 305.473 GHz ( K), and 307.166 GHz ( K). The gas-phase methanol was detected with a signal-to-noise ratio of 5.5 in the stacked channel maps, reaching a sensitivity of 2 mJy beam-1 in a 0.15 km s-1 channel. A more recent analysis of this dataset using a matched filter to search for emission in the domain showed that the three lines listed above were robustly detected with signal-to-noise levels of 4.4, 6.2, and 3.4, respectively (Loomis et al., 2017).
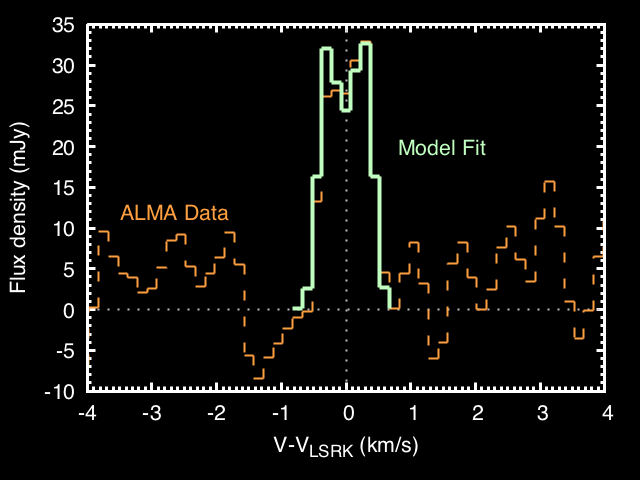
The stacked emission was then simulated using a physical model of TW Hya constrained by a wealth of observations (Kama et al., 2016) and using a parametric model for the gas-phase methanol distribution and abundance. This suggested that the gas-phase methanol arises in ring, peaking at au, and with an abundance ranging from with respect to \ceH2. The derived emission morphology and abundance differed from that predicted by previous models. First, the methanol emission in TW Hya appeared more compact than the predictions, and second, the peak abundance was orders of magnitude lower than expected (Walsh et al., 2014). Figure 1 shows the line profile in orange dashed lines with the best-fit model overlaid in green.
3 An updated chemical model for methanol gas and ice
The apparent discrepancy between predictions and the observations of methanol in TW Hya may be reconciled by modelling the complex chemistry using a disk structure specific to TW Hya. TW Hya is a colder and more settled disk that that used for the previous predictions (from Nomura et al., 2007). In addition, since the models presented in Walsh et al. (2014), there have been numerous laboratory investigations into methanol ice chemistry. Studies into methanol ice photodesorption showed that methanol does not desorb intact at low temperatures (Bertin et al., 2016; Cruz-Diaz et al., 2016). The upper limit for the methanol photodesorption was found to be molecules photon-1 for methanol mixed with CO. This alone could help to reconcile the low methanol abundances seen in TW Hya because previous estimates of intact methanol photodesorption suggested a yield of molecules photon-1 (Öberg et al., 2009).
To investigate the abundance and distribution of methanol gas and ice an updated chemical model was developed and the chemistry was computed using an observationally constrained physical model of the TW Hya protoplanetary disk (from Kama et al., 2016). The chemical model presented in Walsh et al. (2015) was updated with the fragmentation pathways for methanol ice photodesorption (Bertin et al., 2016). The current model also includes an extended surface chemistry network for methanol and its related compounds from Chuang et al. (2016) including methyl formate (\ceHCOOCH3), glycolaldehyde (\ceHOCH2CHO), glyoxal (\ceHC(O)CHO), and ethylene glycol (\ce(CH2OH)2).
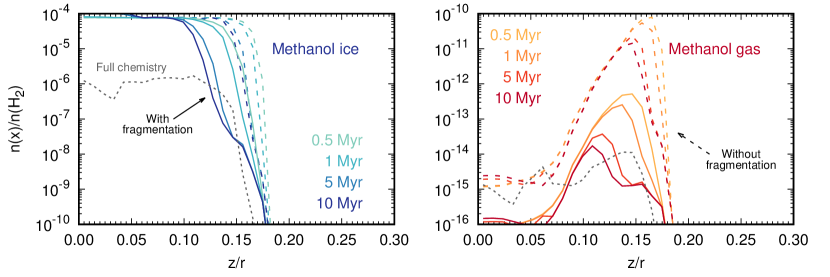
Figure 2 shows the fractional abundances of methanol ice (left) and gas (right) as a function of disk height, , at a radius of 30 au and at four different time steps (0.5, 1.0, 5.0, and 10 Myr) for a model in which photodesorption only is included as a non-thermal desorption mechanism. More details on these calculations are presented in an upcoming publication by Ligterink et al. (2017). When fragmentation upon photodesorption is included, the gas-phase abundance drops by orders of magnitude in the molecular layer present at the methanol snow surface (). The snow surface marks the boundary in the disk atmosphere at which a molecule transitions from the ice phase to the gas phase. Further, the location of the methanol snow surface becomes deeper in time: this is because the methanol ice now needs to reform from its fragments rather than simply refreeze from the gas phase once desorbed.
4 The chemical origin of gas-phase methanol in TW Hya
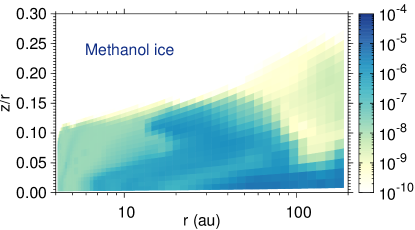
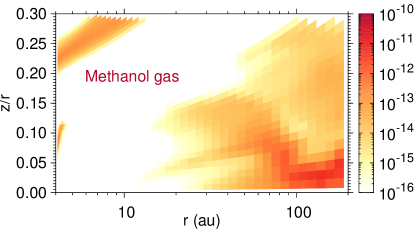
In Figure 3 the two-dimensional fractional abundances of methanol ice (left) and gas (right) are shown as a function of disk radius, , and height scaled by the radius, . These have been computed using the updated chemical model as described previously. Note that the colour-bar scales differ due to the difference in peak abundance between the gas and the ice. This model is more complex than that used for the results presented in Figure 2 in that it also includes all sources of non-thermal desorption (photodesorption and reactive desorption) as well as chemistry induced by bulk ice photodissociation (see Walsh et al., 2014, for full details). The fractional abundances are shown at a single time step (1 Myr).
As expected, the methanol ice is confined to the midplane throughout the disk, lying below within 100 au and below beyond 100 au. This is due to the increasing penetration of stellar and interstellar UV radiation in the outer disk. The gas-phase methanol has a different distribution to that in previous models that predicted that it resides in the outer disk atmosphere (, Semenov & Wiebe, 2011; Furuya & Aikawa, 2014; Walsh et al., 2014). The peak abundance of with respect to \ceH2 is reached in the outer disk beyond au with an abundance of reached beyond au. The bulk of the gas-phase methanol also lies close to the midplane () and mirrors the distribution of methanol ice by becoming more confined to the midplane () beyond au. The peak abundance reached is of the same order of magnitude as that derived from the observations suggesting that the inclusion of fragmentation of methanol ice upon photodesorption does help to reduce the peak gas-phase abundance in the outer disk. The distribution of methanol ice and gas in this model are very similar to that presented in recent work by Parfenov et al. (2017) for the case where they assume that the barrier for diffusion (across the grain/ice surface) is 0.4 times that for desorption. Here we use a value of 0.3.
Figure 2 shows how the more complex chemical model results (dotted lines) compare with the more simple models which neglect bulk ice photodissociation and reactive desorption (solid and dashed lines). The ice abundance is lower in the midplane ( with respect to \ceH2) demonstrating the impact of ice photodissociation on the processing of feedstock ice species such as methanol. The gas-phase distribution demonstrates that (i) the combination of reactive desorption and photodesorption does not help to boost the peak gas-phase abundance of methanol in the molecular layer () and (ii) reactive desorption does help boost the abundance in the midplane () to higher than that from models which include photodesorption (with fragmentation) only. The overall lower peak abundance reached in the more complex model is related to the depletion of methanol ice over time.
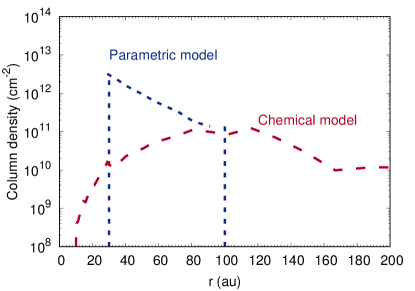
Figure 4 shows the column density of gas-phase methanol as a function of radius from the full chemical model compared with the column density derived from the parametric models used in Walsh et al. (2016). The peak column density for the chemical model is cm-2 and is reached farther out in the disk ( au) than that derived from the parametric models. Given that the line emission is optically thin and in local thermodynamic equilibrium (LTE), this suggests that the emission peak for the chemical model also resides at this location which is a factor of farther from the star than suggested by the observations. Parfenov et al. (2017) find similar results.
5 On the distribution of methanol gas in TW Hya
The results for TW Hya using the full and updated chemical model show that the peak abundance of gas-phase methanol matches well that constrained by the observations. Thus, the inclusion of fragmentation upon photodesorption of methanol ice helps to reconcile the relatively high abundances of gas-phase methanol predicted by the previous generation of protoplanetary disk models with complex chemistry ( with respect to \ceH2, e.g., Semenov & Wiebe, 2011; Furuya & Aikawa, 2014; Walsh et al., 2014). However, the modelled radial distribution does not agree with the observations: the peak emission is predicted at a radius that is a factor of beyond that seen in the ALMA data (see also Parfenov et al., 2017). This suggests that the models, despite their complexity, are missing sources of gas-phase methanol in the inner regions of protoplanetary disks beyond those already considered. Salinas et al. (2016) speculate that collisions between icy bodies in the disk midplane may explain the observed abundance ratio of gas-phase \ceNH3 to gas-phase \ceH2O observed in TW Hya with Herschel. It remains to be tested whether such a mechanism would yield a detectable amount of gas-phase methanol and also if larger molecules like methanol would survive such a process. Öberg et al. (2017) analysed ALMA observations of formaldehyde (\ceH2CO) in TW Hya and found two reservoirs: an inner warm component within au and an outer colder component beyond au arising from the disk atmosphere. Given the strong chemical association between methanol and formaldehyde it is possible that these two molecules share a similar emission morphology; however, methanol is less volatile than formaldehyde. Hence, a chemical process that is able to release methanol in this cold region is still required. One such process is co-desorption with a less volatile yet abundant ice such as CO. This has recently been investigated in experiments by Ligterink et al. (2017). Gas-phase formation of methanol may also need to be revisited.
An alternative explanation is that the ice reservoir may not be present throughout the full radial extent of the disk midplane. Clues pointing to this are present in recent high spatial resolution ALMA images of dust continuum emission from TW Hya which show that the mm-sized dust grains are confined to au (Andrews et al., 2016; Nomura et al., 2016). This dust morphology shows that the large dust grains in TW Hya have settled to the midplane and have drifted inwards due to the head wind and resultant loss in angular momentum induced by the velocity differences in gas and mm-sized dust in the outer disk (Weidenschilling, 1977). Complementary observations of line emission from both single-dish observations and spatially resolved observations with ALMA have provided additional support that these large dust grains are host to the bulk of the ice reservoir (see the recent studies by Kama et al. 2016, Salinas et al. 2016, Bergin et al. 2016, and Du et al. 2017). Sequestration and concentration of the ice reservoir towards the inner disk midplane ( au) may also help to explain the emission morphology of gas-phase methanol as seen with ALMA. This process would help increase the volume of methanol ice in the inner midplane ( au) and would yield an emission morphology which peaks closer to the central star.
6 Detection of COMs higher up the ladder of complexity
The possibility to detect COMs of a similar or higher complexity as methanol in disks around young low-mass stars like TW Hya can now be better quantified in light of the detection of methanol in this source. The disk-integrated rotational spectra of multiple COMs across the full ALMA frequency range have been computed assuming LTE holds, that the disk is face on to the line of sight (as also done in Walsh et al., 2014), and that the disk is at the distance of TW Hya (54 pc). The assumption of LTE for methanol emission was recently tested and verified for TW Hya in Parfenov et al. (2016, 2017). The parametric model which reproduces the methanol detection in TW Hya is used as a template (Walsh et al., 2016). The methanol is confined to the midplane () between a radial range of au: this resulted in a best-fit methanol abundance of with respect to \ceH2. It is assumed that each COM has this abundance in the computation of the spectra. This is an optimistic estimate because in other astrophysical environments gas-phase methanol is often the most abundant COM. This also assumes that all COMs have a similar production mechanism to methanol in the disk.
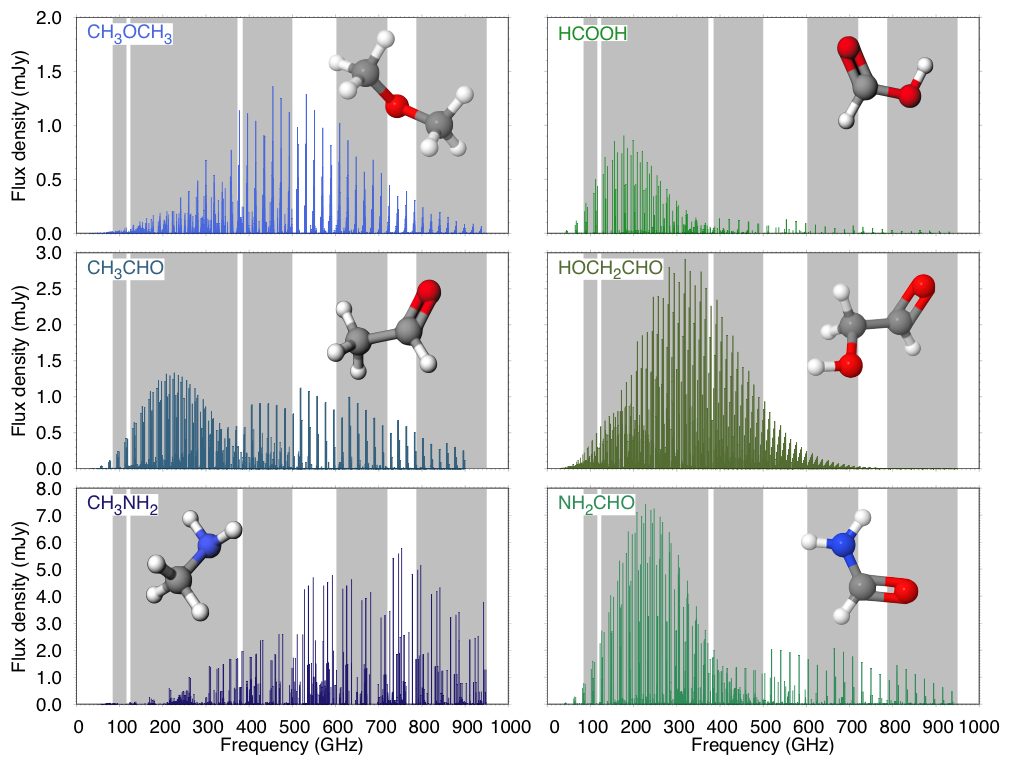
Figure 5 shows the disk-integrated rotational spectra for six COMs:
dimethyl ether (\ceCH3OCH3), formic acid (HCOOH), acetaldehyde (\ceCH3CHO),
glycolaldehyde
(\ceHCOCH2CHO), methylamine (\ceCH3NH2), and formamide (\ceNH2CHO).
The spectra are approximately ordered by peak line flux from top to bottom.
The grey shaded regions show the ALMA observing bands available in ALMA
Cycle 5 (the current observing cycle).
The frequency of the strongest rotational transitions vary according the
properties of the molecule (see, e.g., Herbst & van Dishoeck, 2009).
Formic acid, acetaldehyde, and formamide
all have their strongest transitions towards the lower frequency bands (4, 5, and 6),
glycolaldehyde peaks in band 7, and dimethyl ether and
methylamine have their strongest transitions in band 8 and bands 9 and 10, respectively.
Because of the increase in ALMA sensitivity towards the lower frequencies (for a fixed
integration time), formamide is a strong contender for detection in protoplanetary disks
with a peak line flux density of mJy.
Recall that the rms noise of the ALMA data for TW Hya was
2 mJy beam-1 channel-1.
Detections of individual transitions of formic acid, acetaldehyde,
and glycolaldehyde may also be possible with a sufficiently deep integration.
However, dimethyl ether and methylamine may lie beyond the capabilities of the
telescope, at least in candidate disks around young low-mass stars.
These line spectra are computed for a disk at the same distance as TW Hya (54 pc). For disks at a distance of pc which is more typical of nearby star-forming regions, the line emission will be diluted by a factor of . However, each of the species considered here has a very high density of spectral lines within the observing band within which the peak emission is attained. For example, formamide has 660 transitions (with ) lying between the lower edge of band 6 (211 GHz) and the upper edge of band 7 (373 GHz). Hence, stacking of line data from a single species using data from unbiased spectral line surveys may enable a signal-to-noise boost of where is the number of stacked lines. It should be noted that care must be taken to avoid stacking transitions of vastly different excitation energies and checks for potential line blends will be required. On this latter point, the typical line widths of disk-integrated line profiles from protoplanetary disks around low-mass stars is of the order of a few km s-1; hence, blending of neighbouring line transitions is expected to be less of an issue than it is towards sources in which the observed spectra are found to be at or close to the confusion limit (e.g., hot cores, see Herbst & van Dishoeck 2009).
References
- Andrews et al. (2016) Andrews, S. M., Wilner, D. J., Zhu, Z., et al. 2016, ApJL, 820, L40
- Bergin et al. (2016) Bergin, E. A., Du, F., Cleeves, L. I., et al. 2016, ApJ, 831, 101
- Bertin et al. (2016) Bertin, M., Romanzin, C., Doronin, M., et al. 2016, ApJL, 817, L12
- Boogert et al. (2015) Boogert, A. C. A., Gerakines, P. A., & Whittet, D. C. B. 2015, ARA&A, 53, 541
- Caselli & Ceccarelli (2012) Caselli, P. & Ceccarelli. C. 2012, A&ARv, 20, 56
- Chen et al. (2013) Chen, Y.-J., Ciaravella, A., Muñoz Caro, G. M., et al. 2013, ApJ, 778, 162
- Chuang et al. (2016) Chuang, K.-J., Fedoseev, G., Ioppolo, S., van Dishoeck, E. F., & Linnartz, H. 2016, MNRAS, 455, 1702
- Cruz-Diaz et al. (2016) Cruz-Diaz, G. A., Martín-Doménech, R., Muñoz Caro, G. M., & Chen, Y.-J. 2016, A&A, 592, A68
- Drozdovskaya et al. (2014) Drozdovskaya, M., Walsh, C., Visser, R., Harsono, D., & van Dishoeck, E. F. 2014, MNRAS, 445, 913
- Drozdovskaya et al. (2016) Drozdovskaya, M., Walsh, C., van Dishoeck, E. F., et al. 2016, MNRAS, 462, 977
- Du et al. (2017) Du, F., Bergin, E. A., Hogerheijde, M. R., et al. 2017, ApJ, 842, 98
- Furuya & Aikawa (2014) Furuya, K. & Aikawa, Y. 2014, ApJ, 790, 97
- Herbst & van Dishoeck (2009) Herbst, E. & van Dishoeck, E. F. 2009, ARA&A, 47, 427
- Hogerheijde et al. (2011) Hogerheidje, M. R., Bergin, E. A., Brinch, C., et al. 2011, Science, 334, 338
- Kama et al. (2016) Kama, M., Bruderer, S., van Dishoeck, E. F., et al. 2016, A&A, 592, A83
- Le Roy et al. (2015) Le Roy, L., Altwegg, K., Balsiger, H., et al. 2015, A&A, 583, A1
- Ligterink et al. (2017) Ligterink, N., Walsh, C., Bhuin, R. G., et al. 2017, A&A, to be submitted
- Loomis et al. (2017) Loomis, R. A., Öberg, K. I., Andrews, S. M., et al. 2017, ApJ, submitted
- Modica & Palumbo (2010) Modica, P. & Palumbo, M. E. 2010, A&A, 519, A22
- Mumma & Charnley (2011) Mumma, M. J. & Charnley, S. B. 2011, ARA&A, 49, 471
- Nomura et al. (2007) Nomura, H., Aikawa, Y., Tsujimoto, M., Nakagawa, Y., & Millar, T. J. 2007, ApJ, 661, 334
- Nomura et al. (2016) Nomura, H., Tsukagoshi, T., Kawabe, R., et al. 2016, ApJL, 819, L7
- Öberg et al. (2009) Öberg, K. I., Garrod, R. T.., van Dishoeck, E. F., & Linnartz, H. 2009, A&A, 504, 891
- Öberg et al. (2015) Öberg, K. I., Guzmán, V. V., Furuya, K., et al. 2015, Nature, 520, 198
- Öberg et al. (2017) Öberg, K. I., Guzmán, V. V., Merchantz, C. J., et al. 2017, ApJ, 839, 43
- Parfenov et al. (2016) Parfenov, S. Yu., Semenov, D. A., Sobolev, A. M., & Gray, M. D. 2016, MNRAS, 460, 2648
- Parfenov et al. (2017) Parfenov, S. Yu., Semenov, D. A., Henning, Th., et al. 2017, MNRAS, 468, 2024
- Salinas et al. (2016) Salinas, V. N., Hogerheijde, M. R., Bergin, E. A., et al. 2016, A&A, 591, A122
- Semenov & Wiebe (2011) Semenov, D. & Wiebe, D. 2011, ApJS, 196, 25
- Walsh et al. (2014) Walsh, C., Millar T. J., Nomura, H., et al. 2014, A&A, 563, A33
- Walsh et al. (2015) Walsh, C., Nomura, H., & van Dishoeck, E. F., 2015, A&A, 582, A88
- Walsh et al. (2016) Walsh, C., Loomis, R. A., Öberg, K. I., et al. 2016, ApJL, 823, L10
- Weidenschilling (1977) Weidenschilling, S. J. 1977, MNRAS, 180, 57
- Yoneda et al. (2016) Yoneda, H., Tsukamoto, Y., Furuya, K., & Aikawa, Y. 2016, ApJ, 833, 105