The Outer Halo of the Milky Way as Probed by RR Lyr Variables from the Palomar Transient Facility 11affiliation: Based in part on observations obtained at the W.M. Keck Observatory, which is operated jointly by the California Institute of Technology, the University of California, and the National Aeronautics and Space Administration.
Abstract
RR Lyr stars are ideal massless tracers that can be used to study the total mass and dark matter content of the outer halo of the Milky Way. This is because they are easy to find in the light curve databases of large stellar surveys and their distances can be determined with only knowledge of the light curve. We present here a sample of 112 RR Lyr beyond 50 kpc in the outer halo of the Milky Way, excluding the Sgr streams, for which we have obtained moderate resolution spectra with Deimos on the Keck 2 Telescope. Four of these have distances exceeding 100 kpc. These were selected from a much larger set of 447 candidate RR Lyr which were datamined using machine learning techniques applied to the light curves of variable stars in the Palomar Transient Facility database. The observed radial velocities taken at the phase of the variable corresponding to the time of observation were converted to systemic radial velocities in the Galactic standard of rest. From our sample of 112 RR Lyr we determine the radial velocity dispersion in the outer halo of the Milky Way to be 90 km s-1 at 50 kpc falling to about 65 km s-1 near 100 kpc once a small number of major outliers are removed. With reasonable estimates of the completeness of our sample of 447 candidates and assuming a spherical halo, we find that the stellar density in the outer halo declines as .
1 Introduction
We present initial results of a study of the outer halo of the Milky Way (henceforth MW) using a large sample of RR Lyr type ab (denoted as RRab) variables. RR Lyr are old low-mass pulsating stars with distinctive light curves, amplitudes at of 0.5 to 1 mag, and periods of 0.4 to 0.8 days, which are unchanged on a timescale of years and in most cases decades or longer. These characteristics make them fairly easy to distinguish in a wide field, multi-epoch optical imaging survey if the survey cadence is suitable. Their most desirable characteristic is that they are standard candles. Accurate luminosities, which have only a small dependence on metallicity and period (see the discussion in §4), can be inferred directly from the light curves, and these stars, with mag, are fairly luminous and hence can be detected at large distances.
There is a long history reaching back more than 30 years of efforts to calibrate the RR Lyr period-luminosity-metallicity relation, many of which use the Baade-Wesselink (Baade, 1926; Wesselink, 1969) infrared surface brightness technique to establish an accurate distance scale. Their subsequent use as distance indicators within the MW halo, primarily for globular clusters and distant halo stars, also has a long history, see, e.g. Longmore, Fernley & Jameson (1986), Cohen (1992), and many other early efforts. Early calibration efforts (see, e.g. Longmore, Fernley & Jameson, 1990) demonstrated the advantages of using IR photometry rather than optical photometry, specifically lower amplitude of variation meaning that fewer epochs are required to determine a mean magnitude, hence a luminosity. Now with the Spitzer IRAC camera (Werner et al., 2004; Fazio et al., 2004) and the WISE all sky survey (Wright et al., 2010), highly accurate photometry on a stable space based platform enables even more precise distances for RR Lyr, with recent period-luminosity calibrations for the WISE bandpasses carried out by Madore et al. (2013) and by Klein et al. (2014). Furthermore, the HST-Fine Guidance Sensor cameras were used by Benedict et al. (2011) to determine trigonometric parallaxes to several of the nearest field RR Lyr, in principle providing a fundamental calibration for all these efforts. Sesar et al. (2017a) used the Tycho-GAIA Astrometric Solution (Michalik, Lindegren & Hobbs, 2015) parallaxes of nearby RR Lyr from the GAIA Data Release 1 (GAIA collaboration, 2016) to verify existing period–luminosity–metallicity relationships of previous studies, illustrating the potential for very high accuracy distances for RR Lyr stars with future GAIA releases.
Our survey for RR Lyr is focused on fundamental mode pulsators, i.e. RR Lyr type . Type RR Lyr stars, which are first overtone pulsators, comprise roughly 23% of the total RR Lyr population (Soszynski et al., 2016). They are systematically less luminous than RRab by about 0.25 mag and have shorter periods (Braga et al., 2015). RR Lyr type can be distinguished from fundamental mode pulsators by their smoother, more sinusoidal light curves, but this makes their separation from contact binary systems more challenging.
We are now in an era of large digital imaging surveys, including the SDSS (York et al., 2000), the Palomar Transient Facility (Law et al 2009, Rau et al. 2009) and its successors, the Catalina Real-Time Transient Surveys (CRTS) (Djorgovski et al, 2011), and the Pan-STARRS survey (Hodapp et al., 2004; Tonry et al., 2012), with LSST coming in the next decade. GAIA recently had its first data release as well (GAIA collaboration, 2016), with more to follow in due course. These surveys, with their huge databases can, depending on their cadences and limiting magnitudes, be used to identify ever larger samples of ever more distant RR Lyr, continuing and expanding on much earlier efforts (see, e.g. Wetterer & McGraw, 1996). Such samples enable studies of the outer halo of the Milky Way, as well as of streams and substructures therein. RR Lyr are particularly useful for isolating halo substructures as they stand out through their variability and blue color against the numerous foreground Galactic disk and inner halo stars; Sesar et al. (2012) and Sesar et al. (2013b) have utilized the Palomar Transient Facility (PTF) samples for this purpose.
Our survey for RR Lyr in the outer halo of the Galaxy carried out with the PTF begins at a heliocentric distance of 50 kpc and reaches out to distances of 110 kpc. Previous surveys of halo RR Lyr stars include Vivas et al. (2001), Keller et al. (2008), Miceli et al. (2008), Sesar et al. (2011), Sesar et al. (2013a) and Drake et al (2014), among others. Our survey presents a significant improvement over anything previously published in sample size and in precision of distances in the 50 to 100 kpc range. We present in this paper the radial velocity data obtained to date for these distant RR Lyr through moderate resolution spectroscopy at the Keck Observatory as well as a preliminary halo density distribution derived from our full RR Lyr sample.
An overview of the PTF is given in §2. The following sections briefly review how we derived our RR Lyr sample, then describe how we calculate distances from the light curve parameters. We then discuss our spectroscopic follow-up campaign at the Keck Observatory to measure radial velocities, and present for 112 RR Lyr in the outer halo of the MW with heliocentric distances ranging from 50 to 109 kpc, and with median distance of 73 kpc, which we subsequently use to derive the velocity dispersion in the outer halo of the MW. Next we give a description of our preliminary halo density distribution derived from our full sample of 447 RR Lyr candidates. This is followed by a comparison of our results with the results of other recent studies of the outer halo of the MW, and a summary.
2 Overview of the Palomar Transient Facility
The PTF (Law et al, 2009; Rau et al., 2009) (P.I. S. R. Kulkarni of Caltech) is a wide-area, two-band ( and filters), deep ( single-epoch, mag co-added) survey aimed at systematic exploration of the optical transient sky. The PTF ran for three years, ending Dec. 31, 2012, then transitioned to the intermediate-PTF (iPTF), with the same goals and facilities but with a slightly different consortium membership. The project uses the CFH12k mosaic camera, with a field of view of 7.26 deg2 and a plate scale of pixel-1, mounted on the Palomar Observatory 48-inch Samuel Oschin Schmidt Telescope (Rahmer et al., 2008). The camera consists of two rows of six CCDs, one of which is not active.
By the end of Sep. 2014, deg2 of sky had been observed by the iPTF in the Mould- filter111The PTF Mould-R filter is similar in shape to the SDSS -band filter, but shifted 27 Å redward. and deg2 in the SDSS filter at least 30 times each. Observations are carried out with several cadences to support various major projects, ranging from searches for comets and asteroids to discovery and monitoring of distant SN. For most of a lunation, the observations are performed in a broad-band filter. The SDSS filter is used during the darkest nights. Under typical seeing conditions ( at the P48 Schmidt) the camera achieves a full width at half-maximum intensity of and limiting AB magnitudes of 20.6 in median seeing.
All PTF data taken by the Palomar Observatory 48-inch telescope are automatically routed to two pipelines: a real-time transient detection pipeline optimized for rapid detection of interesting objects, mostly SN, and hosted by the Lawrence Berkeley National Lab, and a longer-term archival pipeline optimized for high-precision photometry and hosted by the Infrared Processing and Analysis Center (IPAC). The IPAC pipeline performs final image reduction, source extraction, and photometric and astrometric calibration (Grillmair et al. 2010; Ofek et al. 2012; Laher et al. 2014). The photometric uncertainty provided by this pipeline is smaller than mag for sources and increases to 0.2 mag at . The algorithm used for photometric calibration is based on that of Honeycutt (1992) as modified by Ofek et al. (2011) and by Levitan et al. (2011).
The PTF R photometric calibration attempts, within the limits imposed by a survey almost all of whose imaging, especially prior to 2015, was acquired with only a R filter, to reproduce the SDSS system. Relative to the reference UCAC-3 astrometric catalog (Zacharias et al., 2010), the astrometric precision of PTF coordinates is about in RA and Dec.
iPTF, with partial funding from the NSF, is in the process of transitioning to the Zwicky Transient Facility (ZTF), to begin operation in late 2017. The 47 deg2 field of view of the ZTF camera will be roughly 6 times the area of the PTF camera, and larger than the field of each of the photographic plates used for the Palomar Sky Survey. This, combined with better CCDs with faster readout times, will enable ZTF to observe the sky more than 10 times faster than PTF, while still reaching the same magnitude limit.
3 Sample Selection
RR Lyr stand out in a wide field imaging survey because they are blue and variable. However, the PTF is primarily dedicated to searching for explosive transients. To optimize the cadence for this purpose almost all PTF imaging until 2014 was carried out with the filter. Thus for stellar broad-band colors we relied on the SDSS (York et al., 2000). In the SDSS the imaging and thus the derived photometry for a variable star was essentially simultaneous for each of the 5 filters.
We developed a probabilistic measure of whether or not a star is a RR Lyr variable based largely on its light curve characteristics. As described briefly in Sesar et al. (2014), we have chosen to use the random forest classifier to isolate a sample of RR Lyr variables from the PTF data. This is a supervised machine-learning algorithm that uses a training sample and a feature set to build a forest of decision trees. Random forest algorithms are able to determine the importance of each feature used for classification and they are not strongly affected by outliers. Random forest classifiers also tend to be less affected by small changes in the training sample than other classification trees because of the random selection of a subset input features at each node, resulting in a selection that maintains accuracy while reducing correlation (Breiman 2001). They are easily applied to very large sets of time series data (i.e. light curves), and have been used extensively on such data sets in the past few years, see, e.g. Richards et al. (2011), Nun et al. (2014), McCauliff et al. (2014), and Carrasco et al. (2014) for QSOs, and in high-energy physics, see, e.g. Sharma et al. (2014). Because of the algorithm’s features and its previous success in classifying variable sources, it was selected as the algorithm of choice for the RR Lyrae classifier.
As a supervised algorithm, the random forest classifier requires a training sample and a set of features. After some experimentation, we settled on 10 features to characterize the light curves, including several suggested by Stetson (1996). The training sample consisted of PTF light curves of RR Lyr stars and non-RR objects in SDSS Stripe 82, where the RR Lyr are identified in Sesar et al. (2010), and the remaining stellar objects are non-RR stars. Hernitschek et al. (2016) gives extensive details on a similar selection applied to the Pan-STARRS PV2 (internal process V2) data. The output of the classifier (denoted , range 0 to 1) is a measure of probability that the light curve under consideration is that of a RR Lyr. The rank ordering of the values is correct, but the conversion to an actual probability has not been quantified. Light curve parameters are also determined, including the period, amplitude, and epoch of maximum light which defines .
Experience gained with the random forest classifier suggested that 30 epochs, provided that they are well spaced compared to the typical RR Lyr period, suffice to identify a RR Lyr variable, phase the light curve, and determine its period. We thus require a minimum of 30 detections of a given star for it to be included in the RR Lyr search. Until the fall of 2014, after this sample was originally assembled, the RR Lyrae project had no assigned P48 time. Thus to assemble our sample of candidate RR Lyr stars, we datamined the PTF archive in 2013, searching for high galactic latitude fields that had more than 40 R images. We ran the random forest classifier on the time series of photometry (ignoring images which yielded only upper limits instead of detections) for all stars in such fields that showed evidence of variability and that had 30 or more detections at R. We retained only those with a minimum of 0.70 and which have reddening corrected colors from the SDSS within the range appropriate for RR Lyr, e.g. that of Sesar et al. (2010). As a final check, the NASA/IPAC Extragalactic Database was used to remove known QSOs.
The area on the sky of the Sgr stream within of the orbital plane of this tidal stream (i.e., , where is the latitude in the Sgr stream coordinate system defined in Appendix A of Belokurov et al 2014) was excluded. Other known streams, compiled recently by Grillmair & Carlin (2016), are all closer than 50 kpc and hence not relevant here.
Because the RR Lyr survey with PTF and its successors is largely piggy-backing on the various SN surveys, our sample probes widely separated randomly selected high galactic latitude pencil beam fields, each 7.3 deg2 in size. Substructure effects should be minimized because of our sparse sampling over a very large area on the sky.
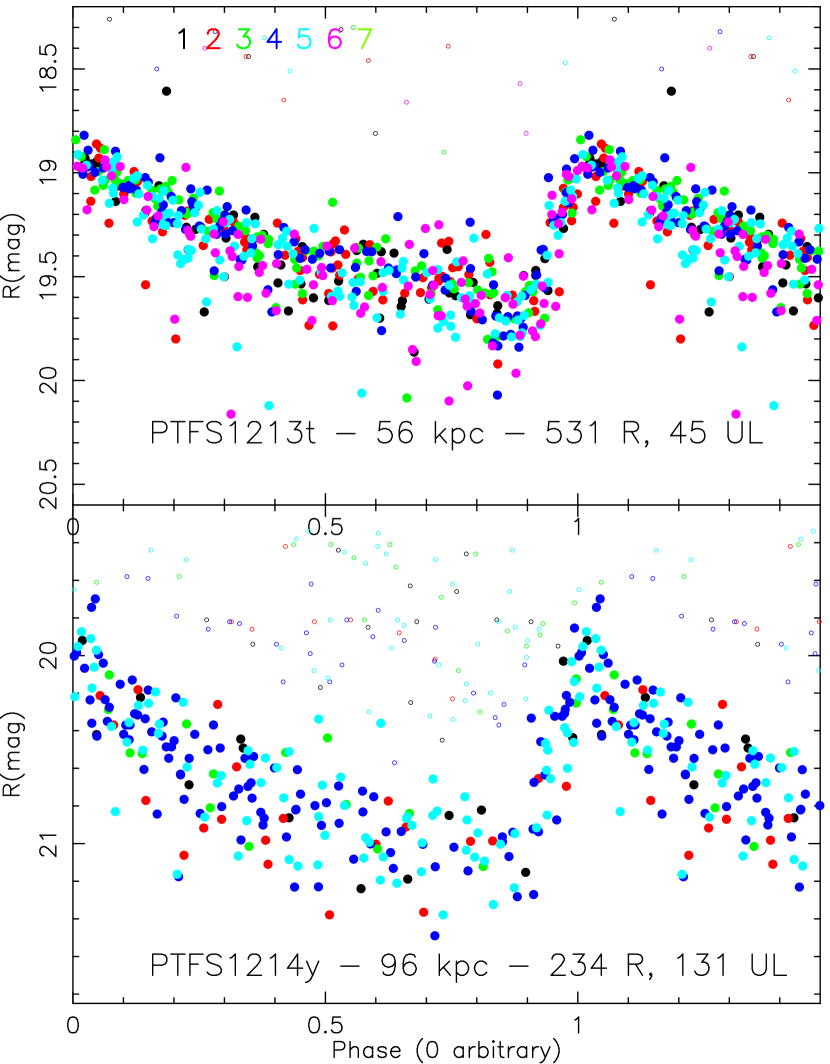
Fig. 1 shows the light curve of one of the brighter RR Lyr in our sample ( kpc) as well as that of one of the more distant RR Lyr ( kpc). The observations extend over more than 6 years with hundreds of detections in the PTF- filter, and with good phasing throughout. We ignore the Blazhko effect, a modulation with time of the pulsation amplitude seen in some RR Lyr stars, as our light curves in general are not of high enough quality to detect this.
Since the PTF is primarily dedicated to the discovery and study of high amplitude explosive transients such as SN, observations are carried out even when sky conditions (seeing or transparency) are not optimal, provided it is safe to open the dome. This means that the depth and point source image size for an individual exposure will vary over a wide range as observations of a specific field are accumulated over several years. Many of the PTF images have a limiting magnitude much brighter than that of the median = 20.6 mag (5 ) limit. Some PTF images, taken under very good conditions (clear night, excellent seeing, excellent telescope performance) reach deeper than the nominal limit. Thus the quality of the light curve of a candidate variable star is not just a function of the brightness of the star and the number of epochs available in the PTF archive. This complicates estimating the completeness corrections in our sample.
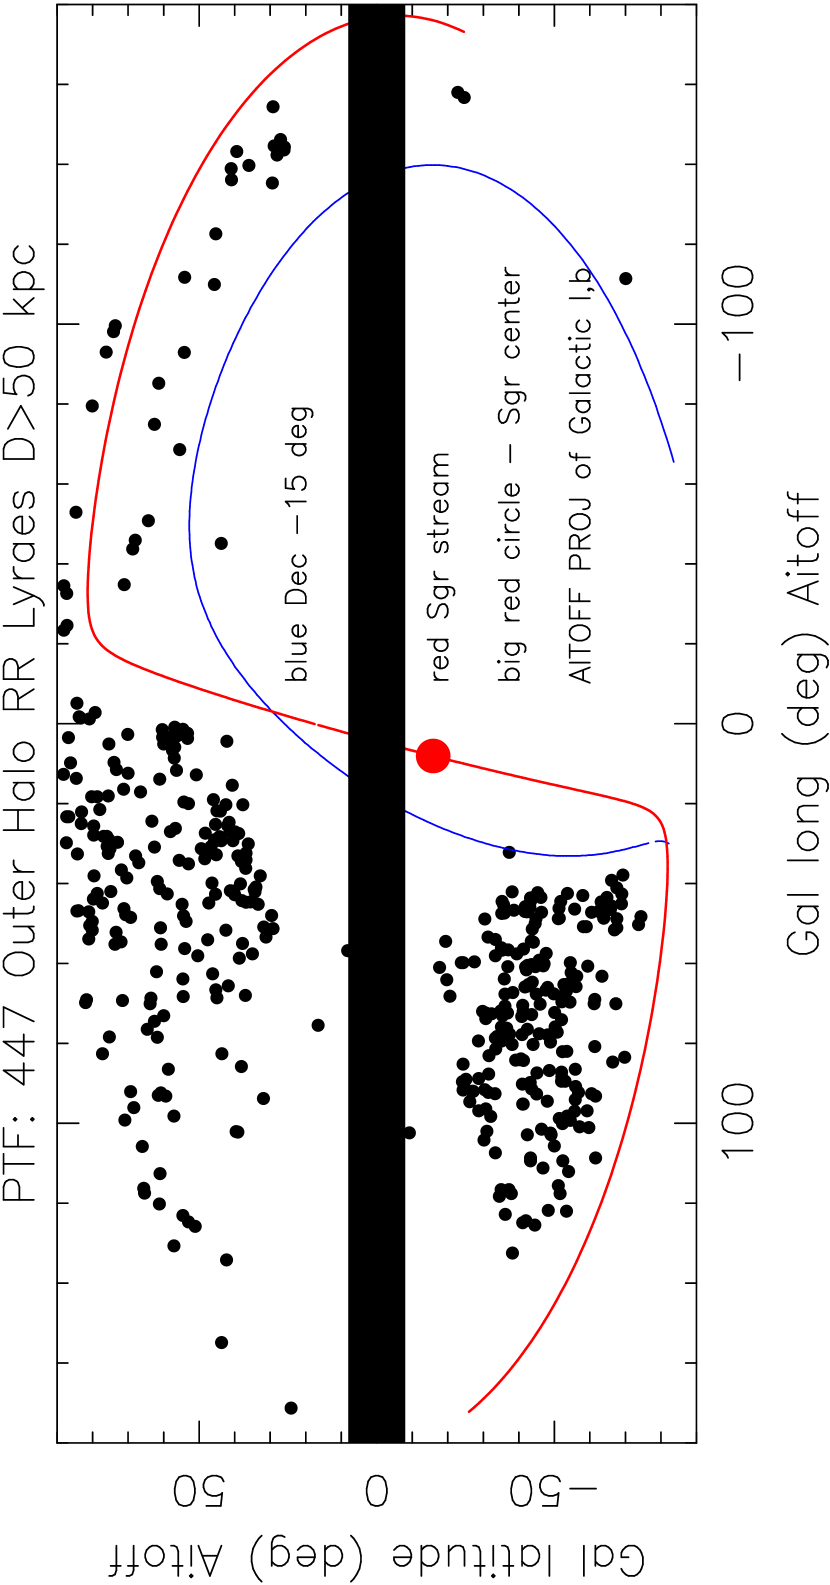
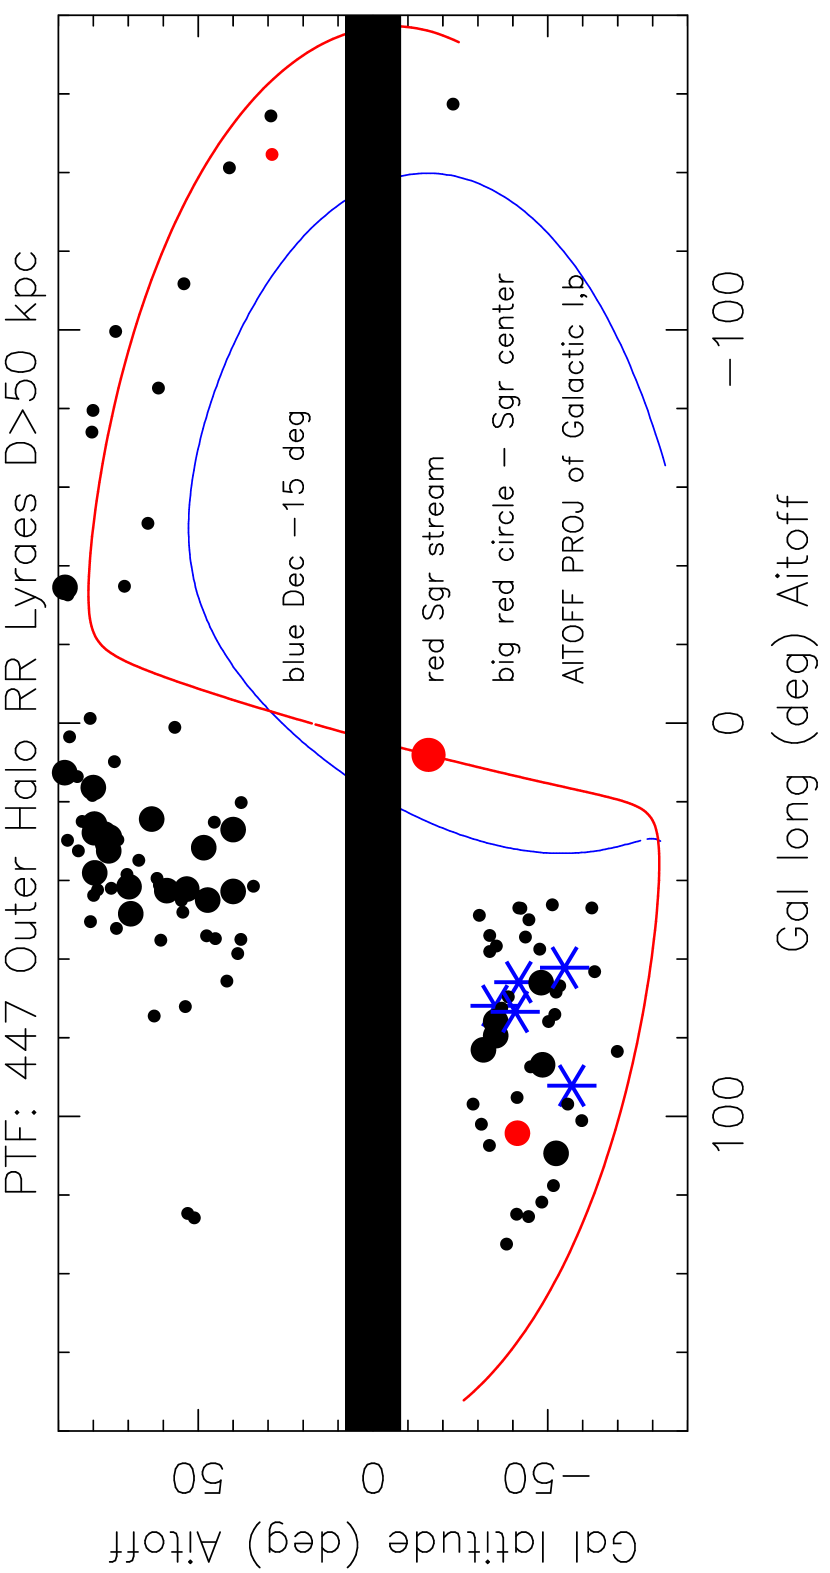
We assembled a list of 447 candidate RR Lyr selected from the PTF database to be at a heliocentric distance of 50 kpc or greater at high Galactic latitude222The minimum heliocentric distance of kpc for a star in our sample corresponds to a Galactocentric distance between 45.9 and 57.8 kpc depending on ()., with SDSS () colors from DR10 (Ahn et al., 2014) within an appropriate range and outside the Sgr streams. Fig. 2 shows their location on the sky using Galactic coordinates. Allowing a distance separation of 5%, the closest pair of candidate RRab has a separation on the sky of 0.16 kpc and a distance of 50.5 kpc. There is one other close pair with separation on the sky of less than 0.4 kpc.
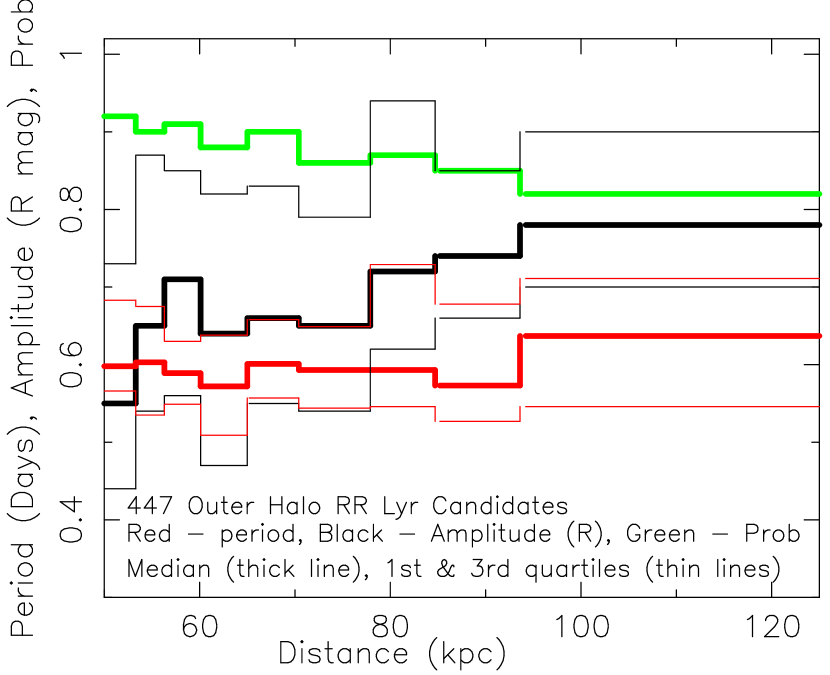
Some trends appear within this sample of 447 candidate RR Lyr as shown in Fig. 3, including a trend towards higher median amplitude with approximately constant median period at larger distances. There is also a trend of lower (recall that ) towards larger distances; the median probability index decreases from 0.92 for the first bin ( to 53 kpc) shown in Fig. 3 to 0.82 for the last bin ( kpc). These trends are not surprising given that we are approaching the limiting magnitude of the PTF survey at the largest distances probed.
As will be described later, 112 stars were selected selected for spectroscopic observations. These consist of the higher probability RR Lyr candidates from this list, within the constraints imposed by the specific dates of the assigned telescope time.
4 Distances
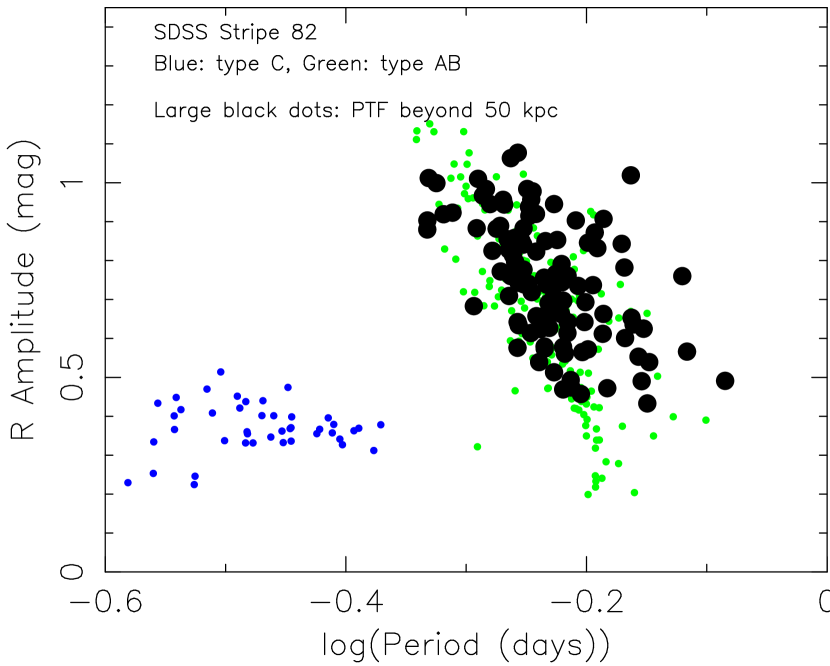
RRab are almost standard candles, and we adopt a median for their extinction corrected mag (averaging the flux of the best fitting light curve template over one period) of +0.6 mag. However, it is well known that there is a small dependence of luminosity on period (linear in log) and on metallicity (linear in [Fe/H]). We first assess the range in period of RR Lyr stars. We use the sample of 173 RRab isolated by Sesar et al. (2010) in Stripe 82 of the SDSS with mean fainter than 17.0 mag. This sample has excellent photometric data with many observed epochs. It covers a wide range in distance and should be representative of our sample as well. Fig. 4 presents the period-amplitude relation for these stars. The RR type c from the Stripe 82 sample are also shown in this figure. Note that they have have shorter periods and lower amplitudes than do the RRab.
A histogram of the periods for the 173 RR stars in Stripe 82 with fainter than 17.0 mag from the sample of Sesar et al. (2010) is shown in shown in the lower panel of Fig. 5; the upper panel displays the same for our PTF RRab sample. The values for mean and rms dispersion of each of the two samples are indicated on the figure; they are essentially identical, which is gratifying, as both probe deep into the outer halo of the Milky Way.
We correct for the period term in the luminosity of RRab adopting the coefficient given by Marconi et al (2015), who present theoretical period-luminosity relations for RR Lyr stars over a range of metallicity based on their new nonlinear time-dependent convective hydrodynamical models of RR Lyr stars. These supersede earlier calculations by Chaboyer (1999), Caceres & Catelan (2008) and others. We note note that their dependence on log() for fundamental mode RR Lyr in the band is 1.6 times larger than that of Caceres & Catelan (2008) and therefore we may hope that use of their coefficients will provide an upper limit to the change in mean with both and [Fe/H].
The luminosity dependence on the period, which is , is in general small, as the median period for our outer halo RR Lyr sample is 0.553 days with dex. This results in a change in distance of less than 3%; even at the extreme high and low values of log(), days and days, the resulting change in distance incurred by including the period dependent term does not exceed 10%. Note that the sample of RRab in SDSS Stripe 82 studied by Sesar et al. (2010) has a median period of 0.582 days, and a for log() of 0.044 dex, almost identical to that of our outer halo sample.
Corrections for interstellar absorption were applied based on the reddening map of Schlegel, Finkbeiner & Davis (1998). If a reddening map with larger extinction at high galactic latitude is used, the distances to the RRLyr would increase.
The absolute luminosity of RRab also depends on the metallicity, for which [Fe/H] is used. Schorck et al (2009) have established the metallicity distribution of the outer halo for very low metallicities; the fraction of the stellar content of the Milky Way halo which is extremely metal poor is very small. Again using the coefficients of Marconi et al (2015), we find that potential variations of [Fe/H] of 0.5 dex about a (low, but not extremely low) mean metallicity leads to an uncertainty in the distance of 4%.
Another key issue is the accuracy of the mean mag measured from our light curves. Although the uncertainty of a R measurement at a single epoch may be large, up to 0.2 mag, the mean R will be much more accurate. A reasonable estimate of this, particularly for stars with many epochs (ignoring upper limits) in their light curves, is 0.03 mag, which corresponds to a distance uncertainty of 1.5%.
Thus if one assumes that the mean metallicity in the outer halo beyond 50 kpc is low and only has a modest gradient with distance and a modest range at any outer halo location, which seems appropriate for the outer halo excluding the Sgr streams, then based on the uncertainties found above, our distances for RRab with good light curves should be precise to 5%. Here the dominant term results from the unknown metallicity. Light curve quality for these RRab will improve with additional observations once ZTF is commissioned resulting in better light curves with more detections.
An empirical test of how large (actually how small) the distance errors might be for RR Lyr due to their range of periods was carried out by B. Sesar. Using the Pan-STARRS RRLyr catalog (to become publicly available on Nov. 1, 2017) he calculated the dispersion in distance based on assuming a fixed absolute mag, ignoring the period and metallicity dependences, for a large () sample of RRab in the Draco dSph galaxy. He measured a rms scatter of 0.08 mag, corresponding to a distance precision of 4% for this sample. In §3.3 of Sesar et al. (2017b) this test of calculating the dispersion in distance is extended to two additional dSph satellites of the Milky Way, Sextans, and Ursa Minor, again with excellent results. In these tests the metallicity dependence within each of these dSph galaxies was ignored. The metallicity range within Draco extends from [Fe/H] = 3.0 to dex (Cohen & Huang, 2009; Kirby et al, 2011) and the range within Ursa Minor is similar (Cohen & Huang, 2010; Kirby et al, 2011). Thus the metallicity dependence is not a significant contributor for most, if not all, outer halo stars. It is clear that distances accurate to 5% can be obtained for RRab with high quality light curves.
The above discussion does not address the issue of the the uncertainty in the adopted extinction map. The recent extinction coefficients of Schlafly & Finkbeiner (2011) (their table 6) and the Schlafly et al (2014) dust map lead to somewhat higher extinction at high Galactic latitude than that we adopt, which would result in our distances being slightly underestimated. Furthermore we have adopted an absolute R mag (corrected for reddening) for the median of our sample of +0.6 mag. If this choice is incorrect, all of our distances need to be scaled appropriately.
5 Light Curve Quality
Table 1 gives the light curve parameters for each star in our sample of 112 RRab in the Keck sample. The last three columns of this table indicate for each RRab the number of available -band detections, the number of -band detections, and an assessment of the light curve quality in the PTF Stellar Light Curve database as of late 2016. The latter was set by visual inspection by the first author in late 2016. Quality 1 light curves are clearly RR Lyr variables, quality 2 are probably RR Lyr, while the nature of objects with quality 3 light curves is uncertain.
The initial determination of light curve parameters for the Keck sample was carried out in 2014, at which time the number of available epochs was smaller (often considerably smaller) than at present. Beginning in late 2014 we were allocated a total of roughly 100 hours of P48 (i.e. PTF) time made available through the Caltech allocation to improve the light curves of the more distant stars in the Keck sample. These distant stars have a much higher fraction of non-detections than do the brighter end of our sample, and so need additional imaging to raise the number of detections to a level that ensures accurate characterization of the light curve parameters. Our goal in this effort is 100 detected epochs of R-band imaging for each of the most distant RR Lyr candidates.
In late 2016 and early 2017 the light curve of each of the stars in the Keck sample was checked to look for problems in the phasing, i.e. incorrect periods or determinations of caused by the limited data available when the light curves were first determined in 2014. As necessary, the light curve parameters were re-determined at that time, and the correction from the observed to the systemic described in §6 was updated using the new ephemeris parameters. This was a crucial step, as the initial values were in several cases sufficiently far off that the accumulated phase change over several years significantly affected the derived phase correction to the observed .
At the present time, as indicated in Table 1, only 12 stars from the Keck sample of 112 stars have less than 50 detections in or 50 detections in the filter. Only 4 stars (4%) of the total sample of 112 RR Lyr are classified as having poor light curves (i.e. quality 3). As described earlier, we have until very recently had no control over the observing plan for PTF/P48 time, which is defined by the other major projects of the PTF, especially the SN projects. Thus the number of epochs of observation of a given star varies from a minimum of up to when a RR Lyr candidate is by chance located in a field which is of major interest to one of the other PTF projects.
6 Radial Velocity Measurements
A spectroscopic campaign to obtain radial velocities for RR Lyr candidates began at the Keck Observatory with the Deimos spectrograph (Faber et al., 2003) in the spring of 2014 following a brief effort to use the DBSP on the Hale Telescope at the Palomar Observatory, which yielded one useful spectrum. RRab are pulsating periodic variable stars. Spectroscopic observations to determine must be taken within the range of phase such that () in the stellar atmosphere is as small as possible. The observing list for each night was compiled from the candidate RRab near the meridian during the night with the appropriate range of phase ( to 0.7) accessible during that time. Observation planning therefore required having both a coordinate list and accurate predicted phases from the start to the end of the night for the specific date; the phases are calculated from the periods we determined from the PTF light curves. Candidates with high probability index () were favored, but it was sometimes necessary to incorporate candidates with lower to fill in gaps in the observing plan for a specific night.
The Deimos spectrograph was usually configured with the 600 grove/mm grating blazed at 7500 Å and spectral resolution 2000 for a 1.0 arcsec wide slit and a scale of 0.65 Å/pixel. Spectra were taken with the central wavelength set to 7500 Å. Most spectra were taken with a 1.0 arcsec wide slit, but on nights with good seeing, the 0.7 or the 0.8 arcsec slit was used, yielding correspondingly higher spectral resolution. During our first Keck run, a small number of spectra were acquired with the 1200 g/mm gold coated grating blazed at 7545 Å which yielded even higher spectral resolution. However, the velocity precision for an exposure of a fixed time turned out not to be better than with the 600 g/mm grating due to the increased SNR with the 600 g/mm grating. The maximum (and typical) exposure time was set to 30 min to avoid excessive phase blurring. Fig 6 shows spectra in the region of H for 9 of our RR Lyr candidates selected to cover the full range in distance of our sample. Note the degradation in the SNR at the largest distances, which arises from the fixed maximum integration time of 30 min.
The determination of the systemic for a RR Lyr requires knowledge of the phase at the time of the observation. A correction which depends on the phase is applied to get the systemic , then a heliocentric correction, and finally we apply a correction to the Galactocentric rest frame (GSR).
The uncertainties in the systemic velocities include both a measurement error and a term for the uncertainty in fitting to the model radial velocity curve. Details for this calculation are given in §5.3 of Sesar et al. (2012). Since typical amplitudes over the period for RR Lyr stars of H are km s-1, it is important that the phase of observation be determined accurately. This requires accurate periods and phasing.
The primary feature we use for determination is H. Due to the low efficiency of Deimos in the blue, we do not achieve a SNR high enough there to use the higher Balmer lines or the strong blue metallic lines. Sesar (2012) has derived template velocity curves which calibrate the change in velocity as a function of pulsation phase for several of the Balmer lines; we adopt his H template here; see also the very detailed recent study by Chadid, Sneden & Preston (2016). The normalized curves of Sesar (2012) are then scaled by the amplitude of variation of the light curve to derive the correction from the observed at phase to the systemic velocity. The other major features clearly visible in these spectra are the Paschen lines around 8600 Å, but we are not aware of any calibration for them. The infrared Ca triplet and a few OI lines are also visible in these spectra, and we will undertake an attempt to use them as metallicity indicators in the future.
Standard arc lamps (Ne, Ar, Kr, and Xe) were used for wavelength calibration, which was then tuned up slightly for each observation of a RR Lyr candidate using the night sky emission lines superposed on each stellar spectrum, important as there are few arc lines in the region of H, the primary feature we are using to determine .
From our Keck runs beginning in April 2014 and extending through Sep 2016 we have acquired spectra of roughly 135 candidate RR Lyr from our PTF sample, 112 of which we believe to be RRab stars based on their light curves, their colors, and their spectra, the remainder being a few quasars, a few RR type c variables, or other types of variable stars. The stars in the Keck sample are widely dispersed on the sky with the closest pair in the list of candidate RRab being separated by . Thus no multiplexing was possible, and a substantial number of Keck nights were required to obtain this set of spectra.
The set of 112 RR Lyr with spectroscopic , which are listed in Table 1, have heliocentric distances of kpc with a median of kpc. The resulting relative to the Galactic standard of rest and its uncertainty are given in Table 2. Typical uncertainties for from a single measurement range from 17 to 20 km s-1.
A separate list of 4 RR Lyr that were observed during our first run with Deimos on Keck for this project, but which are probably part of the Sgr stream, is given at the end of this table. The exclusion region for the Sgr stream was originally set to be within 5∘ of the orbital plane of this tidal stream, but was raised to 9∘ shortly after observing commenced. Once the exclusion region around the Sgr stream was increased in size, these four stars were dropped from our sample of candidate RR Lyr in the outer halo of the Galaxy. There are 7 stars in our sample which are between 9 and 15∘ from the orbital plane of the Sgr tidal stream.
6.1 Test of Accuracy
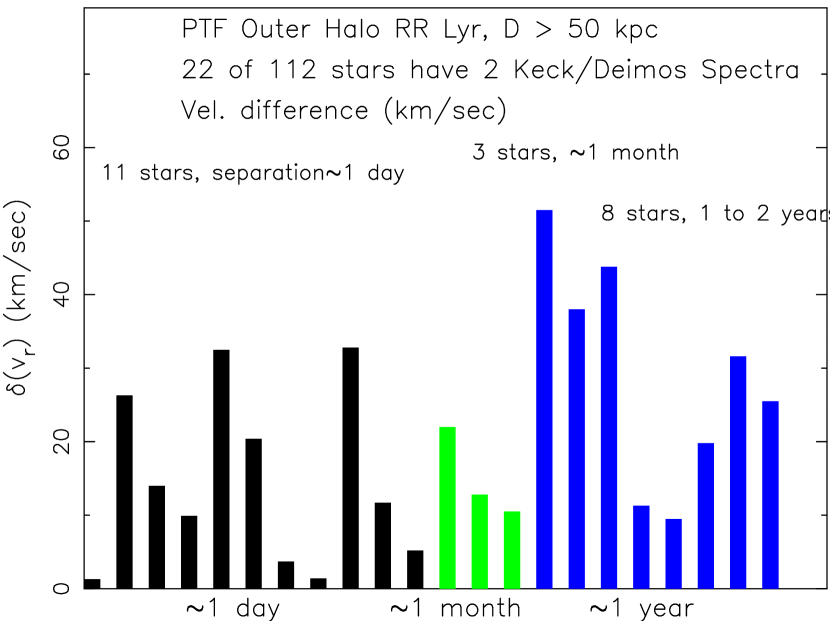
To demonstrate the accuracy of our systemic for RR Lyr variables, Table 3 gives the independent for those candidate RR Lyr variables from our sample with more than one Deimos spectrum; there are 22 (20% of the total sample with Keck ) with two independent spectra. In several cases, the two Deimos spectra were taken on the same night, often consecutively, but analyzed independently. The agreement between the two determinations of for each of these 6 stars is good. There are 11 stars with two spectra from the same night or from consecutive nights. These in general show small differences in between the two spectra. Only three have differences exceeding 20 km s-1, with the largest difference being 33 km s-1. Given that the nominal uncertainty of a single measurement is 20 km s-1, this agreement is good.
There are 8 RR Lyr candidates with two Deimos spectra taken more than a year apart. The differences are larger here, ranging from 9 to 51 km s-1, with two having differences exceeding 40 km s-1.
The difference in for stars with multiple spectra is shown in Fig. 7 as a function of the separation in time between the two epochs of observation, which increases along the X axis. As indicated above, for small differences in time, the difference between the two for a given star is within close to or within the expected uncertainties, but once the time interval becomes large (months to years), there are two cases with disagreements exceeding 40 km s-1 between the two derived .
We suspect that these disagreements arise in part from possible errors in the phases due to uncertainties in the period. Thus our process to determine in the Galactic standard of rest (GSR) for these RR Lyr variables from the observed using phase dependent corrections appears to be working reasonably well in general. However, for a small fraction of our candidate RR Lyr variables, this is not the case. While there are a few unexpectedly large discrepancies, they are relatively small compared to the velocity dispersion among our 112 RRLyr sample to be discussed later in §7.
As indicated earlier, if the star were not a genuine RRab variable or the key light curve parameters (period and epoch of zero phase) we derived were wrong, incorrect would be derived. However, we note that one of the stars with two independent spectra which shows an unexpectedly large has an excellent light curve with 224 detections with the PTF- filter.
6.2 Contaminants in the Sample of Candidate RR Lyr Stars
The only blue point sources seen at high galactic latitude are RR Lyr, QSOs, blue horizontal branch (BHB) stars and blue stragglers. Since our primary selection is by variability resembling that expected for a RRab, the non-variable BHB stars and blue stragglers become irrelevant. Thus the primary source of contamination is expected to be QSOs, but the timescale and characteristics of their variation are quite different from those of RRab. As the number of observed epochs of photometric monitoring increases, and this will grow with time as the iPTF transitions into the ZTF, the fraction of contaminating quasars will fall, because their extended light curves will diverge more and more from those of RRab, the variation will not be periodic, etc.
Table 4 lists the five broad lined objects (i.e. QSOs) we have found from our spectroscopic campaign that are not included in NED. Given that most QSOs are eliminated as they do not have light curves that resemble RR Lyr and adding in a check with NED, the contamination rate of QSOs within the sample selected for spectroscopy can be kept very low, and can, as described above, be expected to fall with time as the survey time coverage increases. WISE colors (Wright et al., 2010) can also be used to cut down the fraction of QSO contamination (Nikutta et al., 2014) due to the difference in spectral slope between a power law and a (hot) thermal spectrum, but are of limited use for such distant objects as they are often so faint that only the W1 color is given in the WISE catalog.
The other potential contaminant of our sample of RRab stars is overtone pulsators, i.e. type RR Lyr. Several of the variable stars listed at the end of Table 4 are probably RR Lyr . They were originally believed to be RRab and were part of the spectroscopic sample, but as their light curves built up with time, they became inconsistent with the period range and/or shape appropriate for RRab and were removed. Given the mean difference in luminosity at of 0.25 mag between RR Lyr pulsators in the fundamental and the first overtone modes, the distance of a candidate will be overestimated by 12% if it is actually a type rather than the more common type RR Lyr. Furthermore the relationship for H of the overtone pulsators may be different from that derived for the RR Lyr that we are using.
Most importantly, type RR Lyr can be eliminated using a period-amplitude diagram, as is shown for the SDSS Stripe 82 sample in Fig. 4. The type variables have smaller periods and smaller amplitudes of variation than do the fundamental mode RR Lyr . There is essentially no overlap between them in this diagram.
7 The Radial Dependence of The Velocity Dispersion
Our ultimate goal is the determination of the mass of the MW out to as close to the virial radius as possible. We intend to use our sample of RR Lyr as massless point-source test particles. In support of this effort, we have ignored RR Lyr in the Sgr stream. However, there may be previously unknown structures whose stars may be moving with non-virialized velocities. So before determining the velocity dispersion, we look for evidence from our data regarding the possible presence of new substructures. A search for previously unknown low luminosity galactic satellites in the outer halo that have not yet been disrupted was conducted by Sesar et al. (2014) by using the RR Lyr from the PTF as indicators, but there was no detection, although the derived upper limit is high. With our survey we can look for evidence for the presence of more diffuse and more extended structures.
At the large distances we probe, the dispersion of the line-of-sight velocity, which is what we measure, is essentially identical to the dispersion of , the radial velocity as seen from the Galactic center. We first consider the sample as a whole. Fig. 9 shows a histogram of the entire sample of 112 RRab. We see a rather broad range spread between and km s-1. This may be the result of a wide spread in at all Galactocentric distances, of a trend with , of the presence of outliers due to halo structures, or of contamination in the sample with objects that are not RRab. As discussed in 6.2, we believe that our sample has few such contaminants.
In an effort to identify whether outliers are present, we carried out an exercise where we began with the full sample, calculating the , , and the median distance. We then removed the largest outlier in , where “last” refers to the mean found in the previous iteration. We continued doing this repeatedly. The result for , , and the median distance for is shown in Fig. 10 for 24 such trials. First we note that the median distance begins for the entire sample at 74.1 kpc and slowly decreases, ending up after 24 deletions at 71.8 kpc. The for the entire sample treated as a whole begins at 98 km s-1 and ends up at 60 km s-1. It falls quite rapidly initially, suggesting the presence of some outliers, then after about 8 RRab are removed, the decline becomes more gradual. At the same time, the mean starts at about km s-1, and rises to +3 km s-1 at the end of the 24 trials. So the halo has no, or at most very small, net motion.
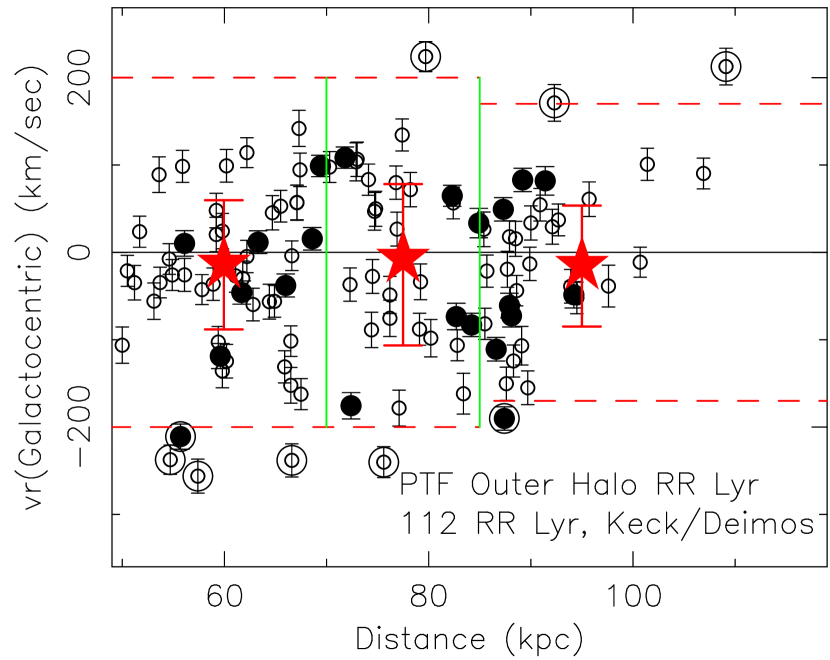
To proceed further, we need to look into potential variations with distance and to whether we can find any more clues regarding the presence of outliers. The we have determined for 112 candidate RR Lyr with distances beyond 50 kpc in the MW halo are shown as a function of in Fig. 11. In this figure, the stars are divided into three distance regimes, with the intermediate one being 70 to 85 kpc, and the most distant group, which contains 26 stars, ranges outward from 85 kpc to 109 kpc, with four at distances exceeding 100 kpc. The first point to note is that the mean for each of the three groups (shown as large stars in the figure) is close to 0 km/s; the mean values and other statistics are given in Table 5. This is yet another indication that our values of inferred from our , as corrected for phase within the RR Lyr period, are in general valid.
Before computing the velocity dispersion, we need to decide whether there are genuine outliers and how to handle them. These are important as they may be a manifestation of previously unknown large scale substructures in the halo. Fig. 11 shows several outliers, and we have chosen km s-1 as the cutoff for outliers for the sample within 85 kpc, dropping to 170 km s-1 outside that distance. The number of outliers in each distance range is given in Table 5. With this definition, there are a total of 9 outliers from the 112 RRab in our Keck sample. They are circled in Fig. 11.
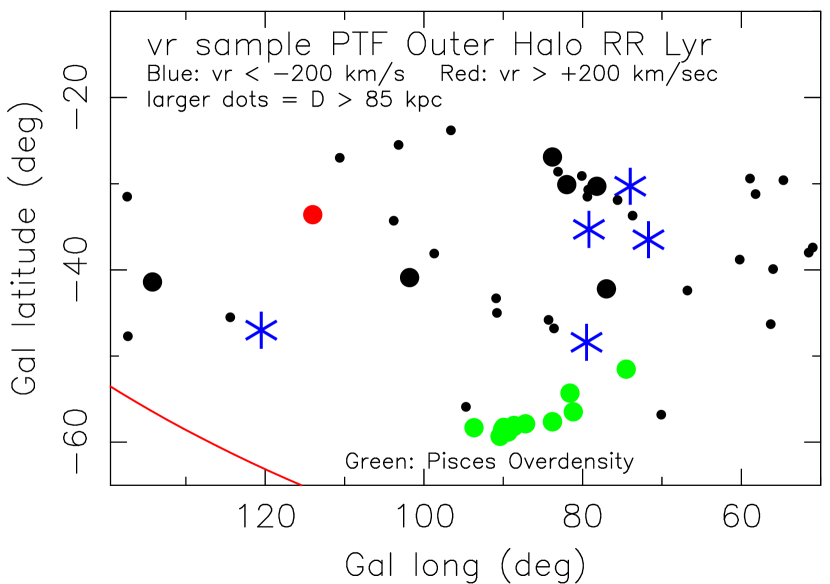
We first look at the low outliers. There are only five major low outliers. These five RR Lyr have km s-1, and distances between 51 and 73 kpc. All of them have excellent quality 1 light curves. Fig. 8 shows the position on the sky of the 112 RR Lyr candidates in our Keck/Deimos sample. These 5 low outliers (indicated as blue stars in the figure) are confined to a small region on the sky with RA between 329 and 10∘ and Dec between 4 and 15∘. A blowup of this region on the sky is shown in Fig. 12. The green points indicate RR Lyr in the Pisces overdensity, discovered by Sesar et al. (2007) as a linear stream at a distance of 80 kpc within the SDSS stripe 82; however recall that Stripe 82 is a narrow equatorial stripe only 1∘.27 wide extending from R.A. 20h to R.A. 4h. A more recent discussion of this structure is given by Nie et al. (2015), but this structure is more distant than the set of 5 low outliers in our sample. An examination of Figs. 8 and 12 combined with Fig. 11 strongly suggests that these five stars belong to some previously unknown diffuse outer halo structure which extends over about 40∘, perhaps from a disrupted satellite. These five low outliers are sufficiently far from the plane of the Sgr streams that it is unlikely that they are part of it. We therefore consider them as potentially not virialized. The choice of the cutoff adopted for RR Lyr with kpc of km s-1 is an estimate based on Figure 11.
Table 5 gives the statistics of the sample of 112 RR Lyr when divided into three distance ranges, and when only two groups are used, with a boundary at 85 kpc. Values for are given as calculated from the measured of each RR Lyr, and also with a 20 km s-1 measurement error removed. They are calculated for the full sample, and also for the case where the major outliers have been excluded. Since the removal of only a few outliers considerably reduces the velocity dispersion within each distance range, we consider our choice of cutoffs for outliers as reasonable. For example, for the outermost group of RR Lyr with kpc, is reduced from 90 km s-1 to 65 km s-1 by removing only 3 outliers from our sample of 26 RR Lyr in this distance range.
Note that with the outliers eliminated, the velocity disperion is quite low, not exceeding 87 km s-1 beyond 50 kpc, and for the outermost stars with kpc, km s-1. Clearly a larger sample of tracers with accurate distances and beyond 50 kpc is desirable. We are working on it, but it will take several years to enlarge our sample of 112 RRab beyond 50 kpc with measured by a substantial factor.
8 The Radial Distribution of the PTF RR Lyr Sample
With considerable caveats, we present the radial distribution in the outer halo of the MW for our sample of 447 RR Lyr candidates. We assume an isotropic spherical halo. The major concern is the serious incompleteness in our sample of outer halo RR Lyr stars at the largest distances probed, i.e. beyond 90 kpc.
One might also worry about an increasing number of interlopers (i.e. not genuine RRab) in the sample as the distance increases and the light curve quality decreases due to increasing observational uncertainties in each individual observation and to a lower fraction of detections coupled with an increasing fraction of upper limits for a given number of epochs of observation. However, the small spread of the period distribution and the strong period-amplitude correlation shown in Figs. 5 and 4 as well as the behavior of the quartiles of period and amplitude as a function of distance (see Fig. 3 suggest that our sample is not contaminated by interlopers even at the largest distances we probe. Note that a careful examination of Fig. 3 does support the suggestion that there is a strong increase in incompleteness of our sample of RRLyr at the largest distances included our sample.
We can assess the importance of incompleteness by considering the fraction of upper limits instead of detections among RRab which have many epochs of observation and which span the full range in distance probed here. Fig. 14 shows some relevant data, specifically the fraction of upper limits among the available images in the PFS database for a sample 80 RR Lyr stars at the close end of our sample (50 kpc) vs 50 of the most distant ones (i.e. beyond 95 kpc). As we had no control over the cadence nor of the selection of fields to be observed on a given night at that time, the number of observations of a given field (at least at the time that the sample was constructed) depended on how many times a field was observed by other PTF projects.
For the nearer RR Lyr in our sample, the fraction of upper limits is low, usually less than 10%, while for the most distant ones, the fraction of upper limits is typically 60%. Our PTF RR Lyr sample was selected in 2014 and hence given the much smaller number of images of each field in the database at that time compared to the present values given in Table 2, a larger fraction of the most distant RR Lyr will not be picked up as candidate RR Lyr as their light curves would not have contained more than 30 detections at that time. Although as indicated earlier in §5, the ephemerides have been checked recently and updated as necessary, the list of candidates has not. Redoing the selection from the PTF seems unjustified given that a high quality PS1 RR Lyr catalog with careful determination of its completeness and purity will be released shortly (Hernitschek et al., 2016; Sesar et al., 2017b). We can safely assume that there is an incompleteness of at least a factor of two for the most distant part of our sample; the actual completeness correction at the faint end of our PTF sample could be even larger.
With regard to the issue of contamination of the Keck sample by interlopers, we compare the number of candidate RR Lyr with as a function of distance with the distribution in distance of our sample of 112 RR Lyr with Keck/Deimos . Note that 326 of the 447 candidates meet this probability restriction, while essentially all of candidates selected for Keck spectroscopy have . This ratio is given as a function of distance in Table 6. There are many candidates at the near end of the sample, but our goal was to get spectra of as many distant stars as possible, so candidates at the closer end of our sample were not observed unless no suitable distant candidate had a phase within the allowed range during that part of the night. As shown in Table 6, only 21% of the candidates with kpc have Keck , while this fraction is 50% from 64 to 99 kpc, beyond which it drops to 38%. If the sample of candidates was seriously contaminated with interlopers as the distance increased, this success fraction should have fallen significantly. We can therefore assume that the fraction of interlopers is not rising significantly towards the faint end of the sample, until a distance of at least 90 kpc, beyond which the sample is small.
Another way to approach the same issue is to examine the current PTF light curves for those RR Lyr candidates which are not in the Keck sample. If there is serious contamination which is dependent on distance by stars which are not RRab (presumably more contamination at larger distances), the fraction of these RR Lyr candidates that have quality 3 light curves (light curves which do not suggest that the star is a RR Lyr) will rise substantially with distance. We have carried out this check for candidates over a wide range in distance. For candidates at distances closer than 60 kpc, 94% of them show high quality light curves. This fraction falls to 85% for those between 65 and 70 kpc. It remains above 80% out to 95 kpc, beyond which it drops to 70%. This change with distance of the potential fraction of contaminants is small enough that the effect on the power law fit should not be large, at least within 95 kpc.
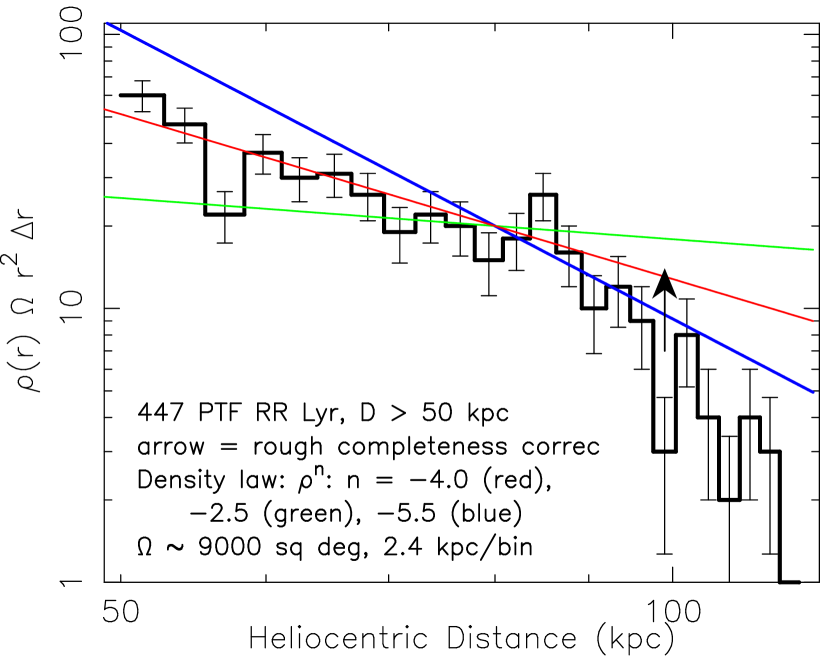
Fig. 15 presents the number of candidates in bins in distance, with both axes of the plot using a logarithmic scale. Also shown are a number of power law fits. The upward arrow indicates a correction for an incompleteness of 50% in the RR Lyr sample at the largest distances probed arising from the large fraction of upper limits in their PTF light curves. It is clear that a volume density law of is a reasonable fit from 50 to 85 kpc, and, with an incompleteness correction of a factor of two, would be a good fit out to 100 kpc.
9 Comparison With Previous Results
9.1 Comparison With Other Samples of Milky Way Outer Halo Stars
As a result of many recent large stellar surveys, our knowledge of the outer halo of the MW is improving very rapidly. Outer halo stellar samples are increasing in size and distance range probed. For comparison, the early discussion of the kinematics of the halo by Kinman et al. (1996) used only a total of 67 RR Lyr and BHB stars in the inner halo out to kpc; they found a velocity dispersion of 110 km s-1. However, samples of outer halo stars with spectroscopic , particularly in the crucial region beyond kpc, such as ours are growing very slowly.
The Catalina Real-time Transient Survey (CRTS) has been in operation since 2006 mining the data stream from three telescopes (0.7 m, 1.0 m, and 1.5 m diameters) in the mountains north of Tucson Arizona which are operated by the Lunar and Planetary Laboratory at the University of Arizona and whose primary mission is the detection of near earth asteroids. The photometric calibration and cadence of the CRTS are not as well controlled as those of the PTF, but the time span of the imaging and hence of the light curves is more than a decade. Drake et al (2014) used this database to produce the Catalina Surveys Periodic Variable Star Catalog, which has roughly 16,800 RRab variables. The maximum distance of the RRab in their survey is 60 kpc, however the bulk of their sample is closer than 40 kpc. Our sample begins at 50 kpc and we have eliminated the Sgr stream, while the CRTS catalog has not. We find that the overlap between our sample of 447 RR Lyr and their sample is only 32 stars. The agreement of the derived period for the variables in common between the two surveys is less than 0.0010 days for 24 of the 32 stars in common, while the largest difference is 0.0016 days. The more recent southern extension of the Catalina Sky Surveys RR Lyr catalog, Torrealba et al (2015), has no overlap in sky coverage with our Palomar based survey.
Very recently Iorio et al (2017), in a paper not yet accepted, have produced a catalog of RR Lyr by combining the first GAIA data release (GAIA collaboration, 2016) with 2MASS (Skrutskie et al, 2006). Their sample has 21,600 RR Lyr and is confined to the inner halo. Thus there is a very large overlap with the CRTS sample of Drake et al (2014), but Iorio et al (2017) only reach out to a heliocentric distance of 20 kpc, and thus there is no overlap with our sample, whose minimum distance is 50 kpc.
The huge database of SDSS, coupling uniformly measured multi-color photometry from its deep imaging over a large fraction of the northern sky and uniformly reduced spectra, was a breakthrough. It was used by Xue et al. (2008) to isolate a sample of 2400 BHB stars with that reaches out to kpc, with very limited coverage out to 50 kpc; Xue, Rix, Yanny et al. (2011) gives a slightly improved selection of BHB stars from the same material. More recently, Xue et al. (2014) used the database of the Sloan Extension for Galactic Understanding and Exploration (SEGUE) (Yanny, Rockosi, Newberg et al., 2009) to select a sample of 6036 distant K giants. They developed probabilistic procedures to obtain their luminosities, claiming to thus have achieved a median accuracy of 16% in their distances. Their sample extends out to 80 kpc, although almost all of the stars beyond 60 kpc are in the Sgr Stream or other known halo substructures.
The K-giant sample of Xue et al. (2014), when cleaned of known substructures, primarily the Sgr Stream, has 1757 stars with distances beyond 10 kpc, but in the outer halo it is significantly smaller than our sample, which begins at 50 kpc. The purged sample of Xue et al. (2014) has only two K giants beyond 65 kpc, with the most distant at about 75 kpc. Our sample reaches significantly further out in the MW halo with a median distance of 73 kpc. Furthermore, the distances to our RR Lyr sample are much more accurate than those of K giants.
The hypervelocity star survey (Brown, Geller & Kenyon, 2014) has carried out extensive spectroscopy of very blue stars in the outer halo selected from SDSS photometry. While SDSS colors are used, this is one of the few surveys besides ours that obtains their own spectra. The kinematics of the majority of their sample of the late B-type outer halo stars found the course of this work are discussed in Brown et al. (2010). Their dataset contains 910 late B and early A such stars, almost all of which are BHB stars with a small contamination of less luminous blue stragglers. The bulk of their sample is closer than 50 kpc.
Bochanski et al. (2014) selected a sample of 404 candidate very distant M giants based on their NIR colors from UKIDSS combined with optical colors from SDSS and undetectable proper motions (to rule out nearby M dwarfs). Two of these were spectroscopically confirmed and appear to be extremely distant, with their estimated minimum distances being 130 kpc. Their sample of very distant M giants selected via photometry has roughly 80% contamination which can only be resolved by spectroscopy; photometry alone is insufficient. Furthermore, M giants in the outer halo are a very biased indicator as they can only arise from a metal-rich population, and presumably are located in potentially non-virialized initially compact infalling structures, if in fact their distances and classifications are correct. As noted by Bochanski et al. (2014), these stars lie close to the Sgr plane. The recent model of the Sgr Stream by Dierickx & Loeb (2017) suggests these M giants are located within the Sgr Stream; it successfully reproduces their distance and low . Sesar et al (2017c) have recently identified some of these spurs in the Sgr stream at distances exceeding 100 kpc using the PS1 RR Lyr sample. However, given the high contamination fraction of their M giant sample, the amount of observing time which would be required to generate a clean large sample of such distant M giants is prohibitive and furthermore a sample of M giants would not probe the bulk of the outer halo of the MW.
Slater et al. (2017) isolate a sample of 4000 distant giants in the halo with wide field imaging using a narrow bandwidth filter covering the region of the Mg triplet at 5170 Å, which is well known to be a good giant/dwarf discriminator. This is combined with broad-band SDSS imaging. Extensive statistical treatment using population synthesis modeling is required to clean the sample of numerous dwarf interlopers, and the distances of individual objects are quite uncertain. The sample of 4000 giants reaches out to 80 kpc.
Deason et al. (2012) attempted to build up a sample of more distant ( kpc) BHB stars by stacking multi-epoch photometry from Stripe 82 of the SDSS (and other regions with multiple images) to isolate candidate BHB stars, but these are too faint to have SDSS spectroscopy. They obtained low resolution () spectra using FORS2 on the VLT to try to separate BHB stars from contamination by brighter blue stragglers, which outnumber by a factor of more than four the desired BHB stars. The final sample has only 7 faint BHB stars. Deason et al. (2012) then add a small number of other potential outer halo stars with highly uncertain distances as well as the dwarf satellites of the MW.
The only sample that reaches out to the distances probed by our RR Lyr sample with a substantial number of stars beyond 50 kpc is that of Deason et al. (2014) which uses BHB and blue straggler stars from the SDSS DR9. There are several issues that afflict this sample, particularly contamination with blue stragglers, and, more seriously, with QSOs. Extensive color modeling, taking into account photometric scattering, was used to try to remove contaminants, which outnumber the desired BHB stars by a large factor.
It is clear that the sample of distant RR Lyr from the PTF with Keck radial velocities presented here has unique characteristics. It is a clean sample with few interlopers, and each star has has a highly accurate distance. At the present time, and even after the release in Nov. 2017 of the PS1 sample by Sesar et al. (2017b), ours is the only reliable sample with at least a modest number of of tracer stars beyond 80 kpc in the outer halo with measured .
9.2 The Density Profile in the Outer Halo
The determination of the density profile in the outer halo of a large set of massless tracer stars is clearly a crucial input to determining the mass of the MW. Given the limited data, the solution is usually expressed as a power-law fit to the density vs distance. Our preliminary result based on a large sample of RR Lyr variables is given in §8 and is shown in Fig. 15. We find that a power law in with a slope of is consistent with the stellar density derived from the distances of our RR Lyr sample. This assumes an isotropic spherical halo. With larger samples one can also solve for the flattening profile of the halo, but we could not attempt this. Bovy et al. (2017), based on an analysis of the Pal 5 and GD-1 stellar streams, suggest that the axis ratio of the dark matter’s halo density distribution is 1.05 within the inner 20 kpc, providing some support to our assumptions, although Iorio et al (2017) suggest that the inner halo has a substantial oblateness which decreases at larger Galactic radii. There seems to be a general consensus that the outer halo is less oblate than the inner halo.
Our result contradicts that of Deason et al. (2014), who claim that beyond 50 kpc there is a striking drop in the stellar halo density. Although in their earlier paper (Deason, Belokurov & Evans, 2011) they found a power law fit of for the region kpc (the maximum reached), Deason et al. (2014) find a power law slope of beyond 50 kpc, with even steeper slopes (power law index to ) favored at larger radii. On the other hand, De Propris et al. (2010), who used a sample of 666 BHB stars from the 2dF quasar redshift survey, found a very shallow slope for the density in the outer halo of and a velocity dispersion which increases with , reaching a huge exceeding 200 km s-1 at kpc over the two lines of sight probed. Our data do not support the results of either of these two studies. Our sample is much cleaner with much better distances than the samples of either of these two analyses.
A number of other analyses have been published recently which agree with our halo density distribution to within the uncertainties. Among the many samples of outer halo stars discussed above in §9.1, the large SDSS/SEGUE samples of K giants stand out for their size and spatial coverage. The latest analysis of such is that of Xue et al. (2016). As the luminosity of K giants depends strongly on the metallicity, they had to use forward modeling techniques to fit the spatial distribution and abundance distribution simultaneously. They found that a power-law slope with index is a good fit to the number density profile of the halo beyond kpc. Das & Binney (2016) reanalyze this sample using an extended distribution function to find the density distribution power law index is at large radii out to 80 kpc. Kafle, Sharma, Lewis et al. (2914) combine the BHB and K giant samples from the SDSS/SEGUE to find a slope of in the halo beyond 20 kpc. The recent work by Slater et al. (2017) using SDSS photometry coupled with imaging in a narrow band filter centered at the Mg triplet to eliminate dwarfs also targets K giants. They use sophisticated CMD modeling and population synthesis to derive a halo density profile from 30 to 80 kpc.
Thus, as discussed above, there seems to be a growing consensus that in the outer halo of the MW at least out to 85 kpc, the stellar density can be represented as a power law with a slope of to . This is quite close to the slope found in the inner halo, at least from 20 kpc outward, by several groups, see e.g. Xue et al. (2016).
9.3 The Velocity Dispersion In the Outer Halo
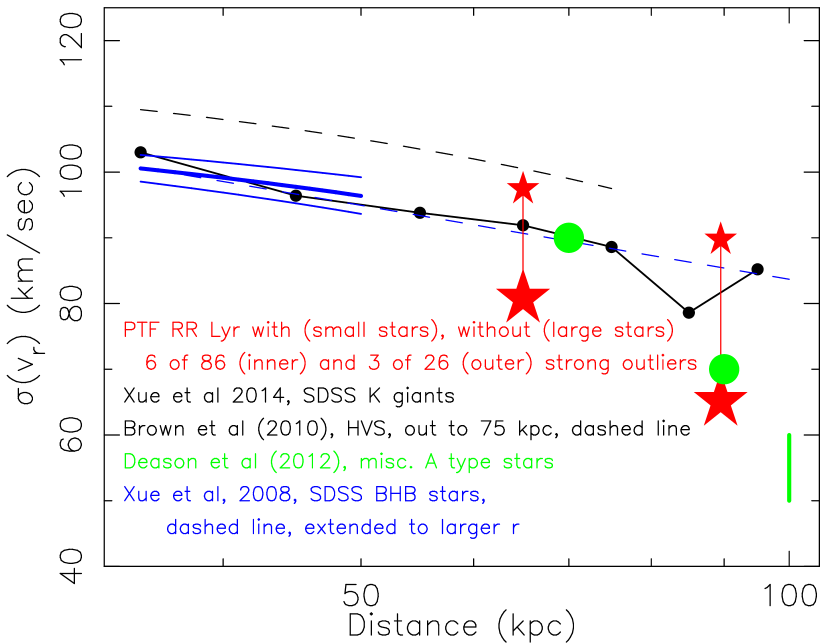
The behavior of the of a sample of massless tracers as a function of distance provides important clues as to the potential and total mass of the MW. Towards this goal, several of the studies referenced in §9.1 have measured for a large fraction of the members of their sample. In particular those based on SDSS and its successors (i.e SEGUE) fall into this class. In this section we compare our derived as a function of distance for our RRab sample (shown in Table 5 and in Fig. 13) with those of other groups.
The two large samples of outer halo stars based on the SDSS and SEGUE, i.e. the BHB sample of Xue et al. (2008) (see also Xue, Rix, Yanny et al., 2011) and the K giant sample of Xue et al. (2016), both of which reach out to kpc, have been analyzed by many different groups using various sophisticated modeling techniques to derive properties of the outer halo. The latest result from these samples is Xue et al. (2016), where references to earlier work can be found.
Xue et al. (2008) and Xue, Rix, Yanny et al. (2011) derived the radial trend of out to 50 kpc, where they found 95 km s-1. The spatial range of this relation was extended by Deason et al. (2012), who added a small number of more distant objects. Kafle, Sharma, Lewis et al. (2914), who derived their own sample of K giants from the SEGUE data, also found a similar value of of 100 km s-1 for kpc; see their Fig. 1.
Fig. 13 illustrates some of these results from the literature compared to our relationship for as a function of between 50 and 100 kpc. With the exception of De Propris et al. (2010), all of these investigations, including ours presented here, are in reasonable agreement regarding the velocity dispersion of the outer halo stars as a function of distance from 50 to 100 kpc within the regime probed by each group, 50 to 100 kpc in our case. All recent studies find 90 km s-1 at 50 kpc, dropping lower as increases. The hypervelocity star survey (Brown, Geller & Kenyon, 2014) derives the same general decline of with but has roughly 20 km/sec higher at all probed than our result and that of most recent work.
The agreement on the spatial distribution among the various studies, among the most recent of which is Xue et al. (2016), is also satisfactory out to perhaps 60 kpc; from 30 to 60 kpc all groups agree that the number density of tracers can be represented by a power law with index of about . There are only two surveys beyond that, our work and that of Deason et al. (2014), and there is a major disagreement at these larger distances between us, with Deason et al. (2012) claiming a very rapid drop in the number density beyond 50 kpc. They find a power law of with distance beyond 50 kpc, dropping to slopes of to at larger distances. Unless we have badly underestimated our contamination problems, which at least in the sample selected for Keck spectroscopy is highly unlikely given the quality ratings of the light curves and the period-phase relation for our sample shown in Fig. 4, we advocate that our results are more reliable, given the substantial contamination of the Deason et al. (2012) sample by QSOs for which the corrections they use may not be adequate.
We thus conclude that the outer halo at kpc is cold, and it’s radial velocity dispersion is low. These factors suggest, in accordance with several recent analyses, a low total mass for the MW. For our RRab survey based on the PTF database, the key issues are the purity and completeness of the sample and the potential impact of substructure which we suggest may produce the outliers in in these distant outer halo samples of “massless and virialized” tracer stars. The new PanSTARRS RR Lyr catalog by Hernitschek et al. (2016) and by Sesar et al. (2017b) will allow future investigations to avoid most if not all of these concerns.
10 Summary
RR Lyr stars of type ab are ideal massless tracers that can be used to study the outer halo of the MW. Because they have (to first order) a fixed luminosity, their periods are about 0.5 days, they are common in old metal-poor stellar populations, and their amplitude of variation is substantial, reaching up to 1 mag, they are easily found in any multi-color imaging survey with extensive temporal coverage. Since they are blue, even when they are in the outer halo of the MW, they stand out against the numerous redder foreground stars, and can be distinguished from quasars by the nature of their variability, quasars being non-periodic variables, while the other blue halo stars (BHBs and blue stragglers) can be eliminated as being non-variable. RR Lyr are thus ideal probes of the outer halo which can be found at great distances in the current generation of large stellar surveys and whose distances can be measured to high accuracy with just a light curve.
We present here a sample of 112 RRab beyond 50 kpc in the outer halo of the MW for which we have obtained moderate resolution spectra with Deimos on the Keck 2 Telescope. Four of these have distances exceeding 100 kpc. These were selected from a much larger set of 447 candidate RR Lyr which were datamined using machine learning techniques applied to the light curves of variable stars in the Palomar Transient Facility database. The observed radial velocities taken at the phase of the variable corresponding to the time of observation were converted to systemic radial velocities in the Galactic standard of rest. This only works well when the ephemerides of the variable stars are accurately known.
From our sample of 112 RR Lyr with Keck we determine the radial velocity dispersion in the outer halo of the MW to be 90 km s-1 at 50 kpc falling to about 65 km s-1 near 100 kpc once a small number of major outliers are removed. The five very low stars, all of which have km s-1, are surprisingly close together on the sky at a distance of about 60 kpc, but there is no known structure at that distance in that part of the sky.
With reasonable estimates of the completeness of our sample of 447 candidates and assuming a spherical halo, we find that the stellar density in the outer halo declines as . Most, but not all, other recent works corroborate this functional form.
The problems we have faced have been in the accuracy of the ephemerides for the RR Lyr sample and in issues of completeness and non-RR Lyr interlopers. Further exploration of the issue of substructure in the outer halo requires a larger sample. The new Pan-STARRS RR Lyr catalog by Hernitschek et al. (2016) and by Sesar et al. (2017b) provides this, and will allow investigations which we expect to carry out in the near future to avoid most if not all of these concerns. Ultimately LSST will allow techniques similar to those we used to identify RR Lyr at even larger distances of up to several hundred kpc. Of course spectroscopic follow up of the very distant RRab we expect to find with LSST will require the next generation of extremely large telescopes beyond the current 10 m Kecks.
References
- Ahn et al. (2014) Ahn, C. P., Alexandroff, R., Allende Prieto, C. et al., 2014, ApJS, 211, A17
- Baade (1926) Baade, W., 1926, Astron. Nach., 228, 359
- Belokurov et al (2014) Belokurov, V., Koposov, S. E., Evans, N. W. et al., 2014, MNRAS, 437, 116
- Benedict et al. (2011) Benedict, G. F., McArthur, B. E., Feast, M. W. et al., 2011, AJ, 142, 187
- Bochanski et al. (2014) Bochanski, J. J., Willman, B., Caldwell, N., Sanderson, R., West, A. J., Strader, J. & Brown, W., 2014, ApJ, 790, L5
- Bovy et al. (2017) Bovy, J., Bahmanyar, A., Fritz, T. K. & Kalilvayalil, N., 2017, arXiv:1609.01298
- Braga et al. (2015) Braga, V. F., Dall’Ora, M., Bono, G., et al., 2015, ApJ, 799, A165
- Breiman (2001) Breiman, L., 2001, Machine Learning, 45, 5
- Brown et al. (2010) Brown, W. R., Geller, M. J., Kenyon, S. J. & Diaferio, A., 2010, AJ, 139, 59
- Brown, Geller & Kenyon (2014) Brown, W. R., Geller, M. J. & Kenyon, S. J., 2014, ApJ, 787, A89
- Carrasco et al. (2014) Carrasco, D., Barrientos, L. F., Pichara, K. et al., 2014, A&A, 584, A44
- Caceres & Catelan (2008) Caceres, C. & Catelan, M., 2008, ApJS, 179, 242
- Chaboyer (1999) Chaboyer, B., 1999, in “Post-Hipparcos cosmic candles”, ed. A. Heck & F. Caputo, Kluwer Academic Publishers, pg. 111
- Chadid, Sneden & Preston (2016) Chadid, M., Sneden, C. & Preston, G. W., 2016, arXiv:1611.02368
- Cohen (1992) Cohen, J. G., 1992, ApJ, 400, 528
- Cohen & Huang (2009) Cohen, J. G. & Huang, W., 2009, ApJ, 701, 1053
- Cohen & Huang (2010) Cohen, J. G. & Huang, W., 2010, ApJ, 719, 931
- Das & Binney (2016) Das, P. & Binney, J., 2016, MNRAS, 460, 1725
- Deason, Belokurov & Evans (2011) Deason, A. J., Belokurov, V. & Evans, N. W., 2011 MNRAS, 416, 2903
- Deason et al. (2012) Deason, A. J., Belokurov, V., Evans, N. W. et al., 2012, MNRAS, 425, 2840
- Deason et al. (2014) Deason, A. J., Belokurov, V., Koposov, S. E. & Rockosi, C., 2014, ApJ, 787, 30
- De Propris et al. (2010) De Propris, R., Harrison, C. D. & Mares, P. J., 2010, ApJ, 719, 1582
- Dierickx & Loeb (2017) Dierickx, M. I. & Loeb, A., 2017, ApJ, 836, A92
- Djorgovski et al (2011) Djorgovski, S. G., Drake, A. J., Mahabal, A. A. et al, 2011, in “The First Year of MAXI: Monitoring Variable X-ray Sources”, ed. T. Mihara & N. Kawai, Tokyo: JAXA Special Publ. (2011)
- Drake et al (2014) Drake, A. J., Graham, M. J., Djorgovski, S. G. et al, 2014, ApJS, 213, 9
- Faber et al. (2003) Faber, S., Phillips, A. C., Kibrick, R. I. et al., 2003, SPIE, 4841, 1657
- Fazio et al. (2004) Fazio, G. et al, 2004, ApJS, 154, 10
- GAIA collaboration (2016) GAIA Collaboration, Brown, A. G. A.Vallenari, A. et al., 2016, arXiv:1609.04172
- Grillmair et al. (2010) Grillmair, C. J., Laher, R., Surace, J. et al., 2010, ASP Conf, 434, 28
- Grillmair & Carlin (2016) Grillmair, C. J. & Carlin, J. L., 2016, chapter in “Tidal Streams in the Local Group and Beyond”, eds. H. Newberg & J. Carlin (see arXiv:1603.08936)
- Hernitschek et al. (2016) Hernitschek, N., Schlafly, E. .F., Sesar, B. et al., 2016, ApJ, 817, A73
- Honeycutt (1992) Honeycutt, R. K. 1992, PASP, 104, 435
- Hodapp et al. (2004) Hodapp, K. W., Kuhn, J., Thornton, R, et al., 2004, in Astrophysics & Space Science library, Vol. 300, Scientific Detectors for Astronomy, The Beginning of a New Era, ed. P. Amico, J. W. Beletic & J. E. Beletic, 501-509
- Iorio et al (2017) Iorio, G., Belokurov, V., Erkal, D., Koposov, S. E., Nipoti, C. & Fraternali, F., 2017, MNRAS, submitted, see arXiv:1707.03833
- Kafle, Sharma, Lewis et al. (2914) Kafle, P. R., Sharma, S., Lewis, G. F. & Bland-Hawthorn, J., 2014, ApJ, 794, A59
- Keller et al. (2008) Keller, S. C., Murphy, S., Prior, S., Da Costa, G. & Schmidt, B., 2008, ApJ, 678, 851
- Kinman et al. (1996) Kinman, T. D., Pier, J. R. Sunzeff, N. B., et al., 1996, AJ, 111, 1164
- Kirby et al (2011) Kirby, E. N., Lanfranchi, A., Simon, J. D. et al, 2011, ApJ, 727, 78
- Klein et al. (2014) Klein, C. R, Richards, J. R., Butler, N. R. & Bloom, J. S., 2014, arXiv:1402.4449
- Kordopatis et al. (2013) Kordopatis, G., Gilmore, G., Steinmetz, M. et al., 2013, AJ, 136, 134
- Laher et al. (2014) Laher R. R., Surace, J., Grillmair, C. J., et al., 2014, PASP 126, 674
- Law et al (2009) Law, N. M., Kulkarni, S. R., Dekany, R. G. et al., 2009, PASP, 121, 1395
- Levitan et al. (2011) Levitan, D., Fulton, B. J., Groot, P. J., et al.. 2011, ApJ, 739, 68
- Longmore, Fernley & Jameson (1986) Longmore, A. J., Fernley, J. A. & Jameson, R. F., 1986, MNRAS, 220, 279
- Longmore, Fernley & Jameson (1990) Longmore, A. J., Fernley, J. A. & Jameson, R. F., 1990, MNRAS, 247, 684
- Madore et al. (2013) Madore, B. F., Hoffman, D., Freedman, W. L. et al., 2013, ApJ, 776, A135
- Marconi et al (2015) Marconi, M., Coppola, G., Bono, G. et al, 2015, ApJ, 808, A50
- McCauliff et al. (2014) McCauliff, S., Jenkins, J. M., Catanzarite, J. et al., 2015, ApJ, 806, 6
- Miceli et al. (2008) Miceli, A., Rest, A., Stubbs, C. W. et al., 2008, ApJ, 678, 865
- Michalik, Lindegren & Hobbs (2015) Michalik, D., Lindegren, L. & Hobbs, D., 2015, A&A, 574, A115
- Nie et al. (2015) Nie, J. D., Smith, M. C., Belokurov, V. et al., 2015, ApJ, 810, A153
- Nikutta et al. (2014) Nikutta, R., Hunt-Walker, N., Nenkova, M., Ivezić, Z. & Elitzur, M., 2014, MNRAS, 442, 3361
- Nun et al. (2014) Nun, I., Pichara, K., Protopapas, P. & Kim, D.-W., 2014, ApJ, 793, A23
- Ofek et al. (2011) Ofek, E. O., Frail, D. A., Breslauer, B., Kulkarni, S. R., Chandra, P., Gal-Yam, A., Kasliwal, M. M. & Gehrels, N., 2011, ApJ, 740, 65
- Ofek et al. (2012) Ofek, E. O., Laher, R., Law, N. et al., 2012, PASP, 124, 62
- Rahmer et al. (2008) Rahmer, G., Smith, R., Velur, V et al., 2008, Proc. SPIE, 7014, 163
- Rau et al. (2009) Rau, A., Kulkarni, S. R., Law, N. M. et al., 2009, PASP, 121, 1334
- Richards et al. (2011) Richards, J. W., Starr, D. L., Butler, N. R. et al., 2011, ApJ, 733, 10
- Schlafly & Finkbeiner (2011) Schlafly, E. F. & Finkbeiner, D. P., 2011, ApJ, 373, A103
- Schlafly et al (2014) Schlafly, E. F., Green, G.., Finkbeiner, D. F., et al, 2014, ApJ, 789, A15
- Schlegel, Finkbeiner & Davis (1998) Schlegel, D., Finkbeiner, D. P. & Davis, M., 1998, ApJ, 500, 525
- Sesar et al. (2007) Sesar, B., Ivezic, A., Lupton, R. H., et al., 2007, AJ, 134, 2236
- Sesar et al. (2010) Sesar, B., Ivezić, Z., Grammer, S. H. et al., 2010, ApJ, 708, 717
- Sesar et al. (2011) Sesar, B., Jurić, M. & Ivezić, Z., 2011, ApJ, 731, A4
- Sesar et al. (2012) Sesar, B., Cohen, J. G., Levitan, D. et al., 2012, ApJ, 755, 134
- Sesar (2012) Sesar, B., 2012, AJ, 144, A114
- Sesar et al. (2013a) Sesar, B., Ivezić, Z., Sutart, J. et al., 2013a, AJ, 146, A21
- Sesar et al. (2013b) Sesar, B., Grillmair, C. J., Cohen, J. G. et al., 2013b, ApJ, 776, 26
- Sesar et al. (2014) Sesar, B., Banholzer, S. R., Cohen, J. G. et al., 2014, ApJ, 793, A135
- Sesar et al. (2017a) Sesar, B., Fouesneau, M., Price-Whelan, A., Bailer-Jones, C., Gould, A. & Rix, H.-W., 2017a, ApJ, 838, A107
- Sesar et al. (2017b) Sesar, B., Hernitschek, N., Ivezic, Z. et al., 2017b, AJ, 153, 204
- Sesar et al (2017c) Sesar, B., Hernitschek, N., Dierickx, M. I. P., Fardal, M. A. & Rix, H. W., 2017, ApJ, 844, A:L4
- Sharma et al. (2014) Sharma, M., Nayak, J., Koul, M. K., Bose, S. & Mitra, A., 2014, Research in Astronomy and Astrophysics, 14, 1491
- Skrutskie et al (2006) Skrutskie, M. F., Cutri, R. M., Stiening, R. et al, 2006, AJ, 131, 1163
- Slater et al. (2017) Slater, C. T., Nidever, D. L., Munn, J. M., Bell, E. F. & Majewski, S. R., 2017, ApJ, 832, A206
- Soszynski et al. (2016) Soszynski, I., Udalski, A., Szymanski, M. et al., 2016, Acta Astronomica, 66, 131
- Stetson (1996) Stetson, P. B., 1996, PASP, 108, 851
- Schorck et al (2009) Schorck, T., Christlieb, N., Cohen, J.G. et al, 2009, A&A, 507, 817
- Tonry et al. (2012) Tonry, J., L., Stubbs, C. W., Lykke, K. R. et al., 2012, ApJ, 750, A99
- Torrealba et al (2015) Torrealba, G., Catelan, M., Drake, A. J. et al, 2015, MNRAS, 446, 2251
- Vivas et al. (2001) Vivas, A. K., Zinn, R., Andrews, P., Bailyn, C. et al., 2001, ApJ, 554, L33
- Werner et al. (2004) Werner, M. W., Roellig, T. L., Low, F. J., et al., 2004, ApJS, 154, 1
- Wesselink (1969) Wesselink, A. J., 1969, MNRAS, 144, 297
- Wetterer & McGraw (1996) Wetterer, C. J. & McGraw, J. T., 1996, AJ, 112, 1046
- Wright et al. (2010) Wright, E. L. et al, 2010, AJ, 140, 1868
- Xue et al. (2008) Xue, X. X., Rix, H.-W., Zhao, G. et al., 2008, ApJ, 684, 1143
- Xue, Rix, Yanny et al. (2011) Xue, X. X., Rix, H. W., Yanny, B. et al., 2011, ApJ, 738, 79
- Xue et al. (2014) Xue, X. X., Ma, Z., Rix, H.-W. et al., 2014, ApJ, 784, 170
- Xue et al. (2016) Xue, X. X., Rix, H. W., Ma, Z. et al., 2016, ApJ, 809, A144
- Yanny, Rockosi, Newberg et al. (2009) Yanny, B., Rockosi, C., Newberg, H. J., et al., 2009, AJ, 137, 4377
- York et al. (2000) York, D. G., Adelman, J., Anderson Jr., J. E., et al., 2000, AJ, 120, 1579
- Zacharias et al. (2010) Zacharias, N., Finch, C., Girard, T., et al. 2010, AJ, 139, 2184
| RA | Dec | Period | 0 PhaseaaEpoch of maximum light in heliocentric Julian date 2400000 days. This choice, made for ease of computations, requires 7 digits in the period for accurate phasing at the present epoch. | Amp | Mean | N()bbNumber of epochs taken with the PTF– filter in which the star was detected as of late 2016. | N()ccNumber of epochs taken with the PTF– filter in which the star was detected as of late 2016. | QualityddObserved light curve resembles that of a RR Lyr: 1 = excellent, 2 = probable, 3 = uncertain |
|---|---|---|---|---|---|---|---|---|
| (Deg.) | (Deg.) | (days) | (days) | ( mag) | (mag) | |||
| 3.77632 | 28.37604 | 0.7038231 | 56917.70 | 0.62 | 20.64 | 39 | 3 | 2 |
| 10.51398 | 15.64457 | 0.6035999 | 55473.75 | 0.70 | 19.94 | 44 | 131 | 1 |
| 13.31085 | 17.13101 | 0.6009332 | 55477.85 | 0.66 | 19.64 | 59 | 0 | 1 |
| 21.20049 | 20.43072 | 0.5733125 | 56239.63 | 0.66 | 20.31 | 82 | 16 | 1 |
| 21.39914 | 3.82265 | 0.6442016 | 55477.74 | 0.83 | 19.37 | 483 | 78 | 1 |
| 22.09602 | 13.81008 | 0.5529058 | 55906.68 | 0.58 | 19.12 | 158 | 0 | 1 |
| 26.33246 | 29.49091 | 0.5849030 | 56178.70 | 0.74 | 19.67 | 723 | 178 | 1 |
| 28.45696 | 20.34656 | 0.5965452 | 55430.84 | 0.85 | 19.10 | 500 | 91 | 1 |
| 29.46073 | 22.95502 | 0.7648931 | 55067.03 | 0.57 | 19.10 | 85 | 11 | 1 |
| 29.92910 | 26.09113 | 0.6033530 | 55506.60 | 0.58 | 19.11 | 50 | 0 | 2 |
| 32.71250 | 30.72719 | 0.5593969 | 55889.78 | 0.88 | 19.64 | 35 | 51 | 1 |
| 82.26892 | 3.38001 | 0.6566145 | 56974.84 | 0.47 | 19.31 | 48 | 0 | 1 |
| 115.18660 | 20.78280 | 0.4653525 | 56306.62 | 0.90 | 19.60 | 221 | 37 | 1 |
| 120.40829 | 11.03271 | 0.8227144 | 56315.70 | 0.49 | 19.87 | 36 | 0 | 2 |
| 125.76719 | 20.88205 | 0.6509836 | 55561.96 | 0.61 | 20.24 | 438 | 91 | 1 |
| 133.76732 | 63.42198 | 0.5425147 | 56225.94 | 0.86 | 19.47 | 69 | 33 | 1 |
| 135.73433 | 61.63280 | 0.5863690 | 56238.90 | 0.67 | 19.57 | 173 | 100 | 1 |
| 143.29643 | 13.29081 | 0.5914273 | 55959.91 | 0.70 | 19.46 | 375 | 138 | 1 |
| 153.38060 | 37.91186 | 0.6296058 | 56354.66 | 0.69 | 19.45 | 55 | 0 | 1 |
| 158.10118 | 6.32611 | 0.5824709 | 55953.99 | 0.57 | 19.44 | 35 | 0 | 2 |
| 163.17050 | 37.51453 | 0.5940006 | 55250.78 | 0.70 | 19.55 | 185 | 77 | 1 |
| 164.48911 | 34.74506 | 0.5930000 | 57481.68 | 0.70 | 20.22 | 48 | 45 | 1 |
| 180.44336 | 29.98856 | 0.6285709 | 56328.76 | 0.64 | 19.97 | 140 | 4 | 1 |
| 180.89786 | 32.49513 | 0.5869673 | 55297.81 | 0.69 | 20.36 | 174 | 86 | 1 |
| 181.01610 | 2.64746 | 0.6868450 | 55615.01 | 1.02 | 20.08 | 65 | 87 | 1 |
| 185.11430 | 35.10371 | 0.5590766 | 56033.76 | 0.84 | 19.55 | 93 | 0 | 1 |
| 185.74637 | 45.19566 | 0.5389892 | 57125.90 | 0.94 | 19.98 | 128 | 131 | 1 |
| 188.21655 | 3.81825 | 0.6903981 | 55603.82 | 0.64 | 19.53 | 252 | 46 | 1 |
| 190.73627 | 39.43732 | 0.6328233 | 55984.06 | 0.85 | 20.18 | 83 | 8 | 1 |
| 191.65421 | 31.93755 | 0.5496644 | 55300.94 | 0.86 | 20.47 | 224 | 100 | 1 |
| 193.90346 | 45.04369 | 0.5817848 | 55301.85 | 0.76 | 19.87 | 84 | 97 | 1 |
| 196.89822 | 27.27304 | 0.4651977 | 55663.69 | 0.88 | 20.02 | 596 | 118 | 1 |
| 197.85255 | 45.04933 | 0.6086488 | 56017.80 | 0.64 | 20.03 | 110 | 94 | 1 |
| 198.01382 | 37.50263 | 0.6876892 | 55020.68 | 0.65 | 19.67 | 189 | 33 | 1 |
| 198.82190 | 43.19382 | 0.5113264 | 55320.71 | 0.88 | 20.47 | 491 | 129 | 1 |
| 199.47290 | 32.11800 | 0.5893799 | 56342.04 | 0.66 | 19.30 | 468 | 224 | 1 |
| 201.59912 | 20.38593 | 0.5929822 | 56001.94 | 0.95 | 20.05 | 29 | 17 | 1 |
| 203.98247 | 49.90129 | 0.5348190 | 55296.00 | 0.89 | 19.75 | 86 | 0 | 1 |
| 204.35236 | 38.22820 | 0.5458603 | 55319.85 | 0.76 | 20.30 | 205 | 43 | 1 |
| 205.20570 | 36.85392 | 0.5540681 | 55275.94 | 0.74 | 20.31 | 102 | 1 | 1 |
| 205.90588 | 32.55605 | 0.6121942 | 56016.83 | 0.49 | 19.82 | 297 | 41 | 1 |
| 206.48932 | 31.08889 | 0.5676502 | 55369.63 | 0.96 | 20.30 | 48 | 19 | 2 |
| 207.65234 | 44.81257 | 0.6749544 | 56017.71 | 0.84 | 20.07 | 104 | 5 | 1 |
| 209.52818 | 37.12393 | 0.7011946 | 56330.01 | 0.49 | 20.47 | 285 | 5 | 1 |
| 210.14015 | 61.58023 | 0.5085552 | 55352.88 | 0.68 | 19.50 | 118 | 0 | 1 |
| 210.61269 | 39.29613 | 0.4733887 | 56060.90 | 1.00 | 20.64 | 261 | 53 | 1 |
| 210.63774 | 38.23235 | 0.6085635 | 55637.83 | 0.76 | 20.26 | 240 | 9 | 1 |
| 211.99417 | 36.80729 | 0.6083931 | 56035.89 | 0.61 | 20.42 | 103 | 8 | 2 |
| 212.58949 | 22.25360 | 0.6129632 | 55668.81 | 0.47 | 19.51 | 49 | 82 | 1 |
| 215.60762 | 35.91516 | 0.5540740 | 55275.94 | 0.63 | 20.18 | 120 | 13 | 1 |
| 216.20433 | 47.13657 | 0.5778699 | 56065.96 | 0.62 | 20.29 | 84 | 71 | 2 |
| 218.04994 | 40.74793 | 0.7578443 | 55279.73 | 0.76 | 20.18 | 192 | 54 | 1 |
| 218.17694 | 42.63344 | 0.6518604 | 55337.82 | 0.91 | 20.25 | 129 | 18 | 1 |
| 223.34651 | 4.97518 | 0.5878099 | 56133.73 | 0.68 | 19.53 | 90 | 5 | 1 |
| 223.62280 | 35.96528 | 0.5530584 | 56035.72 | 0.64 | 19.78 | 210 | 25 | 1 |
| 226.80437 | 25.50584 | 0.6792830 | 55360.64 | 0.60 | 20.62 | 64 | 13 | 3 |
| 229.78807 | 48.06219 | 0.5459260 | 55345.80 | 1.06 | 20.02 | 59 | 0 | 1 |
| 230.30850 | 36.28413 | 0.5731339 | 56058.84 | 0.82 | 20.05 | 85 | 11 | 1 |
| 231.29987 | 37.24485 | 0.6033793 | 56075.86 | 0.47 | 19.67 | 118 | 0 | 1 |
| 233.92378 | 36.95277 | 0.5269989 | 56039.89 | 0.83 | 20.40 | 97 | 8 | 1 |
| 236.47386 | 58.07009 | 0.6181521 | 55036.85 | 0.90 | 20.18 | 523 | 180 | 1 |
| 239.07004 | 36.43287 | 0.5929263 | 55386.82 | 0.51 | 19.86 | 100 | 5 | 2 |
| 239.77188 | 38.56579 | 0.6242449 | 56039.94 | 0.46 | 20.10 | 140 | 0 | 1 |
| 240.32909 | 33.09862 | 0.5354092 | 56135.86 | 0.77 | 20.48 | 145 | 15 | 1 |
| 242.53758 | 21.51107 | 0.5912649 | 56090.65 | 0.73 | 20.27 | 28 | 1 | 3 |
| 242.69720 | 14.62067 | 0.5550773 | 55413.67 | 0.84 | 19.92 | 216 | 28 | 1 |
| 246.64397 | 6.24227 | 0.4882272 | 56003.00 | 0.92 | 19.56 | 68 | 0 | 1 |
| 246.97688 | 31.55486 | 0.5459153 | 56039.84 | 0.84 | 20.41 | 160 | 56 | 1 |
| 247.74931 | 12.76744 | 0.4665125 | 57538.67 | 1.01 | 20.53 | 145 | 0 | 2 |
| 248.35423 | 39.41171 | 0.5647064 | 55605.02 | 0.74 | 19.95 | 101 | 29 | 1 |
| 251.16412 | 38.47088 | 0.5246175 | 55702.92 | 0.95 | 19.75 | 231 | 73 | 1 |
| 253.12921 | 25.36446 | 0.6019734 | 55721.91 | 0.74 | 20.30 | 91 | 26 | 1 |
| 256.70535 | 45.84140 | 0.5876117 | 56046.88 | 0.63 | 19.65 | 192 | 36 | 1 |
| 257.61386 | 20.88444 | 0.5681136 | 55438.69 | 0.72 | 19.53 | 132 | 30 | 1 |
| 258.68228 | 34.30839 | 0.5655935 | 55407.67 | 0.92 | 19.23 | 166 | 52 | 1 |
| 258.77704 | 37.91151 | 0.6390487 | 55711.95 | 0.74 | 20.14 | 109 | 35 | 1 |
| 313.08780 | 0.13357 | 0.5592707 | 55416.69 | 0.78 | 19.95 | 163 | 66 | 1 |
| 318.20523 | 3.33563 | 0.6259214 | 55437.64 | 0.57 | 19.76 | 42 | 4 | 3 |
| 320.21838 | 6.36956 | 0.6970433 | 55467.77 | 0.55 | 19.11 | 59 | 12 | 2 |
| 321.29257 | 4.89429 | 0.5652243 | 55456.70 | 0.94 | 19.46 | 51 | 0 | 2 |
| 323.07294 | 3.48319 | 0.5174600 | 55422.74 | 0.97 | 19.39 | 116 | 0 | 1 |
| 323.74008 | 3.52009 | 0.5533006 | 55429.77 | 1.08 | 20.12 | 95 | 0 | 1 |
| 327.28622 | 1.67528 | 0.5440798 | 55042.88 | 0.83 | 19.66 | 146 | 14 | 1 |
| 328.31757 | 1.61321 | 0.6410172 | 55423.82 | 0.87 | 20.17 | 114 | 19 | 1 |
| 329.61261 | 15.67164 | 0.5728618 | 55353.93 | 0.92 | 19.31 | 116 | 17 | 1 |
| 331.79990 | 15.46090 | 0.6015934 | 55498.66 | 0.79 | 19.98 | 141 | 5 | 1 |
| 331.87677 | 13.06594 | 0.6053543 | 55445.69 | 0.56 | 20.14 | 102 | 27 | 1 |
| 332.41092 | 18.24430 | 0.5671536 | 55428.81 | 0.61 | 20.31 | 35 | 16 | 3 |
| 332.70486 | 5.19797 | 0.5691122 | 55014.77 | 0.98 | 19.72 | 39 | 30 | 1 |
| 332.72507 | 9.88418 | 0.5480604 | 55365.95 | 0.81 | 19.40 | 128 | 0 | 1 |
| 332.92017 | 20.10988 | 0.5950155 | 55765.97 | 0.77 | 19.70 | 58 | 20 | 1 |
| 333.47647 | 18.46705 | 0.6784748 | 55471.69 | 0.78 | 20.24 | 46 | 20 | 1 |
| 334.12289 | 17.94743 | 0.5823412 | 55824.91 | 0.58 | 19.92 | 90 | 42 | 1 |
| 334.17758 | 23.86207 | 0.7038231 | 55482.60 | 0.63 | 20.29 | 99 | 15 | 1 |
| 334.32181 | 3.08049 | 0.6328018 | 55055.91 | 0.57 | 19.67 | 79 | 0 | 1 |
| 334.78058 | 22.16861 | 0.5763521 | 55824.82 | 0.54 | 19.69 | 113 | 19 | 1 |
| 334.99887 | 20.37570 | 0.5833233 | 55812.69 | 0.85 | 20.47 | 216 | 12 | 1 |
| 336.45602 | 14.85005 | 0.5597054 | 55123.72 | 0.74 | 19.71 | 124 | 0 | 1 |
| 339.64056 | 8.46784 | 0.5313083 | 55038.78 | 0.88 | 20.36 | 51 | 0 | 1 |
| 343.30026 | 32.76220 | 0.5572263 | 55821.73 | 0.85 | 19.73 | 43 | 80 | 1 |
| 344.95831 | 4.83823 | 0.7089223 | 55007.93 | 0.43 | 19.14 | 105 | 0 | 1 |
| 346.05371 | 8.77550 | 0.5578092 | 55426.81 | 0.75 | 20.02 | 70 | 0 | 2 |
| 346.24451 | 7.73412 | 0.6210057 | 55416.91 | 0.74 | 20.24 | 247 | 0 | 1 |
| 346.25085 | 5.34930 | 0.4800212 | 56167.85 | 0.92 | 20.04 | 172 | 0 | 1 |
| 348.78879 | 13.35353 | 0.5378452 | 55448.79 | 0.96 | 20.05 | 197 | 0 | 1 |
| 349.55212 | 11.92246 | 0.5632662 | 56571.76 | 0.98 | 20.00 | 242 | 0 | 1 |
| 350.69650 | 33.79972 | 0.5440564 | 55142.61 | 0.71 | 19.35 | 309 | 385 | 1 |
| 351.98282 | 20.68219 | 0.5503856 | 55418.70 | 0.80 | 19.49 | 72 | 10 | 1 |
| 354.65012 | 25.68250 | 0.5205241 | 56271.65 | 0.98 | 19.10 | 138 | 89 | 1 |
| 355.48550 | 18.87469 | 0.6517739 | 55425.84 | 0.66 | 20.53 | 53 | 9 | 2 |
| 356.80493 | 3.27760 | 0.7114636 | 55038.82 | 0.54 | 19.14 | 59 | 0 | 1 |
| 358.89981 | 34.25303 | 0.5126550 | 56256.68 | 1.01 | 19.27 | 73 | 197 | 1 |
| Probable | Sgr | Stream | ||||||
| 185.831403 | 11.011716 | 0.5416933 | 55899.95 | 0.76 | ||||
| 189.730895 | 7.902692 | 0.4639002 | 55378.71 | 1.17 | 287 | 69 | 1 | |
| 191.481527 | 5.967331 | 0.6101711 | 55333.68 | 0.55 | 280 | 116 | 1 | |
| 208.767863 | 5.213217 | 0.4890867 | 55330.74 | 1.08 | 304 | 114 | 1 |
| RA | Dec | DistanceaaHeliocentric distance. | No. Spectra | bb corrected to the systemic velocity, then to the heliocentric velocity, and then to the Galactic system of rest. | Date | |
|---|---|---|---|---|---|---|
| (Deg.) | (Deg.) | (kpc) | (GSR ) | ( ) | ||
| 3.77632 | 28.37604 | 109.1 | 1 | 212.7 | 21.0 | 9/2015 |
| 10.51398 | 15.64457 | 75.6 | 1 | 240.2 | 17.7 | 9/5/2016 |
| 13.31085 | 17.13101 | 65.9 | 1 | 131.1 | 18.4 | 10/2015 |
| 21.20049 | 20.43073 | 88.3 | 1 | 124.4 | 18.4 | 10/2015 |
| 21.39914 | 3.82266 | 59.2 | 1 | 20.4 | 19.7 | 10/2015 |
| 22.09602 | 13.81008 | 50.5 | 1 | 21.2 | 17.8 | 10/2015 |
| 26.33246 | 29.49091 | 66.0 | 2 | 38.0 | 12.9 | dupccTwo Keck/Deimos spectra have been taken. See Table 3 for details. |
| 28.45696 | 20.34657 | 51.2 | 1 | 34.8 | 19.8 | 10/2015 |
| 29.46073 | 22.95502 | 54.9 | 1 | 25.9 | 17.7 | 10/2015 |
| 29.92910 | 26.09113 | 51.7 | 1 | 23.6 | 17.8 | 10/2015 |
| 32.71250 | 30.72719 | 64.4 | 1 | 56.5 | 20.0 | 10/2015 |
| 82.26892 | 3.38001 | 57.8 | 1 | 42.7 | 17.1 | 9/2014 |
| 115.18660 | 20.78290 | 60.2 | 1 | 124.7 | 19.3 | 10/2015 |
| 120.40829 | 11.03272 | 79.7 | 1 | 224.0 | 17.2 | 10/2015 |
| 125.76719 | 20.88206 | 88.6 | 1 | 43.8 | 17.4 | 1/2014ddA DBSP spectrum taken with the Hale Telescope at Palomar Observatory. |
| 133.76732 | 63.42198 | 59.2 | 1 | 47.9 | 19.8 | 4/2016 |
| 135.73433 | 61.63280 | 63.3 | 2 | 11.6 | 13.1 | dup |
| 143.29643 | 13.29081 | 60.2 | 1 | 99.0 | 18.7 | 4/2016 |
| 153.38060 | 37.91186 | 61.1 | 1 | 26.9 | 18.7 | 6/2016 |
| 158.10118 | 6.32611 | 59.4 | 1 | 102.7 | 17.8 | 4/2016 |
| 163.17050 | 37.51453 | 62.8 | 1 | 59.7 | 18.7 | 4/2015 |
| 164.48911 | 34.74506 | 85.5 | 1 | 81.8 | 17.9 | 6/2016 |
| 180.44336 | 29.98856 | 77.4 | 1 | 134.3 | 18.3 | 5/2014 |
| 180.89786 | 32.49513 | 90.9 | 1 | 54.4 | 18.6 | 5/2014 |
| 181.01610 | 2.64747 | 83.4 | 1 | 161.8 | 23.4 | 5/2014 |
| 185.11430 | 35.10371 | 61.8 | 1 | 29.7 | 19.7 | 4/2016 |
| 185.74637 | 45.19566 | 74.8 | 1 | 49.8 | 20.1 | 4/2016 |
| 188.21655 | 3.81826 | 64.9 | 1 | 56.1 | 18.2 | 5/2015 |
| 190.73627 | 39.43733 | 85.4 | 1 | 26.3 | 19.8 | 5/2014 |
| 191.65421 | 31.93755 | 94.2 | 2 | 48.6 | 14.0 | dup |
| 193.90346 | 45.04369 | 72.3 | 1 | 36.9 | 19.1 | 5/2014 |
| 196.89822 | 27.27304 | 72.9 | 1 | 103.6 | 21.8 | 4/2014 |
| 197.85255 | 45.04933 | 79.1 | 1 | 88.0 | 18.3 | 5/2014 |
| 198.01382 | 37.50263 | 69.4 | 2 | 98.9 | 12.2 | dup |
| 198.82190 | 43.19382 | 92.1 | 1 | 29.3 | 20.0 | 4/2014 |
| 199.47290 | 32.11801 | 55.9 | 1 | 98.4 | 18.4 | 5/2015 |
| 201.59912 | 20.38593 | 79.2 | 1 | 33.7 | 20.5 | 5/2014 |
| 203.98247 | 49.90129 | 67.1 | 1 | 56.8 | 20.1 | 5/2014 |
| 204.35236 | 38.22820 | 86.6 | 2 | 110.9 | 13.5 | dup |
| 205.20570 | 36.85392 | 87.3 | 2 | 49.2 | 13.4 | dup |
| 205.90588 | 32.55605 | 71.8 | 2 | 108.4 | 12.2 | dup |
| 206.48932 | 31.08890 | 87.7 | 1 | 19.4 | 20.6 | 7/2/2016 |
| 207.65234 | 44.81257 | 82.7 | 2 | 73.5 | 15.6 | dup |
| 209.52818 | 37.12393 | 100.7 | 1 | 11.3 | 17.2 | 4/2014 |
| 210.14015 | 61.58023 | 58.9 | 1 | 36.4 | 18.6 | 6/2016 |
| 210.61269 | 39.29613 | 97.6 | 1 | 38.6 | 23.9 | 4/2014 |
| 210.63774 | 38.23235 | 87.9 | 2 | 60.9 | 14.8 | dup |
| 211.99417 | 36.80729 | 94.5 | 1 | 52.3 | 18.1 | 4/2014 |
| 212.58949 | 22.25361 | 62.2 | 1 | 114.1 | 17.1 | 5/2015 |
| 215.60762 | 35.91516 | 82.4 | 1 | 56.5 | 18.2 | 4/2014 |
| 216.20433 | 47.13658 | 87.9 | 1 | 17.9 | 18.2 | 5/2014 |
| 218.04994 | 40.74793 | 89.9 | 1 | 13.2 | 19.1 | 4/2014 |
| 218.17694 | 42.63344 | 89.1 | 1 | 106.9 | 22.1 | 4/2014 |
| 223.34651 | 4.97518 | 62.2 | 1 | 4.8 | 18.6 | 5/2015 |
| 223.62280 | 35.96528 | 68.6 | 2 | 15.5 | 12.9 | dup |
| 226.80437 | 25.50584 | 106.9 | 1 | 90.3 | 17.6 | 4/2016 |
| 229.78807 | 48.06219 | 76.2 | 1 | 48.8 | 21.3 | 6/2016 |
| 230.30850 | 36.28413 | 78.2 | 1 | 71.8 | 19.6 | 5/2014 |
| 231.29987 | 37.24485 | 66.6 | 1 | 3.9 | 17.0 | 6/2016 |
| 233.92378 | 36.95277 | 90.0 | 1 | 33.6 | 19.6 | 4/2016 |
| 236.47386 | 58.07009 | 84.9 | 2 | 33.5 | 19.6 | dup |
| 239.07004 | 36.43287 | 72.4 | 2 | 175.6 | 16.1 | dup |
| 239.77188 | 38.56579 | 82.3 | 2 | 64.7 | 12.0 | dup |
| 240.32909 | 33.09862 | 93.9 | 1 | 38.8 | 19.2 | 4/2014 |
| 242.53758 | 21.51107 | 87.4 | 2 | 190.2 | 13.4 | dup |
| 242.69720 | 14.62067 | 73.0 | 1 | 106.5 | 19.7 | 6/2016 |
| 246.64397 | 6.24227 | 59.8 | 1 | 24.3 | 20.3 | 9/5/2016 |
| 246.97688 | 31.55486 | 91.4 | 2 | 81.8 | 16.3 | dup |
| 247.74931 | 12.76744 | 92.3 | 1 | 171.1 | 21.0 | 5/2014 |
| 248.35423 | 39.41171 | 74.7 | 1 | 46.9 | 21.5 | 4/2014 |
| 251.16412 | 38.47088 | 66.5 | 1 | 152.3 | 20.5 | 5/2014 |
| 253.12921 | 25.36446 | 89.2 | 2 | 82.9 | 13.4 | dup |
| 256.70535 | 45.84146 | 65.5 | 1 | 52.8 | 18.2 | 9/2015 |
| 257.61386 | 20.88444 | 61.7 | 2 | 46.0 | 13.3 | dup |
| 258.68228 | 34.30840 | 53.6 | 1 | 88.9 | 20.3 | 9/2015 |
| 258.77704 | 37.91151 | 84.2 | 2 | 83.1 | 13.4 | dup |
| 313.08780 | 0.13357 | 74.5 | 1 | 27.6 | 19.3 | 9/2014 |
| 318.20523 | 3.33564 | 70.3 | 1 | 97.6 | 17.7 | 9/2014 |
| 320.21838 | 6.36956 | 53.7 | 1 | 34.6 | 17.6 | 10/2015 |
| 321.29257 | 4.89429 | 59.6 | 2 | 118.8 | 14.4 | dup |
| 323.07294 | 3.48319 | 56.1 | 2 | 10.2 | 14.6 | dup |
| 323.74008 | 3.52009 | 80.2 | 1 | 98.3 | 21.4 | 10/2015 |
| 327.28622 | 1.67528 | 64.7 | 1 | 45.3 | 19.6 | 9/5/2016 |
| 328.31757 | 1.61321 | 85.7 | 1 | 21.5 | 18.4 | 9/2014 |
| 329.61261 | 15.67164 | 55.7 | 2 | 210.9 | 14.4 | dup |
| 331.79990 | 15.46091 | 76.9 | 1 | 26.6 | 19.4 | 10/2015 |
| 331.87677 | 13.06594 | 82.8 | 1 | 106.4 | 17.7 | 9/2014 |
| 332.41092 | 18.24431 | 88.1 | 2 | 72.6 | 12.8 | dup |
| 332.70486 | 5.19797 | 67.3 | 1 | 141.8 | 20.7 | 9/2014 |
| 332.72507 | 9.88418 | 57.4 | 1 | 256.2 | 19.5 | 10/2015 |
| 332.92017 | 20.10989 | 67.4 | 1 | 94.4 | 19.2 | 10/2015 |
| 333.47647 | 18.46705 | 89.7 | 1 | 155.1 | 19.3 | 9/2014 |
| 334.12289 | 17.94743 | 74.1 | 1 | 83.2 | 17.8 | 9/5/2016 |
| 334.17758 | 23.86207 | 92.7 | 1 | 37.1 | 18.2 | 9/5/2016 |
| 334.32181 | 3.08049 | 67.5 | 1 | 162.4 | 17.8 | 9/2014 |
| 334.78058 | 22.16861 | 66.5 | 1 | 101.6 | 17.5 | 9/5/2016 |
| 334.99887 | 20.37570 | 95.7 | 1 | 60.8 | 19.8 | 10/2015 |
| 336.45602 | 14.85005 | 66.6 | 1 | 238.2 | 19.0 | 9/2014 |
| 339.64056 | 8.46785 | 88.5 | 1 | 15.5 | 20.0 | 10/2015 |
| 343.30026 | 32.76222 | 67.1 | 1 | 57.1 | 19.8 | 10/2015 |
| 344.95831 | 4.83823 | 54.7 | 1 | 237.4 | 16.8 | 10/2015 |
| 346.05371 | 8.77550 | 76.8 | 1 | 79.8 | 19.1 | 10/2015 |
| 346.24451 | 7.73412 | 87.6 | 1 | 150.4 | 19.0 | 9/5/2016 |
| 346.25085 | 5.34935 | 74.4 | 1 | 88.8 | 20.3 | 10/2015 |
| 348.78879 | 13.35353 | 77.1 | 1 | 178.3 | 20.5 | 6/2016 |
| 349.55212 | 11.92246 | 76.2 | 1 | 75.5 | 20.8 | 6/2016 |
| 350.69650 | 33.79972 | 56.1 | 1 | 25.8 | 18.8 | 10/2015 |
| 351.98282 | 20.68220 | 59.8 | 1 | 135.7 | 19.4 | 10/2015 |
| 354.65012 | 25.68251 | 50.0 | 1 | 106.3 | 20.8 | 10/2015 |
| 355.48550 | 18.87470 | 101.4 | 1 | 100.8 | 18.4 | 9/5/2016 |
| 356.80493 | 3.27760 | 54.6 | 1 | 7.6 | 17.5 | 9/5/2016 |
| 358.89981 | 34.25304 | 53.1 | 1 | 55.9 | 20.9 | 10/2015 |
| Sgr | Stream ? | |||||
| 185.831403 | 11.011716 | 86.9 | 1 | 62.5 | 20.5 | 4/2014 |
| 189.730895 | 7.90269 | 86.1 | 1 | 25.5 | 4/2014 | |
| 191.481527 | 5.967331 | 79.5 | 1 | 4.1 | 19.2 | 5/2014 |
| 208.767863 | 5.213217 | 83.9 | 1 | 29.0 | 4/2014 |
| RA | Dec | aa corrected to the systemic velocity, then to the heliocentric velocity, and then to the Galactic system of rest. | bbThe 1 uncertainty in the GSR radial velocity. | Date |
|---|---|---|---|---|
| (2000) | (GSR: ) | () | ||
| Same night | ||||
| 135.734329 | 61.632797 | 1.6 | 18.5 | 4/5/2016 |
| 24.7 | 18.5 | 4/5/2016 | ||
| 204.352357 | 38.228202 | 111.6 | 19.1 | 4/5/2016 |
| 110.3 | 19.1 | 4/5/2016 | ||
| 205.905884 | 32.5560532 | 109.1 | 17.2 | 4/30/2014 |
| 107.7 | 17.2 | 4/30/2014 | ||
| 323.072937 | 3.48319101 | 6.0 | 20.6 | 10/14/2015 |
| 26.5 | 20.6 | 10/14/2015 | ||
| 329.612610 | 15.671644 | 217.9 | 20.3 | 10/13/2015 |
| 203.9 | 20.3 | 10/13/2015 | ||
| 332.410919 | 18.2443104 | 67.6 | 18.1 | 10/13/2015 |
| 77.5 | 18.1 | 10/13/2015 | ||
| Consecutive | Nights | |||
| 198.013824 | 37.5026283 | 109.1 | 17.2 | 4/30/2014 |
| 88.7 | 17.6 | 5/1/2014 | ||
| 205.205704 | 36.8539162 | 47.3 | 19.0 | 4/30/2014 |
| 51.0 | 19.1 | 5/1/2014 | ||
| 207.652344 | 44.8125725 | 89.9 | 22.1 | 4/30/2014 |
| 57.1 | 21.0 | 5/1/2014 | ||
| 239.070038 | 36.4328651 | 181.5 | 22.7 | 4/30/2014 |
| 169.8 | 19.7 | 5/1/2014 | ||
| 246.976883 | 31.5548630 | 84.4 | 23.0 | 4/30/2014 |
| 79.2 | 23.2 | 5/1/2014 | ||
| 1 Month Apart | ||||
| 26.332462 | 29.490912 | 43.3 | 18.2 | 9/19/2015 |
| 32.8 | 19.0 | 10/11/2015 | ||
| 242.537582 | 21.5110741 | 183.8 | 18.9 | 6/2016 |
| 196.6 | 18.9 | 7/2016 | ||
| 258.777034 | 37.911508 | 20.0 | 6/2016 | |
| 20.0 | 9/5/2016 | |||
| Nights Separated By | A Year or More | |||
| 191.654206 | 31.937550 | 22.8 | 19.8 | 4/30/2016 |
| 74.3 | 23.0 | 5/29/2014 | ||
| 210.637741 | 38.2323532 | 55.3 | 20.9 | 4/30/2014 |
| 66.6 | 19.1 | 4/5/2016 | ||
| 223.622803 | 35.9652824 | 25.4 | 18.3 | 5/18/2014 |
| 5.6 | 18.3 | 6/4/2016 | ||
| 236.473862 | 58.0700874 | 20.7 | 27.7 | 4/30/2014 |
| 46.2 | 20.2 | 6/4/2016 | ||
| 239.771881 | 38.5657883 | 48.9 | 17.0 | 5/28/2014 |
| 80.5 | 17.0 | 6/4/2016 | ||
| 253.129211 | 25.3644562 | 78.2 | 19.0 | 4/30/2014 |
| 87.7 | 19.0 | 6/4/2016 | ||
| 257.613861 | 20.8844376 | 65.0 | 18.8 | 9/2015 |
| 27.0 | 18.8 | 4/2016 | ||
| 321.292572 | 4.89428520 | 140.7 | 20.4 | 10/2015 |
| 96.9 | 20.4 | 7/2016 |
| RA | Dec | PTFR | Comments |
|---|---|---|---|
| QSO | (not in NED | as of 7/2016) | |
| 3.776320 | 28.376036 | 20.6 | broad em. 5650 Å |
| 22.518406 | 5.325709 | 20.1 | broad em. 6200, 9200 Å |
| 67.040609 | 0.551808 | 19.9 | broad em. 6600 Å |
| 328.276107 | 10.135809 | 20.0 | broad em. 5450 Å |
| 338.817911 | 8.405663 | 20.3 | broad em. 6850 Å |
| Variable | Stars | ||
| 211.637100 | 20.845664 | 19.9 | variable |
| 241.766698 | 22.951423 | 19.8 | variable, period 0.2278 days. |
| 250.411946 | 39.1151 | 20.2 | variable |
| 291.426967 | 38.535437 | 20.3 | variable |
| 341.865780 | 27.500455 | 20.5 | RRc ? period 0.336 days |
| 344.190408 | 5.472125 | 19.7 | SX Phe period 0.0402351 days |
| 355.394934 | 13.261791 | 19.8 | RRc period 0.423 days |
| Range | N | aaAll velocities are in the Galactic standard of rest. | bbThe values are followed by values in parentheses which have a measurement uncertainty of 20 removed in quadrature. |
|---|---|---|---|
| () | ()bbThe values are followed by values in parentheses which have a measurement uncertainty of 20 removed in quadrature.) | ||
| All | |||
| 51 | 97.4 (95.3) | ||
| 35 | 103.5 (101.5) | ||
| 86 | 99.4 (97.4) | ||
| 26 | 6.2 | 91.9 (89.7) | |
| OutliersccOutliers are defined as: for kpc, for kpc. | |||
| 47 | 78.7 (76.1) | ||
| 33 | 89.4 (87.1) | ||
| 80 | 83.1 (80.7) | ||
| 23 | 68.0 (65.0) |
| Range | N(RR Lyr) | N(RR Lyr) | FractionaaThe ratio of the number of candidate RR Lyr selected from the PTF database in 2014 with to those from this sample with Keck/Deimos for each distance bin. |
|---|---|---|---|
| (kpc) | Confirmed RR Lyr | PTF Candidates | (Confirmed/Candidates) |
| with bbThe number of RR Lyr in this distance bin from the PTF sample that have been confirmed with Keck/Deimos spectroscopy and have a given in Table 2. | |||
| 33 | 155 | 0.21 | |
| 38 | 86 | 0.44 | |
| 15 | 30 | 0.50 | |
| 14 | 25 | 0.56 | |
| 9 | 16 | 0.56 | |
| 3 | 8 | 0.38 |