A wide dispersion in star formation rate and dynamical mass of solar mass black hole host galaxies at redshift 6
Abstract
ALMA [CII] line and continuum observations of five redshift quasars are presented. This sample was selected to probe lower black hole mass quasars than most previous studies. We find a wide dispersion in properties with CFHQS J02160455, a low-luminosity quasar with absolute magnitude , remaining undetected implying a limit on the star formation rate in the host galaxy of , whereas other host galaxies have star formation rates up to hundreds of solar masses per year. Two other quasars have particularly interesting properties. VIMOS2911 is one of the least luminous quasars known with , yet its host galaxy is experiencing a very powerful starburst. PSO J16713 has a broad and luminous [CII] line and a neighbouring galaxy a projected distance of 5 kpc away that is also detected in the [CII] line and continuum. Combining with similar observations from the literature, we study the ratio of [CII] line to far-infrared luminosity finding this ratio increases at high-redshift at a fixed far-infrared luminosity, likely due to lower dust content, lower metallicity and/or higher gas masses. We compile a sample of 21 high-redshift quasars with dynamical masses and investigate the relationship between black hole mass and dynamical mass. The new observations presented here reveal dynamical masses consistent with the relationship defined by local galaxies. However, the full sample shows a very wide scatter across the black hole mass – dynamical mass plane, whereas both the local relationship and simulations of high-redshift quasars show a much lower dispersion in dynamical mass.
Subject headings:
cosmology: observations — galaxies: evolution — galaxies: high-redshift — quasars: general1. Introduction
Massive galaxies in the nearby universe have supermassive (greater than a million times the mass of the Sun) black holes lurking at their centers. In most cases these black holes are inactive as there is little gas or stars close enough to the event horizon to be accreted. However, the very existence of these black holes shows that a large amount of material must have been accreted earlier in the lifetime of the galaxy when it would have been viewed as an active galactic nucleus (AGN), and when particularly luminous and not obscured, as a quasar. The masses of local supermassive black holes are correlated with the velocity dispersion of the bulges in their host galaxies (Ferrarese & Merritt, 2000). This has led to almost two decades of study into the physical reason for this correlation, in which AGN feedback and merging are key components (see Kormendy & Ho 2013 for a review). Studying relations between galaxies and quasar activity out to the earliest cosmic epochs are key for understanding this puzzle.
Pioneering work with bolometer cameras showed that between 20% and 40% of very high-redshift () quasars have detectable millimeter or sub-millimeter emission from cool dust (Bertoldi et al., 2003; Robson et al., 2004; Wang et al., 2008, 2011; Omont et al., 2013). The relatively weak correlation between far-infrared luminosity and quasar bolometric luminosity, in addition to spectral energy distribution fits for a few quasars, suggest the predominant source of energy that heats the dust comes from extreme starbursts with star formation rates , rather than the quasar itself (Wang et al., 2011).
This field has undergone a revolution with the superb sensitivity and spatial resolution of the Atacama Large Millimeter Array (ALMA). The host galaxies of almost all quasars are now detectable with ALMA in both continuum and the [C ii] m emission line, providing information on their dust properties, chemical enrichment, star formation rate and kinematics. The highest redshift quasar hosts show a wide range of star formation rates (Omont et al., 2013; Willott et al., 2013; Venemans et al., 2012, 2016; Wang et al., 2016) and the rate for moderate luminosity quasars is significantly lower at than at (Willott et al., 2015a), implying a looser connection between these two processes at an early epoch.
Previous studies have shown that the black hole masses of quasars lie above that expected for their dynamical masses determined from the [C ii] line if they were to lie on the same tight correlation in place at low redshift (Walter et al., 2004; Wang et al., 2013, 2016). Although unknown disk inclinations can be an issue for individual sources, the full sample should be viewed at random orientations within those allowed by AGN unification schemes (Carilli & Wang, 2006; Ho, 2007). If this observational result is true it shows that black hole accretion was much more rapid in the early universe, possibly requiring super-Eddington accretion or extremely massive black hole seeds (Volonteri et al., 2015). However, when studying the most luminous quasars in an optically-selected sample only those with the most massive black holes get selected and therefore if there is a wide dispersion in the relation between black hole and dynamical mass, there is an expectation of a bias to high black hole masses in the observed sub-sample compared to that in a volume-limited sample (Willott et al., 2005; Lauer et al., 2007). Indeed, in a previous study of three moderate luminosity quasars with lower black hole mass, we showed that their dynamical masses match those of local galaxies (Willott et al., 2015a).
In this paper we extend the sample size of our study of moderate luminosity quasars with black holes in the mass range at . In Section 2 we present the new ALMA observations and data processing. Section 3 details the results for each quasar. Section 4 compares the [C ii] line and far-IR luminosities and studies how the ratio between these two depends on far-IR luminosity and redshift. Section 5 analyzes the correlation between black hole and dynamical mass in the light of these new observations. Cosmological parameters of , and (Planck Collaboration, 2014) are assumed throughout.
2. Observations
The high-redshift quasars observed in ALMA Cycle 3 project 2015.1.00606.S are CFHQS J021627045534 (J02160455), CFHQS J022122080251 (J02210802), CFHQS J232908030158 (J23290301), PSO J167.6415-13.4960 (PSO J16713) and VIMOS2911991793 (VIMOS2911). The quasars were selected for study with ALMA based on their black hole masses to substantially increase the number of quasars with such low black hole mass observed in the [C ii] line and dust continuum. Positions, redshifts, black hole masses and references for the observed quasars are given in Table 1. J23290301 has previously been observed in ALMA Cycle 0 project 2011.0.00243.S but was not securely detected in either line or continuum with only a hint of [C ii] line emission at the expected frequency (Willott et al., 2013). The Cycle 3 observations presented here use more antennae to provide better sensitivity.
Observations of each quasar were made using 37 or 38 of the 12 m diameter antennae. The maximum baselines were between 450 and 700 m providing beam major axes in the range 0.6 to 0.8 arcsec for good sensitivity to emission extended on the expected quasar host galaxy scales of a few kpc. On-source integration times ranged from 43 to 49 minutes. Observations of the science targets were interleaved with those of nearby phase calibrators.
The band 6 (1.3 mm) receivers were set to cover the frequency range expected for the redshifted [C ii] transition (=1900.5369 GHz) and to sample the dust continuum. Each setup has four GHz basebands, two pairs of adjacent bands with a GHz gap in between. One of these bands was centred on the expected [C ii] location based on published Mg ii (if available) or Ly redshifts. Each baseband covers a redshift interval of . The 128 channels in each band have width 15.625 MHz (equal to km s-1 to km s-1 at these redshifts). The three bands without the line were used to form a continuum image.
Data processing was performed with the CASA software package111http://casa.nrao.edu. All five targets were imaged in a consistent manner with no channel binning and natural baseline weighting (Briggs robust parameter = 2). The line cube data were continuum-subtracted in the -plane with flagging of channels showing line emission. Flux calibration used either Pallas or a quasar from the ALMA bandpass calibrator grid source list. The estimated flux calibration uncertainties are 5% and this is added in quadrature to all flux measurement uncertainties. The continuum sensitivity achieved ranged from 11 to 14 Jy per beam rms. The single channel rms in the band containing the line was between 0.09 and 0.14 mJy per beam.
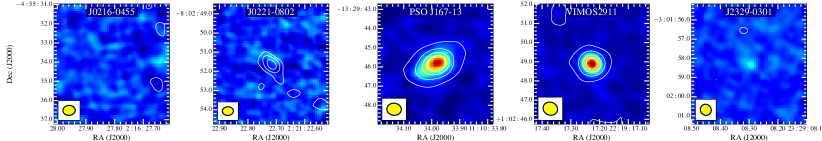
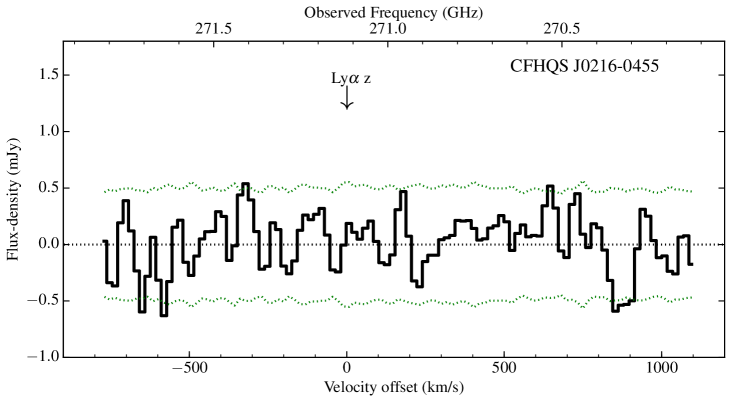
Measurements from the ALMA data are given in Table 2. Line moment zero and continuum images are shown in Figure 1. For obvious line-detected sources the minimum and maximum channels to use in the moment zero image were those showing significant () emission in the individual channel maps. For sources without line detections the central 20 channels ( km s-1) were used to make the moment zero map. Extracted spectra of the sub-band where the [C ii] line is expected are plotted in Figure 2. For detected sources an elliptical aperture of the measured source FWHM along the major and minor axes was used to extract the spectrum. For sources without line detections an elliptical aperture of the beam size was used. Uncertainties in each line channel and in the continuum were determined by placing random apertures of equivalent size within regions of the maps free of genuine emission and with similar noise to the center.
| Quasar | RA | DEC | |||||
|---|---|---|---|---|---|---|---|
| J02160455 | 02:16:27.81 | 04:55:34.1b | – | – | |||
| J02210802 | 02:21:22.718 | 08:02:51.62c | – | ||||
| PSO J16713 | 11:10:33.986 | 13:29:45.85d | – | ||||
| VIMOS2911 | 22:19:17.227 | +01:02:48.88d | – | ||||
| J23290301 | 23:29:08.30 | 03:01:58.3d |
Notes.—
a Uncertainties on black hole masses are dominated by the 0.3 dex scatter in the calibration of the Mg ii virial technique.
b Optical position from discovery paper.
c Millimeter continuum position from this work.
d Millimeter line position from this work.
References: e Willott et al. (2009); f Willott et al. (2010a); g Willott et al. (2010b); h Venemans et al. (2015); i Kashikawa et al. (2015); j Willott et al. (2007).
3. Notes on individual quasars
3.1. CFHQS J02160455
J02160455 is the lowest luminosity quasar discovered in the CFHQS with absolute magnitude (Willott et al., 2009). The redshift of is based on a strong and narrow Ly line, where the broad red wing of this line identifies the object as an AGN rather than a Lyman break galaxy. Mg ii emission has not been detected for this quasar, so the black hole mass of is instead estimated assuming that it accretes at the Eddington rate (Willott et al., 2010a).
In the ALMA data there is no detection of either line or continuum emission. The expected [C ii] redshift is based on the narrow Ly line so we do not think it likely that the true position of the [C ii] line is outside the observed band. The adjacent sub-band was searched for a [C ii] line, but no line was seen. The non-detection in both line and continuum is consistent with a low star-formation rate ( limit of ) in the host galaxy of this very low black hole mass and luminosity quasar.
3.2. CFHQS J02210802
This quasar is typical of the luminosity and black hole mass of the CFHQS survey. The Ly emission line is broad and asymmetric with a narrow spike at (Willott et al., 2010b). The near-IR spectrum shows a relatively broad Mg ii line that has a large uncertainty on both its peak location () and line width, due to the faintness of the quasar and high sky noise at this wavelength (Willott et al., 2010a).
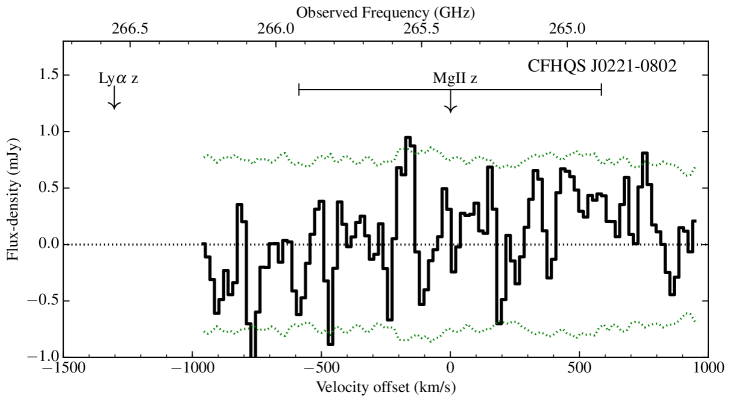
Figure 1 shows a clear continuum detection (at ), but no evidence for the [C ii] line is seen in either the line map or extracted spectrum. Despite the low S/N of the continuum detection, the source is significantly elongated at an angle very different from the beam. The adjacent sub-band was also searched for line emission but none was seen. For the ALMA observations we centred the frequency sub-band based on the Mg ii redshift. Figure 2 shows the spectrum with the [C ii] locations expected based on the Mg ii and Ly lines. The uncertainty in the Mg ii redshift covers most of the sub-band. Unfortunately the adjacent sub-band was set to cover lower frequency so it does not cover the [C ii] location for the Ly redshift. Based on the typical [C ii] line to continuum ratios for quasars with this far-IR luminosity (see Section 4) we would expect to have detected the [C ii] line at significance. Offsets of km s-1 between the Mg ii and [C ii] redshifts have been found for other high-redshift quasars by Venemans et al. (2016). Therefore we make the assumption that the [C ii] redshift is similar to the Ly redshift and was therefore missed by these observations. Table 2 gives limits based on the non-detection of [C ii] in this quasar, but we do not use these for the remainder of this paper because of the high likelihood that the line was missed.
3.3. PSO J16713
This is one of three quasars discovered in the Pan-STARRS1 survey by Venemans et al. (2015). The optical–near-IR spectrum shows broad Ly and Mg ii giving a redshift of and black hole mass of , the only one in their paper with , which is why we targeted it with ALMA.
The ALMA data reveal PSO J16713 as a very luminous and extended source in both continuum and [C ii] line emission. A Gaussian fit to the continuum yields a deconvolved size of arcsec at position angle of 120∘, equivalent to kpc. The continuum emission is asymmetric being more extended to the south-east than north-west of the peak (Figure 1).
The source is similarly extended in the [C ii] line. The peak positions of line and continuum are co-incident and there is a roughly constant line to continuum ratio across the whole source, however a Gaussian fit to the [C ii] moment zero map gives a larger deconvolved size of arcsec at position angle of 124∘, equivalent to kpc.
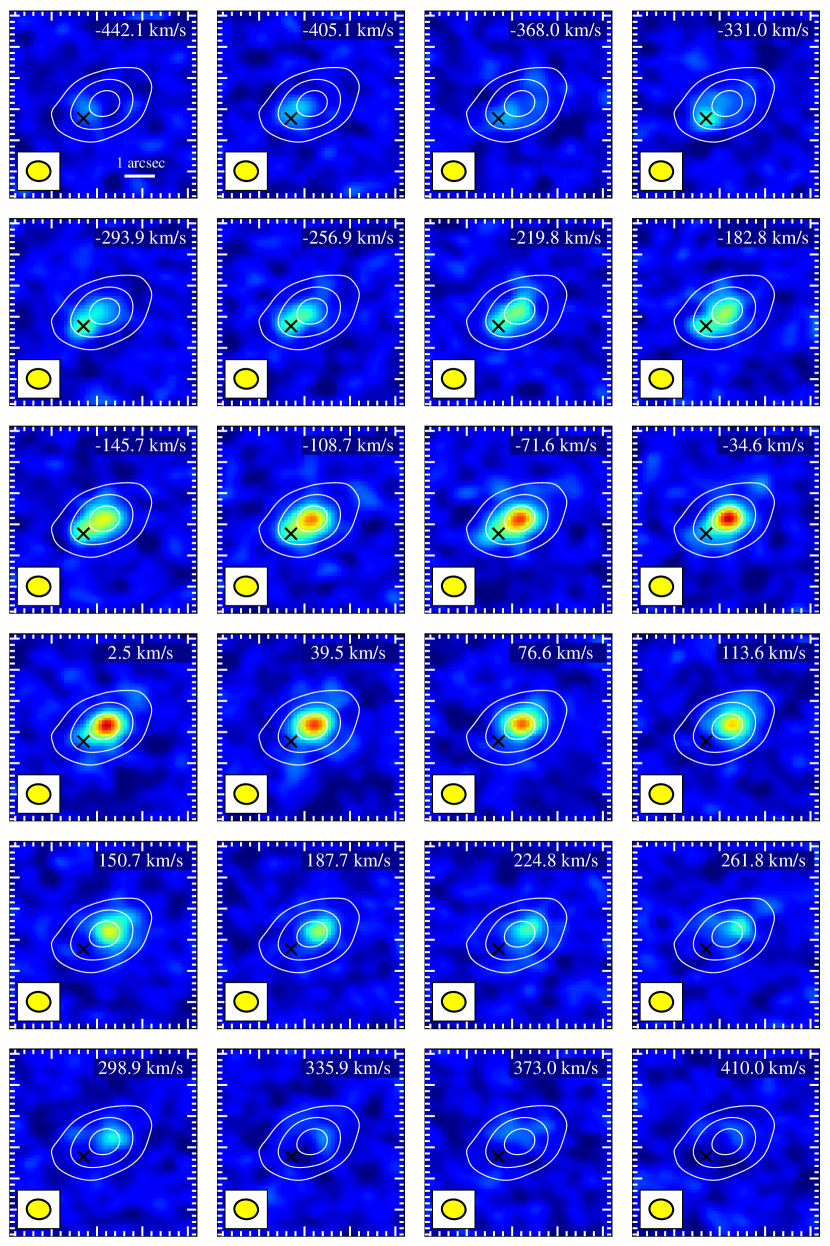
To get a clearer idea of the spatial and velocity structure of the [C ii] emission of PSO J16713 in Figure 3 we show maps in separate velocity bins. Each bin is the sum of two of the original 128 channels, i.e. 31.25 MHz or 37.0 km s-1. Zero velocity is defined based on the redshift of the [C ii] peak that is co-incident with the peak in continuum and therefore assumed to be co-located with the quasar nucleus. The centroid of the emission smoothly shifts towards the north-west as velocity increases from zero to higher values. This is reminiscent of some other quasar host galaxies at this spatial resolution (Wang et al., 2013; Willott et al., 2013), possibly indicative of a rotating disk. As one moves to negative velocities a similar effect of shifting the centroid to the south-east is seen, but in addition there is a distinct source located 0.9 arcsec from the quasar centre at 11:10:34.030 13:29:46.301. This source is visible at a wide range of velocities from to km s-1 with a peak at km s-1 or redshift . Because this source is spatially and spectrally distinct from the main component we interpret this as a companion galaxy lying at a projected distance of only 5.0 kpc from the quasar. Similar [C ii] companions have been seen in a few other quasars (Decarli et al., 2017) and galaxies (Willott et al., 2015b; Maiolino et al., 2015). Multiple UV components separated by a few kiloparsecs are very common in the most UV-luminous galaxies at this epoch (Bowler et al., 2017), suggesting a high merger rate for such galaxies. It is likely that high black hole mass quasars are hosted in similar galaxies.
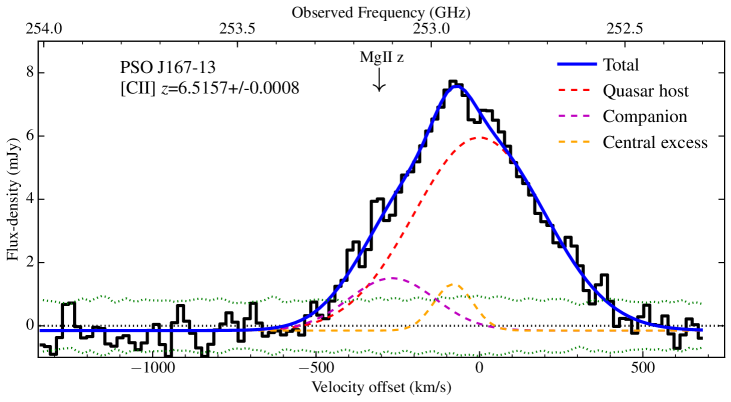
The extracted [C ii] spectrum (Figure 2) shows a broad (500 km s-1), approximately Gaussian, profile. However, we know from Figure 3 that this is composed of multiple components. The peak in the [C ii] spectrum is offset by about km s-1 from the zero velocity defined by the peak at the [C ii] quasar position. This is because of additional components at negative velocities. In addition there is the relatively broad ( to km s-1) companion galaxy component visible at a positional offset of 0.9 arcsec from the quasar. Therefore we fit the [C ii] spectrum for this source with a combination of three Gaussians; one for the quasar host, one for the companion galaxy and one for what we term the central excess at the peak of the integrated [C ii] profile. The relative velocities of these Gaussian components are fixed based on the information from Figures 2 and 3 at km s-1 for the quasar host, km s-1 for the companion galaxy and km s-1 for the central excess and only the amplitude and width of the Gaussians allowed to vary as free parameters. The resulting fit is shown in Figure 2 to provide a good fit to the integrated spectrum.
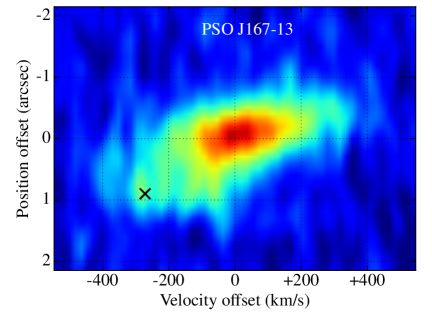
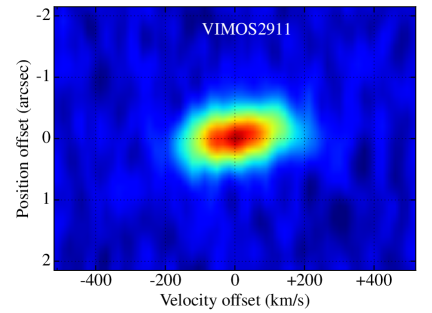
In Figure 4 we show a position-velocity (P-V) diagram obtained by taking a slice along the major axis defined by the quasar host and companion. This shows clearly the two separate components in space and velocity and suggests the companion galaxy has further structure that would perhaps be possible to separate with higher spatial resolution observations. The P-V diagram further suggests the narrow central excess component at km s-1 may be located at 0.5 to 1.5 arcsec south-east of the quasar in roughly the same location in projected space as the companion. This is reminiscent, but on a scale a factor of two larger, to the [C ii] P-V diagram of the Lyman break galaxy WMH5 (Willott et al., 2015b) that has been interpreted as two sub-components undergoing infall along a filament forming a massive galaxy (Jones et al., 2017) as seen in simulations (Pallottini et al., 2017). At positive velocities the P-V diagram also shows a velocity gradient, as was seen in the channel maps, indicative of a rotating disk. Follow-up at higher resolution would be required to verify this interpretation.
For the dynamical mass estimate in Section 5 we use a deconvolved size for the quasar host only of arcsec ( kpc) calculated by replacing the south-east half of the [C ii] emission with a copy of the emission to the north-west. This ensures only the potential galaxy disk component contributes to the dynamical mass estimate, not that of the companion galaxy or central excess.
Venemans et al. (2015) quote an ionized near-zone size of proper Mpc for this quasar based on the Mg ii redshift of . If one instead assumes the [C ii] redshift of as the systemic redshift the near-zone size would be proper Mpc. Therefore the revised redshift does not make a significant change to the near-zone size for this quasar.
| Quasar | FWHM[CII] | SFR[CII] | SFRFIR | ||||||
|---|---|---|---|---|---|---|---|---|---|
| km s-1 | Jy km s-1 | Jy | |||||||
| J02160455a | – | – | – | ||||||
| J02210802a | – | – | |||||||
| PSO J16713b | |||||||||
| VIMOS2911 | |||||||||
| J23290301 |
Notes.—
Quoted uncertainties in , SFR[CII] and SFRFIR only include measurement uncertainties, not the uncertainties in extrapolating from a monochromatic to integrated luminosity or that of the luminosity-SFR calibrations. The effect on and SFRFIR for dust temperatures different from the nominal K are given by scaling factors of 0.7 and 1.7 for K and 60 K respectively. All upper limits are .
a Limits involving [C ii] lines for these two quasars assume that the line lies within the observed ALMA frequency band. This is particularly uncertain for J02210802 where we suspect the line lies outside the observed frequency range.
b For PSO J16713 all data except the FWHM include the companion galaxy because it cannot be separated in the continuum. From the fit in Figure 2 the quasar host component accounts for 80% of the total [C ii] emission.
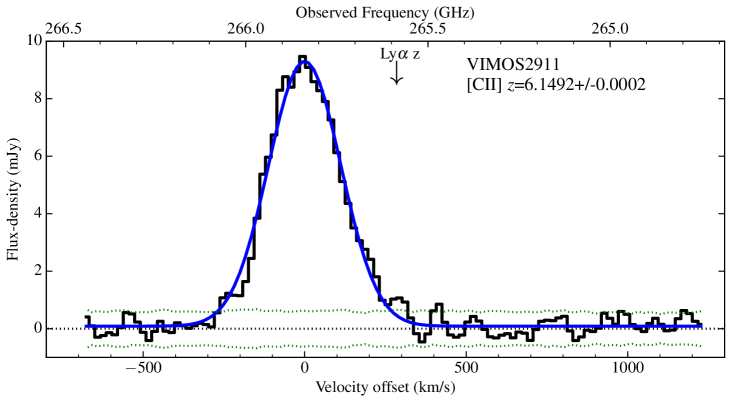
3.4. VIMOS2911
VIMOS2911 is a faint quasar discovered at in the Subaru High-z Quasar Survey of Kashikawa et al. (2015). With absolute magnitude it was the second quasar, after CFHQS J02160455, to be found in the rest-frame UV luminosity range overlapping that of star-forming galaxies. The black hole mass has not yet been measured using broad emission line widths, but assuming that it accretes at the Eddington rate (see Section 5 for rationale of this assumption), Kashikawa et al. (2015) find it to have .
Considering the low luminosity and black hole mass of VIMOS2911, the ALMA observations show a surprisingly powerful starburst in the host galaxy. There are very strong [C ii] line and continuum detections, only a little less luminous than for PSO J16713. In the continuum the source has a deconvolved size of arcsec at position angle of 142∘, with the major axis size equivalent to kpc. The [C ii] moment zero source size is somewhat larger at arcsec at position angle of 20∘, equivalent to kpc. The greater extent of [C ii] than continuum seen for PSO J16713 and VIMOS2911 is characteristic of high-redshift quasars with high S/N detections (Wang et al., 2013), potentially because some fraction of the dust is heated by the quasar. However, for VIMOS2911 the low quasar luminosity would imply a negligible contribution to the dust continuum luminosity and its luminosity is expected to be mostly due to star formation (see Section 4 for further discussion) .
The extracted spectrum of VIMOS2911 (Figure 2) is well fit by a single Gaussian with FWHM=264 km s-1, which is fairly narrow for a quasar host galaxy. The P-V diagram (Figure 4) shows much more symmetry than PSO J16713 and a gradual change in peak location versus velocity as would be found for a marginally-resolved disk (c.f. the quasars in Wang et al. 2013).
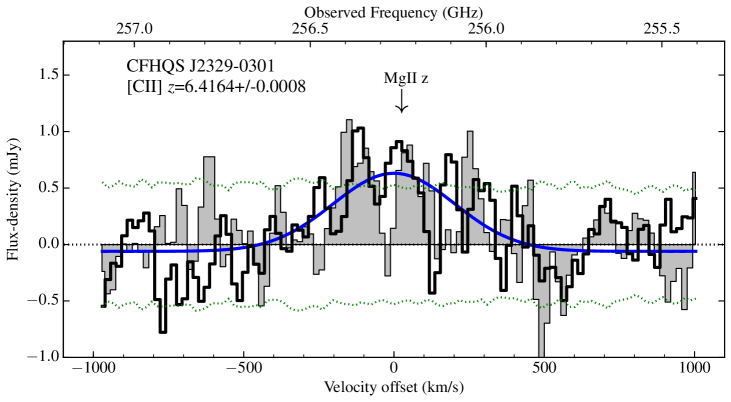
3.5. CFHQS J23290301
CFHQS J23290301 is a quasar based on the Mg ii redshift with black hole mass . It is embedded in a luminous Ly halo extending over 15 kpc (Goto et al., 2009; Willott et al., 2011). In Cycle 0 we made ALMA observations that did not detect either line or continuum reaching limits quoted as Jy km s-1 and Jy (Willott et al., 2013). Weak [C ii] emission at a significance level insufficient to be called a secure detection was noted in the Cycle 0 data. The new Cycle 3 data goes deeper and in the following we will compare it with the Cycle 0 data.
Inspection of the [C ii] data cube and continuum map both show weak emission at a position 0.5 arcsec north of the expected position. However this expected position is based on optical data with an astrometric uncertainty of 0.5 arcsec. As noted in Willott et al. (2013) there is a lower redshift galaxy 7 arcsec north of the quasar detected in the optical and ALMA continuum. The spatial offset between this galaxy and the weak continuum emission matches that between this galaxy and the optical quasar thereby proving that the [C ii] and continuum detections are indeed from the quasar.
The continuum is detected with flux-density Jy, so only and consequently barely visible in contours on Figure 1. This low flux explains why it was not visible in the Cycle 0 observations. The continuum detection is taken seriously here because it coincides with a higher significance () detection in the [C ii] line. As seen in Figure 2 the line is fairly broad and appears to have three or more peaks, but this may be due to noise. The redshift from a Gaussian fit almost exactly matches that of the Mg ii line. Also plotted on Figure 2 is a thin grey line showing the Cycle 0 spectrum. This has been extracted over the same region as the Cycle 3 spectrum, so shows a higher flux than the spectrum presented in Willott et al. (2013) which used a smaller extraction region centred 0.5 arcsec to the south. It can be seen that the Cycle 0 spectrum has positive emission at similar frequencies to the Cycle 3 spectrum, but with higher noise. The Cycle 3 flux of Jy km s-1 is higher than the limit in Willott et al. (2013). This is explained by the smaller aperture and smaller FWHM assumed when deriving that limit. The [C ii] moment zero deconvolved source size is arcsec at position angle of 25∘, equivalent to kpc.
4. [CII] and FIR Luminosities
From the observed continuum and line measurements we make determinations of far-infrared and [C ii] line luminosities and from these estimates of the star formation rate. The far-IR luminosity integrated over rest-frame 42.5 to 122.5 m is determined from the observed 1.2 mm continuum assuming a greybody spectrum with dust temperature, K and emissivity index, , to be consistent with previous works. There are few measurements of quasar dust SEDs extending into the observed millimeter, but Venemans et al. (2016) measured the continuum slope in ALMA data of one quasar and found it implied a temperature of K, consistent with our assumed temperature. We also calculate the far-IR luminosity for two other values of dust temperature to give an indication of the likely systematic uncertainty. For K and K the scaling factors to apply to are 0.7 and 1.7 respectively. This uncertainty due to dust temperature is included in the error bars plotted in Figure 5.
To convert from to SFR we use the relation
| (1) |
appropriate for a Chabrier IMF (Carilli & Walter, 2013). Note this assumes that all the dust is heated by star formation and not by the quasar. The star formation rate can also be determined from the [C ii] luminosity. We use the relation
| (2) |
of Sargsyan et al. (2014) that is valid to a precision of 50% for a wide range of low-redshift star-forming galaxies and consistent with other low-redshift studies (De Looze et al., 2014; Herrera-Camus et al., 2015).
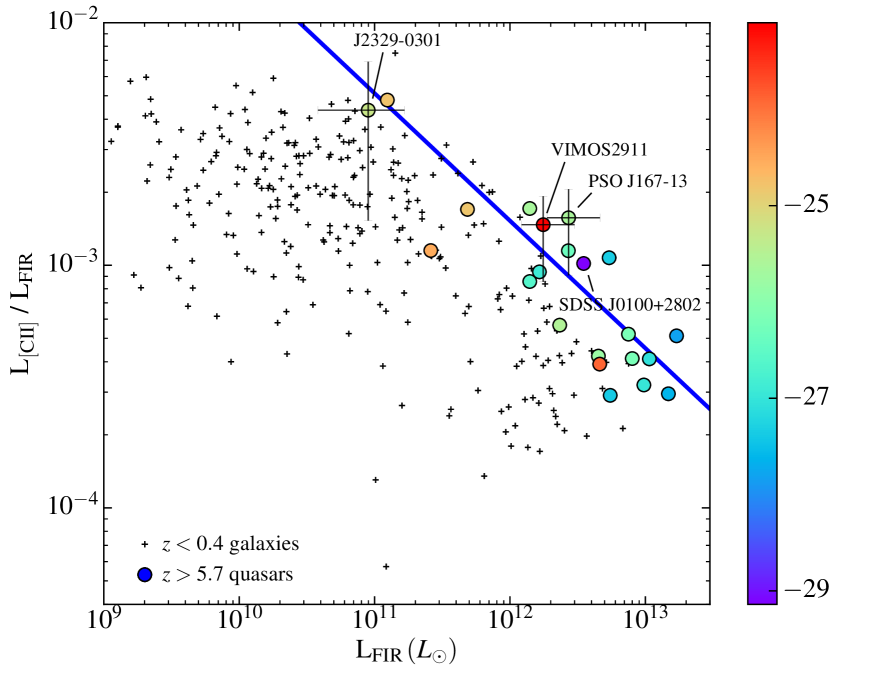
As seen in Table 2, values of star formation derived from these two methods, [C ii] line and dust continuum, are comparable for these quasars. The two values would be equal for the case where the ratio of is . At low redshift it is well known that the most luminous, and hottest, infrared galaxies have a relative deficit of [C ii] emission with ratios of a few , compared to a few for normal star-forming galaxies (De Looze et al., 2014; Díaz-Santos et al., 2017). A number of factors contribute to this correlation, but the overwhelming factor appears to be an increase in the radiation field in compact starburst regions (Díaz-Santos et al., 2017). Within individual galaxies there is a clear decrease in the ratio with increasing SFR density (Smith et al., 2017). Figure 5 shows the trend of a decreasing ratio with increasing for a compilation of galaxies at from Graciá-Carpio et al. (2011) and Sargsyan et al. (2012).
For high-redshift galaxies a similar trend of decreasing with increasing has been found, however at a given the ratio appears higher than at low redshift (Stacey et al., 2010; Brisbin et al., 2015). In the pre-ALMA era it was only possible to observe ultraluminous () galaxies at high redshifts. With ALMA detections of line and continuum down to in galaxies the difference between the ratios at low- and high-redshift has been reduced (Willott et al., 2015a, b; Capak et al., 2015).
In Figure 5 we plot the ratio of against for 22 quasars at . There is a clear correlation here that approximately matches the slope seen at lower redshift. We fit the relationship between and for the high- quasar sample using orthogonal distance regression that accounts for errors in both axes. We find
| (3) |
indicating a steeper correlation than in our previous work (slope of 1.27 in Willott et al. 2015). The difference is due to the increased sample size and a change in fitting method that accounts for errors in both axes. For the ratio line plotted in Figure 5 there is a logarithmic slope of . There are some indications from our data that the slope flattens at , just as it does for the low-redshift galaxies.
The high-redshift best fit relationship is offset by a factor of three compared to the low-redshift galaxies. There are several factors that may cause this offset. Fisher et al. (2014) suggested that high-redshift galaxies are deficient in dust, as also seen in rest-frame UV observations (Bouwens et al., 2014), and have low metallicities with properties similar to scaled-up local dwarfs. Such galaxies typically have (Cormier et al., 2015), similar to the low-luminosity end of the quasar relation. Narayanan & Krumholz (2017) present a model where the [C ii] emission arises predominantly at the surfaces of clouds and suggest it is the higher gas mass at early epochs that causes a higher ratio of [C ii] to continuum emission.
Smith et al. (2017) showed that in individual nearby galaxies there is a correlation with both metallicity and radius, in that there is enhanced [C ii] relative to continuum, in the more metal-poor, outer regions of the galaxies. In addition to this they also showed a strong anti-correlation of the ratio with star formation rate density, which also obviously increases towards the center. It is interesting to compare this with observations of high-redshift quasars. Whilst the quasars are mostly only just resolved in current ALMA observations, in cases where deconvolved sizes can be measured it has always been found that the [C ii] emission is somewhat more extended than the dust continuum as we found for PSOJ16713 and VIMOS2911 here (Wang et al., 2013; Cicone et al., 2015; Venemans et al., 2016). This is in agreement with the spatially-resolved results at lower redshift.
One possibility to explain the more extended line than continuum emission in quasars is that a large fraction of the energy that heats the dust comes from the quasar nucleus. In Figure 5 we color-coded the quasar sample with their absolute magnitudes. A positive correlation between quasar luminosity and far-IR luminosity does exist as has been seen previously (Wang et al., 2011; Omont et al., 2013; Venemans et al., 2016). However, there is a large amount of scatter and significantly the most luminous and least luminous quasars in the sample, SDSS J0100+2802 (Wang et al., 2016), and VIMOS2911 (this paper), have very similar values of both and . In particular, the fact that the most luminous known quasar has a relatively high ratio suggests that it is not necessarily the presence of a luminous AGN that depresses the global [C ii] to FIR ratio.
An alternative to using the ratio of [C ii] to far-IR luminosities is to calculate the rest-frame equivalent width, EW[CII], of the [C ii] line. This quantity has the advantage of not depending on the extrapolation from a single far-IR continuum point to the integrated far-IR luminosity. For our three quasars with detections in line and continuum we find EW[CII]=1.56 (PSO J16713), 1.74 (VIMOS2911) and 4.86 (J23290301) m. These are comparable to the typical value of EW[CII]=1.27 m for local starburst galaxies (Venemans et al., 2016).
5. Dynamical Mass and Black hole mass
The aim of this observing program was to increase the number of quasars at and black hole masses with ALMA line and continuum measurements. This region of parameter space is sparsely populated to date with the majority of ALMA observations of quasars having black hole masses . As described earlier, only by fully sampling a wide range of black hole masses can we avoid the biases imposed by scatter.
Measuring dynamical masses at these high redshifts with marginally resolved data is a challenge as clear evidence for ordered kinematics is not usually available. However, many quasars do show spatially-resolved velocities with a velocity gradient from one side of the major axis to the other (Wang et al., 2013; Willott et al., 2013; Venemans et al., 2016; Decarli et al., 2017). Here we follow the method of Wang et al. (2013) in assuming that the observed [C ii] emission comes from a thin disk where the observed velocity structure is entirely due to rotation. The fact that most of the spectra are not flat-topped or double-horned velocity profiles shows that the thin disk assumption is indeed only an approximation of the dynamical mass. The inclination angle, , is determined by the ratio of the deconvolved minor () and major () axes, . The circular velocity is FWHM. Then the dynamical mass is given by
| (4) |
where is the disk diameter in kpc, calculated as the deconvolved Gaussian spatial FWHM.
Our sample consists of 21 of the 22 quasars discussed in Section 4 and plotted on Figure 5. We exclude SDSS J10440125 because the [C ii] and CO () spectra differ, indicating complex dynamics (Wang et al., 2013). All quasars have measured [C ii] FWHM, although for SDSS J1148+5251 we instead use the CO observations of Stefan et al. (2015) for the reasons discussed in Wang et al. (2016). Four quasar host galaxies are unresolved in the rest-frame FIR line data so for these we assume a size of kpc, which is the median of the resolved sources. This is a reasonable assumption as the upper limits are generally greater than this value. Nine quasars do not have deconvolved minor axis sizes available, so for these we assume the random orientation angle of 55∘. For the three quasars presented in this paper we determine dynamical masses of PSO J16713 , VIMOS2911 and J23290301 .
Black hole masses of the quasars are mostly based on the Mg ii broad emission line virial calibration as reported in Willott et al. (2010a); De Rosa et al. (2011, 2014); Wang et al. (2013); Venemans et al. (2013, 2015); Wu et al. (2015); Shao et al. (2017). The uncertainties on black hole masses are all dominated by the 0.3 dex scatter in the calibration of the Mg ii virial technique. For three quasars, Mg ii information is not available, so their black hole masses are estimated from their UV luminosities assuming they accrete at the Eddington luminosity as is commonly observed for such high-redshift quasars (Jiang et al., 2007; Willott et al., 2010a; De Rosa et al., 2011).
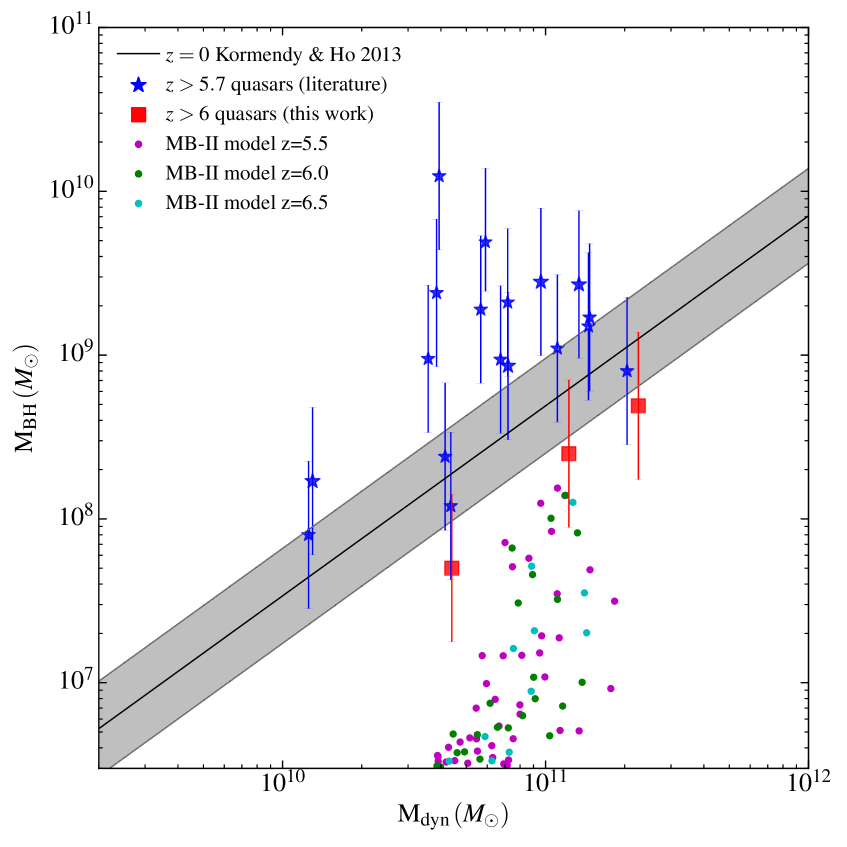
In Figure 6 we plot the black hole mass against the dynamical mass for these 21 quasars. The three new additions from this paper are shown as red squares. It is clear that our effort to target quasars with low black hole mass reveals a different picture to previous works based mostly on the most massive black holes. All three of our new observations show black hole masses at a given dynamical mass below, but consistent with, the relation of Kormendy & Ho (2013) (equating to ). The distribution of dynamical masses for these three quasars is consistent with the same distribution as for quasars with black hole masses a factor of 10 to 100 times greater. The new observations serve to enforce the results of previous works (Willott et al., 2015a; Wang et al., 2016) that there is no strong correlation between the two properties in quasars, but that the scatter is very much larger in the early universe than it is today.
We remind the reader that all the quasar data plotted in Figure 6 has been calculated using the same rotating disk assumption for the dynamical mass, but even if some quasar hosts are dispersion-dominated it would not strongly affect these results. Even with the new data it is still not yet possible to determine the true relationship at between dynamical mass and black hole mass in a volume-limited sample as there will be many black holes with still lower mass that cannot be identified as AGN with current observations.
High-resolution cosmological hydrodynamical simulations can now simulate large enough volumes to trace the early growth of supermassive black holes. Whilst high-resolution volumes containing the most massive black holes are still out of reach, recent works have enabled volumes containing black holes of mass up to . The MassiveBlack-II simulation of Khandai et al. (2015) includes star formation, black hole accretion and feedback and provides a theoretical comparison to our observations. In Figure 6 we show the black hole mass and dynamical mass of the dark matter halo catalogues from MassiveBlack-II at three redshifts: . For the dynamical mass we use the circular velocities of the halos from the simulation and an assumed size equal to the median of our 21 quasars ( kpc). This enables a direct comparison of the mass within the same radius rather than the full extent of the halo. The dynamical masses are then calculated with Equation (4) in the same way as for the quasar sample.
The simulated quasars with have dynamical masses of , consistent with some of our quasars such as J23290301, but on average somewhat higher than the typical dynamical mass for these quasars of a few times . The observations show a much greater scatter than the simulations. In part this is because of a wider range of for the observations than the single value used with the simulation data, but the observations also show a larger range of . In particular the simulations predict a very steep relationship with a wide range of black hole masses hosted by a narrow range of halo masses, whereas the observations show a wide spread in both properties. The slope of the correlation in the simulations is much steeper than that at as rapid exponential accretion causes an increase in black hole mass much faster than the slow accumulation in dark matter halos.
6. Conclusions
The ALMA observations presented here for five quasars with black hole masses show a wide range of properties. The lowest optical luminosity quasar, J02160455, is undetected in both the [C ii] line and the continuum, indicating a star formation rate in its host galaxy of . J23290301, undetected in ALMA Cycle 0 data, is now just detected with SFR . J02210802 has a dust continuum detection revealing SFR , typical of highly star-forming galaxies. For J02210802 we speculate the lack of a [C ii] detection is due to a velocity offset between the line and that targeted by these observations. VIMOS2911, despite being a low luminosity quasar, resides in a host galaxy undergoing a powerful starburst with estimated star formation rate of . The source is extended in both line and continuum with deconvolved sizes of 2 to 3 kpc and there is a velocity gradient across the source.
For PSO J16713 we found a very luminous and extended source in both line and continuum, revealing a powerful starburst with SFR . In addition to an extended (5 kpc) disk with a velocity gradient, the [C ii] data reveal a companion galaxy at a projected distance of 5 kpc and probably at least one more velocity component offset from the main galaxy spatial location. This system appears to be an example of a high-density region where a massive galaxy is forming by accretion of star-forming sub-clumps as seen in some other galaxy observations (Willott et al., 2015b; Maiolino et al., 2015; Decarli et al., 2017; Bowler et al., 2017) and in simulations of [C ii] emission in the early universe (Katz et al., 2017; Pallottini et al., 2017).
We have investigated the ratio of [C ii] to far-IR emission in a sample of 22 quasars. We found a correlation between this ratio and the far-IR luminosity with a logarithmic slope of , similar to the slope seen in nearby luminous and ultraluminous galaxies. However, the high-redshift quasar sample is offset by a factor of three compared to the low-redshift galaxies. This increase in [C ii] line luminosity at higher redshift could be due to lower dust content, lower metallicity or higher gas masses. For two of our quasars where it could be measured, the size of the [C ii]-emitting region is larger than the size of the dust-emitting region, which has been seen in other high- and low-redshift galaxies (Wang et al., 2013; Cicone et al., 2015; Venemans et al., 2016; Smith et al., 2017).
Our study significantly increases the number of high-redshift quasars containing moderate mass black holes with measured dynamical masses. All three quasars in this paper fall below the relation for low-redshift galaxies, contrary to what has been observed to date for high-redshift quasars with higher black hole masses. The distribution of dynamical masses for these three low black hole mass quasars is consistent with the distribution for quasars with black hole masses ten to a hundred times greater. There is no significant correlation between these two properties in high-redshift quasars, but there is a much larger scatter than seen in galaxies in the local universe. We compared our measurements with the results of simulations of quasar hosts (Khandai et al., 2015). The simulated quasars reside in a narrower range of halo masses than the observed quasars, with a typical value a little higher than the median of the observations in the same black hole mass range. However the simulations do predict a relatively weak correlation between these two quantities at , as observed. The weak correlation is likely an effect of the rapid accretion growth of supermassive black holes at early times. In contrast, at later times, merging and AGN feedback tighten the relationship.
References
- Bañados et al. (2015) Bañados, E., Decarli, R., Walter, F., et al. 2015, ApJ, 805, L8
- Bertoldi et al. (2003) Bertoldi, F., Carilli, C. L., Cox, P., et al. 2003, A&A, 406, L55
- Bouwens et al. (2014) Bouwens, R. J., Illingworth, G. D., Oesch, P. A., et al. 2014, ApJ, 793, 115
- Bowler et al. (2017) Bowler, R. A. A., Dunlop, J. S., McLure, R. J., & McLeod, D. J. 2017, MNRAS, 466, 3612
- Brisbin et al. (2015) Brisbin, D., Ferkinhoff, C., Nikola, T., et al. 2015, ApJ, 799, 13
- Capak et al. (2015) Capak, P. L., Carilli, C., Jones, G., et al. 2015, Nature, 522, 455
- Carilli & Walter (2013) Carilli, C. L., & Walter, F. 2013, ARA&A, 51, 105
- Carilli & Wang (2006) Carilli, C. L., & Wang, R. 2006, AJ, 131, 2763
- Cicone et al. (2015) Cicone, C., Maiolino, R., Gallerani, S., et al. 2015, A&A, 574, A14
- Cormier et al. (2015) Cormier, D., Madden, S. C., Lebouteiller, V., et al. 2015, A&A, 578, A53
- De Looze et al. (2014) De Looze, I., Cormier, D., Lebouteiller, V., et al. 2014, A&A, 568, A62
- De Rosa et al. (2011) De Rosa, G., Decarli, R., Walter, F., et al. 2011, ApJ, 739, 56
- De Rosa et al. (2014) De Rosa, G., Venemans, B. P., Decarli, R., et al. 2014, ApJ, 790, 145
- Decarli et al. (2017) Decarli, R., Walter, F., Venemans, B. P., et al. 2017, Nature, 545, 457
- Díaz-Santos et al. (2017) Díaz-Santos, T., Armus, L., Charmandaris, V., et al. 2017, ApJ, 846, 32
- Ferrarese & Merritt (2000) Ferrarese, L., & Merritt, D. 2000, ApJ, 539, L9
- Fisher et al. (2014) Fisher, D. B., Bolatto, A. D., Herrera-Camus, R., et al. 2014, Nature, 505, 186
- Goto et al. (2009) Goto, T., Utsumi, Y., Furusawa, H., Miyazaki, S., & Komiyama, Y. 2009, MNRAS, 400, 843
- Graciá-Carpio et al. (2011) Graciá-Carpio, J., Sturm, E., Hailey-Dunsheath, S., et al. 2011, ApJ, 728, L7
- Herrera-Camus et al. (2015) Herrera-Camus, R., Bolatto, A. D., Wolfire, M. G., et al. 2015, ApJ, 800, 1
- Ho (2007) Ho, L. C. 2007, ApJ, 669, 821
- Jiang et al. (2007) Jiang, L., Fan, X., Vestergaard, M., et al. 2007, AJ, 134, 1150
- Jones et al. (2017) Jones, G. C., Willott, C. J., Carilli, C. L., et al. 2017, ApJ, 845, 175
- Kashikawa et al. (2015) Kashikawa, N., Ishizaki, Y., Willott, C. J., et al. 2015, ApJ, 798, 28
- Katz et al. (2017) Katz, H., Kimm, T., Sijacki, D., & Haehnelt, M. G. 2017, MNRAS, 468, 4831
- Khandai et al. (2015) Khandai, N., Di Matteo, T., Croft, R., et al. 2015, MNRAS, 450, 1349
- Kormendy & Ho (2013) Kormendy, J., & Ho, L. C. 2013, ARA&A, 51, 511
- Lauer et al. (2007) Lauer, T. R., Tremaine, S., Richstone, D., & Faber, S. M. 2007, ApJ, 670, 249
- Maiolino et al. (2005) Maiolino, R., Cox, P., Caselli, P., et al. 2005, A&A, 440, L51
- Maiolino et al. (2015) Maiolino, R., Carniani, S., Fontana, A., et al. 2015, MNRAS, 452, 54
- Narayanan & Krumholz (2017) Narayanan, D., & Krumholz, M. R. 2017, MNRAS, 467, 50
- Omont et al. (2013) Omont, A., Willott, C. J., Beelen, A., et al. 2013, A&A, 552, A43
- Pallottini et al. (2017) Pallottini, A., Ferrara, A., Gallerani, S., et al. 2017, MNRAS, 465, 2540
- Planck Collaboration (2014) Planck Collaboration. 2014, A&A, 571, A16
- Robson et al. (2004) Robson, I., Priddey, R. S., Isaak, K. G., & McMahon, R. G. 2004, MNRAS, 351, L29
- Sargsyan et al. (2014) Sargsyan, L., Samsonyan, A., Lebouteiller, V., et al. 2014, ApJ, 790, 15
- Sargsyan et al. (2012) Sargsyan, L., Lebouteiller, V., Weedman, D., et al. 2012, ApJ, 755, 171
- Shao et al. (2017) Shao, Y., Wang, R., Jones, G. C., et al. 2017, ApJ, 845, 138
- Smith et al. (2017) Smith, J. D. T., Croxall, K., Draine, B., et al. 2017, ApJ, 834, 5
- Stacey et al. (2010) Stacey, G. J., Hailey-Dunsheath, S., Ferkinhoff, C., et al. 2010, ApJ, 724, 957
- Stefan et al. (2015) Stefan, I. I., Carilli, C. L., Wagg, J., et al. 2015, MNRAS, 451, 1713
- Venemans et al. (2016) Venemans, B. P., Walter, F., Zschaechner, L., et al. 2016, ApJ, 816, 37
- Venemans et al. (2012) Venemans, B. P., McMahon, R. G., Walter, F., et al. 2012, ApJ, 751, L25
- Venemans et al. (2013) Venemans, B. P., Findlay, J. R., Sutherland, W. J., et al. 2013, ApJ, 779, 24
- Venemans et al. (2015) Venemans, B. P., Bañados, E., Decarli, R., et al. 2015, ApJ, 801, L11
- Venemans et al. (2017) Venemans, B. P., Walter, F., Decarli, R., et al. 2017, ApJ, 837, 146
- Volonteri et al. (2015) Volonteri, M., Capelo, P. R., Netzer, H., et al. 2015, MNRAS, 449, 1470
- Walter et al. (2004) Walter, F., Carilli, C., Bertoldi, F., et al. 2004, ApJ, 615, L17
- Wang et al. (2008) Wang, R., Wagg, J., Carilli, C. L., et al. 2008, AJ, 135, 1201
- Wang et al. (2011) —. 2011, AJ, 142, 101
- Wang et al. (2013) —. 2013, ApJ, 773, 44
- Wang et al. (2016) Wang, R., Wu, X.-B., Neri, R., et al. 2016, ApJ, 830, 53
- Willott et al. (2015a) Willott, C. J., Bergeron, J., & Omont, A. 2015a, ApJ, 801, 123
- Willott et al. (2015b) Willott, C. J., Carilli, C. L., Wagg, J., & Wang, R. 2015b, ApJ, 807, 180
- Willott et al. (2011) Willott, C. J., Chet, S., Bergeron, J., & Hutchings, J. B. 2011, AJ, 142, 186
- Willott et al. (2013) Willott, C. J., Omont, A., & Bergeron, J. 2013, ApJ, 770, 13
- Willott et al. (2005) Willott, C. J., Percival, W. J., McLure, R. J., et al. 2005, ApJ, 626, 657
- Willott et al. (2007) Willott, C. J., Delorme, P., Omont, A., et al. 2007, AJ, 134, 2435
- Willott et al. (2009) Willott, C. J., Delorme, P., Reylé, C., et al. 2009, AJ, 137, 3541
- Willott et al. (2010a) Willott, C. J., Albert, L., Arzoumanian, D., et al. 2010a, AJ, 140, 546
- Willott et al. (2010b) Willott, C. J., Delorme, P., Reylé, C., et al. 2010b, AJ, 139, 906
- Wu et al. (2015) Wu, X.-B., Wang, F., Fan, X., et al. 2015, Nature, 518, 512