LLAMA: Normal star formation efficiencies of molecular gas in the centres of luminous Seyfert galaxies
Abstract
Using new APEX and JCMT spectroscopy of the CO 21 line, we undertake a controlled study of cold molecular gas in moderately luminous (L erg s-1) Active Galactic Nuclei (AGN) and inactive galaxies from the Luminous Local AGN with Matched Analogs (LLAMA) survey. We use spatially resolved infrared photometry of the LLAMA galaxies from 2MASS, WISE, IRAS & Herschel, corrected for nuclear emission using multi-component spectral energy distribution (SED) fits, to examine the dust-reprocessed star-formation rates (SFRs), molecular gas fractions and star formation efficiencies (SFEs) over their central 1–3 kpc. We find that the gas fractions and central SFEs of both active and inactive galaxies are similar when controlling for host stellar mass and morphology (Hubble type). The equivalent central molecular gas depletion times are consistent with the disks of normal spiral galaxies in the local Universe. Despite energetic arguments that the AGN in LLAMA should be capable of disrupting the observable cold molecular gas in their central environments, our results indicate that nuclear radiation only couples weakly with this phase. We find a mild preference for obscured AGN to contain higher amounts of central molecular gas, which suggests a connection between AGN obscuration and the gaseous environment of the nucleus. Systems with depressed SFEs are not found among the LLAMA AGN. We speculate that the processes that sustain the collapse of molecular gas into dense pre-stellar cores may also be a prerequisite for the inflow of material on to AGN accretion disks.
keywords:
galaxies: ISM – galaxies: Seyfert – galaxies: star formation – ISM: molecules – infrared: galaxies – methods: statistical1 Introduction
Active Galactic Nuclei (AGN111We use the acronym ‘AGN’ for both singular and plural forms.) are important phases in the life cycle of a galaxy, during which its central supermassive black hole (SMBH) accretes material from the circum-nuclear environment (the inner few 100s of pc). The amount of material needed to fuel an AGN is not large; a powerful Seyfert galaxy with a fiducial bolometric luminosity of erg s-1 can be sustained for a Myr through the accretion of only M⊙ of gas (assuming a characteristic radiative efficiency of accretion per cent). This constitutes a minute fraction of the gas usually available in the central regions of spiral galaxies, but as it falls into the deep potential well of an SMBH, it can gain a tremendous amount of energy, some of which will be liberated in the form of radiation, winds, and relativistic jets. The coupling of the liberated energy (or momentum) with extended gas is believed to significantly impact the host galaxy, both in the circum-nuclear environment, where it is responsible for the regulation of SMBH scaling relationships, and if the AGN is powerful enough, over the entire host (see Fabian (2012) and references therein). Indeed, AGN feedback is the crucial input needed in galaxy formation theory to explain the shut-down of star formation in massive galaxies over the history of the Universe (Bower et al. 2006; Croton et al. 2006; Somerville et al. 2008).
Cold molecular gas is the primary raw material for the formation of new stars (see Kennicutt & Evans (2012) for a recent extensive review). The incidence and surface density of molecular gas is closely related to the star-formation rate (SFR) within galaxies (Bigiel et al. 2008; Schruba et al. 2011). Molecular gas scaling laws, as these relationships have been widely denoted, exist even over regions as small as kpc in star-forming galaxies (Leroy et al. 2013), and their exact form is known to depend on the compactness and intensity of the star-formation associated with the gas (e.g. Genzel et al. 2010, and references therein). The efficiency with which stars form in molecular clouds (the ‘star formation efficiency’; hereafter SFE) is moderated by their turbulent support against self-gravitational collapse (e.g. Krumholz & McKee 2005), which is influenced by a number of physical and dynamical processes. In this work, we examine whether energy from an AGN has an important impact on the SFE in the central regions of galaxies. This is an important test of the ability of AGN to directly influence the material responsible for star formation in galaxies.
Our study considers the nature of molecular gas within 1–3 kpc of the nucleus222We will use the term ‘central’ consistently to refer to the inner few kpc of a galaxy. in moderately luminous nearby Seyfert galaxies (Section 2.2). This physical scale is large enough to average over many molecular clouds and is therefore insensitive to stochasticity in the SFE due to variations in the dense molecular component between individual clouds (Lada et al. 2012). However, we are also looking at a region of these galaxies small enough that the energetic feedback from the current phase of accretion in their AGN can potentially drive out or influence a major part of the cold gas (Section 5.1).
The global SFE is known to be a function of gross galaxy properties (Saintonge et al. 2011, 2012), such as stellar mass, level of disturbance and offset from the so-called ‘Galaxy Main Sequence of star formation’ (e.g. Speagle et al. 2014). It is well-established that AGN host galaxies have distinguishing properties: they tend to be massive galaxies of intermediate Hubble type (large disks and bulges; e.g. Adams 1977; Schawinski et al. 2010), and show higher rates of dusty star-formation than other galaxies of similar mass (e.g. Dahari & De Robertis 1988; Kauffmann et al. 2003; Rosario et al. 2016). Therefore, any investigation into the direct influence of AGN on the nature of molecular gas should be sensitive to the particularities of AGN hosts. As a trivial example, local AGN and inactive galaxies selected solely on the basis of a magnitude-limited catalog, such as the RC3 (Third Reference Catalogue of Bright Galaxies; de Vaucouleurs et al. 1991), will differ in their stellar mass distributions. Since the SFE decreases with stellar mass (Saintonge et al. 2011), the median SFE among the AGN of this hypothetical sample would be lower than that of the inactive galaxies, purely due to the bias of the AGN host population. To overcome this, our study has adopted a careful control strategy for overall galaxy properties, to help discern the possible effect of AGN feedback on central molecular gas independent of systematic AGN-independent trends (Section 2.1).
Cold molecular gas in galaxies reveals itself most effectively through emission in the rotational lines of the polar diatomic 12CO molecule, an abundant component of metal-enriched interstellar molecular gas (e.g., Solomon & de Zafra 1975). Since the advent of millimetre-wave molecular spectroscopy in astronomy, the low order 12CO rotational lines have been the principal tracer of the bulk of the molecular gas in galaxies (e.g. Young & Scoville 1991). The use of these features, however, comes with a degree of complexity. In most circumstances, the low order CO lines are optically thick, so their use as a mass proxy, through the CO-to-H2 conversion factor , is sensitive to the metallicity, geometry, and cloud structure of the molecular gas emitting the lines (Genzel et al. 2012; Bolatto, Wolfire & Leroy 2013). In general, these properties are not known and have to be assumed. A common approach is to adopt an average found for the disk of the Milky Way, though there is considerable real variation in this factor in the disks of galaxies (Sandstrom et al. 2013). In addition, the centres of galaxies often show depressed , which, if not taken into account, could mistakenly imply incorrectly low gas masses, and by extension, incorrectly high SFEs in these environments. In this study, we use a refined statistical approach that propagates our uncertain knowledge of essential conversions such as to quantify the differences in gas fractions (Section 4.2) and SFEs (Section 4.5) in the centres of luminous Seyferts and inactive galaxies.
Local AGN have been the target of several CO studies, mostly with single-dish telescopes with beams that covered most of the emission from the host galaxies (Heckman et al. 1989; Maiolino et al. 1997; Curran et al. 2001; Bertram et al. 2007). In recent years, interferometry is increasingly being used for small-scale studies of kinematics and outflows in Seyfert galaxies (e.g. García-Burillo et al. 2005, 2014), a field set to burgeon with the advent of ALMA.
Early work reported differences in the gas content and SFE between Seyfert galaxies and inactive galaxies, as well as differences across the various types of Seyferts (Heckman et al. 1989). Since then, other large sample studies have suggested that these results were driven by selection effects and that Seyfert hosts actually have normal SFEs (e.g. Maiolino et al. 1997). On the other hand, among more luminous local AGN, Bertram et al. (2007) reported enhanced SFEs intermediate between normal galaxies and strong starbursts, suggesting a connection between the phenomenon of luminous AGN fuelling and the ultra-luminous dusty star-forming galaxies. A major complexity when interpreting these papers is that the characteristic host properties of the AGN were not always adequately controlled for when making comparisons of inactive galaxies. There is also uncertainty in the level to which the AGN contaminates some of the FIR emission that was used to estimate the SFR, particularly in studies of luminous systems. This work adopts a careful control strategy and a uniform multi-wavelength analyses to jointly compare the SFE of AGN and inactive galaxies.
Section 2 describes our experimental setup, including sample selection and the compilation of essential measurements. Section 3 outlines our statistical approach, followed by the examination of key results in Section 4. We discuss the interpretation of our findings in Section 5. Throughout this paper, we assume a WMAP9 concordance cosmology (Hinshaw et al. 2013) as adapted for the Astropy333http://www.astropy.org/ Python package (Astropy Collaboration et al. 2013). Unless otherwise specified, a Chabrier IMF (Chabrier 2003) is assumed for stellar population-dependent quantities. All quoted uncertainties are equivalent to 1 standard deviation, and we adopt a threshold probability of 5 per cent when evaluating the statistical significance of a difference from a Null Hypothesis.
2 Data and Measurements
The properties of our sample of AGN and inactive galaxies are described below, followed by a description of new CO spectroscopy, archival CO data, multi-wavelength photometry and the spectral energy distribution (SED) fitting method used to derive IR luminosities of the dust heated by star-formation and the AGN. Most of datasets used in this work can be obtained from public repositories. Raw and reduced APEX CO spectral data may be obtained directly from the lead author.
2.1 The LLAMA sample
The Luminous Local AGN with Matched Analogs (LLAMA444http://www.mpe.mpg.de/llama) project has targetted 20 southern AGN and a set of 19 inactive galaxies that serve as a carefully-selected control sample, to explore the relationships between on-going nuclear activity and circum-nuclear dynamics and star-formation. The continuing program will obtain HST imaging, high-spatial resolution AO-assisted near-infrared (NIR) integral-field unit spectra with the VLT/SINFONI and high S/N contiguous optical-NIR IFU spectra with VLT/XSHOOTER for all sources. The AGN were selected on the basis of their luminosities in the 14–195 keV band, from the SWIFT-BAT all-sky survey. The choice of ultra-hard X-ray selection ensures a minimal sensitivity to modest levels of X-ray obscuration, with obscuration-dependent incompleteness only becoming important at equivalent Hydrogen column densities cm-2, i.e., in the Compton-thick regime (Ricci et al. 2015). The AGN in LLAMA are comprised of a volume-limited sample with , L erg s-1, and declination . The inactive control sample are galaxies with no known signatures of nuclear activity, selected from the RC3 (de Vaucouleurs et al. 1991) to satisfy the same observability criteria and redshift limit as the AGN, and are matched to them within dex in H-band luminosity, in RC3 Hubble type, and in galaxy inclination. They tend to be at somewhat lower distances than the AGN (Davies et al. 2015, also see Figure 6 of this paper).
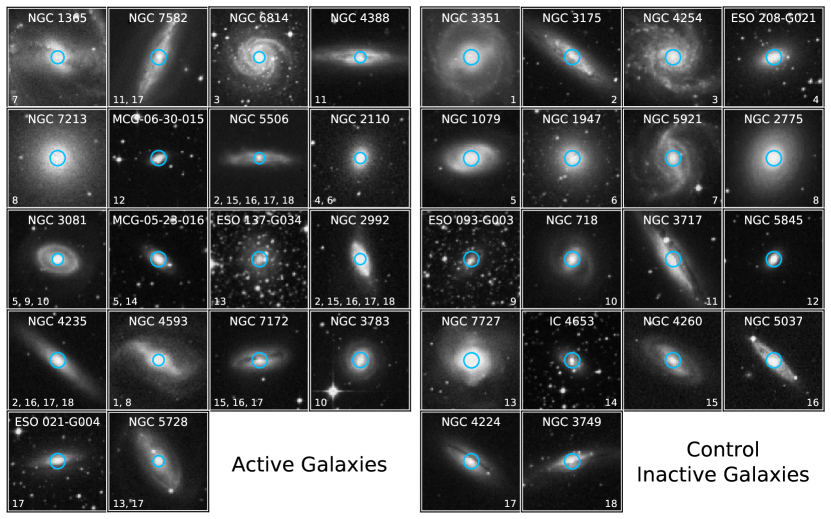
Figure 1 displays DSS R-band images of the 36 LLAMA galaxies used in this study. Centaurus A (NGC 5128) was excluded from the study due to its proximity – it is a third of the distance of the next nearest LLAMA AGN. Its unique matched analog, NGC 1315, was also removed. MCG-05-14-012 (ESO 424-12) was excluded because its low stellar mass and large distance implied unreasonably long observing times to satisfy our CO characterisation criteria (see below).
The AGN and control galaxies in Figure 1 are ordered by distance. A number key system is used to indicate the AGN that are matched to each control galaxy. A single control galaxy may be matched to more than one AGN within our matching tolerances, and reciprocally, an AGN may have more than one control galaxy. A visual examination of Figure 1 is a useful exercise to ascertain the scope and accuracy of our matching approach.
The AGN in LLAMA are nearby well-studied Seyfert galaxies with a wealth of contextual data. Spectral classifications from the literature were compiled in Davies et al. (2015) and in Table 1. The classifications cover the traditional Seyfert 1-1.8 and Seyfert 2 categories, but also include Seyfert 1i, which only show broad permitted lines in the infrared, and Seyfert 1h, which show broad optical lines in polarised light. In addition to optical classifications, we obtained absorption-corrected rest-frame 2–10 keV fluxes for our AGN from Ricci et al. (2017), and converted these to intrinsic 2–10 keV X-ray luminosities (LX), using the compilation of redshift-independent distances from Davies et al. (2015). Ricci et al. (2017) also provides estimates of the intrinsic line-of-sight absorbing column densities (NH) towards the nucleus for all the AGN. In objects with no hint of intrinsic X-ray absorption, NH is set to an upper limit of cm-2.
2.2 CO 21 spectroscopy
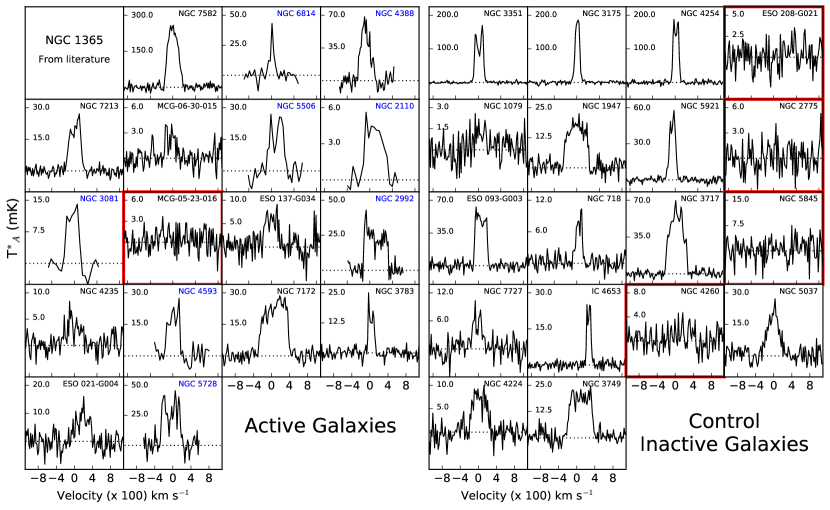
For this study, we observed or compiled archival spectroscopy of the 12CO 21 line at a rest frequency of GHz, which achieves an optimal trade-off between spatial resolution and line sensitivity. Our targets are nearby, so we used 12-m class single-dish millimetre telescopes for our observations. The approximate half-power beam widths (HPBWs) achieved for each target are shown as cyan circles in Figure 1. They span the central regions of our targets, subtending projected radii of 0.7-2.7 kpc over the full range of distances of the sample. Figure 2 presents a montage of the final reduced CO spectra of the LLAMA targets.
2.2.1 APEX spectroscopy
27 targets were observed in a dedicated LLAMA follow-up survey with the Atacama Pathfinder Experiment (APEX) telescope (Program ID M0014_96; PI: Rosario). Spectra were taken in several tracks over October – December 2015, with varying but generally favourable conditions. The requested final integration time of a target was designed to achieve either a S/N detection of the CO 21 line, based on its central FIR luminosity and a typical star-formation depletion time of 1 Gyr (see Section 4.5 for definitions), or a limit on the central molecular gas fraction of 5 per cent. This approach is preferred over a fixed depth survey, since it allows us to devote more observing time to gas-poor and distant systems, and achieve a volume-limited equivalent CO survey that mirrors the LLAMA selection strategy.
The APEX-1 heterodyne receiver system was used with a standard beam switching sequence. The equivalent circular half-power beam width (HPBW) of this setup is 271 at 230 GHz. Calibrators were chosen following standard APEX queue observing guidelines. All the spectra were reduced with the CLASS software from the GILDAS package555https://www.iram.fr/IRAMFR/GILDAS/. Spectra from contiguous tracks on the same observation date were resampled and added into a single spectrum to which baseline corrections were applied. When the CO 21 line was detectable in spectra from different dates, we visually compared them to ascertain if any flux calibration or wavelength calibration systematics were evident. Finding none, we proceeded to combined baseline-subtracted spectra taken on different dates into a single final spectrum for each object.
The spectra are shown in Figure 2. We adopted a two-tier approach to measure the integrated CO flux from a spectrum. We first fit666We rely on the versatile Python LMFIT package with a least-squares algorithm for line profile fits. the CO line with a single gaussian profile, which allowed a preliminary assessment of the line strength, centre and width. In galaxies with well-detected lines, several cases of substantial deviations from a simple gaussian profile are evident, implying that a single gaussian fit will not capture the line flux accurately. Therefore, for lines with a preliminary SNR , we remeasured the line flux as follows. We integrated the spectrum within of the CO line centre to obtain the total flux, where both the line width and its centre come from the gaussian fit. We estimated the spectral noise from the baseline variance in spectral regions with absolute velocity offsets km s-1 from the line centre. We were able to adopt this technique of integrated flux measurements for strongly detected lines due to the very flat baselines and wide bandpass of our APEX spectra.
We converted antenna temperatures to luminance units (Jy km s-1) using a fixed conversion of 39 Jy/K, suitable for APEX at 230 GHz.
2.2.2 JCMT data
8 AGN were observed with the James Clerk Maxwell Telescope (JCMT) in a filler program between February 2011 and April 2013. The A3 (211-279 GHz) receiver was used with a beam size of 204. Each galaxy was initially observed for 30 minutes. For weak detections, additional observations were obtained up to no more than 2 hours. The individual scans for a single galaxy were first-order baseline-subtracted and then co-added. The short bandpass of the JCMT spectra do not include enough line-free regions for an estimation of the spectral noise. Therefore, we fit the line spectra with a combination of two gaussian profiles and a flat continuum, and add a 10 per cent error in quadrature to the uncertainty on the line fluxes to account for any spectral baselining uncertainties. We used a conversion factor of 28 Jy/K (an aperture efficiency of 0.55) to scale from antenna temperatures to luminance units.
2.2.3 Measurements from the literature
NGC 1365, a Seyfert 1.8 in a massive barred spiral galaxy, has been the subject of extensive CO follow-up in the literature. To match the approximate depths and resolutions of the CO data for the rest of the LLAMA sample, we adopt the CO 21 flux measurement of NGC 1365 from Curran et al. (2001), based on spectroscopy with the 15-m Swedish ESO Sub-millimetre Telescope (SEST; HPBW ″ at 230 GHz). They report a line flux of Jy km s-1.
| Name | Distance | AGN Type | Telescope | ICO [21]a | SCO |
| (Mpc) | (K km s-1) | (Jy km s-1) | |||
| AGN | |||||
| ESO 021-G004 | 39 | 2 | APEX | ||
| ESO 137-G034 | 35 | 2 | APEX | ||
| MCG-05-23-016 | 35 | 1i | APEX | ||
| MCG-06-30-015 | 27 | 1.2 | APEX | ||
| NGC 1365 | 18 | 1.8 | SEST | ||
| NGC 2110 | 34 | 1i | JCMT | ||
| NGC 2992 | 36 | 1i | JCMT | ||
| NGC 3081 | 34 | 1h | JCMT | ||
| NGC 3783 | 38 | 1.5 | APEX | ||
| NGC 4235 | 37 | 1.2 | APEX | ||
| NGC 4388 | 25 | 1h | JCMT | ||
| NGC 4593 | 37 | 1.0 | JCMT | ||
| NGC 5506 | 27 | 1i | JCMT | ||
| NGC 5728 | 39 | 2 | JCMT | ||
| NGC 6814 | 23 | 1.5 | JCMT | ||
| NGC 7172 | 37 | 1i | APEX | ||
| NGC 7213 | 25 | 1 | APEX | ||
| NGC 7582 | 22 | 1i | APEX | ||
| Inactive Galaxies | |||||
| ESO 093-G003 | 22 | APEX | |||
| ESO 208-G021 | 17 | APEX | |||
| IC 4653 | 26 | APEX | |||
| NGC 1079 | 19 | APEX | |||
| NGC 1947 | 19 | APEX | |||
| NGC 2775 | 21 | APEX | |||
| NGC 3175 | 14 | APEX | |||
| NGC 3351 | 11 | APEX | |||
| NGC 3717 | 24 | APEX | |||
| NGC 3749 | 42 | APEX | |||
| NGC 4224 | 41 | APEX | |||
| NGC 4254 | 15 | APEX | |||
| NGC 4260 | 31 | APEX | |||
| NGC 5037 | 35 | APEX | |||
| NGC 5845 | 25 | APEX | |||
| NGC 5921 | 21 | APEX | |||
| NGC 718 | 23 | APEX | |||
| NGC 7727 | 26 | APEX | |||
| aScaled to the Tmb scale. | |||||
2.3 Infrared photometry
Essential insight into the conditions of the molecular gas in our galaxies comes from a comparison of the cold gas masses with stellar masses and the SFR in their central regions. We relied on infrared (IR) photometry and multi-component fits to the IR SED to estimate these quantities. The near-IR in our galaxies is dominated by stellar light, while the mid-IR and far-IR/sub-millimeter bands give us a good handle on the dust emission from the AGN ‘torus’ and from star-forming regions.
2.3.1 Near-infrared photometry

Images and photometry in the near-infrared (NIR) J/H/Ks bands for all our galaxies were compiled from the 2MASS survey through the NASA/IPAC Infrared Science Archive (IRSA)777http://irsa.ipac.caltech.edu/Missions/2mass.html. For total galaxy photometry, we used measurements from the 2MASS Extended Source Catalog (XSC) and the Large Galaxy Atlas, both of which employ light profile fits to the galaxies to yield integrated fluxes that are robust to the presence of foreground stars, or variations in the seeing or background.
We performed beam-matched photometry directly from the 2MASS Ks images to obtain a measure of the near-IR light from our galaxies co-spatial with the molecular gas from our single-dish spectra. We assumed a circular gaussian beam with a width () equal to that of the beam of the respective telescopes at 230 GHz. We weighted the 2MASS Ks by this beam profile, and integrated over the images, scaling by the appropriate 2MASS zeropoints, to derive a Ks flux matched to the single dish beam. This approach is appropriate because the equivalent resolution of the 2MASS images is a few arcseconds, much smaller than the beam widths of the single-dish observations. Figure 3 displays the integrated and beam-matched luminosities in the Ks for all the LLAMA galaxies, indicating that the single-dish beams sample a few tens of percent of the total NIR emission in these systems.
Burtscher et al. (2015) characterised the dilution of the stellar photospheric CO bandhead (2.3 m) in a number of active galaxies, enabling a very sensitive measurement of the NIR luminosity of their AGN. This work has published constraints for 15 of the 18 LLAMA AGN and we adopted these measurements of the intrinsic K band luminosity of their nuclear sources. For the remaining 3 AGN, we adopted the AGN’s K-band luminosity estimated from our multi-component SED fits (Section 3.1). ESO 137-G034 & NGC 5728, two heavily obscured AGN, do not appear to show any AGN light in the K-band to the limit of the Burtscher et al. (2015) analysis, probably due to a high optical depth to NIR radiation in their AGN tori. Our estimates/limits on the AGN’s NIR luminosities are plotted in Figure 3 as red star/arrowhead points. In most cases, they are a few times weaker than the beam-matched K-band luminosities, but in NGC 5506, MCG-05-23-016 & NGC 3783, the AGN dominates the central emission.
We subtracted the contribution of the AGN light from the beam-matched 2MASS Ks fluxes, assuming a flat AGN SED across the K-band. The resulting pure stellar K-band luminosity is used in the study of the central gas fraction (Section 4.2). If the AGN’s luminosity was within -2 of the beam-matched central flux, we considered this flux to be an upper limit on the central stellar luminosity.
2.3.2 Mid-infrared photometry
We compiled integrated mid-infrared (MIR) fluxes for our targets from the ALLWISE catalog available on IRSA. Associations with the catalog were made using a circular cone search with a tolerance of 5 arcsec, which yielded a single counterpart within 2.2 arcsec in all cases.
We adopted the WISE pipeline-produced “GMAG” aperture photometry which relies on scaled apertures derived from the profile of the galaxy from the 2MASS XSC. The aperture photometry is preferred over the standard profile-fit “MPRO” photometry from the ALLWISE catalog, since all the LLAMA galaxies are moderately to well-resolved in the WISE Atlas images.
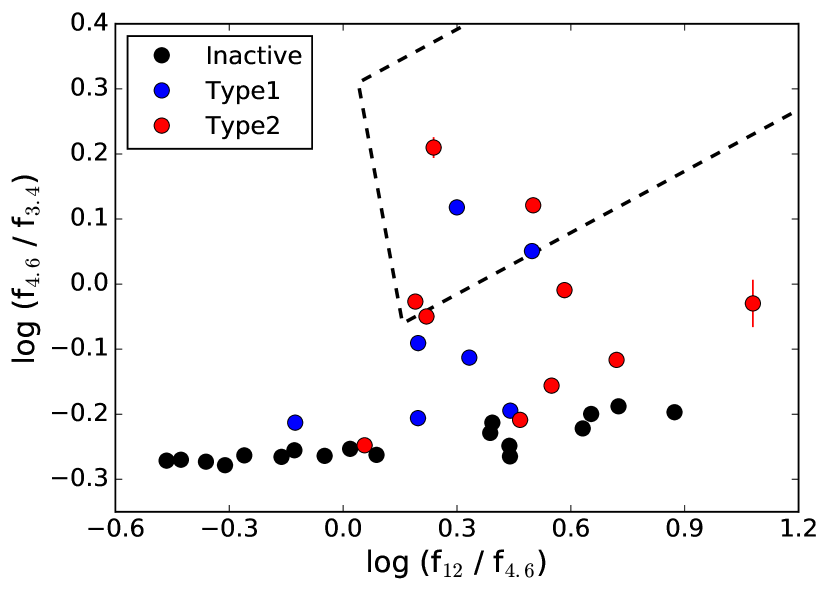
In Figure 4, we compare our AGN and inactive galaxies in a diagram of flux ratios between WISE bands. Objects which are dominated by AGN emission in the MIR have been shown to lie within the region delineated by dashed lines in such a diagram (Mateos et al. 2012). Many of the LLAMA AGN lie within or close to the AGN-dominated region, consistent with our selection of relatively luminous Seyferts. On the other hand, all the inactive galaxies lie well away from the region, showing that there is no sign of any hot dust emission in our control sample. The lack of even heavily-obscured nuclear sources in the control galaxies confirms their inactive nature.
While most of our AGN have Herschel far-infrared photometry (Section 2.3.3), only two of the control galaxies have been the target of Herschel imaging programs. For a measure of the resolved thermal infrared emission for the rest, we rely on the WISE W4 (22 m) Atlas images. The control galaxies do not contain detectable AGN, so we can confidently assume that any of their thermal emission in the long-wavelength MIR arises from dust heated by stars. The PSF of the WISE Atlas images in the W4 band has a FWHM of and varies between objects and epochs; its large size in comparison to the single-dish beam demands the use of uncertain deconvolution techniques for accurate beam-matched photometry. We instead rely on a simplified measure of the thermal dust emission within the single-dish beam based on the following procedure. We match the WISE W4 images to the single-dish resolution by convolving them with a circular spatial gaussian kernel of width given by:
| (1) |
where is the millimeter telescope beam and is the typical gaussian-equivalent width of the WISE W4 Atlas images (). We then extracted photometry from the beam-matched WISE images within a circular aperture with a diameter equal to the HPBW of the single-dish telescope used for each object.
2.3.3 Far-infrared photometry
We employ both legacy IRAS data and modern Herschel data to get the best combined FIR datasets for the LLAMA galaxies. The AGN have been the focus of targetted Herschel imaging programs, but most of the inactive galaxies do not have Herschel coverage. Therefore, we have compiled all-sky IRAS data, where available, for the entire set, and compare these measurements to Herschel photometry to understand and account for systematics between the datasets. Any large differences will complicate the controlled nature of our study, since Herschel maps, only widely available for our AGN, are more sensitive and allow better background subtraction than IRAS scans.
Using the SCANPI facility from IRSA, we obtained 60 m and 100 m photometry from the Infrared Astronomical Satellite (IRAS) for 34 LLAMA galaxies. Two objects (MCG-05-23-016 & NGC 3081) were flagged by IRSA to have problematic IRAS data. SCANPI is designed for versatile use of IRAS all-sky data, allowing the user to choose between many different flavours of photometric measurements with information about individual IRAS scans as well as combinations of all scans that cover a target. We followed the recommendations in the SCANPI documentation for the working choice of photometric measurements. We only used data from median-combined scans. For sources with a flux Jy (SNR of several), we took the peak flux from the combined scans, except for sources which were determined to be extended, in which case, we used a measure of the integrated flux (fnu_t). For weaker sources, we used photometry based on a point-source template fit, which is more resilient to the complex background of the IRAS scans. In all cases, we adopted the estimate of the noise as the flux uncertainty, and considered a source to be a detection if its flux was the noise level.
Sixteen AGN in our sample were observed with the Herschel Space Observatory (Pilbratt et al. 2010) using the PACS and SPIRE instruments, covering wavelengths from 70 m to 500 m. Details of these observations, the reduction of the data and associated photometry are published in Meléndez et al. (2014, PACS) and Shimizu et al. (2016, SPIRE), from which integrated photometric measurements and their uncertainties were obtained.
Two inactive control galaxies (NGC 3351 & NGC 4254) also have Herschel photometry from the KINGFISH survey of local galaxies (Kennicutt et al. 2011). We adopted the KINGFISH photometric measurements for these galaxies from Dale et al. (2012).
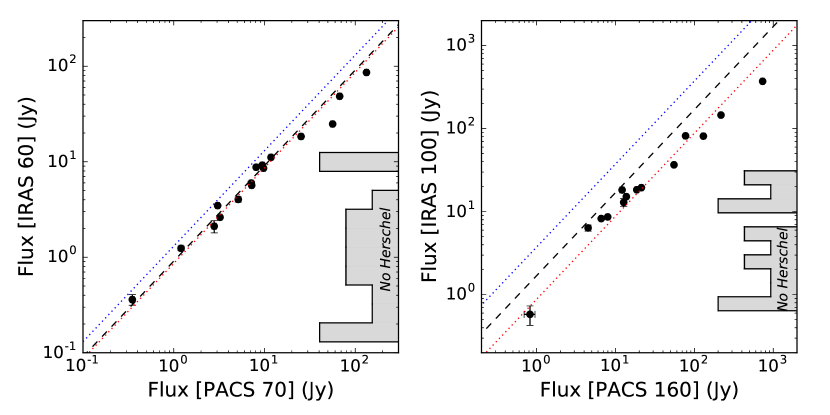
In Figure 5, we check for systematic zero-point differences between the IRAS and Herschel/PACS photometry by comparing photometry in nearby bands (IRAS 60 m vs. PACS 70 m, and IRAS 100 m vs. PACS 160 m). The various lines show the expected tracks of selected galaxy dust SED models from Dale & Helou (2002), and the vertical histograms show the distributions of IRAS fluxes for the remainder of the sample that do not have Herschel coverage.
We find that the PACS fluxes of the brightest sources ( Jy) are systematically brighter than their IRAS fluxes, both when compared to the trend shown by the fainter sources and against expectations from galaxy SED models. This is likely due to source emission that extends beyond the cross-scan width of the IRAS scans () in some of the nearest and brightest objects. The fainter sources lie in the range expected for typical cold dust SEDs of normal star-forming galaxies (; see Section 3.1 for details). This suggests that any systematic offsets are minor. In addition, all LLAMA galaxies without Herschel coverage, including most inactive galaxies, are Jy in both IRAS bands. Therefore, we can compare the FIR properties derived for the AGN and inactive galaxies without major concerns about the disparity of their FIR data coverage.
In addition to the integrated photometry, we performed aperture photometry on the PACS 160 m images, when available, following a similar procedure as described in Section 2.3.2 for the WISE W4 images. The convolution kernel to match the PACS PSF to the single-dish beam was calculated using an equivalent gaussian PSF with a FWHM of 113 for the 160 m maps.
| Name | L | LGAL | LAGN | LX | NH | LK,AGN |
| (K km s-1 pc2) | (erg s-1) | (erg s-1) | (erg s-1) | (cm-2) | (erg s-1) | |
| AGN | ||||||
| ESO 021-G004 | 42.19 | 23.8 | 42.10 | |||
| ESO 137-G034 | 42.34 | 24.3 | 40.77 | |||
| MCG-05-23-016 | 43.16 | 22.2 | 43.00 | |||
| MCG-06-30-015 | 42.56 | 20.9 | 42.35 | |||
| NGC 1365 | 42.31 | 22.2 | 42.63 | |||
| NGC 2110 | 42.65 | 22.9 | 42.69 | |||
| NGC 2992 | 42.11 | 21.7 | 42.20 | |||
| NGC 3081 | 42.94 | 23.9 | 41.32 | |||
| NGC 3783 | 43.23 | 20.5 | 43.39 | |||
| NGC 4235 | 41.94 | 21.3 | 42.10 | |||
| NGC 4388 | 43.20 | 23.5 | 41.75 | |||
| NGC 4593 | 42.91 | 20.0 | 42.42 | |||
| NGC 5506 | 43.10 | 22.4 | 43.09 | |||
| NGC 5728 | 43.14 | 24.1 | 41.02 | |||
| NGC 6814 | 42.32 | 21.0 | 41.73 | |||
| NGC 7172 | 42.84 | 22.9 | 42.46 | |||
| NGC 7213 | 42.06 | 20.0 | 42.46 | |||
| NGC 7582 | 42.90 | 24.3 | 42.78 | |||
| Inactive Galaxies | ||||||
| ESO 093-G003 | ||||||
| ESO 208-G021 | ||||||
| IC 4653 | ||||||
| NGC 1079 | ||||||
| NGC 1947 | ||||||
| NGC 2775 | ||||||
| NGC 3175 | ||||||
| NGC 3351 | ||||||
| NGC 3717 | ||||||
| NGC 3749 | ||||||
| NGC 4224 | ||||||
| NGC 4254 | ||||||
| NGC 4260 | ||||||
| NGC 5037 | ||||||
| NGC 5845 | ||||||
| NGC 5921 | ||||||
| NGC 718 | ||||||
| NGC 7727 | ||||||
3 Estimation and Statistics
3.1 Multi-component SED fitting
We fitted the infrared photometry of the AGN and galaxies using a multi-component Bayesian SED fitting package (FortesFit; Rosario 2017). The fits combined three libraries of SED models: a) a set of single stellar population models (SSPs) generated with the Bruzual & Charlot (2003) GALAXEV package; b) a single-parameter sequence of templates of the dust emission from galaxies heated by star-formation and the interstellar radiation field (Dale & Helou 2002); c) a suite of empirical AGN template SEDs, covering a range in MIR-to-FIR flux ratios.
The SEDs from the SSP models are parameterised by their age, chemical abundance and total stellar mass. In this study, we are only concerned with the long-wavelength ( m) shape of the IR stellar emission from our galaxies, rather than the detailed properties of their stellar population. This shape is only weakly affected by dust obscuration. Consequently, we did not consider any extinction when generating the library of SED models. We considered a model grid of ten SSP ages logarithmically spaced between 5 Myr and 11 Gyr, and four metallicities with the solar metal abundance pattern but scaled to [Fe/H] of 1/50, 1/5, 1, and 2.5 of the solar value. The stellar mass is determined by the normalisation of a particular SED model.
The galaxy dust emission templates of Dale & Helou (2002) are a sequence of model SEDs for which a single parameter , which is related to the 60-to-100 m flux ratio of the template, has been shown to describe much of the variation observed in the MIR-to-FIR shape and the equivalent width of PAHs among galaxies in the local Universe. For full flexibility, we allow the normalisation of the template, which determines , the integrated 8–1000 m luminosity of the galaxy’s dust emission, to vary independently of .
For the AGN emission, we compiled a custom library of templates that span the range of mid-to-far IR empirical SED shapes reported in the literature (Appendix A). The library is parameterised by their integrated 8–1000 m luminosity arising from AGN-heated dust emission () and the ratio of the 160 m monochromatic luminosity to () which describes the steepness of the FIR tail of this emission.
Here we briefly summarise the key features of the fitting package, referring the interested reader to a forth-coming publication that fully documents the software (Rosario 2017).
The parameters of the fit are treated as continuous variables and the routine is able to evaluate a hybrid SED model (a combination of SEDs from all three components) at any point in multi-dimensional parameter space using a fast interpolation scheme. This greatly reduces the discrepancy between the model photometry and the data arising from the coarseness of a model grid, obviating the need for complicated template error correction terms with functional forms that are hard to motivate. The interpolation also enables continuous probability density functions to be used as priors on the parameters, which may be applied individually for each parameter or jointly on a number of parameters together in the current implementation of the code.
In fitting the LLAMA AGN, we applied a lognormal prior distribution on using the information available from their X-ray luminosities. Adopting the best-fit relationship from Gandhi et al. (2009), we calculated a 12 m luminosity from the AGN component from LX, and extrapolated this to an estimate of using the mean AGN IR template from Mullaney et al. (2011) (). We set the mode of the prior distribution on to this value and took a fixed standard deviation of 1 dex, which conservatively combines the uncertainty on the X-ray–MIR relationship, the errors on LX, and the range of ratios of the 12 m luminosity to in the family of AGN empirical templates.
We also used a similar approach to derive an upper limit on in the LLAMA controls sample. A custom analysis following Koss et al. (2013) with the more sensitive 105 month SWIFT-BAT survey does not detect any of the inactive galaxies to a limit of erg s-1cm-2. Adopting a ratio of LX to the keV luminosity previously noted for BAT AGN (; Ricci et al. 2017), we use this limit to calculate a maximum LX that could arise from any possible weak X-ray AGN among the control galaxies. Converting this to an equivalent limiting using our shallowest AGN template (Symeonidis et al. 2016), we set a uniform prior distribution on the AGN luminosity of the control sample with a very broad span of 10 dex up to this limiting value. We also adopted a uniform prior for covering the full range shown by the AGN template library, between and .
We applied a broad uniformly-distributed prior on with a span of 10 dex. For each galaxy with at least one detection in a FIR band ( m), we computed the geometric mean of the measured monochromatic luminosities in these bands and took this as the central value of the prior distribution. In the galaxies without such detections, we chose a central value of erg s-1. We stress that this prior distribution is very uninformative, allowing the likelihood of the model to determine the posterior distributions of while preventing the code from exploring unphysically low or high values. We adopted a normal prior for with a mean of 2.0 and a dispersion of 1.4, which captures the distribution found among massive star-forming galaxies in the local Universe (e.g. Rosario et al. 2016).
While the details of the stellar component of the SEDs are not critical to our results, we nevertheless applied reasonable physical priors for the parameters of the SSPs. The stellar mass was allowed to vary uniformly over 10 dex centred on M⊙, while the SSP ages and abundances were constrained with normally distributed priors centred on 1.0 Gyr and solar abundance respectively, with dispersions of 1.0 dex and a factor of 2 respectively.
The fitting was performed using the Markov-Chain Monte-Carlo (MCMC) engine EMCEE (Foreman-Mackey et al. 2013) with its affine-invariant ensemble sampler. We used a likelihood function that followed the specifications of Sawicki (2012), the product of a standard likelihood for high S/N flux measurements with (assumed) gaussian errors, and likelihood based on the error function to incorporate the upper limits in the photometry. We ran 40 MCMC chains with 600 steps and a fixed burn-in phase of 300 steps. The sampling was dense enough to converge on the joint multi-parameter posterior distributions in fits of all the galaxies, while still permitting each fit to complete with a sensible processing time of minutes.
3.2 Comparative methodology
A thorough understanding of the properties of the cold molecular gas in the LLAMA galaxies requires us to combine direct measurements of CO fluxes, which generally have well-behaved gaussian errors, with estimates of quantities such as , derived from our multi-component SED fits. The uncertainties on the latter can have a distribution that differs considerably from normal, due to the complex likelihood space that arises from the SED models. In addition, our controlled experiment investigates the differences of various quantities between the AGN and their control galaxies, while being aware of their often substantial uncertainties. The different sensitivities of the FIR photometry between AGN and inactive galaxies (Section 2.3.3) adds another layer of intricacy when making these comparative assessments.
In this subsection, we describe the statistical approach we have taken in estimating the distributions of various measured or modelled quantities for an ensemble of galaxies (AGN or inactive), and in quantifying the differences between ensembles of controlled pairs of galaxies.
We begin by drawing a distinction between the estimate of a quantity for a particular galaxy , denoted by , and the estimate of the distribution of for an ensemble of galaxies . Both are estimations, in the sense that they represent our knowledge of the truth, in this case the actual value of for a galaxy () and the actual distribution of for the ensemble (), in the presence of sampling error and the uncertainties of the measured data. For L, for a given galaxy is determined by the normally distributed measurement errors on its CO 21 flux and the uncertainty on its luminosity distance (typically 15 per cent for Tully-Fisher based distances). For , is instead determined by the posterior distribution from the Bayesian fitting exercise. When evaluating functions of estimated quantities (e.g., the gas fraction in Section 4.2 which depends on L and M⋆), we use the bootstrap technique888We use a fixed number of 2000 bootstrap samples for each evaluation. to sample for each of the independent variables and evaluate the functional relationship to obtain for the derived quantity. In this way, we propagate uncertainties and covariances consistently for all measured and derived quantities in this study.
A special note about our treatment of limits. For a quantity that is assessed to have a limiting value for a galaxy , we assume that is a uniform distribution between the and dex of (depending on whether it is an upper or lower limit). This is a very uninformative assumption, designed to treat the information from the limits as conservatively as possible.
The accuracy of for any particular ensemble of galaxies is set by for the individual objects and sampling error due to the finite size of the ensemble. We use the Kernel Density Estimate (KDE) technique to describe for visual assessment in figures, with the choice of uniform bandwidth listed in the associated captions.
While the bootstrap approach outlined above allows us to describe accurately, sample size variance is built into the design of the LLAMA experiment and cannot be easily overcome. While LLAMA is one of the largest host galaxy-controlled AGN surveys with uniform millimetre spectroscopy, the subsample size of 18 objects still places severe limitations on the discrimination of fine differences between AGN and their control galaxies.
We perform Kolmogorov–Smirnov (K–S) tests on pairs of bootstrapped samples of the AGN and inactive galaxies to describe the differences between the of each subsample. These differences are represented by the median value of PKS, the probability that the two distributions are drawn from a common parent distribution (the Null hypothesis of the test). Following our choice of significance threshold, a median P indicates that the distributions from the subsamples are statistically distinct.
We also consider the distributions of the difference of a certain quantity (typically expressed as a logarithmic difference) between an AGN and its control galaxy, using the ensemble of controlled pairs. These distributions are better at revealing finer differences between the subsamples, since they factor out systematic variations correlated with the galaxy properties used for the matching of controls in LLAMA. For example, is low in early-type galaxies and high in late-types. The difference distributions only compare AGN and inactive galaxies with the same morphology (within the matching tolerance); therefore, it serves as a better indicator of potential morphology-independent differences of between AGN and their controls than a comparison of the separate distributions of AGN and inactive galaxies, since the latter approach is more affected by morphology-dependent scatter within each subsample.
We construct difference distributions using the bootstrap approach. In each realisation, we randomly select one control galaxy for each AGN, yielding 18 independent control pairs per realisation. This makes full use of the additional information available for AGN with multiple control galaxies, while maintaining equal statistical weight for all AGN. We note, however, that our results do not strongly differ if we took an approach that uses all control pairs in each bootstrap realisation to construct difference distributions. We describe these distributions using KDE for visual purposes, and derive a median difference, its uncertainty, and the variance of the differences from the bootstrapped samples.
We also account for sampling error by performing a one-sample Student’s T-test on each bootstrap realisation, which determines whether it differs significantly from a zero-mean normal distribution. A median value of P implies that the difference distribution has a mean value that is significantly offset from zero. We do find any statistically significant offsets between AGN and control for any of the quantities studied in this work. As a guide for future studies, we state the minimum difference that we can significantly measure with the size of the LLAMA sample using simulations based on the observed difference distributions.
Key information is displayed in the distinctive three panel plots used throughout Section 4 and in Table 3.
| Quantity | Ensemble | Mediana | Ptestb |
| (Unit) | |||
| log ICO,25 | AGN | ||
| (log K km s-1) | Inactive | 0.43 | |
| Pairs | 0.09 | ||
| log fgas | AGN | ||
| Inactive | 0.43 | ||
| Pairs | 0.18 | ||
| LGAL | AGN | ||
| (log erg s-1) | Inactive | 0.10 | |
| Pairs | 0.11 | ||
| tdep | AGN | ||
| (log Years) | Inactive | 0.43 | |
| Pairs | 0.48 | ||
| aMedian logarithmic difference for pairs. | |||
| bProbabilities from 1) Kolmogorov-Smirnov test that AGN and | |||
| control distributions are indistinct, and 2) Student T-test that | |||
| differences of pairs are normally distributed with zero mean. | |||
4 Results
4.1 CO 21 intensities
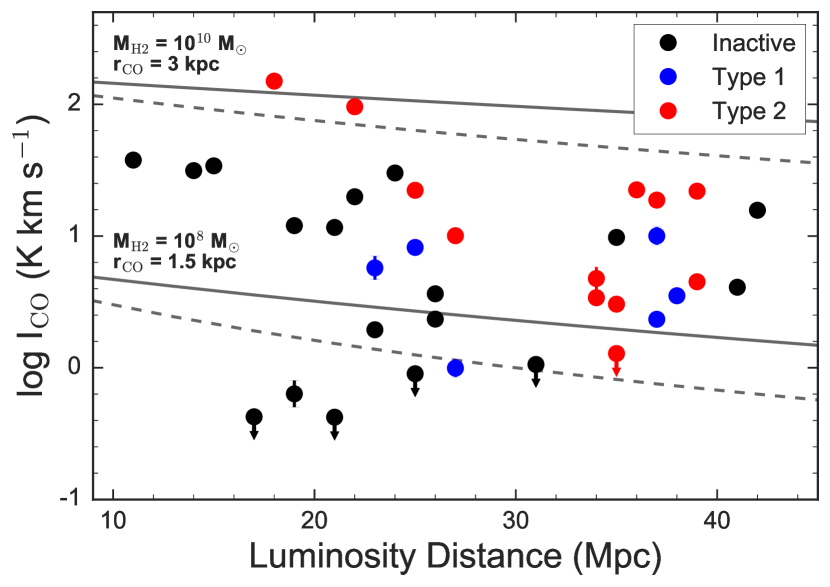
In Figure 6, we plot the velocity-integrated CO 21 surface brightness (ICO) against distance for the LLAMA galaxies, splitting them into the AGN (coloured points) and inactives (black points). The AGN are further distinguished based on their optical classification: Seyfert 1–1.5 are marked as Type 1 (AGN with low levels of optical extinction), and Seyferts 1.8 and higher (including Seyferts 1i and 1h) as Type 2 (AGN with moderate to high levels of optical extinction). The LLAMA control galaxies are typically closer than the LLAMA AGN, with a median distance difference of 12 Mpc.
As a guide to the eye, the lines in Figure 6 show the expected variation of ICO with distance for smooth exponential discs of a given molecular gas mass, observed with the APEX beam modelled as a Gaussian with width ). We plot tracks for two fiducial disc models with different sizes and total molecular Hydrogen mass (MH2), at two different inclinations with respect to the line of sight. Due to the radial gradient in the CO emission in discs, the observed beam-averaged surface brightness drops slowly with distance. A fair comparison of the CO intensities of LLAMA AGN and control should account for the systematic change in ICO with distance expected in galaxy discs. We derive a correction to ICO based on smooth exponential disc models to allow this comparison.
Following Leroy et al. (2008), we estimate the exponential scale length of the CO disc in each galaxy from the size of the stellar disc:
| (2) |
where is the galaxy’s -band isophotal radius at 25 mag arcsec-2 (Table 1). This relation has a scatter of %. As discussed in Lisenfeld et al. (2011) and Boselli, Cortese & Boquien (2014), rCO and the inclination of the exponential molecular gas disc (assumed to be the same as the inclination of the stellar disc) together define a CO profile which may be windowed by the single-dish telescope beam and integrated to estimate the observed CO flux of an observation of the galaxy. We calculate the ratio of this integral for the actual distance of the galaxy and assuming that it is at a reference distance of 25 Mpc. Multiplying the observed ICO by this ratio, we calculate the expected CO surface brightness at the reference distance (ICO,25), correcting for first-order distance-dependent systematics.
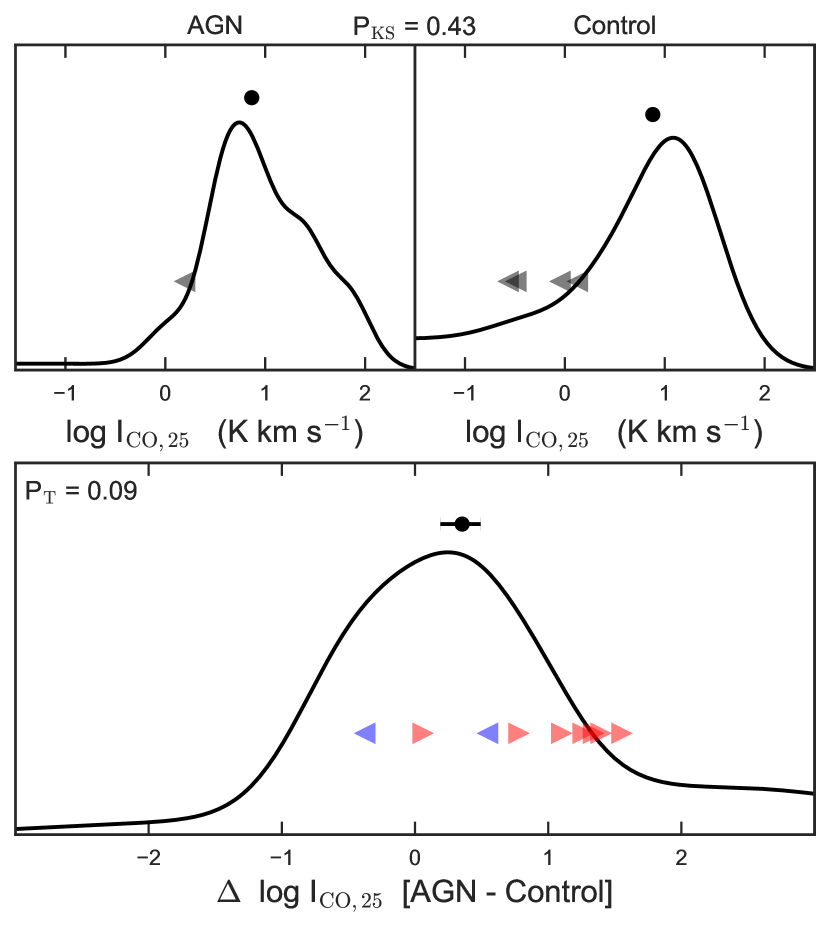
In the top two panels of Figure 7, we compare the distributions of ICO,25 of the AGN and the inactive galaxies. Their similar medians and a high value of P per cent indicates that the distributions are statistically indistinguishable.
In the lower panel, we consider the distribution of the logarithmic difference of ICO,25 for the controlled pairs of AGN and inactive galaxies. While we show the limits for visual inspection purposes, their effects are taken into account when estimating the distribution in the fashion outlined in Section 3.2. The overall distribution of differences is wide, and has a median value of dex, implying CO 21 intensity that is higher in the AGN than in their matched inactive galaxies (at a significance of ). However, we cannot rule out that a difference at this level is solely due to stochasticity between the two subsamples, as the Student’s T probability is %. Simulations allow us state that if the mean ICO of the AGN and control galaxies differed by a factor of , we would have seen this effect clearly in our sample.
4.2 Gas fractions
From the beam-matched photometry of their 2MASS images, we estimate the stellar masses () of the LLAMA galaxies within the regions covered by the CO observations and use these to derive their central molecular gas fractions.
We obtain the central of our targets by multiplying their 2MASS Ks beam-matched luminosity by an appropriate K-band mass-to-light (M/LK) ratio. We examined a suite of composite population synthesis models from the Maraston (2005) library and established that stellar populations with ages Gyr, such as those found in the centres of massive galaxies, show a range of M/LK with a typical value of 3.2 and scatter of 0.3 dex. We therefore considered a lognormal distribution of M/LK specified by these values in our bootstrap analysis. The scatter of M/LK is the dominant source of uncertainty in these mass estimates, being greater than both the errors of the photometric measurements and the errors on nuclear luminosities from Burtscher et al. (2015).
The CO luminosities (L) of our targets are calculated following Solomon & Vanden Bout (2005):
| (3) |
where is the velocity-integrated flux of the CO 21 line in Jy km s-1, DL is the luminosity distance in Mpc and is the redshift. R12 is the CO 10/CO 21 brightness temperature ratio which refers L to the CO 10 line as is the custom in most studies. In this work, we assume a fiducial value of R (Sandstrom et al. 2013).
We adopt a CO-to-H2 conversion factor M⊙pc-2/(K km s-2) (referred to CO 10). This is lower than the canonical value for the Milky Way disk ( M⊙pc-2/(K km s-2); Dame, Hartmann & Thaddeus 2001; Bolatto, Wolfire & Leroy 2013), but is characteristic of the central kpc of metal-rich galaxies, where is known to be somewhat depressed (Sandstrom et al. 2013). The average can vary by , and be lower by as much as a factor of five in some systems. This drop is usually attributed to a change in the properties of the cold molecular clouds in galactic centers, due to increased turbulence in the clouds or greater pressure in the circum-cloud ISM. There remains, however, no clear association between variations in and the presence of AGN in galaxies. We adopt an uncertainty of 0.3 dex for our main analysis, and we comment on the effects of potentially lower values when discussing our findings in Section 5.
The molecular gas fraction is defined as:
| (4) |
where MH2 = L is the mass in H2 in solar units as with .
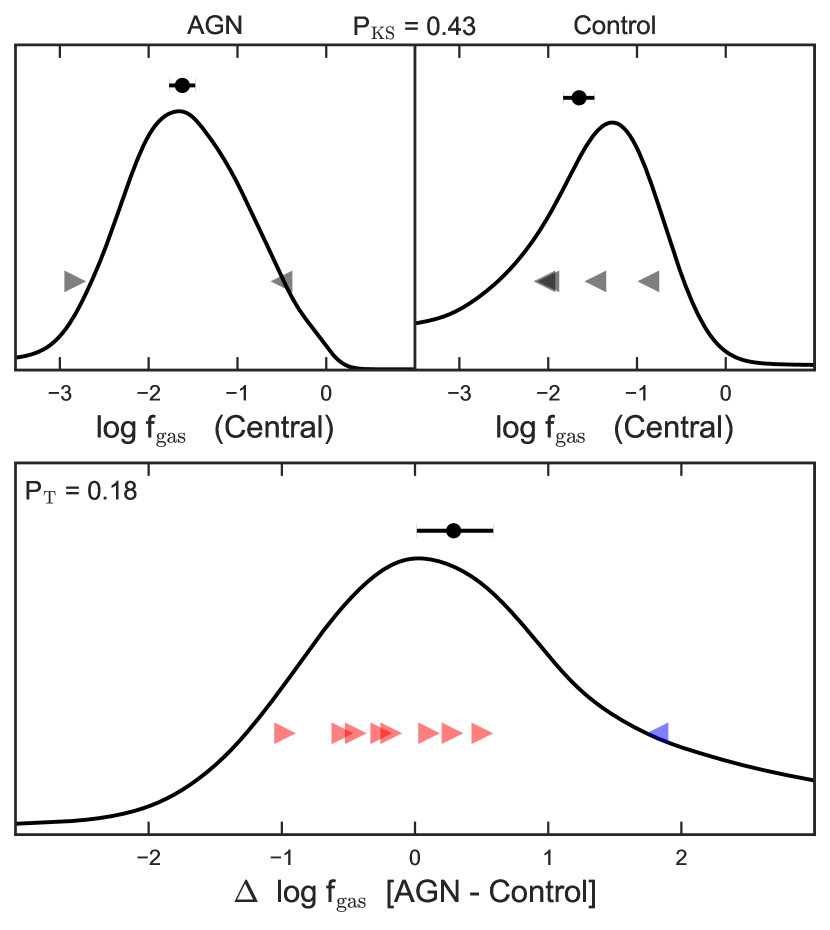
Figure 8 shows the distributions of of the AGN and inactive galaxies, folding in the uncertainties and systematics described above. As we found for the CO line surface brightnesses, the relative abundance of molecular gas in AGN hosts is indistinguishable from similar inactive galaxies: the medians of the distributions are within 0.1 dex and PKS per cent. The distribution of the logarithmic difference in the gas fraction between AGN and control galaxies peaks at zero, with a slightly positive median value () because the numerous lower limits on lead to a longer positive tail to the estimated distribution. We conclude that our AGN hosts do not show any conclusive evidence for either an enhanced or depressed incidence of cold molecular gas relative to stars in their central regions. With the size of the LLAMA sample, we would have been sensitive to differences greater that a factor of 5.5.
4.3 Integrated IR luminosities
The SED fitting procedure allows us to decompose the galaxy-integrated IR luminosities of the LLAMA AGN into emission from AGN () and emission from extended cold dust that is primarily heated by star-formation (). The inactive galaxies are also fit in the similar fashion, with a cap on on the grounds that none show signs of nuclear activity.
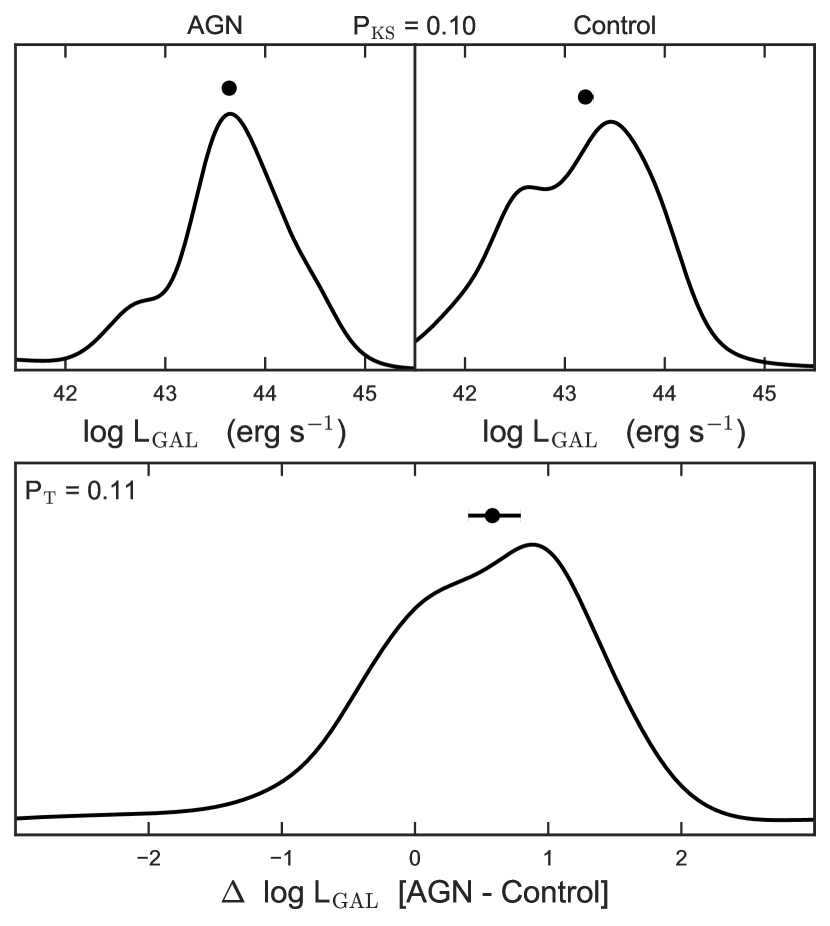
In the top panels of Figure 9, we compare the marginalised distributions of of the AGN and inactive galaxies taken directly from the outputs of our SED fits. The median of the AGN is 0.4 dex higher than the inactive galaxies, but this could arise due to sampling error, as a K–S test indicate that the distributions are not significantly indistinct. The distribution of logarithmic difference in from the control pairs shows a positive shift ( dex) towards a higher IR luminosity from AGN hosts after controlling for galaxy mass, inclination and Hubble Type. This offset is below our adopted significance threshold from the T-test, but we can exclude differences between AGN and control populations that are greater than a factor of 5.5.
4.4 Beam-matched IR luminosities and central SFR
In Sections 2.3.2 & 2.3.3, we developed the approach taken to measure WISE 22 m and Herschel/PACS 160 m photometry matched to the beam of the CO spectroscopic observations. The images in these bands offer the highest available spatial resolution at wavelengths dominated by the thermal infrared emission from star-formation, a necessary handle on the central SFRs in these galaxies.
Two AGN (NGC 4593 & ESO 021-G004) lack Herschel imaging; for these objects we do not possess a reliable measure of the resolved thermal dust emission, since the WISE 22 m band is strongly dominated by AGN light. We take their integrated as a conservative upper limit to their central FIR luminosities.
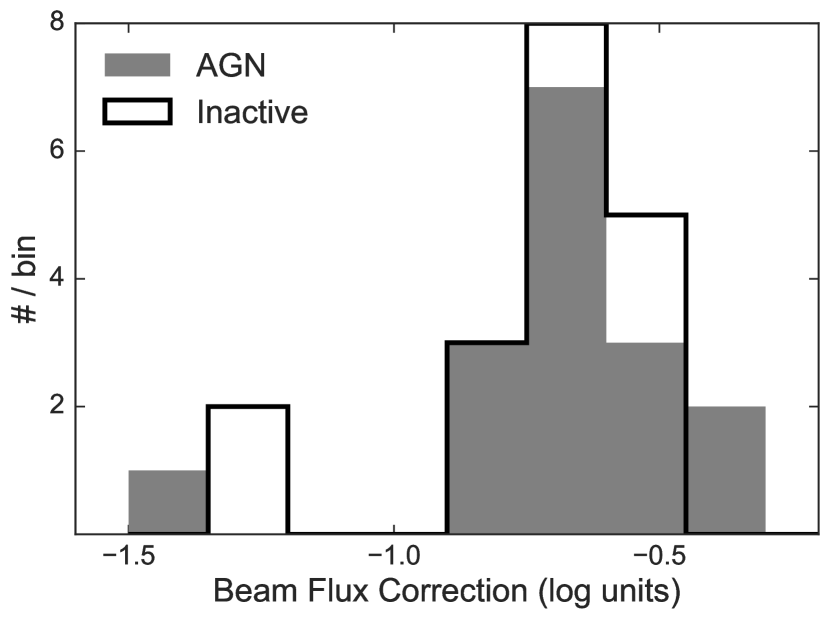
The ratio of the beam-matched flux to the integrated flux of a galaxy in its respective band (hereafter ) gives us the scaling to convert the galaxy’s integrated to an estimate of the central . In Figure 10, we compare for the AGN and inactive galaxies. Despite the differences in the bands used to derive this ratio, its distributions are similar in the two subsamples, which suggests that there are no large differences in the average dust emission profiles from star-formation between the AGN and inactive galaxies.
We use a modified form of the relationship between SFR and to derive the central SFR, as follows:
| (5) |
which is based on the calibration from Kennicutt & Evans (2012), in the limit that all the radiation from the young stars of a continuous star-forming population with a Chabrier IMF is absorbed by dust (Rosario et al. 2016). The uncertainty on this calibration is approximately 0.5 dex, which will dominate the error budget of this calculation over any uncertainty in or differences in the dust SEDs of the integrated and central dust emission.
4.5 Molecular gas scaling laws and SF depletion times
Molecular gas is the raw material for star formation. The SFR associated with a unit mass of molecular gas (the star-formation efficiency or ‘SFE’) provides fundamental insight into the physical conditions of the molecular phase and the environments of star-forming regions within it. The mass of molecular gas is related to the luminosity of the CO line (L), and the SFR determines the majority of the IR luminosity () of star-forming galaxies.
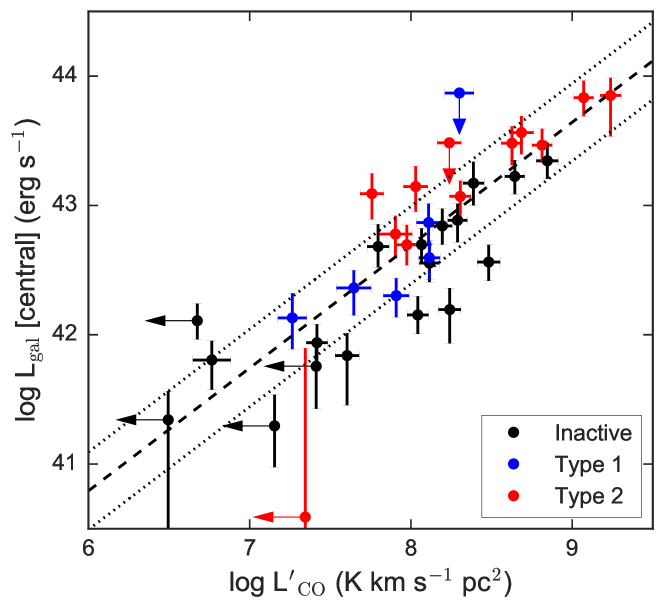
A popular diagnostic of the SFE is the correlation between L and : a region of a galaxy with more efficient star formation will produce a higher for a given L (if remains fixed and is a bolometric measure of the SFR). We plot this correlation in Figure 11, differentiating between the two types of AGN (Type 1/2; Section 4.1) and the inactive galaxies. The dashed line in the Figure shows the relationship among nearby resolved disk galaxies in the HERACLES survey (Leroy et al. 2013), scaled to a fiducial region of a galaxy that spans 2 kpc999The relationship given as Eqn. 9 of Leroy et al. (2013) is in terms of surface densities of gas and SFR. For consistency with our approach, we adopt their FUV+24 m SFR relationship, and convert to L and using our own preferred calibrations. We however retain their choice of which is appropriate for galaxy disks.. The dotted lines delineate the estimated 0.3 dex scatter about this relationship.
Most AGN (16 of 17) and inactive galaxies (10 of 14) with CO detections lie within the expected relationship for normal galaxy disks, implying that the SFEs of the central gas of these systems is typical. Therefore, to first order, the AGN and inactive galaxies as a population have similar normal SFEs. A few inactive galaxies scatter below the relationship, while the AGN tend to occupy the upper envelope of the data points. A small offset of dex is measurable between the two subsamples, such that the AGN show a higher for a given L, and therefore, a higher overall SFE. This offset is, however, not significant due to the restrictions of the sample size of LLAMA. It should be pursued with a larger survey with more statistical power.
We examine the central SFE in more detail by examining the distributions of the molecular gas depletion time , the ratio of MH2 to the SFR (in surface densities or integrated over the CO telescope beam). This is the lifetime of the molecular gas at a constant level of star-formation; more efficient star-forming environments show shorter depletion times.
We compare the distributions of between AGN and inactive galaxies in the upper panels of Figure 12. The two subsamples taken individually show statistically similar central depletion times (P 43 per cent), with median values of slightly over 1 Gyr. This is typical of galaxy disks (Leroy et al. 2008), confirming the impressions from Figure 11. The logarithmic difference of between the AGN and their control shows a broad distribution that is statistically consistent with a zero offset. Simulations indicate that our experiment would have confirmed offsets greater than a factor of 6. We conclude that the central molecular gas properties of the AGN and control galaxies in LLAMA are statistically similar.
4.6 Molecular gas and AGN properties
| Name | Distance | AGN Type | LX | NH | inclination | ICO [21]a | Reference for CO measurement | |
| (Mpc) | (erg s-1) | (cm-2) | (arcsec) | (degree) | (K km s-1) | |||
| NGC 1068 | 14.4 | 2.0 | 42.82 | 25.0 | 212 | 32 | Curran et al. (2001) | |
| NGC 3079 | 20.2 | 2.0 | 41.51 | 25.1 | 238 | 80 | Aalto et al. (1995) | |
| NGC 3227 | 23.0 | 1.5 | 42.37 | 21.0 | 161 | 47 | Rigopoulou et al. (1997) | |
| NGC 3516 | 38.9 | 1.2 | 42.75 | 20.0 | 52 | 39 | Monje, Blain & Phillips (2011) | |
| NGC 4151 | 19.0 | 1.5 | 42.56 | 22.7 | 189 | 45 | Rigopoulou et al. (1997) | |
| NGC 5643 | 16.9 | 2.0 | 42.41 | 25.4 | 137 | 29 | Monje, Blain & Phillips (2011) | |
| NGC 7314 | 17.4 | 1.9 | 42.18 | 21.6 | 137 | 63 | Rigopoulou et al. (1997) | |
| NGC 7465 | 27.2 | 1.9 | 41.93 | 21.5 | 37 | 50 | Monje, Blain & Phillips (2011) | |
| aOn the Tmb scale. | ||||||||
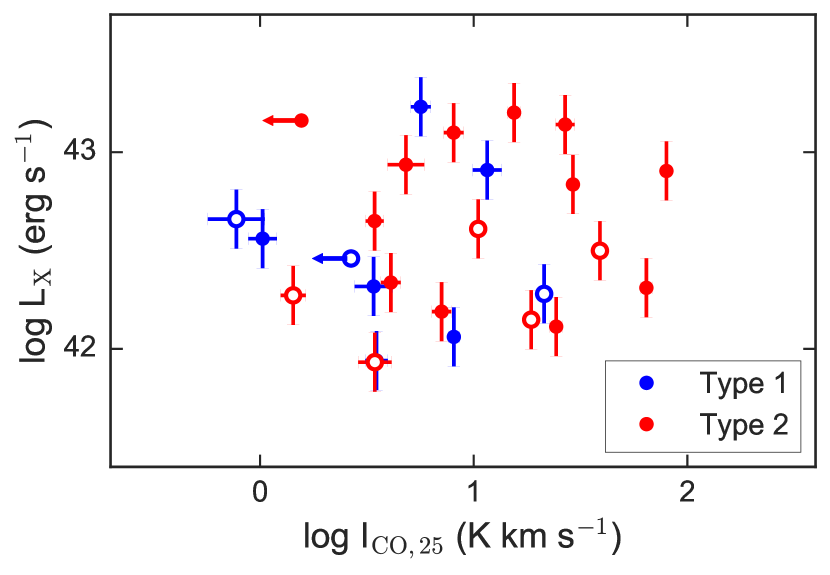
Here we explore whether the power output or nuclear environment of AGN is related to the gas content in their central kpc. Using X-ray spectral fits (Ricci et al. 2017), we test for correlations between the intrinsic X-ray luminosity (LX) or the Hydrogen column density of nuclear absorption (NH) against the CO 21 intensity (ICO,25) corrected for distance-dependent systematics (Section 4.1). This element of our study does not require the control sample, so we are free to expand our sample of AGN to cover a larger range in AGN power to improve statistics and the dynamic range available to test for correlations. Therefore, we supplement the LLAMA AGN with a set of CO 21 measurements from the literature for eight other SWIFT-BAT selected AGN at Mpc. We retain the LLAMA distance limit to curtail Malmquist bias and the need for large distance-dependent corrections. The CO 21 measurements of the supplementary AGN, adopted distances, X-ray spectral properties, and galaxy structural properties relevant to the ICO correction are shown in Table 4. Their X-ray luminosities overlap with, but are typically lower, than those of LLAMA. Two heavily X-ray obscured supplementary AGN only have lower limits on NH.
We find no correlation between ICO,25 and the power of the AGN measured by LX (Figure 13). A Spearman rank correlation test yields a coefficient of 0.06 and a probability of 78% that these properties are completely uncorrelated. This is not surprising given the vastly different scales spanned by the single-dish beams and the accretion disk: the amount of cold molecular gas over kpc is weakly coupled to the instantaneous nuclear accretion rate.
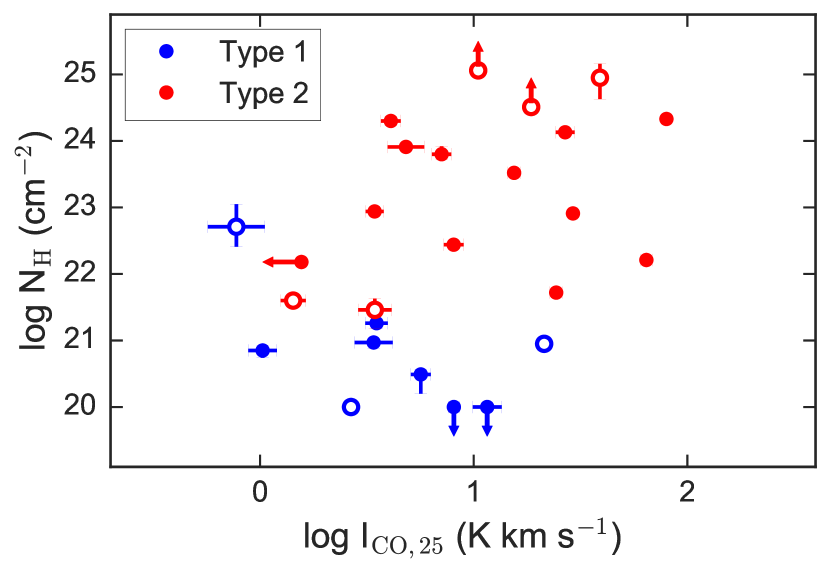
On the other hand, we find a mild correlation between ICO,25 and NH (Figure 14) with a Spearman rank correlation coefficient of 0.4 and a rejection of the null hypothesis of uncorrelated quantities at the 5% level. The ability to uncover this trend is certainly due to the large dynamic range in NH spanned by these local AGN. NH also correlates well with optical extinction towards the broad-line region and with mid-IR extinction towards the AGN torus (Davies et al. 2015; Burtscher et al. 2016), and this can be seen from the vertical differentiation of blue and red points in the Figure. While objects with low ICO are a mix of Type 1s and Type 2s, there is a preponderance of Type 2s among the AGN with high CO intensities. We will discuss this result in more detail in Section 5.4.
5 Discussion
5.1 Feedback energy considerations
The large beam size of the single-dish CO observations give us a census of cold gas within kpc of the nucleus in the LLAMA galaxies. Here we explore whether this gas could be influenced by the activity in the nucleus, using broad energy arguments.
The accretion energy liberated by the AGN can be estimated from their hard X-ray luminosities, using the bolometric correction from Winter et al. (2012) suitable for local BAT-selected AGN. For the period of a typical accreting phase over which the power from the SMBH remains roughly constant (tAGN), a certain fraction of the emitted energy will couple dynamically with the molecular gas. This radiation coupling () is very uncertain, but theoretically motivated models of AGN feedback suggest a value of at least per cent (Di Matteo, Springel & Hernquist 2005). Therefore, for each AGN, we can estimate an energy Erad, a rough measure of the accretion power that could influence molecular gas in the AGN:
| (6) | |||||
| (7) |
where is the 14–195 keV luminosity of the AGN. We adopt characteristic values of t yr (Hickox et al. 2014; Schawinski et al. 2015) and .
The exact form of the coupling could be in multiple forms, such as through direct absorption of radiation by molecular or atomic clouds in situ, or through a mechanical working fluid such as a thermal wind or relativistic particles in a jet. If Erad is distributed across all the molecular gas in the central regions of the AGN hosts (i.e., within the telescope beam), we could compare it to the gravitational potential energy of this gas, which gives us a sense of whether feedback from the AGN should destabilise this mass of gas. The gravitational potential in the central regions of our galaxies will be dominated by their baryonic material (stars and gas). The molecular gas fractions are a few per cent (Figure 8) and HI corrections in the centres of typical disk galaxies are small (e.g. Bigiel et al. 2008). Therefore, we can use our central stellar mass estimates from the beam-matched K-band luminosities, corrected for AGN light, to approximate the gravitational potential energy of the molecular gas, as follows:
| (8) |
where Rbeam is the radius of the galaxy region covered by the CO beam and is a geometrical factor that encapsulates our ignorance about the spatial distribution of the molecular gas with respect to the gravitational potential of the galaxy. has a value of 1 for gas that is uniformly distributed in a disk of size Rbeam within a spherical isothermal potential. We take this as our baseline assumption.
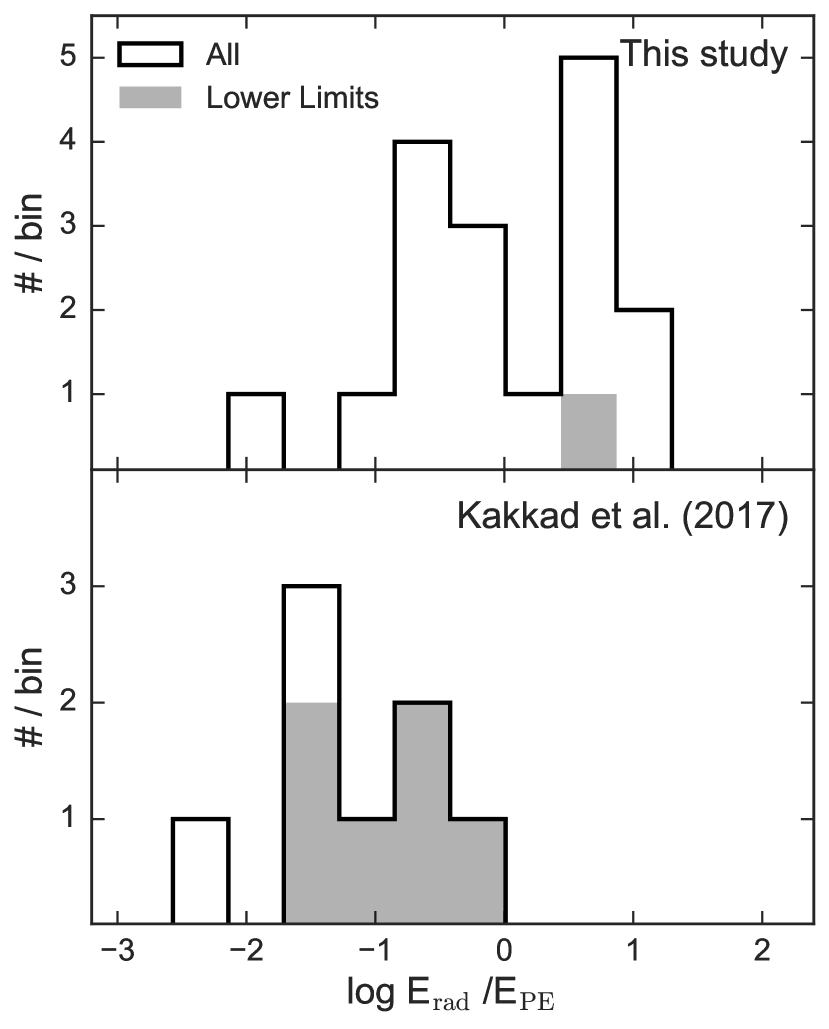
In the upper panel of Figure 15, we plot the ratio Erad/E for the AGN. In cases where we only have upper limits on CO 21 (MCG -05-23-016) or on the central stellar mass (NGC 3783), we use these limits to estimate a lower limit to Erad/E (grey filled histogram). While the ratio of energies shows considerable spread, there is sufficient radiative energy in most of the AGN to dynamically influence the molecular gas, given our assumptions. This highlights the relevance of both the luminosities of our AGN sample and the scales probed by our study. While these AGN may not be luminous enough to greatly affect the galaxy-wide gas content of their hosts, they do have the capacity to destabilise the cold gas within their central few kpc. When molecular material is more centrally concentrated than the gravitational potential of the galaxy, and the gas is easily destablised. This is the likely explanation for the powerful molecular outflows seen among local ULIRGs harbouring AGN (e.g., Feruglio et al. 2010; Cicone et al. 2014).
5.2 The central molecular gas in AGN host galaxies
We have compared and contrasted the central CO 21 luminosities (L; Section 4.1) and molecular gas fractions (fgas; Section 4.2) of the LLAMA AGN and inactive control galaxies. Despite the large spread of these quantities, we find them to be statistically indistinguishable between the subsamples. The most noticeable difference is the larger number of CO non-detections among the inactive group. Gas-poor galaxies may be under-represented among our AGN hosts, though, in both subsets, they constitute a minority, and hence the difference in CO detection rates among AGN and inactive galaxies is still consistent with sampling effects. We conclude that, for the most part, the galaxies in our sample have equivalent amounts of cold gas in their centres irrespective of their level of nuclear activity.
The star formation efficiencies and cold gas depletion timescales () in the centres of LLAMA galaxies are comparable to those found in the disks of normal inactive star forming galaxies in the local Universe (Section 4.5), as long as we assume a depressed in these central regions (Sandstrom et al. 2013). Broadly speaking, the AGN and inactive galaxies have very similar distributions of central , and our controlled study shows at best a marginal decrease in (or an increase in SFE) in the AGN. This is reflected in the slight offset () between AGN and inactive galaxies in Figure 11. This offset is independent of the various uncertain factors needed to convert measured luminosities to gas masses or SFRs.
The clearest conclusion from our analysis is that AGN definitely do not show strongly deviant SFEs, even in gas that is within the dynamical sphere of influence of a moderately luminous nuclear source. In particular, there is no evidence that the SFEs of the central molecular gas in AGN hosts are systematically suppressed. This implies that radiative feedback or winds, amply evident in the kinematics of emission lines from ionised gas and excited warm molecular gas in Seyferts (Veilleux, Cecil & Bland-Hawthorn 2005; Müller-Sánchez et al. 2011; Bae & Woo 2014), do not substantially alter the environments within molecular clouds that produce the bulk of the low-excitation CO emission. We have shown above that there is ample energy in these typical Seyferts to influence the dynamics of the gas. The normal values of the SFE in the LLAMA AGN suggests that the coupling of mechanical feedback energy from the nucleus with the cold, dense, star-forming phase in not as efficient as canonical models have assumed, at least in the settled disk galaxies that host most Seyfert nuclei in the local Universe.
The geometry of the AGN radiation field and winds may be an important mitigating factor. CO-emitting gas lies primarily in the plane of a galaxy’s thin disk. We have assumed in the calculations of Section 5.1 that this gas intersects with a substantial portion of the absorbed bolometric power from the AGN. However, most of the power may instead be absorbed and carried away in a hot phase that interacts only weakly with cold molecular clouds. This could happen due to disk plane pressure gradients, which force hot winds to escape perpendicular to the disk as suggested by some high-resolution hydrodynamic simulations (Gabor & Bournaud 2014; Wada, Schartmann & Meijerink 2016). The primary mode of AGN feedback on galaxies would then be through the heating of galaxy atmospheres that strangulates future star formation, rather than through the prompt shut-down of existing star formation.
While all of the CO-detected AGN have SFEs at or above the norm for star-forming disks, 4 of the 14 CO-detected inactive galaxies have SFEs depressed by at least a factor of 5 compared to this norm. This may point to a situation where galaxies with low central SFEs do not easily host luminous AGN. While the result needs to be verified with more statistical rigour using larger samples, we speculate on its implication in light of AGN fuelling mechanisms. The SFE of bulk molecular gas is directly proportional to the fraction of the gas that can collapse into dense pre-stellar cores and sustain star formation. The processes that hinder the formation of dense cores in nuclear molecular gas, such as high levels of turbulence, low molecular gas filling factors, or low gas pressures (Krumholz & McKee 2005), also prevent this gas from effectively forming an accretion flow to the central SMBH. Thus, a marginally unstable circum-nuclear molecular structure may be a necessary prerequisite for AGN activity at a high accretion rate.
5.3 Comparisons to AGN host galaxies at high redshift
Star formation during the redshift interval has particular relevance for our understanding of the evolution of galaxies, since most of the stellar mass of the Universe was produced at that time (Madau & Dickinson 2014). AGN are more frequent, and possibly more luminous, at this epoch (e.g., Aird et al. 2010), so there is much interest in unraveling the signatures of AGN feedback on molecular gas in these distant AGN hosts (e.g., Brusa et al. 2015; Kakkad et al. 2017).
Recently, Kakkad et al. (2017) reported lower and molecular gas fractions from an ALMA survey of ten X-ray selected AGN at . In the scenario of suppressive AGN feedback on star formation, their results are interpreted as widespread evidence for the prompt removal of star-forming molecular gas, possibly by an outflow, which depresses . A lower results from this because the SFR tracer (in their case, the FIR continuum) responds to the associated decrease in star formation more slowly that the timescale over which the gas is removed.
At face value, these results are inconsistent with our findings, since we find the same distribution of gas fractions in the LLAMA galaxies independent of their state of nuclear activity. Therefore, we compare some of the relevant properties of the AGN studied in Kakkad et al. (2017) to the AGN in LLAMA to help appreciate these differences.
In the lower panel of Figure 15, we plot the ratio Erad/E ratio for the Kakkad et al. (2017) sample, calculated using Equations 6 & 8. We use the , M⋆, and as tabulated in their work, and adopt an Rbeam of 4 kpc, consistent with the 1 arcsec ALMA resolution of their CO 21 maps. We have assumed that the gravitational potential in these distant AGN is dominated by baryons (stars and gas). Seven of their targets only have upper limits in , which we show as shaded histograms in Figure 15.
Assuming as in Section 5.1, we find that the AGN from Kakkad et al. (2017) generally have Erad/E, and are therefore less capable of disturbing their molecular gas than the LLAMA AGN. This is because the host galaxies of these distant AGN are orders of magnitude more gas-rich than the centres of local Seyfert galaxies. Even though the luminous output of the AGN from Kakkad et al. (2017) are a factor of higher than those in LLAMA, they cannot produce enough energy to easily unbind the sheer amount of gas found in their massive, strongly star-forming hosts. This makes the strong evidence for AGN feedback reported in Kakkad et al. (2017) even more at odds with our findings.
There may be many reasons for this difference. The molecular gas in distant AGN hosts may be more centrally concentrated than the stellar distribution (), though the CO 21 map is resolved in one of the targets from Kakkad et al. (2017), suggesting this is not universally the case. The coupling between the AGN luminosity and molecular gas () may be significantly higher than canonical models imply. Alternatively, the timescale for luminous AGN activity (tAGN) may be longer at these redshifts. Finally, more luminous AGN may be able to excite and destroy the CO molecule more effectively, which will increase , though a comparison of CO-based and dust-based gas masses for one well-studied case suggests otherwise (Brusa et al. 2015). All these unknowns may play a part in enhancing the ability of nuclear activity to unbind galaxy-wide gas and reconcile our results with those of Kakkad et al. (2017). If so, this would imply a clear difference between local and high-redshift galaxies, with respect to the detailed physics that governs the cross-section of interaction between the output of the AGN and the star-forming gas. It is essential to tie this down if the global importance of AGN feedback is to be fully understood.
5.4 Is AGN obscuration related to the amount of cold gas in a galaxy’s centre?
We find a mild positive correlation between the nuclear obscuring column (NH) and ICO,25 (Section 4.6). Our result is more significant than previous work from Strong et al. (2004), though they used a set of AGN that covered a much wider range in distance (15-300 Mpc) and their observations were not corrected for beam-dilution effects. The existence of this correlation suggests that the material that obscures at least some of the high energy emission from the AGN is linked to molecular gas in the larger environment of the nucleus. In the popular AGN unification scheme, most nuclear obscuration can be attributed to a pc-scale “torus” with an anisotropic gas distribution (see Netzer (2015) for a modern review). A small fraction of the obscuration could come from gas on kpc-scales, as some IR studies have postulated (Deo et al. 2007; Goulding et al. 2012; Prieto et al. 2014). A weak connection may also arise due to the long-lived gaseous inflow patterns between the torus and circum-nuclear gas, or due to the molecular emission from the torus itself (García-Burillo et al. 2016; Gallimore et al. 2016). Modern interferometric observatories such as ALMA will obtain molecular line maps that resolve the inner circum-nuclear region ( pc) for complete samples of nearby AGN. This should allow a detailed assessment of whether the immediate nuclear environment and the covering factor of central molecular gas plays a part in the obscuration properties of AGN.
The observed fraction of obscured AGN is a function of nuclear luminosity (e.g., Lawrence & Elvis 1982; Davies et al. 2015). In our study, both obscured and unobscured AGN are equally luminous (Figure 13), but larger samples, typically spanning a wider range of distances, will suffer from unavoidable Malmquist bias. Such luminosity-dependent effects can masquerade as trends with obscuration, likely a limitation of much earlier work. It is essential that future investigation into the connections between large-scale molecular gas and AGN obscuration is crafted with special care to minimise such biases or account for them through modelling.
5.5 Star-formation in AGN host galaxies
AGN and inactive galaxies span a range of IR luminosities. AGN betray themselves in the form of clear MIR excesses, and we have used this fact to confidently separate the AGN and host galaxy IR contributions from the IR SEDs (Appendix A). We find that AGN host galaxies are systematically more luminous in the FIR, which can be attributed to higher levels of star-formation even when controlling for stellar mass and Hubble type. The equivalent galaxy-integrated SFRs of AGN hosts are higher than controlled inactive galaxies, in a median sense. While we cannot take our results as independent evidence for higher SFRs in AGN due to the limited statistical power of our sample, they are in line with a number of other studies which demonstrate that AGN, especially luminous ones, are preferentially found among star-forming and FIR-bright host galaxies (e.g., Salim et al. 2007; Rosario et al. 2013; Shimizu et al. 2017).
This observation highlights the important role that cold gas plays in the fueling of Seyfert AGN activity. The same gaseous reservoirs sustain star formation in these galaxies. Even among galaxies with similar gross optical properties and structure, it is the ones that have enough gas to sustain star formation that are also preferentially the hosts of AGN. This connection has been uncovered in X-ray luminous AGN hosts across a broad range of redshifts (e.g., Santini et al. 2012; Rosario et al. 2013; Vito et al. 2014).
We have used the WISE 22 m images to determine the scaling to central IR luminosities for most of the inactive galaxies. Unlike in the canonical FIR ( m), the MIR dust emission could have a substantial component that arises from heating by the interstellar radiation field from older stars (e.g. Groves et al. 2012). This additional contribution boosts the central MIR emission relative to the extended MIR emission and flattens the dust emission profiles of these galaxies in the MIR compared to the FIR. Our examination of the beam-matching factor () in Figure 10 suggests that this effect is not large, since the distribution of is very similar between AGN and inactive galaxies, even though the factor was calculated from 160 m images for the AGN. However, even if there is a small contribution to the 22 m emission from dust that is not heated by star formation, this will only heighten the difference in the central SFRs between AGN and their control.
6 Conclusions
We have used the APEX and JCMT telescopes to obtain CO 21 spectroscopy for a matched sample of 17 AGN and 18 control galaxies from the LLAMA survey. Using this data, along with an additional measurement in the literature, we have explored whether the properties of the cold molecular gas in the central few kpc of AGN differ significantly from inactive galaxies with similar host characteristics.
1) The central CO 21 intensities (ICO), gas fractions (), and molecular gas depletion times () of AGN are statistically indistinguishable from those of the inactive control galaxies.
2) The centres of AGN hosts and inactive control galaxies both lie on the same relationship between L and SFR as the extended discs of star-forming galaxies, implying normal efficiencies of star formation in the central molecular gas.
3) These results indicate that AGN do not strongly influence the cold, star-forming molecular phase in the centres of their hosts, despite heuristic arguments which suggest that the AGN in LLAMA are luminous enough to dynamically disturb this material (Section 5.1). We conclude that the prompt feedback from nuclear activity on the star-forming molecular phase is weak.
4) The most CO-rich AGN are also optically and X-ray obscured. This suggests a weak but definite connection between kpc-scale cold gas and the obscuration to the nucleus, which may be in situ or mediated by the dynamical connection between circum-nuclear material and the obscuring torus. A larger survey of AGN is needed to explore this more effectively, and Section 5.4 discusses a possible strategy.
Acknowledgements
We thank the anonymous referee for insight that has substantially improved the quality of this work. D.R. and D.M.A. acknowledge the support of the UK Science and Technology Facilities Council (STFC) through grant ST/L00075X/1. L.B. acknowledges support by a DFG grant within the SPP 1573 “Physics of the interstellar medium”. M.K. acknowledges support from the Swiss National Science Foundation and Ambizione fellowship grant PZ00P2_154799/1. A.S. acknowledges the support of the Royal Society through the award of a University Research Fellowship. The Atacama Pathfinder Experiment (APEX) is a collaboration between the Max-Planck-Institut für Radioastronomie, the European Southern Observatory, and the Onsala Space Observatory. The James Clerk Maxwell Telescope (JCMT) is operated by the East Asian Observatory on behalf of NAOJ, ASIAA, KASI, NAOC, and the Chinese Academy of Sciences (Grant No. XDB09000000), with additional funding support from the STFC and participating universities in the United Kingdom and Canada. The Wide-field Infrared Survey Explorer (WISE) is a joint project of the University of California, Los Angeles, and JPL/California Institute of Technology, funded by NASA. The Infrared Astronomical Satellite (IRAS) was a joint project of the US, UK and the Netherlands. Herschel is an ESA space observatory with science instruments provided by European-led Principal Investigator consortia and with important participation from NASA.
References
- Aalto et al. (1995) Aalto S., Booth R. S., Black J. H., Johansson L. E. B., 1995, A&A, 300, 369
- Adams (1977) Adams T. F., 1977, ApJS, 33, 19
- Aird et al. (2010) Aird J. et al., 2010, MNRAS, 401, 2531
- Astropy Collaboration et al. (2013) Astropy Collaboration et al., 2013, A&A, 558, A33
- Bae & Woo (2014) Bae H.-J., Woo J.-H., 2014, ApJ, 795, 30
- Baloković et al. (2015) Baloković M. et al., 2015, ApJ, 800, 62
- Bertram et al. (2007) Bertram T., Eckart A., Fischer S., Zuther J., Straubmeier C., Wisotzki L., Krips M., 2007, A&A, 470, 571
- Bigiel et al. (2008) Bigiel F., Leroy A., Walter F., Brinks E., de Blok W. J. G., Madore B., Thornley M. D., 2008, AJ, 136, 2846
- Bolatto, Wolfire & Leroy (2013) Bolatto A. D., Wolfire M., Leroy A. K., 2013, ARA&A, 51, 207
- Boselli, Cortese & Boquien (2014) Boselli A., Cortese L., Boquien M., 2014, A&A, 564, A65
- Bower et al. (2006) Bower R. G., Benson A. J., Malbon R., Helly J. C., Frenk C. S., Baugh C. M., Cole S., Lacey C. G., 2006, MNRAS, 370, 645
- Brusa et al. (2015) Brusa M. et al., 2015, A&A, 578, A11
- Bruzual & Charlot (2003) Bruzual G., Charlot S., 2003, MNRAS, 344, 1000
- Burtscher et al. (2016) Burtscher L. et al., 2016, A&A, 586, A28
- Burtscher et al. (2015) Burtscher L. et al., 2015, A&A, 578, A47
- Chabrier (2003) Chabrier G., 2003, PASP, 115, 763
- Cicone et al. (2014) Cicone C. et al., 2014, A&A, 562, A21
- Croton et al. (2006) Croton D. J. et al., 2006, MNRAS, 365, 11
- Curran et al. (2001) Curran S. J., Polatidis A. G., Aalto S., Booth R. S., 2001, A&A, 368, 824
- Dahari & De Robertis (1988) Dahari O., De Robertis M. M., 1988, ApJS, 67, 249
- Dale et al. (2012) Dale D. A. et al., 2012, ApJ, 745, 95
- Dale & Helou (2002) Dale D. A., Helou G., 2002, ApJ, 576, 159
- Dame, Hartmann & Thaddeus (2001) Dame T. M., Hartmann D., Thaddeus P., 2001, ApJ, 547, 792
- Davies et al. (2015) Davies R. I. et al., 2015, ApJ, 806, 127
- de Vaucouleurs et al. (1991) de Vaucouleurs G., de Vaucouleurs A., Corwin, Jr. H. G., Buta R. J., Paturel G., Fouqué P., 1991, Third Reference Catalogue of Bright Galaxies. Volume I: Explanations and references. Volume II: Data for galaxies between 0h and 12h. Volume III: Data for galaxies between 12h and 24h.
- Deo et al. (2007) Deo R. P., Crenshaw D. M., Kraemer S. B., Dietrich M., Elitzur M., Teplitz H., Turner T. J., 2007, ApJ, 671, 124
- Di Matteo, Springel & Hernquist (2005) Di Matteo T., Springel V., Hernquist L., 2005, Nature, 433, 604
- Fabian (2012) Fabian A. C., 2012, ARA&A, 50, 455
- Feruglio et al. (2010) Feruglio C., Maiolino R., Piconcelli E., Menci N., Aussel H., Lamastra A., Fiore F., 2010, A&A, 518, L155
- Foreman-Mackey et al. (2013) Foreman-Mackey D., Hogg D. W., Lang D., Goodman J., 2013, PASP, 125, 306
- Gabor & Bournaud (2014) Gabor J. M., Bournaud F., 2014, MNRAS, 441, 1615
- Gallimore et al. (2016) Gallimore J. F. et al., 2016, ApJ, 829, L7
- Gandhi et al. (2009) Gandhi P., Horst H., Smette A., Hönig S., Comastri A., Gilli R., Vignali C., Duschl W., 2009, A&A, 502, 457
- García-Burillo et al. (2016) García-Burillo S. et al., 2016, ApJ, 823, L12
- García-Burillo et al. (2005) García-Burillo S., Combes F., Schinnerer E., Boone F., Hunt L. K., 2005, A&A, 441, 1011
- García-Burillo et al. (2014) García-Burillo S. et al., 2014, A&A, 567, A125
- Genzel et al. (2012) Genzel R. et al., 2012, ApJ, 746, 69
- Genzel et al. (2010) Genzel R. et al., 2010, MNRAS, 407, 2091
- Goulding et al. (2012) Goulding A. D., Alexander D. M., Bauer F. E., Forman W. R., Hickox R. C., Jones C., Mullaney J. R., Trichas M., 2012, ApJ, 755, 5
- Groves et al. (2012) Groves B. et al., 2012, MNRAS, 426, 892
- Heckman et al. (1989) Heckman T. M., Blitz L., Wilson A. S., Armus L., Miley G. K., 1989, ApJ, 342, 735
- Hickox et al. (2014) Hickox R. C., Mullaney J. R., Alexander D. M., Chen C.-T. J., Civano F. M., Goulding A. D., Hainline K. N., 2014, ApJ, 782, 9
- Hinshaw et al. (2013) Hinshaw G. et al., 2013, ApJS, 208, 19
- Kakkad et al. (2017) Kakkad D. et al., 2017, ArXiv e-prints
- Kauffmann et al. (2003) Kauffmann G. et al., 2003, MNRAS, 346, 1055
- Kennicutt et al. (2011) Kennicutt R. C. et al., 2011, PASP, 123, 1347
- Kennicutt & Evans (2012) Kennicutt R. C., Evans N. J., 2012, ARA&A, 50, 531
- Koss et al. (2013) Koss M., Mushotzky R., Baumgartner W., Veilleux S., Tueller J., Markwardt C., Casey C. M., 2013, ApJ, 765, L26
- Krumholz & McKee (2005) Krumholz M. R., McKee C. F., 2005, ApJ, 630, 250
- Lada et al. (2012) Lada C. J., Forbrich J., Lombardi M., Alves J. F., 2012, ApJ, 745, 190
- Lawrence & Elvis (1982) Lawrence A., Elvis M., 1982, ApJ, 256, 410
- Leroy et al. (2008) Leroy A. K., Walter F., Brinks E., Bigiel F., de Blok W. J. G., Madore B., Thornley M. D., 2008, AJ, 136, 2782
- Leroy et al. (2013) Leroy A. K. et al., 2013, AJ, 146, 19
- Lisenfeld et al. (2011) Lisenfeld U. et al., 2011, A&A, 534, A102
- Madau & Dickinson (2014) Madau P., Dickinson M., 2014, ARA&A, 52, 415
- Maiolino et al. (1997) Maiolino R., Ruiz M., Rieke G. H., Papadopoulos P., 1997, ApJ, 485, 552
- Maraston (2005) Maraston C., 2005, MNRAS, 362, 799
- Mateos et al. (2012) Mateos S. et al., 2012, MNRAS, 426, 3271
- Meléndez et al. (2014) Meléndez M., Mushotzky R. F., Shimizu T. T., Barger A. J., Cowie L. L., 2014, ApJ, 794, 152
- Monje, Blain & Phillips (2011) Monje R. R., Blain A. W., Phillips T. G., 2011, ApJS, 195, 23
- Mor & Netzer (2012) Mor R., Netzer H., 2012, MNRAS, 420, 526
- Mullaney et al. (2011) Mullaney J. R., Alexander D. M., Goulding A. D., Hickox R. C., 2011, MNRAS, 414, 1082
- Müller-Sánchez et al. (2011) Müller-Sánchez F., Prieto M. A., Hicks E. K. S., Vives-Arias H., Davies R. I., Malkan M., Tacconi L. J., Genzel R., 2011, ApJ, 739, 69
- Netzer (2015) Netzer H., 2015, ARA&A, 53, 365
- Piconcelli et al. (2007) Piconcelli E., Bianchi S., Guainazzi M., Fiore F., Chiaberge M., 2007, A&A, 466, 855
- Pilbratt et al. (2010) Pilbratt G. L. et al., 2010, A&A, 518, L1
- Prieto et al. (2014) Prieto M. A., Mezcua M., Fernández-Ontiveros J. A., Schartmann M., 2014, MNRAS, 442, 2145
- Ricci et al. (2017) Ricci C. et al., 2017, ArXiv e-prints
- Ricci et al. (2015) Ricci C., Ueda Y., Koss M. J., Trakhtenbrot B., Bauer F. E., Gandhi P., 2015, ApJ, 815, L13
- Rigopoulou et al. (1997) Rigopoulou D., Papadakis I., Lawrence A., Ward M., 1997, A&A, 327, 493
- Rivers et al. (2015) Rivers E. et al., 2015, ApJ, 815, 55
- Rosario (2017) Rosario D. J., 2017, in prep.
- Rosario et al. (2016) Rosario D. J., Mendel J. T., Ellison S. L., Lutz D., Trump J. R., 2016, MNRAS, 457, 2703
- Rosario et al. (2013) Rosario D. J. et al., 2013, ApJ, 771, 63
- Saintonge et al. (2011) Saintonge A. et al., 2011, MNRAS, 415, 61
- Saintonge et al. (2012) Saintonge A. et al., 2012, ApJ, 758, 73
- Salim et al. (2007) Salim S. et al., 2007, ApJS, 173, 267
- Sandstrom et al. (2013) Sandstrom K. M. et al., 2013, ApJ, 777, 5
- Santini et al. (2012) Santini P. et al., 2012, A&A, 540, A109
- Sawicki (2012) Sawicki M., 2012, PASP, 124, 1208
- Schawinski et al. (2015) Schawinski K., Koss M., Berney S., Sartori L. F., 2015, MNRAS, 451, 2517
- Schawinski et al. (2010) Schawinski K. et al., 2010, ApJ, 711, 284
- Schruba et al. (2011) Schruba A. et al., 2011, AJ, 142, 37
- Shimizu et al. (2016) Shimizu T. T., Meléndez M., Mushotzky R. F., Koss M. J., Barger A. J., Cowie L. L., 2016, MNRAS, 456, 3335
- Shimizu et al. (2017) Shimizu T. T., Mushotzky R. F., Meléndez M., Koss M. J., Barger A. J., Cowie L. L., 2017, MNRAS, 466, 3161
- Solomon & de Zafra (1975) Solomon P. M., de Zafra R., 1975, ApJ, 199, L79
- Solomon & Vanden Bout (2005) Solomon P. M., Vanden Bout P. A., 2005, ARA&A, 43, 677
- Somerville et al. (2008) Somerville R. S., Hopkins P. F., Cox T. J., Robertson B. E., Hernquist L., 2008, MNRAS, 391, 481
- Speagle et al. (2014) Speagle J. S., Steinhardt C. L., Capak P. L., Silverman J. D., 2014, ApJS, 214, 15
- Strong et al. (2004) Strong M., Pedlar A., Aalto S., Beswick R. J., Curran S., Booth R., 2004, MNRAS, 353, 1151
- Symeonidis et al. (2016) Symeonidis M., Giblin B. M., Page M. J., Pearson C., Bendo G., Seymour N., Oliver S. J., 2016, MNRAS, 459, 257
- Veilleux, Cecil & Bland-Hawthorn (2005) Veilleux S., Cecil G., Bland-Hawthorn J., 2005, ARA&A, 43, 769
- Vito et al. (2014) Vito F. et al., 2014, MNRAS, 441, 1059
- Wada, Schartmann & Meijerink (2016) Wada K., Schartmann M., Meijerink R., 2016, ApJ, 828, L19
- Winter et al. (2012) Winter L. M., Veilleux S., McKernan B., Kallman T. R., 2012, ApJ, 745, 107
- Young & Scoville (1991) Young J. S., Scoville N. Z., 1991, ARA&A, 29, 581
Appendix A Empirical AGN SED templates in the Infrared
A number of recent studies have used MIR spectroscopy from the Spitzer/Infra-Red Spectrograph (IRS) and FIR photometry from IRAS to arrive at the intrinsic AGN-heated dust emission in representative samples of local Seyfert galaxies and QSOs. Despite a similarity in approach, there remains some disagreement among these studies on the degree to which the light from the AGN is reprocessed by cold dust that lies kpc from the nucleus. While most empirical AGN SED templates agree on the general shape of the AGN torus emission at their peak wavelengths ( m), they differ by as much as an order of magnitude in the long-wavelength tail emitted by AGN-heated dust in the FIR. In general, the templates derived by Mor & Netzer (2012) imply a steep drop-off to long wavelengths, while the template recently proposed by Symeonidis et al. (2016), applicable to luminous PG QSOs, indicates a much slower drop-off, with more of the AGN’s IR luminosity arising in the FIR. The popular templates from Mullaney et al. (2011), based on fits to SWIFT-BAT AGN, exhibit a behaviour intermediate to the templates of Mor & Netzer (2012) and Symeonidis et al. (2016) (Figure 16).
Rather than restrict ourselves to a choice of AGN templates that is dictated by one study, we instead considered the ensemble of all templates compiled by the works listed above – three each from Mor & Netzer (2012)101010The upper and lower scatter about the mean Mor & Netzer (2012) template was kindly provided by H. Netzer (private communication). and Mullaney et al. (2011)111111The Mullaney et al. (2011) templates were extrapolated to 1 m with a power-law of fixed slope that matches those of the other template families (Figure 16). representing the median and scatter shown by the AGN in their samples, and the mean SED from Symeonidis et al. (2016). These seven templates can be cast into a sequence delineated by the fraction of the IR luminosity that is emitted in the FIR. Therefore, we define a parameter , where is the monochromatic rest-frame 160 m luminosity of the AGN template, and is its integrated 8–1000 m luminosity. We plot the final set of seven templates in Figure 16 differentiated by . This library of basis templates was used in the SED fits described in Section 3.1.
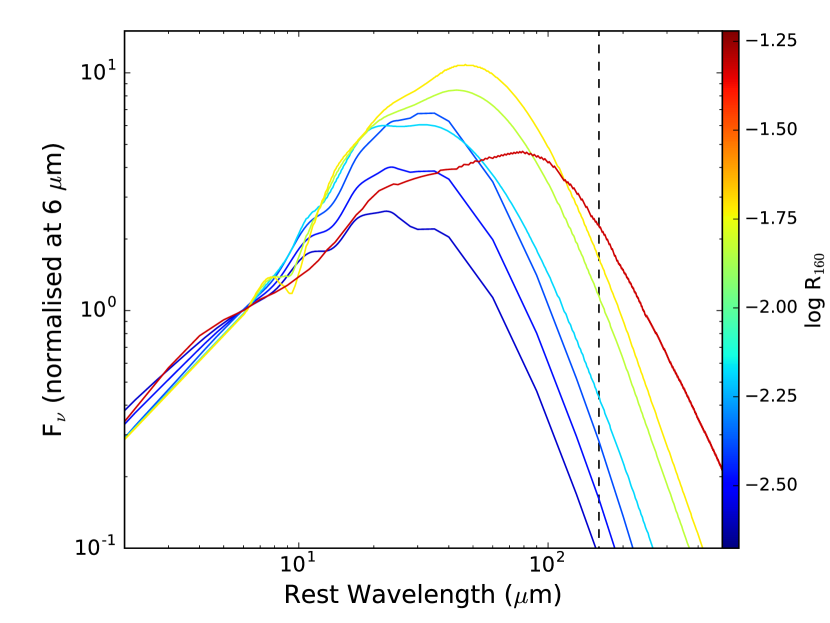
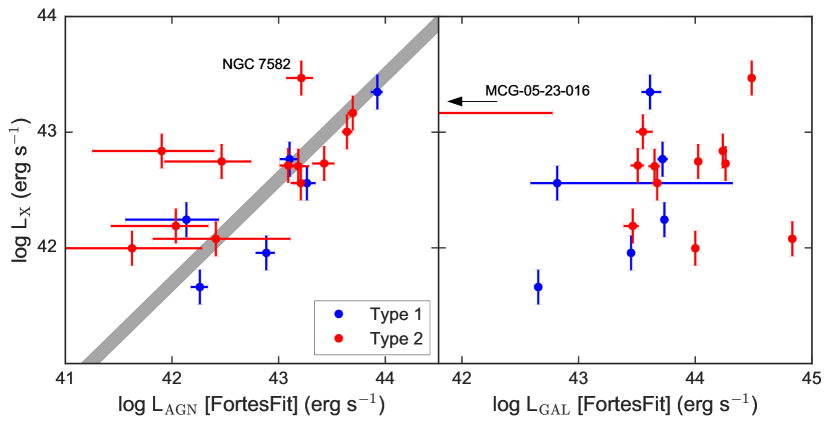
In Section 4.3, we explore the differences between the galaxy IR luminosities () between AGN and control galaxies. Errors in this analysis could arise if the AGN IR templates do not adequately capture the emission from cold dust that is heated directly by the AGN. As discussed above, the inclusion of a range of empirical AGN IR template shapes is motivated by our current best understanding of the diversity of the long-wavelength emission from AGN. However, one may argue that this approach is still not wholly satisfactory. The AGN that were used to construct the empirical AGN templates are typically more luminous than the LLAMA AGN, and, regardless of the method, the FIR emission of the templates are still extrapolations, since a model dust component from the galaxy dominated the FIR in all these studies. Therefore, the possibility remains that the luminosity of AGN-heated dust in the LLAMA AGN was underestimated, and a portion of the true emission from the AGN was incorrectly incorporated into by the SED fits. If this were the case, we would expect a correlation between and LX, an independent measure of the luminosity of the AGN.
Figure 17 tests this notion. In the left panel, we demonstrate that the IR luminosity of the AGN () derived from the SED fits correlates with LX, and that the slope of the trend is consistent with the expectation from the X-ray–MIR relation of Gandhi et al. (2009). A few poorly-constrained estimates of tend to be significantly lower than the expectation from this relation (grey band), but an inspection of their fits show that, in all cases, the AGN is faint with respect to the MIR emission from the system and does not display much contrast in the combined SED. The only object in which an energetically important AGN contribution may be underestimated is NGC 7582 (marked in the diagram). This well-known Seyfert 2 is known to display strong short-timescale X-ray spectral variations from a complex set of absorbers (Piconcelli et al. 2007), and recent NuStar analysis (Rivers et al. 2015) suggest an intrinsic flux that is an order of magnitude lower than the value we used for this study. Taking all this information together, we consider the general agreement between our estimates of and the predictions from the LX as evidence for the validity of our fits.
Unlike with , there is no correlation between LX and (right panel of Figure 17). In order to resolve the differences in the distributions of between AGN and inactive galaxies in Figure 9, most of the AGN would have required a boost of to their FIR luminosities, which would betray itself clearly in this figure in the form of higher among the more luminous AGN. The lack of any significant correlation implies that we have not systematically included – or excluded – any important portion of an AGN’s IR luminosity incorrectly as emission from the galaxy.
Appendix B MCG -05-23-016
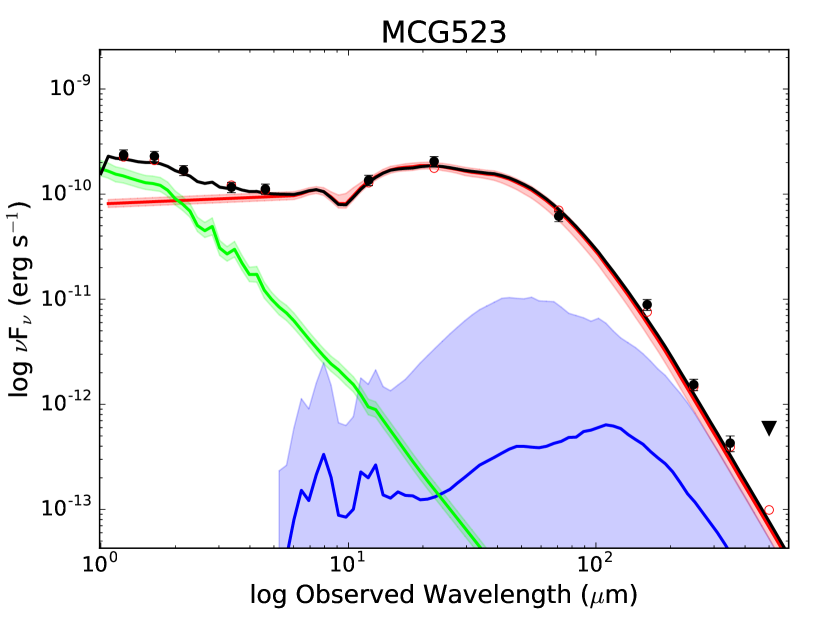
This relatively powerful AGN (LX erg s-1) has been studied extensively in recent years due to its complex X-ray spectrum, which shows a strong Fe K fluorescence line from both the accretion disk and torus, as well as a prominent reflection hump indicating substantial amounts of nuclear cold gas (e.g. Baloković et al. 2015). It is hosted by a gas-poor early-type host galaxy with a low stellar mass M⋆ M⊙. This AGN is unique in our sample because its SED is consistent with pure AGN-heated dust even into the sub-mm bands, with no hint of a cold dust excess from star-formation (Figure 18). In this sense, it provides us with one of the best constraints on the intrinsic torus emission from an AGN in the nearby Universe. We find a best-fitting value of which is substantially shallower towards the FIR than the mean empirical AGN SED of Mor & Netzer (2012), but consistent with the flatter SEDs presented by Mullaney et al. (2011). It is also somewhat steeper than the FIR-bright SED proposed by Symeonidis et al. (2016). In this galaxy, we can assert with some confidence that the AGN is not responsible for heating a great deal of extended cold dust which could be mistakenly attributed to star formation. Having said this, MCG -05-23-016 is the only AGN in LLAMA that is not detected in CO. The upper limit on its central gas mass is M⊙, sufficient to fuel the AGN at its current luminosity for 700 Myr. Therefore, the bright and prominent torus is still quite consistent with our constraints on the molecular emission from this system. MCG -05-23-016 has an unusually small and faint narrow line region (Prieto et al. 2014). Therefore, it is possible that the paucity of gas and dust in the central kpc is responsible for the lack of extended AGN heated dust emission. Much of the detectable gas in this galaxy appears to be confined to within the inner few 100 pc.