Dust-trapping vortices and a potentially planet-triggered spiral wake in the pre-transitional disk of V1247 Orionis
Abstract
The radial drift problem constitutes one of the most fundamental problems in planet formation theory, as it predicts particles to drift into the star before they are able to grow to planetesimal size. Dust-trapping vortices have been proposed as a possible solution to this problem, as they might be able to trap particles over millions of years, allowing them to grow beyond the radial drift barrier. Here, we present ALMA 0.04″-resolution imaging of the pre-transitional disk of V1247 Orionis that reveals an asymmetric ring as well as a sharply-confined crescent structure, resembling morphologies seen in theoretical models of vortex formation. The asymmetric ring (at 0.17″=54 au separation from the star) and the crescent (at 0.38″=120 au) seem smoothly connected through a one-armed spiral arm structure that has been found previously in scattered light. We propose a physical scenario with a planet orbiting at ″100 au, where the one-armed spiral arm detected in polarised light traces the accretion stream feeding the protoplanet. The dynamical influence of the planet clears the gap between the ring and the crescent and triggers two vortices that trap mm-sized particles, namely the crescent and the bright asymmetry seen in the ring. We conducted dedicated hydrodynamics simulations of a disk with an embedded planet, which results in similar spiral-arm morphologies as seen in our scattered light images. At the position of the spiral wake and the crescent we also observe 12CO (3-2) and H12CO+ (4-3) excess line emission, likely tracing the increased scale-height in these disk regions.
Subject headings:
stars: pre-main sequence — stars: variables: T Tauri, Herbig Ae/Be — stars: individual (V1247 Orionis) — planets and satellites: formation — accretion, accretion disks — submillimeter: planetary systems1. Introduction
One of the major unsolved problems in the field of planet formation is the radial drift problem, where drag forces between the dust and gas cause the orbits of dust grains to decay (Weidenschilling, 1977). The radial drift velocity scales with the particle size and might prevent dust grains from growing beyond millimeter size (at 100 au separation). Larger particles would drift into the star before they are able to grow further into planetesimals and planets. One promising mechanism that has been proposed for solving the radial drift barrier is dust trapping, where the dust particles get trapped in a pressure bump and converge azimuthally towards the pressure maximum instead of acquiring high inward drift (e.g. Brauer et al., 2008; Birnstiel et al., 2013).
Pinilla et al. (2012) estimated that a local enhancement of 30% in gas pressure would be sufficient to trap particles effectively over several million years. Over the last years, several mechanisms have been proposed that could produce the required long-lifed vortices in the disk, including the presence of planets (e.g. Dodson-Robinson & Salyk, 2011; Zhu et al., 2012; Pinilla et al., 2012) and the strong viscosity-gradients that are encountered at the edges of disk dead zones (Regály et al., 2012).
Observationally, dust-trapping vortices could be detected at millimeter wavelengths as asymmetric structures with a wide azimuthal but narrow radial extend. SMA+CARMA interferometry already identified several disks with asymmetric structures that have been interpreted as dust traps (Regály et al., 2012). ALMA observations on Oph-IRS48 (catalog ) (van der Marel et al., 2013) with 0.22″ resolution showed a peanut-shaped structure that spans less than a third of the ring azimuth, while 0.16″-resolution imaging with superuniform weighting suggested the presence of a ring+arc structure around HD135344B (catalog ) (van der Marel et al., 2016).
V1247 Orionis (catalog ) is an F0V-type star at a distance of pc111All physical scales from the literature have been adjusted to match the GAIA distance adopted in this paper. (GAIA data release 1, Gaia Collaboration et al., 2016a, b). Its SED exhibits a strong near-/far-infrared excess, but only modest mid-infrared excess, characteristic for pre-transitional disks. Kraus et al. (2013) resolved at near-infrared wavelengths (NIR, m) a narrow, optically-thick inner disk at 0.15-0.22 au. This inner disk is separated from the outer disk by a gap that was resolved at mid-infrared wavelengths (MIR, m) with Gemini speckle interferometry (38 au=0.120″). Modeling the NIR+MIR visibilities and SED revealed the presence of optically thin, sub-m-sized, carbon-rich dust grains located inside the gap, which might indicate that V1247 Ori is in a particularly early stage of disk clearing (Kraus et al., 2013). Willson et al. (2017) analysed Keck/NIRC2+VLT/NACO aperture masking observations from three epochs and detected a strong asymmetric structure that moves in position angle (PA) from (2012.03), (2012.97), to (2013.81), consistent with Keplerian motion of a companion on an au orbit.
Finally, V1247 Ori was imaged with Subaru/HiCIAO polarimetry (Ohta et al., 2016), which revealed a one-sided spiral arm extending from the inner working angle (0.14″) to ″ in South-East direction. The spiral arm features an exceptionally large azimuthal contrast: the radial peak of the south-eastern arc is about brighter than the north-western disk measured at the same distance from the star.
Here, we present ALMA observations of V1247 Orionis (catalog ) that reveal a ring-shaped inner disk component with a prominent asymmetry and a sharply-confined crescent structure. The observation provide a improvement in angular resolution compared to earlier observations of candidates for dust trapping-vortices. V1247 Orionis also represents the first case where two vortices might have been observed in the same system, near the inner/outer edge of a density gap.
2. Observations
V1247 Ori (catalog ) was observed on 2015-11-16 (120 min), 2015-12-01 (68 min) and 2015-12-05 (134 min) with 47 antennas of ALMA’s 12 m array. The array was configured for the longest baselines offered in Cycle 3 (C36-8/7), with baselines between 82 m and 11.05 km. We observed in ALMA band 7 at frequencies around 320 GHz (870 m) with an aggregate bandwidth of 7.27 GHz. The high-resolution channels covered the 12CO (3-2) and H12CO+ (4-3) line with a velocity resolution of km s-1. The sources J0510+1800 (catalog ) and J0522-3627 (catalog ) were used as bandpass calibrators, J0541-0211 (catalog ) as phase calibrator, and J0541-0541 (catalog ) as flux calibrator.
For our continuum imaging, we excluded all channels that include line emission. The image reconstructions were carried out using CASA version 4.5.1-REL and phase self-calibration. We computed a grid with different reconstruction parameters and weighting schemes and selected the image with the lowest root-mean-square noise, using briggs weighting, robust parameter 0.6, threshold 0.06 mJy, and a 0.45″ mask.
3. Results
3.1. Continuum imaging
The 870 m continuum image (Fig. 1) reveals the following spatial components:
-
(a)
an unresolved, central emission peak near the location of the star,
-
(b)
a ring of emission (radii ) with significant substructure, namely strong excess flux in the south-eastern direction (R1) and weaker excess in the north-western direction (R2),
-
(c)
a crescent-shaped structure (radii ) that extends along PA , but break down into two components (C1, C2), and
-
(d)
extended flux with a Gaussian half-width-at-half-maximum (HWHM) of .
In order we quantify these components we fitted a geometric model consisting of the following components (where denotes the azimuthal angle, counted eastwards of North):
-
(1)
a Uniform Disk with radius and integrated flux that represents the central emission peak.
-
(2)
a ring with inner (outer) radius () and integrated flux . Given the asymmetries evident in the ALMA image (features R1+R2), we give the fitting algorithm the flexibility to add two asymmetric components, whose azimuthal modulations we parameterise as and .
-
(3)
a ring with an azimuthal modulation to fit the crescent structure. The ring is parameterized with radius , Gaussian ring HWHM , and the azimuthal modulation . This component contributes integrated flux.
-
(4)
a disk that represents the extended flux component, contributing to the total flux. The intensity profile is parameterised to connect smoothly with the ring component and drops with a radial power-law exponent inside and outside of the ring:
(1) (2) (3) (4) (5)
All components are projected to mimic inclination effects (with inclination angle and disk minor-axis along PA ) and the model images are convolved with the interferometric beam. We explore the parameter space with a Differential Evolution optimisation algorithm (Storn & Price, 1997) and report best-fit parameters in Table 1.
| Central peak (Significance 2) | |||
|---|---|---|---|
| Central peak, uniform disk radius | [″] | ||
| Central peak, integrated flux | [mJy] | ||
| Ring structure (Significance 27) | |||
| Ring inclination | [∘] | ||
| Ring PA | [∘] | ||
| Ring inner radius | [″] | ||
| Ring outer radius | [″] | ||
| Ring flux | [mJy] | ||
| Ring asymmetry R1, PA | [∘] | ||
| Ring asymmetry R1, amplitude | |||
| Ring asymmetry R1, exponent | |||
| Ring asymmetry R2, PA | [∘] | ||
| Ring asymmetry R2, amplitude | |||
| Ring asymmetry R2, exponent | |||
| Crescent structure (Significance 10) | |||
| Crescent radius | [″] | ||
| Crescent HWHM | [″] | ||
| Crescent flux | [mJy] | ||
| Crescent asymmetry, PA | [∘] | ||
| Crescent asymmetry, amplitude | |||
| Crescent asymmetry, stretch-factor | |||
| Extended structure (Significance 5) | |||
| Extended emission, power-law exponent | |||
| Extended emission flux | [mJy] | ||
Note. — We define inclination as face-on. PAs are measured East of North.
3.2. Line imaging
The ALMA spectrum (Fig. 4, top) exhibits line emission from CO (3-2) and H12CO+ (4-3). Despite the relatively low signal-to-noise, we are able to draw the following basic conclusions:
The CO channel maps and moment maps (Fig. 4, middle-left+bottom) show a rotation profile with the blue-shifted lobe to the North-West and the red-shifted lobe South-East of the star. The CO flux drops off rapidly with increasing separation from the star, reflecting the radial temperature profile in the disk surface layer. Interestingly, we see some excess of CO emission near the location of the crescent structure (C1-C2) and in the south-eastern part of the disk near feature R1 outside of the ring structure.
The H12CO+ channel maps (Fig. 4, middle-right) suggest that the H12CO+-emitting gas also follows the disk rotation. As with CO, we see some excess emission in the south-eastern part of the disk near feature R1.
4. Discussion
4.1. Multi-wavelength constraints on the disk structure
Some of the ALMA features can be directly associated with structures that have been previously resolved with VLTI NIR+MIR long-baseline interferometry (Kraus et al., 2013):
The unresolved central peak seen by ALMA corresponds likely to the optically-thick dust resolved with VLTI/AMBER NIR interferometry at the dust sublimation radius (0.15-0.22 au). The fact that the central peak is unresolved with ALMA confirms that this disk component is very narrow ( au).
The MIR emission (8-13 m) was found to contain contributions from an optically-thick disk at au and emission from optically thin, carbonaceous dust grain located further in (Kraus et al., 2013). The size of this component matches with the ring-shaped emission detected in the ALMA image ( au).
The -band emission (m) was resolved with aperture masking interferometry, where Willson et al. (2017) produced an image that shows of the -band emission arranged in an arc-like structure North of the star. Overlaying the aperture masking and ALMA image (Fig. 1, top-right) shows that the extended -band flux traces likely thermal emission from the northern part of the ALMA ring. In order to emit significantly at such large distances from the stars, these particles likely are quantum-heated by the UV-radiation of the star (Klarmann et al., 2017), which is consistent with the strong PAH features in the spectrum (Kraus et al., 2013) and the fact that the PAH emission is spatially extended (Kraus, 2015).
4.2. The crescent structure and ring asymmetry as dust traps
We considered whether the sub-millimeter crescent might constitute the over-density in a planet-induced spiral arm, or, alternatively, a dust trap.
In order to test the spiral-arm hypothesis, we deproject the ALMA image using the ring inclination/PA and overplot the analytic description of a planet-triggered spiral-arm (Ogilvie & Lubow, 2002), where the free parameters are the separation and PA of the planet and the dimension-less parameter that is proportional to the sound speed. Figure 2 (middle-left) shows that the crescent does not follow the pitch angle of the spiral-arm model and seems to be co-radial, instead. We note that the agreement between the spiral-arm model and the crescent morphology can be improved if the spiral is inclined with respect to the disk plane, as illustrated in Fig. 2 (middle-right + bottom), where we adopted a misalignment angle of . The projection of the inclined spiral provides a better fit to the shape of the crescent, with a lower pitch angle than for a co-planar spiral. Interestingly, this scenario provides also a natural explanation for the brightness drop that is observed along PA (between C1 and C2; Fig. 1). In our inclined-spiral model, the disk plane and spiral plane cross along this PA and the shadow casted by the geometrically-thin, optically-thick inner disk might lower the temperature at this location in the spiral, potentially explaining the observed sub-millimeter brightness drop. The misalignment might suggest that the orbit of the planetary perturber is inclined with respect to the disk plane. Various mechanisms have been identified that could have resulted in such a configuration, including the dynamical interaction with other bodies in the system (such as the inferred body at 5 au) or a warp in the primordial disk that formed the planet.
However, we think that a dust-trapping vortex provides the most likely explanation for the observed co-radial structure of the crescent, its high azimuthal contrast and azimuthal extend. In a dust trap, the particles get trapped in a pressure bump and converge azimuthally towards the pressure maximum (Brauer et al., 2008). This allows them to grow efficiently to millimeter-size, which causes the region to appear prominently at sub-millimeter wavelengths. Several hydrodynamic instabilities have been proposed that could trigger dust-trapping vortices, including the Rossby Wave Instability (Lovelace et al., 1999), the baroclinic instability (Klahr & Bodenheimer, 2003), and the Kelvin-Helmholtz instability (Lithwick, 2007). Interestingly, the Rossby Wave Instability is predicted to trigger the formation of vortices not only at the pressure gradient at the outer edge of a planet-cleared gap, but also near the inner edge (Li et al., 2005). This leads us to suggest that the asymmetry R1 might also represent a vortex that formed at the inner edge of the gap. The observed 30% azimuthal modulation might trace the mm-sized dust population that is superposed on the higher-density population of small grains traced by our earlier MIR interferometry observations (Kraus et al., 2013). The small grains are well-mixed with the gas and would appear as a symmetric ring.
The high resolution offered by our observation enables us to measure the vortex elongation (i.e. the ratio between the radial width and azimuthal extent), which is an important quantity for comparison with theoretical models. We estimate elongations of 3.1 and 5.5 for the “ring” and “crescent” vortex, respectively. Lesur & Papaloizou (2009) predicted a stable regime for vortices with aspect-ratios between 4 and 5.9, although these numbers were computed for the gas and are thus not suitable for direct comparison with our observed values.
4.3. Planet-triggered dust traps and a spiral wake
The key observational diagnostics that we derive for V1247 Ori include a ring-like feature that is separated from an asymmetric disk segment by a gap with a density depletion of at least one order-of-magnitude (likely more if one assumes that the dust grains are larger in the crescent). The crescent (C1+C2) and the ring (R1) appear to be smoothly connected through a spiral-arm-like scattered-light feature (S1). This scattered-light feature coincides with the slight density excess in the gap (“bridge”).
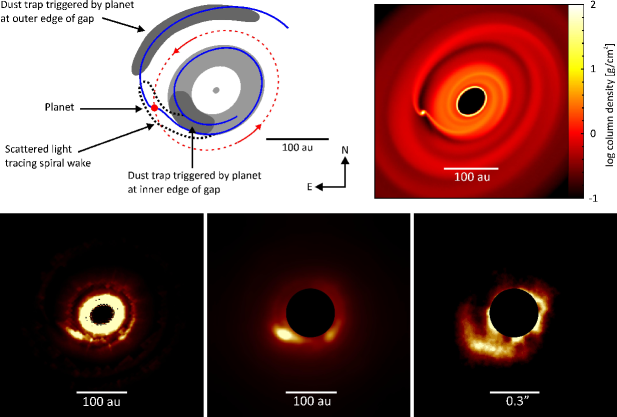
In order to explain these intriguing characteristics, we propose a scenario, where a planet orbits at a separation of au=″ from the star and clears the gap between the ring and the crescent structure (Fig. 3, top-left). The dynamical influence of this planet could trigger dust traps on both edges of the gap, namely in the crescent (C1+C2) and possibly also in the ring (R1). The accretion streamers that feed the planet exhibit an increased vertical scale-height, which manifests in the observed spiral arm seen in scattered light. The small dust grains coupled with the gas in the accretion streamers could cause the local enhancement in dust density that is observed in the “bridge” connecting the ring and crescent. This scenario is consistent with the disk-rotation direction determined by Willson et al. (2017), who determined the 3-dimensional disk orientation by combining information on the rotation direction of the disk (from the CO kinematics) with the direction of motion of an orbiting structure detected at au. They conclude that the northern disk part is facing towards the observer. Adopting this direction of motion (indicated with arrows in Fig. 3), we find that the spiral-arm is tailing, as expected for planet-triggered spiral wakes.
The scale-height increase in the spiral might also be responsible for the 12CO and H12CO+ excess line emission ″ South-East of the star (Sect. 3.2; Fig. 4). For optically-thick lines, like 12CO, the surface brightness is proportional to the gas temperature. In the spiral structure (S1), the increased scale height will allow more efficient heating of the surface layer gas, resulting in the excess line emission from this region.
Besides the aforemention scenario with a planet at au, we also considered an alternative scenario, where a planet orbits at au and clears the region inside the ALMA ring. The planet generates a primary vortex (which dissipates and evolves into the ring observed in the ALMA image) and triggers the formation of a second-generation vortex further out, corresponding to the ALMA crescent. This scenario predicts two distinct spiral arm structures observable in scattered light, namely one spiral arm that is triggered by the crescent structure (imaged by HiCIAO) and one spiral arm triggered by the planet itself (yet undetected, but possibly located inside the ring structure). In this scenario, the planet might already have been detected at 5-6 au with the sparse aperture masking observations by Willson et al. (2017). This scenario has been proposed by van der Marel et al. (2016) to explain the ALMA ring+crescent morphology in HD135344B (catalog ), where indeed two spiral arms have been imaged in scattered light. However, there are significant differences with respect to the relative positions of the scattered light+ALMA features: In HD135344B (catalog ) the ALMA feature (their F1) is cospatial with the end of the spiral arm (their S1), as expected if the spiral density wave is triggered by the vortex itself (van der Marel et al., 2016). This is not the case for V1247 Ori, which is more consistent with the hypothesis that both are directly triggered by a planet.
5. Radiation Hydrodynamics Simulation
We conducted dedicated smooth particle hydrodynamics simulations with the specific parameters of V1247 Ori in order to test whether the scale-height variation of a planet-induced spiral wake could result in the detected scattered-light signature. Our simulation adopts a fixed gas-to-dust ratio and a relatively high viscosity () and is therefore not suited to simulate the vortex formation itself, which will require further dedicated theoretical work. Given the large number of free parameters involved, it is also out of the scope of this paper to model the images quantitatively.
Our simulations were performed using the code by Benz (1990), Bate et al. (1995) and Price & Bate (2007) that was adopted for modelling embedded protoplanets by Ayliffe & Bate (2009, 2010). The disk extends over radii au, with a constant scale height and a surface density , corresponding to a disk mass of 0.013 M☉. Our calculation was performed with a resolution of particles and assuming a 3 MJup planet mass. The planet was placed at au and the disk was allowed to evolve. Snapshots were taken once the simulation reached a quasi-steady state after 10 orbits (at the planet location). We used the Monte-Carlo radiative transfer code TORUS (Harries, 2000) to create synthetic images, where we assume a fixed dust-to-gas ratio of 100, a grain size distribution for , and silicate grain opacities (Draine & Lee, 1984).
The synthetic scattered-light image (Fig. 3, bottom) shows a spiral-arm-like structure that appears most prominently in the inwards-facing spiral arm triggered by the planet. This confirms that a planet-triggered spiral arm should be detectable in polarised light, where the PA and pitch angle matches roughly the ones observed with HiCIAO.
Our simulation predicts a high column density in the vicinity of the planet (Fig. 3, top-right), which opens the possibility that the circumplanetary disk might be detectable in sub-mm continuum emission. This sub-mm flux is not detected, which might indicate that the sub-mm emissivity of the dust in the vicinity of the planet is lower than in other disk structures (e.g. due to dust filtration processes at the edge of the gap, Paardekooper & Mellema, 2006). Sophisticated simulations with decoupled gas+dust populations and grain growth will be required to derive quantitative constraints. Also, the planet emission might be confused with the bright emission from the nearby ring feature R1.
6. Conclusions
Our ALMA imaging of V1247 Ori reveals a crescent structure whose morphology and properties match the predictions of a dust-trapping vortex. The superb 0.04″-resolution of our ALMA image reveals intriguing substructure in the dust trap and provides for the first time the opportunity to confront competing theories of vortex formation with detailed observational evidence.
We propose that the vortex is triggered by a planet orbiting at au, whose spiral wake is seen in scattered light and likely in the detected 12CO and H12CO+ line excess emission. The continuum excess emission observed in the asymmetric ring feature (R1) might constitute a second dust trap that formed near the inner edge of the planet-cleared gap.
The protoplanet itself has not been discovered so far, neither in SPHERE H spectral differential imaging (Willson et al., 2017) nor in our ALMA imaging, possibly due to confusion with the bright ring structure. Further efforts should be taken to achieve a direct detection, for instance with deeper ALMA imaging.
References
- Ayliffe & Bate (2009) Ayliffe, B. A., & Bate, M. R. 2009, MNRAS, 393, 49
- Ayliffe & Bate (2010) —. 2010, MNRAS, 408, 876
- Bate et al. (1995) Bate, M. R., Bonnell, I. A., & Price, N. M. 1995, MNRAS, 277, 362
- Benz (1990) Benz, W. 1990, in Numerical Modelling of Nonlinear Stellar Pulsations Problems and Prospects, ed. J. R. Buchler, 269
- Birnstiel et al. (2013) Birnstiel, T., Dullemond, C. P., & Pinilla, P. 2013, A&A, 550, L8
- Brauer et al. (2008) Brauer, F., Dullemond, C. P., & Henning, T. 2008, A&A, 480, 859
- Dodson-Robinson & Salyk (2011) Dodson-Robinson, S. E., & Salyk, C. 2011, ApJ, 738, 131
- Draine & Lee (1984) Draine, B. T., & Lee, H. M. 1984, ApJ, 285, 89
- Gaia Collaboration et al. (2016a) Gaia Collaboration et al. 2016a, A&A, 595, A2
- Gaia Collaboration et al. (2016b) —. 2016b, A&A, 595, A1
- Harries (2000) Harries, T. J. 2000, MNRAS, 315, 722
- Klahr & Bodenheimer (2003) Klahr, H. H., & Bodenheimer, P. 2003, ApJ, 582, 869
- Klarmann et al. (2017) Klarmann, L., et al. 2017, A&A, 599, A80
- Kraus (2015) Kraus, S. 2015, Ap&SS, 357, 97
- Kraus et al. (2013) Kraus, S., et al. 2013, ApJ, 768, 80
- Lesur & Papaloizou (2009) Lesur, G., & Papaloizou, J. C. B. 2009, A&A, 498, 1
- Li et al. (2005) Li, H., Li, S., Koller, J., Wendroff, B. B., Liska, R., Orban, C. M., Liang, E. P. T., & Lin, D. N. C. 2005, ApJ, 624, 1003
- Lithwick (2007) Lithwick, Y. 2007, ApJ, 670, 789
- Lovelace et al. (1999) Lovelace, R. V. E., Li, H., Colgate, S. A., & Nelson, A. F. 1999, ApJ, 513, 805
- Ogilvie & Lubow (2002) Ogilvie, G. I., & Lubow, S. H. 2002, MNRAS, 330, 950
- Ohta et al. (2016) Ohta, Y., et al. 2016, PASJ, 68, 53
- Paardekooper & Mellema (2006) Paardekooper, S.-J., & Mellema, G. 2006, A&A, 453, 1129
- Pinilla et al. (2012) Pinilla, P., Birnstiel, T., Ricci, L., Dullemond, C. P., Uribe, A. L., Testi, L., & Natta, A. 2012, A&A, 538, A114
- Price & Bate (2007) Price, D. J., & Bate, M. R. 2007, MNRAS, 377, 77
- Regály et al. (2012) Regály, Z., Juhász, A., Sándor, Z., & Dullemond, C. P. 2012, MNRAS, 419, 1701
- Storn & Price (1997) Storn, R., & Price, K. 1997, Journal of Global Optimization, 11, 341
- van der Marel et al. (2016) van der Marel, N., Cazzoletti, P., Pinilla, P., & Garufi, A. 2016, ApJ, 832, 178
- van der Marel et al. (2013) van der Marel, N., et al. 2013, Science, 340, 1199
- Weidenschilling (1977) Weidenschilling, S. J. 1977, Ap&SS, 51, 153
- Willson et al. (2017) Willson, M., Kraus, S., Kluska, J., Monnier, D., Cure, M., Sitko, M., Aarnio, A., Ireland, M., Rizzuto, A., Hone, E., Kreplin, A., Andrews, S., Calvet, N., Espaillat, C., Fukagawa, M., Harries, T.J., Hinkley, S., Kanaan, S., Muto, T., & Wilner, D.J., A&A, 2017 (submitted)
- Zhu et al. (2012) Zhu, Z., Nelson, R. P., Dong, R., Espaillat, C., & Hartmann, L. 2012, ApJ, 755, 6