Evidence for a Sub-Chandrasekhar Mass Type Ia Supernova in the Ursa Minor Dwarf Galaxy
Abstract
A longstanding problem is identifying the elusive progenitors of Type Ia supernovae (SNe Ia), which can roughly be split into Chandraksekhar and sub-Chandrasekhar mass events. An important difference between these two cases is the nucleosynthetic yield, which is altered by the increased neutron excess in Chandrasekhar progenitors due to their pre-explosion simmering and high central density. Based on these arguments, we show that the chemical composition of the most metal-rich star in the Ursa Minor dwarf galaxy, COS 171, is dominated by nucleosynthesis from a low-metallicity, low-mass, sub-Chandrasekhar mass SN Ia. Key diagnostic abundance ratios include Mn/Fe and Ni/Fe, which could not have been produced by a Chandrasekhar-mass SN Ia. Strong deficiencies of Ni/Fe, Cu/Fe and Zn/Fe also suggest the absence of alpha-rich freeze-out nucleosynthesis, favoring low-mass WD progenitor SN Ia, near from comparisons to numerical detonation models. We also compare Mn/Fe and Ni/Fe ratios to the recent yields predicted by Shen et al., finding consistent results. To explain the [Fe/H] at 1.35 dex for COS 171 would require dilution of the SN Ia ejecta with of material, which is expected for a SN remnant expanding into a warm interstellar medium with . In the future, finding more stars with the unique chemical signatures we highlight here will be important for constraining the rate and environments of sub-Chandrasekhar SNe Ia.
Subject headings:
supernovae: general — stars: abundances — galaxies: dwarf — nuclear reactions, nucleosynthesis, abundancesI. Introduction
The low average metallicity of most dwarf galaxies suggests that, like the Milky Way (MW) halo, star formation (SF) was truncated in these systems prior to complete gas consumption, presumably due to gas loss (e.g., Hartwick 1976). Thus, dwarf galaxies offer the potential to study the early phases of chemical enrichment.
In the Type Ia supernova (henceforth SNIa) time-delay picture of chemical evolution (e.g., Matteucci & Brocato 1990; henceforth MB90) dwarf galaxies experience a low specific star formation rate (SFR), resulting in an increased fraction of nucleosynthesis products from SNIa versus core-collapse, Type II, supernovae (henceforth SNII), compared to the MW at any given metallicity. In this scenario MB90 predicted that dwarf galaxies would show low [/Fe] ratios, compared to the MW disk, due to enhanced iron production from SNIa without extra -element synthesis from SNII. These low [/Fe] ratios were subsequently observed (e.g., Shetrone et al. 2001, 2003).
Thus, it appears that dwarf galaxies are enhanced in SNIa ejecta; so, the chemical composition of stars in these systems may be employed as probes of SNIa nucleosynthesis and thereby provide constraints on the SNIa mechanism.
For recent reviews of SNIa scenarios and variants, including nucleosynthesis predictions, see Seitenzahl & Townsley (2017) and Maoz et al. (2014). One long-standing scenario for SNIa involves an explosion following transfer of mass from a companion onto a white dwarf (WD) near the Chandrasekhar mass limit (e.g., Whelan & Iben 1973).
As first noted by Arnett (1971) iron-peak nucleosynthesis depends strongly on the neutron excess 111=(N-Z)/(N+Z) where N and Z are neutron and proton numbers respectively, , during the explosion; in particular, the yields for neutron-rich species like 51V, 55Mn and 58Ni are reduced at low neutron excess values.
Timmes et al. (2003) suggested that a dispersion of SNIa metallicities could be responsible for much of the intrinsic variation in the luminosity of SNIa, due to the dependence of explosively-produced 56Ni on the neutron excess, which changes markedly with metallicity.
Detailed nucleosynthesis calculations for Chandrasekhar-mass SNIa scenarios (e.g., Piro & Bildsten 2008; Chamulak et al. 2008; Martínez-Rodríguez et al. 2016; and Piersanti et al. 2017) showed that for 1,000 years prior to the SNIa explosion low-level carbon burning, or simmering, occurs which increases to a value roughly equivalent to half solar composition. In particular, the Piersanti et al. (2017) calculations show that very low metallicity Chandrasekhar-mass SNIa have a floor in at the time of explosion near =6.710-4; however, at higher metallicity, SNIa show correspondingly larger . Thus, even with the increase due to simmering, SNIa nucleosynthesis yields reflect their original metallicity. However, the basic conclusion from these studies is that all Chandrasekhar-mass SNIa experience pre-explosion simmering with an increase to high .
Thanks to this increased , even quite metal-poor Chandrasekhar-mass WD produce SNIa Mn/Fe and Ni/Fe yield ratios that are not too different from the solar values.
Alternate SNIa scenarios (e.g., Iben & Tutukov 1984; Webbink 1984; Fink et al. 2007) involves detonation following rapid helium accretion, or a violent collision, or merger, of two sub-Chandrasekhar mass WDs, ultimately triggering a detonation in the primary. Importantly, the simmering phase does not occur in these sub-Chandrasekhar mass models, so there can be no increase in beyond that provided by the primordial metallicity, unlike the Chandrasekhar-mass models. Furthermore, according to Seitenzhal et al. (2013) the critical density required to produce 55Mn following normal freeze-out after nuclear statistical equilibrium (NSE) ( g cm-3) is not reached for WD masses below 1.2M⊙, suggesting no Mn production in sub-Chandrasekhar mass models. Contrary to this assertion, however, the 0.88 to 1.15M⊙ sub-Chandrasekhar mass SNIa models of E. Bravo (introduced in Yamaguchi et al. 2015) show a factor of 10 range in both Mn/Fe and Ni/Fe yield ratios, depending on initial mass and metallicity; these results are confirmed in the recent work of Shen et al. (2017).
Notwithstanding these details, low-metallicity sub-Chandrasekhar mass SNIa are expected to produce very low Mn/Fe and Ni/Fe ratios, distinctly lower than the near-solar values expected from Chandrasekhar-mass SNIa. Thus, the Mn/Fe and Ni/Fe yield ratios are intimately related to the SNIa mechanism and may be employed for diagnostic purposes.
While direct measurement of iron-peak element ratios ratios in supernova remnants (e.g. Badenes et al. 2008a; Yamaguchi et al. 2015; Martínez-Rodríguez et al. 2017) provides a way to probe the SNIa mechanism (e.g., Bravo 2013), the important role of SNIa in the chemical evolution of dwarf galaxies suggests that the composition of these systems may also be of use (e.g., North et al. 2013; Kobayashi, Nomoto & Hachisu 2015). We may expect chemical signatures from SNIa to be enhanced in low-metallicity, low-mass, dwarf galaxies, where the chemical enrichment by SNII is truncated and small numbers of SNe could potentially have a significant and measurable effect on chemical composition. Based on progenitor lifetimes, the order of iron-peak nucleosynthesis might reasonably be: SNII, followed by Chandrasekhar mass SNIa, and finally sub-Chandrasekhar mass SNIa. Thus, one might expect that the most metal-rich stars in a dwarf galaxy are more likely to result from a sub-Chandrasekhar mass SNIa phase of chemical enrichment.
This work was motivated by the unusual composition of the most metal-rich star, COS 171, in the Ursa Minor dwarf galaxy (henceforth UMi), as measured by Cohen & Huang (2010; henceforth CH10). We compare the chemical composition of COS 171 to other UMi stars and the Milky Way halo. Accordingly, we identify a chemically normal star, UMi 28104, useful as a standard to isolate the composition of the contamination event that produced COS 171. We confirm the published LTE abundance calculations of CH10 and, when possible, we have applied differential non-LTE corrections. After comparison of our final chemical abundance ratios with predicted yields from a variety of supernova nucleosynthesis scenarios, we conclude that the COS 171 composition resulted from a low-mass, metal-poor, sub-Chandrasekhar mass SNIa event. In a chemical evolution context, this is most easily understood as due to a sub-Chandrasekhar mass SNIa diluted with 104 M⊙ of hydrogen, consistent with expectations for a supernova remnant expanding into a warm interstellar medium.
II. The Chemical Composition of Ursa Minor
The detailed chemical composition of stars in UMi has been investigated by Shetrone, Côte & Sargent (2001), Sadakane et al. (2004), and CH10.
The seminal work of Shetrone et al. (2001) found that the chemical compositions of UMi, Draco and Sextans dSphs are characterized by a large dispersion in [Fe/H], low [/Fe] ratios, low [Y/Fe], and [Ba/Eu] ratios indicating r-process nucleosynthesis. Thus, the UMi chemical composition is distinct from the MW halo.
Sadakane et al. (2004) confirmed the low [/Fe] ratios in UMi, and, for one star near [Fe/H]=1.5, found very strong over-abundances of neutron-capture elements, matching the solar system r-process pattern.
The most extensive detailed chemical composition study of UMi was undertaken by CH10, who examined 10 UMi RGB stars. They found a range in [Fe/H] from 3.10 to 1.35 dex, roughly normal O/Fe, Mg/Fe, and Si/Fe for the most metal-poor UMi stars, but generally declining [/Fe] with increasing metallicity, well below the MW halo trend, particularly for stars above [Fe/H]2. Critically, three of the four most metal-rich UMi stars show [Eu/Fe] above 0.60 dex (but up to 0.87 dex), and all 4 stars above [Fe/H]=1.9 show heavy element ratios consistent with pure r-process composition. In this way, UMi is similar to the r-process dwarf galaxy Reticulum II (Ji et al. 2016), although Ret II has higher [/Fe].
II.1. The Unusual UMi Star COS 171
At [Fe/H]=1.35 dex, the most metal-rich star in the CH10 sample, COS 171, has an extraordinary chemical composition, including: strong deficiencies (exceeding 0.6 dex) of [C/Fe], [Na/Fe], [Sc/Fe], [V/Fe], [Mn/Fe], [Ni/Fe], [Cu/Fe] and [Zn/Fe] ratios, as well as sub-solar ratios, below 0.3 dex, for [Mg/Fe], [Ca/Fe], [Ti/Fe], [Cr/Fe], and [Co/Fe].
In the following discussion of COS 171, we consider only the UMi abundance results of CH10, in order to avoid complications from systematic measurement differences between studies.
Figure 1 shows [X/Fe] versus [Fe/H] in UMi for the sample of stars studied by CH10, with small red crosses, compared to the MW halo, thick and thin disks (black symbols). It is immediately obvious that UMi shows depleted [/Fe] ratios, with a general trend that is qualitatively consistent with the scenario of MB90, in which dwarf galaxies are predicted to show the decline in [/Fe] at lower [Fe/H] than the MW due to a reduced SFR. Since this reduction of [/Fe] is thought to be due to the contribution of iron from SNIa, the UMi stars appear to show an increasing, and relatively large, SNIa/SNII ratio. Notably, the most iron-rich star in UMi, COS 171 (shown as the large filled red circle), exhibits extraordinarily low [/Fe] ratios compared to any MW study.
At closer inspection, Figure 1 shows that, excluding the most metal-poor star in UMi, the [Mg/Fe] ratios in UMi are not as depleted as the [Si/Fe], [Ca/Fe] and [Ti/Fe] ratios; indeed, the [Mg/Fe] ratios appear normal compared to the MW halo (again, except for the most metal-rich UMi star). If [/Fe] deficiencies in dwarf galaxies are supposed to be due to a reduced SFR, as predicted by MB90, resulting from excess SNIa iron at low [Fe/H], then the halo-like [Mg/Fe] in UMi stars is unexpected: naively, all [/Fe] ratios should decline together.
The implied [Mg/Ca] enhancement, near 0.3–0.4 dex, might be explained by an over-representation of massive SNII. Much larger [Mg/Ca] ratios, near 0.95 dex, have been seen in the Hercules dwarf (henceforth Her) by Koch et al. (2008). Because Mg production is made almost exclusively by massive core-collapse, SNII, events with progenitor masses exceeding 30 M⊙ (e.g. Woosley & Weaver 1995), the high [Mg/Ca] ratios in Her indicate enhanced pollution by high-mass SNII events. Koch et al. (2008) suggested that for Her this could result from stochastic sampling of the initial mass function (henceforth IMF) that, by chance, favored massive stars. However, the probability of randomly selecting only massive stars, above 30M⊙, from the IMF diminishes rapidly with the number of samplings. Such a mechanism could only occur if a small number of SNII events (fewer than 11) produced the Her chemical composition. Similarly, the enhanced [Mg/Ca] ratios in UMi may be the signature of stochastic sampling of the SNII IMF in the chemical evolution of this dwarf galaxy.
We note that in Figure 1 the [Mg/Fe] ratio for COS 171 is markedly lower than would be extrapolated from the trend at lower [Fe/H]. Indeed, while the bulk of UMi stars show [Mg/Ca]0.3 dex, for COS 171 [Mg/Ca]=0.0 dex. This suggests some production of Ca in the composition of COS 171.
The iron-peak elements in Figure 2 show generally good agreement with the MW stars, but severe under abundances for the most metal-rich UMi star, COS171. In particular, the odd-numbered elements, Sc, V, Mn, and Cu are neutron rich, so their deficiency suggests a rather low neutron excess, , (or equivalently high electron fraction, ).
It occurs to us that the excessively low [X/Fe] ratios for the 8 elements in COS 171, shown in Figures 1 and 2, might be largely explained by the addition of nearly pure iron to a pre-existing composition. In Figures 3 and 4 we show the UMi [X/H] versus [Fe/H] LTE abundances from CH10; some panels show a 1:1 line. It is clear from these figures that a simple shift to lower [Fe/H] by 0.7 dex would bring the COS 171 [X/H] ratios into approximate consistency with the more metal-poor members of the galaxy, at least for Na, Mg, Sc, Cu, Ni, Zn, Y and Ba.
Figures 3 and 4, suggest that COS 171 resulted from 0.7 dex of Fe added to the pre-existing galaxy composition. Given the COS 171 [Fe/H]=1.35 dex, a pre-existing composition of [Fe/H]2.05 dex is suggested. The CH10 star with metallicity closest to our putative pre-existing composition is UMi 28104, at [Fe/H]=2.08 dex. Because UMi 28104 has a composition similar to the more metal-poor stars in UMi, with abundance ratios fairly typical of dwarf galaxy stars in other systems (e.g., Shetrone et al. 2001), we take the chemical composition of UMi 28104 to indicate that of UMi just prior to the enrichment event that produced COS 171.
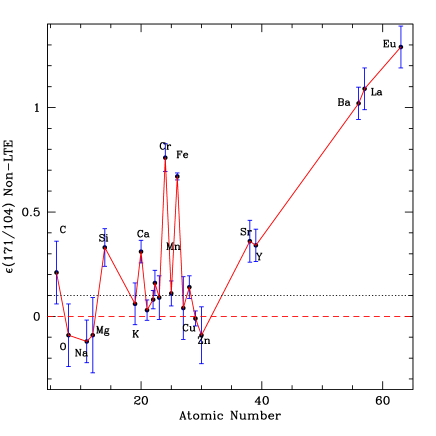
Figure 5 shows the abundance ratios of COS 171 relative to the standard, UMi 28104 (i.e. this is the difference in log abundances); we emphasize that this is not the difference in the number of atoms.
The abundance ratios in Figure 5 not only highlight the enhanced elements in COS 171, but thanks to the similar stellar atmosphere parameters of UMi 28104, taking abundance ratios mitigates a number of systematic measurement errors (e.g., gf values, model atmosphere errors, non-LTE effects, temperature scale errors, etc). While the abundance ratios in Figure 5 are based on the CH10 LTE abundances, the points in the figure have been corrected for differential non-LTE effects, whenever possible (see section II.4).
Error bars in Figure 5 were taken from the abundance dispersions given by CH10, or in the case of oxygen, from the EW uncertainties. The main difference between the ratios presented in Figure 5 compared to the CH10 LTE results is for Mn: with non-LTE corrections the Mn enhancement in COS 171, at 0.11 dex, is less than 1 from zero, whereas the uncorrected CH10 result is 0.38 dex. In Figure 5 the displayed oxygen abundance ratio is not from CH10, but indicates the value found in this work (see section II.3) from the original CH10 spectra. Thus, we find no oxygen enhancement for COS 171 relative to UMi 28104, wheres the original CH10 results suggested a higher oxygen abundance for COS 171 by 0.31 dex.
Figure 5 shows strong enhancements of neutron-capture elements (i.e., elements heavier than zinc), increasing with increasing atomic number, which appears to be due to an r-process enrichment event that affected all UMi stars above [Fe/H]1.9 dex. Since three such r-process rich stars do not share the unusual iron-peak composition of COS 171, we assume that the r-process enrichment event was an unrelated phenomenon.
Excluding the neutron-capture elements, Figure 5 shows clear detection of Si, Ca, Cr and Fe enhancements in COS 171, well above the individual measurement uncertainties. Marginal detections, comparable to the estimated error bars, occur for C, K222Based on our re-analysis of the K abundance for COS 171, Ti, V, Mn, and Ni, while O, Na, Mg, Sc, Co, Cu and Zn show no evidence for enhancement.
II.2. A Check on the LTE Results
As a check on CH10 results, for UMi 28104 and the unusual UMi star COS171 we have employed the CH10 equivalent widths (EWs) and atmosphere parameters to compute element abundances, using the 2014 version of the LTE spectrum synthesis program MOOG (Sneden 1973). Our abundances are in very good agreement with CH10, including the excitation temperatures derived from Fe I lines, thus supporting the unusual composition for COS171 claimed by CH10.
II.3. Oxygen and Potassium Re-analysis
The CH10 abundance of oxygen in COS 171 was based on only two lines: [O I] at 6363Å and O I at 7771Å, with putative EWs of 12.6 mÅ and 8.5 mÅ; for UMi 28104 only the 6363Å line was measured, with an EW of 8.8mÅ. These EWs are strongly affected by noise, given the 1 EW uncertainty of 4mÅ, which explains the large abundance difference derived from the two lines in COS 171.
Curiously, the [O I] line at 6300Å, which has a larger value than the 6363Å line (roughly three times stronger) was not employed by CH10.
In our comparisons of observed and predicted yields from a variety of nucleosynthesis sites, the CH10 oxygen abundance showed significant discordance with abundances of other elements, such as Mg. We therefore elected to re-analyze the original CH10 Keck/HIRES spectra of COS 171 and UMI 28104, which we downloaded from the Keck Archive333https://www2.keck.hawaii.edu/koa/public/koa.php. Reduction to 1-dimensional spectra was performed using the program makee and EWs were measured with the IRAF splot routine.
These spectra show that the 6363Å [O I] and O I 7771Å lines are, indeed, extremely noisy in COS 171 and UMi 28104. The [O I] line at 6300Å has significant EW and should be readily measured; however, in the CH10 UMi spectra this line is blended with a comparable telluric O2 inter-combination (P7) line from the (2-0) –X – electronic vibration-rotation transition. This telluric blend suggests why CH10 did not employ the [O I] 6300Å line. In UMi 28104 the [O I]/O2 blend at 6300Å has a total EW of 42.8mÅ, while for COS 171 the feature has a total EW of 35.8mÅ. We estimated the strength of the blending telluric O2 line from the EW of its spin-doublet, located 0.78Å redward. The two P7 spin-doublet lines have very similar, but not identical, EWs in telluric standard spectra of hot stars, and the redder of the doublet lines is unblended in the UMi stellar spectra. We computed the strength ratio of the O2 line pair from a high S/N spectrum of a telluric standard B star, which then enabled the strength of the O2 contamination of the [O I] 6300Å feature to be computed from the unblended O2 line.
For UMi 28104 the telluric-corrected [O I] 6300Å EW is 21.8mÅ, while for COS 171 the line is weaker, at 12.1 mÅ. Incidentally, these values suggest 6363Å [O I] line EWs of 7 and 4 mÅ, respectively (compared to the CH10 values of 8.8 and 12.6mÅ). Thus, the 6363Å lines are too weak compared to the measurement uncertainty, of 14mÅ, to allow reliable oxygen abundance measurement. For this reason, we rely only on the [O I] line at 6300Å for oxygen abundances in the UMi stars.
Oxygen abundances were computed here from our telluric-corrected EWs for the [O I] 6300Å line, using the spectrum synthesis program MOOG (Sneden 1973), the stellar model atmosphere grid of Kurucz444http://kurucz.harvard.edu/grids and the atmosphere parameters given in CH10. We find [O/H] of 1.616 and 1.712 dex for UMi 28104 and COS 171 respectively, on the meteoritic solar abundance scale of Asplund (2009). Curiously, COS 171 has a lower [O/H], by 0.10 dex, despite its significantly higher [Fe/H], but since this oxygen abundance difference is within the measurement uncertainty of 0.15 dex, the two stars might reasonably have the same oxygen abundance.
We also employed the CH10 spectra to check the measured EW for critical species, including potassium, for which only the K I line at 7699.0Å was used to determine potassium abundances. We measured a K I line EW of 105mÅ for COS 171, significantly smaller than the 130mÅ in CH10; however, we confirmed the CH10 K I line EW for UMi 28104, at 109mÅ. Our K I EW measurement resulted in a decreased potassium abundance for COS 171, at (K)=3.28 dex, which is within 0.01 dex of the value found for UMi 28104. Thus, there appears to have been no measurable potassium production by the progenitor event to COS 171.
II.4. Non-LTE Effects and Abundance Uncertainties
Our use of star UMi 28104 as a comparison to COS 171 both accounts for the pre-existing UMi composition present in COS 171 and eliminates constant systematic effects, such as log gf scales.
| Ion | COS 171 | UMi 28104 | Notes |
|---|---|---|---|
| Na I | 0.00 | 0.02 | 1 |
| Mg I | 0.06 | 0.01 | 2 |
| Si I | 0.02 | 0.02 | 3 |
| K I | 0.30 | 0.37 | 4 |
| Ca I | 0.10 | 0.15 | 5 |
| Sc II | 0.00 | 0.00 | 6 |
| Ti I | 0.24 | 0.39 | 7 |
| Ti II | 0.00 | 0.00 | 8 |
| V I | … | … | 9 |
| Cr I | 0.04: | 0.04: | 10 |
| Mn I | 0.15 | 0.42 | 11 |
| Fe I | 0.05 | 0.11 | 12 |
| Co I | 0.19 | 0.42 | 13 |
| Ni I | 0.00 | 0.00 | 14 |
| Cu I | 0.2: | 0.2: | 15 |
| Zn I | 0.13 | 0.10 | 16 |
Note. — When possible, the non-LTE corrections are taken from the MPIA non-LTE web page (http://nlte.mpia.de/) of Bergemann, which was used for O, Mg, Si, Ti, Mn, Fe and Co. For Na we employed non-LTE web page INSPECT, http://inspect.coolstars19.com/, of Lind. For Ca we used the non-LTE web page of Mashonkina, http://spectrum.inasan.ru/nLTE/. Source references are cited in these web pages, but are not always correct, or may not contain information given by the web page.
1. Average Na I corrections are -0.057 and -0.087 for 171 and 104 if Na D lines included
2. See Bergemann et al. (2016). Also Osorio & Barklem (2016) and Mashonkina (2013)
3. Si corrections in the MPIA web page are not given in the identified reference.
4. Non-LTE corrections for the K I line at 7699Å estimated from Ivanova & Shimanskiĭ 2000
5. Ca non-LTE corrections given by Mashonkina, Sitnova, & Pakhomov (2016)
6. Sc II non-LTE corrections not found, but assumed to be zero or very small.
7. For Ti I source reference is Bergemann (2011); but see also Mashonkina et al. (2016).
8. Ti II non-LTE corrections Mashonkina et al. (2016) are negligibly small.
9. We could not find non-LTE corrections for vanadium.
10.Lawler et al. (2017) found non-LTE corrections for Cr near 0.04 dex in the metal-poor dwarf HD84937. Bergemann & Cescutti (2010) also presented Cr non-LTE corrections for dwarf stars.
11.MPIA web page cite Mn non-LTE corrections from Bergemann & Gehren (2008)
12.MPIA web page cite Fe non-LTE corrections from Bergemann et al. (2012)
13.MPIA web page cited cobalt non-LTE corrections from Bergemann et al. (2010)
14.Wood et al. (2014) found no evidence of non-LTE effect on Ni in the metal-poor dwarf HD84937.
15.Our estimated Cu non-LTE corrections are based on calculations for metal-poor dwarf stars by Yan et al. (2015,2016); see also Shi et al. (2014).
16.Zinc non-LTE corrections estimated from metal-poor dwarf calculations by Takeda et al (2005), who assumed no collisions with hydrogen, SH=0.
One important correction enabled by taking differences between COS 171 and UMi 28014 is that these stars are both metal-poor RGB stars and both likely suffer similar non-LTE effects on the derived LTE abundances. Thus, to first-order the non-LTE effects cancel-out when comparing COS 171 to UMI 28104, but because the latter is more metal-poor, by 0.7 dex, differential non-LTE effects are possible. In particular, non-LTE effects are typically more extreme in more metal-poor stellar atmospheres (e.g. Collet, Asplund & Thévenin 2005; Asplund 2005).
We refer the reader to Asplund (2005) for a review of non-LTE effects in stellar atmospheres, as well as computational aspects, caveats and limitations due to the paucity of known collisional rates.
In order to evaluate the differential non-LTE abundance corrections, and thus compare the abundances here with predicted nucleosynthetic yields, we have searched the literature for non-LTE abundance corrections appropriate for the COS 171 and UMi 28104 atmosphere parameters; this includes the lines used for the abundances of each element. Unfortunately, not all lines of all elements have been investigated, and we could not find non-LTE calculations for vanadium.
Incomplete coverage of stellar atmosphere parameter space is a problem which prevents us from estimating the differential non-LTE abundance corrections between COS 171 and UMi 28104 for some elements; for example, the focus on warm dwarfs in Yan et al. (2015, 2016) prevents reliable differential non-LTE abundance corrections for copper.
In Table 1 we list non-LTE corrections for a variety of species in COS 171 and UMi 28104; when possible, we have preferred results from Bergemann555http://nlte.mpia.de/ and collaborators, because that group’s results include more species than other studies. We make no evaluation of which source of non-LTE corrections is more reliable.
Fortunately, the non-LTE correction differences in Table 1, for most elements are less than 0.10 dex, with the exception of those derived from lines of Ti I, Mn I, and Co I. Since the yield of Mn is sensitive to the neutron excess during explosive nucleosynthesis, it is a useful element for diagnostic purposes; yet, unfortunately, Mn abundances suffer from very large non-LTE corrections.
As Table 1 shows, the Fe I non-LTE abundance corrections for COS 171 are smaller than for UMi 28104, in the same sense as a number of other species; this mitigates, to a small extent, the deviation of the non-LTE corrected [X/Fe I] ratios from the LTE values.
| Species | (X)UMi28104 | (X)Cos171 | ||
|---|---|---|---|---|
| C | 5.97 | … | 6.18 | … |
| O I | 7.07 | 0.0 | 6.98 | 0.0 |
| Na I | 3.84 | 0.02 | 3.70 | 0.00 |
| Mg I | 5.87 | 0.01 | 5.85 | 0.06 |
| Si I | 5.68 | 0.02 | 6.01 | 0.02 |
| K I | 3.29 | 0.37 | 3.65 | 0.30 |
| Ca I | 4.30 | 0.15 | 4.66 | 0.10 |
| Sc II | 0.98 | … | 1.01 | … |
| Ti I | 2.83 | 0.39 | 3.06 | 0.24 |
| Ti II | 3.08 | … | 3.24 | … |
| V I | 1.71 | … | 1.80 | … |
| Cr I | 3.22 | 0.04 | 3.98 | 0.04 |
| Mn I | 2.83 | 0.42 | 3.21 | 0.15 |
| Fe I | 5.37 | 0.11 | 6.10 | 0.05 |
| Co I | 2.94 | 0.42 | 3.21 | 0.19 |
| Ni I | 4.15 | 0.0 | 4.29 | 0.0 |
| Cu I | 1.32 | 0.2 | 1.31 | 0.2 |
| Zn I | 2.22 | 0.10 | 2.16 | 0.13 |
| Sr II | 0.57 | … | 0.93 | … |
| Y II | 0.75 | … | 0.41 | … |
| Ba II | 0.99 | … | 0.03 | … |
| La II | 1.97 | … | 0.88 | … |
| Eu II | 2.31 | … | 1.02 | … |
In Table 2 we present our final adopted LTE abundances and non-LTE corrections for COS 171 and UMi 28104. These constitute the data for comparison with a variety of explosive stellar nucleosynthesis scenarios.
III. Comparison with Nucleosynthesis Predictions
| [C/Fe] | [Si/Fe] | [Ca/Fe] | [V/Fe] | [Cr/Fe] | [Mn/Fe] | [Ni/Fe] | |
|---|---|---|---|---|---|---|---|
| COS 171 (LTE) | 0.90 | 0.15 | 0.28 | 0.81 | 0.31 | 0.92 | 0.56 |
| COS 171 (NLTE) | 0.95 | 0.22 | 0.23 | … | 0.32 | 0.82 | 0.56 |
| SNIa (DDTa)z=0.01 | 3.30 | 0.65 | 0.27 | 0.76 | 0.11 | 0.19 | 0.07 |
| SNII (WW95)z=0.01Z⊙ | |||||||
| 12M⊙ | 0.51 | 0.46 | 0.46 | 1.11 | 0.46 | 0.80 | 0.01 |
| 15M⊙ | 0.34 | 0.14 | 0.13 | 0.69 | 0.17 | 0.60 | 0.06 |
| 20M⊙ | 0.18 | 0.75 | 0.69 | 0.03 | 0.49 | 0.19 | 1.07 |
| SNII (K06)z=0 | |||||||
| 13M⊙ | 0.16 | 0.33 | 0.11 | 0.40 | 0.08 | 0.54 | 0.30 |
| 20M⊙ | 0.07 | 0.48 | 0.40 | 0.42 | 0.35 | 0.31 | 0.79 |
| SNIa (Sub-Ch) | |||||||
| 0.88M⊙ | |||||||
| z=0.00025 | 2.16 | 0.19 | 0.21 | 1.47 | 0.30 | 1.56 | 2.47 |
| z=0.0025 | 2.16 | 0.17 | 0.19 | 0.92 | 0.30 | 0.39 | 1.76 |
| 0.97M⊙ | |||||||
| z=0.00025 | 2.61 | 0.45 | 0.05 | 1.57 | 0.01 | 1.77 | 0.63 |
| z=0.0025 | 2.61 | 0.44 | 0.08 | 1.17 | 0.01 | 0.69 | 0.63 |
| 1.06M⊙ | |||||||
| z=0.00025 | 3.00 | 0.71 | 0.24 | 1.67 | 0.20 | 1.87 | 0.60 |
| z=0.0025 | 3.00 | 0.69 | 0.29 | 1.37 | 0.20 | 0.90 | 0.60 |
| PISN (HW02)z=0 | |||||||
| 242M⊙ | 1.14 | 0.25 | 0.13 | 1.16 | 0.04 | 0.74 | 0.29 |
| 260M⊙ | 1.38 | 0.02 | 0.08 | 1.38 | 0.15 | 0.95 | 0.09 |
| PISN (KYL14)z=0.001 | |||||||
| 250M⊙ | 1.60 | 0.31 | 0.46 | 0.96 | 0.14 | 0.56 | 0.39 |
In this section we compare the chemical composition of COS 171 with predicted nucleosynthesis yields from a variety supernova scenarios. In a first step we simply make a table comparison of the raw LTE and non-LTE corrected COS 171 abundances for a few diagnostic elements. Then for the most promising scenarios, we compare the detailed COS 171 composition to theoretical yields added to the composition of our standard star, UMi 28104, which we have assumed to represent the background composition enriched by the COS 171 progenitor. This has the advantage that zero-point measurement errors common to COS 171 and UMi 28104 cancel-out, giving the smallest measurement uncertainty; however, differential metallicity effects may still be present. Finally, we compare the theoretical yields for sub-Chandrasekhar mass SNIa and Chandrasekhar-mass SNIa deflagration to detonation (DDT) models to the composition of COS 171 with the UMi 28104 background composition subtracted-out. While this gives a direct comparison with predicted yields the uncertainties in the measured abundance differences can be large, especially for elements with small or zero enhancement over the background composition.
All three comparisons favor a sub-Chandrasekhar mass SNIa as the progenitor to the COS 171 composition.
III.1. Comparison of Supernova Yields with the Measured COS 171 Composition
In Table 3 we compare the raw LTE and non-LTE corrected [X/Fe] ratios of a handful of diagnostic elements in COS 171 with predicted element yields for various explosive events.
For core-collapse, SNII, yields we compare with the predictions of Woosley & Weaver (1995; henceforth WW95) and Kobayashi et al. (2006; henceforth K06); for pair instability supernovae (PISN) predictions, at z=0, we compare with the results of Heger & Woosley (2002; henceforth HW02), while for z=0.001 PISN we use the result of Kozyreva, Yoon & Langer (2014). For predicted SNIa yields of various masses and metallicities we consider the Chandrasekhar-mass DDT models of Badenes et al. (2003, 2008b) and Yamaguchi et al. (2015), and the sub-Chandrasekhar mass models (henceforth Bravo models) introduced in Yamaguchi et al. (2015), calculated with a version of the code described in Bravo & Martínez-Pinedo (2012)666The Bravo sub-Chandrasekhar mass SNIa yields are tabulated in Tables 4–7 in Appendix A of this paper.. In particular, we seek predicted yields that could potentially reproduce the unusually low [Mn/Fe], [Ni/Fe] and [/Fe] ratios seen in COS 171, as displayed in Figures 1 and 2.
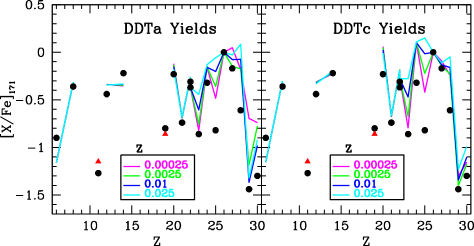
From Table 3 one can immediately see that massive (e.g., 20 M⊙), core-collapse, SNII fail to reproduce the COS 171 composition, because of their expected large -element yields (e.g., Si, Ca); the situation would be worse for more massive SNII, especially for [Mg/Fe] which is over-produced in very massive SNII (e.g. WW95, K06). Table 3 shows that massive SNII also over-produce C, V, Cr, and Mn relative to COS 171.
Low-mass SNII, such as the 12M⊙ and 13M⊙ models of WW95 and K06, respectively, produce low enough -elements to be consistent with COS 171, but they still significantly over-produce carbon, and nickel relative to COS 171. We note that the yields for z=0, 10M⊙, SNII predicted by Heger & Woosley (2010) indicate [Ni/Fe] ratios close to the solar value, well above the measured COS 171 value at 0.56 dex.
For PISN the z=0 HW02 260M⊙ [X/Fe] yields for C, Si, Ca, V, Cr and Mn are fairly close to the low values seen in COS 171, but the predicted [Ni/Fe] ratio is too high by more than 0.5 dex. The 250M⊙ z=0.001 PISN model of Kozyreva et al. (2014) gives a very poor match to COS 171, and in particular cannot explain the low X/Fe values for Si, Ca, Cr, Mn, and possibly Ni.
For the DDTa Chandrasekhar-mass SNIa model Table 3 shows that C/Fe, Si/Fe and Ca/Fe ratios are low enough to fit COS 171, but Cr/Fe, Mn/Fe and Ni/Fe fail significantly.
The Sub-Chandrasekhar models indicate Mn and Ni abundances low enough to match the observed COS 171 Mn/Fe and Ni/Fe ratios for almost all models presented. However, the 1.06M⊙ sub-Chandrasekhar mass models give [X/Fe] suitably low for all diagnostic species listed in Table 3.
III.2. Comparison with Chandrasekhar Mass SNIa
Predicted yields for DDT models added to the UMi 28104 background composition, at two deflagration to detonation transition densities (DDTa and DDTc; e.g., Badenes et al. 2003, 2008b), and a range of metallicities are shown in Figure 6; these give fair agreement with the measured non-LTE corrected COS 171 composition. However, the important neutron-rich elements Mn and Ni are significantly over-produced in these models, well beyond the measurement uncertainties; Cr/Fe is also poorly fit. This disagreement could reasonably be due to the increase in neutron excess during the carbon-burning simmering phase (e.g., Piro & Bildsten 2008). Badenes et al. (2003, 2008b) did not compute Na or K yields, so Figure 6 shows, with red lower limits, the [Na/Fe] and [K/Fe] ratios expected for no production in the COS 171 progenitor; here the final [Na/Fe] and [K/Fe] ratios are due to the UMi 28104 background composition diluted with 0.7 dex of extra Fe.
A range of Chandrasekhar-mass, single degenerate SNIa models, investigated by Dave et al. (2017), permits some comparison with the composition of COS 171. Although Dave et al. (2017) did not publish their yields, their Figures 4 and 7 contains yield information for a few elements. In particular, their Figure 4 allows a comparison of the predicted X/Fe mass fractions for Ni, Mn, and Cr as a function of WD metallicity for all classes of models considered; also, their Figure 7 allows an approximate comparison for their standard deflagration model and their high-density, low C/O ratio, deflagration to detonation model.
Surprisingly, we found that the Dave et al. (2017) Figure 4 Mn/Fe and Cr/Fe mass ratios for the zero-metallicity, high-density, gravitationally confined detonation (z=0, GCD-HIGHDEN) model provides a reasonable match to the measured Mn/Fe and Cr/Fe mass ratios in COS 171. However, the predicted Ni/Fe mass fractions for all models were factors of 12 to 60 greater than measured for COS 171, with the closest match given by the GCD-HIGHDEN model. The STD-DEF and DDT-HIGHDEN-LOWC/CENTRAL models in Dave et al. (2017) compared badly with COS 171, with Mn/Fe and Ni/Fe much larger than observed, by approximately a factor of 10; however, the Cr/Fe was reasonably well matched by these models.
We conclude that none of the single degenerate models match the observed composition of COS 171; in particular, the predicted Mn/Fe and Ni/Fe ratios appear to rule-out this scenario.
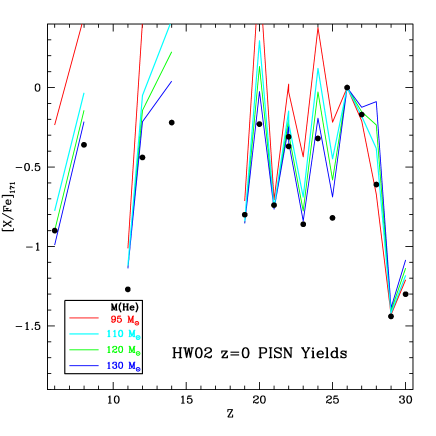
III.3. Comparison with Pair Instability Supernovae Yields
Interestingly, the predicted PISN element yields, added to the UMi 28104 background composition, for the 260M⊙ z=0 star of HW02 come fairly close to fitting the measured non-LTE corrected COS 171 X/Fe ratios for most elements, except for Ni/Fe, which is too high by more than 0.5 dex. Given the comparison in Figure 7, an extrapolation of the PISN yields to slightly higher than their maximum mass might seem to do even better for all elements except Ni. However, HW02 stress that the 260 M⊙ is strictly the highest possible z=0 PISN mass; above this limit pair production is unable to provide sufficient pressure and the object collapses to a black hole.
Furthermore, an improved fit with PISN yields cannot be obtained with non-zero metallicity PISN events, as indicated by the z=0.001 250M⊙ model by Kozyreva et al. (2014), which fails to match the observed Si/Fe, Ca/Fe, Cr/Fe, Mn/Fe and Ni/Fe in COS 171. Thus, currently predicted element yields from PISN events do not fit the composition of COS 171 and we reject this scenario.
III.4. Comparison with Sub-Chandrasekhar Mass SNIa Models
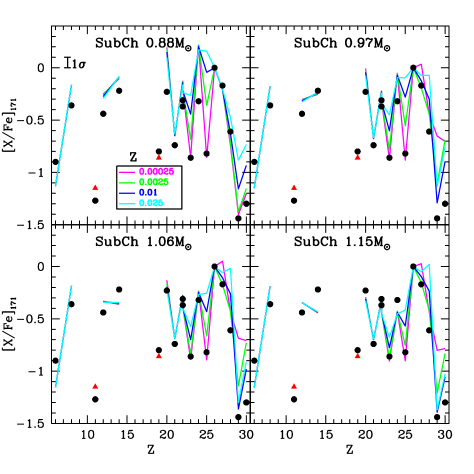
Figure 8 shows excellent overlap between the predicted sub-Chandrasekhar mass SNIa yields added to the UMi 28104 background composition and the observed abundances in COS 171 (corrected for differential non-LTE effects). Critically, there is good overlap for the important [Mn/Fe] and [Ni/Fe] ratios, but also for Sc, Ti, V and Co. In particular, the low [Mn/Fe] and [V/Fe] ratios seen in COS 171 are only reproduced in the lowest metallicity models.
Figure 8 reveals that the Bravo sub-Chandrasekhar mass predictions give decreasing [X/Fe] yields of Si, Ca and Cr with increasing WD mass; conversely, the [Ni/Fe] yield increases with increasing WD mass. These trends suggest that both the WD mass and metallicity may be constrained using the full array of element ratios relative to iron.
The low [Ni/Fe], [Cu/Fe] and [Zn/Fe] ratios in COS 171, while reproduced in the the 0.88 M⊙, z=0.00025, Bravo model, are not well matched with higher WD masses. However, Si is best reproduced in the 0.97 M⊙ models and Ca, Ti, and Cr abundances in COS 171 are best matched by the 1.06 M⊙, z=0.00025, models. Thus, there is some disagreement between the best matching sub-Chandrasekhar WD mass, depending on which elements are considered. While errors in the adopted differential non-LTE corrections to Ca, Ti and Cr LTE abundances might resolve the mass discrepancy, the changes required are at least 0.2 dex and need to work in the same direction, which seems unlikely. Alternatively, an increase in the Fe I non-LTE correction for UMi 28104 by 0.2 dex would reduce the progenitor mass indicated by Ca, Ti and Cr, but this would shift all the solid curves in Figure 8 down, and the implied progenitor mass from Si and Ni abundances would move to even lower values, still out of agreement with Ca, Ti and Cr.
In the Bravo models, Cu and Zn are made in two regions: by alpha-rich freeze-out in the core and also following carbon burning close to the surface, where protons and neutrons are released that subsequently build-up Cu and Zn in a series of (n,), (p,) and (n,p) reactions. Importantly, the alpha-rich freeze-out cannot occur in the 0.88M⊙ model because its maximum temperature is insufficient for complete Si-burning, unlike the more massive WD models (where maximum temperatures are near T6 GK). Furthermore, for the (n,) and (n,p) source of Cu and Zn near the surface, the controlling neutron-excess is determined by the original stellar metallicity in the sub-Chandrasekhar mass models. Therefore, the observed low abundances of Cu and Zn in COS 171 suggests both low-metallicity (z=0.00025) and low WD mass (0.88M⊙).
Direct comparison of the background-subtracted COS 171 element mass ratios with predicted sub-Chandrasekhar mass yields are presented in Figures 9 and 10 for Mn/Fe as a function of Ni/Fe and Si/Fe, respectively. These two figures employ abundance differences, by number, of COS 171 minus UMi 28104, compared to the predictions of Bravo (unpublished). Because these mass ratios are based on true abundance differences, the measurement uncertainties lead to large uncertainties for elements with similar abundances in the two stars; this is despite the small abundance measurement uncertainties, near 0.1 dex, seen in Figure 8.
We estimated the relative abundance difference uncertainties in Figure 9 and 10 arising from scatter in CH10 measurements, including covariances and random excitation temperature errors, and assuming a 0.03 dex loggf scatter. Accordingly, we found 1 uncertainties of 0.070 dex, 0.047 dex, and 0.089 dex for for Mn/Fe, Ni/Fe, and Si/Fe, respectively. Thus, the small total relative abundance uncertainties translate into the substantial mass ratio uncertainties shown in Figures 9 and 10.
In Figure 9 the low Mn/Fe mass ratio indicates a low metallicity for the COS 171 progenitor, within 1 of the lowest metallicity in the Bravo models, at z=0.00025, corresponding to [Fe/H]=1.7 dex. Thus, the COS 171 Mn/Fe mass ratio is consistent with a low metallicity sub-Chandrasekhar mass SNIa, and lies well below any of the DDT model predictions.
The COS 171 Ni/Fe mass ratio in Figure 9 also lies well below the DDT models, and below most of the sub-Chandrasekhar mass model predictions, and indicates a low WD mass between 0.97 and 0.88 M⊙. We note that for lowest WD masses considered by Bravo, the maximum core temperatures are insufficient to drive the alpha-rich freeze-out, which is an important source of Ni, as well as for Cu and Zn. In the Bravo models, the reduced Ni production from the alpha-rich freeze-out is likely the reason why the predicted Ni/Fe ratio declines steeply below 0.97 M⊙ and at low metallicity. However, at high metallicity, there is an increase in Ni/Fe, even for the 0.88 M⊙ models; this is likely due to increased neutron excess for higher metallicity sub-Chandrasekhar mass SNIa.
The importance of the alpha-rich freeze-out in the production of Ni, Cu and Zn leads to a sensitivity of these elements to the WD progenitor mass as well as metallicity; indeed, the measured low Ni/Fe, Cu/Fe and Zn/Fe ratios for COS 171 suggest that the progenitor was likely low-mass, (a linear interpolation suggests 0.95 M⊙) with a reduced or no alpha-rich freezout and very low metallicity. The low metallicity is supported by the measured low Mn/Fe and V/Fe ratios.
Figure 10 also shows that the COS 171 composition lies outside the range of Chandrasekhar-mass SNIa in Table 3. Linear interpolation over Si/Fe for the sub-Chandrasekhar mass models in Figure 10 suggests a mass of 0.94 M⊙, consistent with that indicated by the Ni/Fe ratios. Contrary to the case for Ni/Fe, however, the Si/Fe ratio increases with decreasing WD mass; this is likely due to the relatively low temperatures of the low mass models, resulting in incomplete Si burning and larger amounts of unburnt Si remaining.
We may compare the subtracted COS 171 minus UMi 28104 element mass ratios with the sub-Chandrasekhar mass SNIa mass ratio predictions of Shen et al. (2017), appearing in their figures 8–11. Our subtracted Mn/Fe and Ni/Fe mass ratios for COS 171 lie close to the 0.9 M⊙, z=0, result of Shen et al. (2017) in their Figure 8, but suggest a mass near 0.97 M⊙ in their Figure 9, (both adopt a C/O mass ratio of 50/50). On the other hand, the Shen et al. (2017) predictions for Cr/Fe mass ratios, appearing in their Figure 11, barely overlaps with the measured value for COS 171, but is best matched in their models with a WD mass of 1.1 M⊙. As mentioned previously, Cr/Fe mass ratios predicted by Bravo suggest a match to COS 171 near 1.06 M⊙. Thus, both sets of sub-Chandrasekhar mass models suffer the same differences with our best estimate for the element ratios in COS 171.
We are encouraged by the agreement between Shen et al. (2017) and Bravo predictions for sub-Chandrasekhar mass SNIa element yields of Si, Mn, Fe, and Ni; of particular significance is the implied low sub-Chandrasekhar mass SNIa, which is also supported by the large deficiencies of alpha-rich freeze-out elements Ni, Cu, and Zn.
However, the higher mass WD progenitor indicated from the Ca/Fe, Ti/Fe and Cr/Fe ratios suggest that details of the actual SNIa event differed slightly from the models.
IV. Chemical Evolution of UMi and COS 171
Here we discuss possible chemical evolution scenarios to explain the unusual chemical composition of COS 171 in UMi. As mentioned previously, it is clear that the composition of the slightly more metal-poor stars in UMi were not on the chemical path to COS 171. However, it appears that COS 171 resulted from the addition of iron-peak and r-process material to the composition of UMi stars near [Fe/H]=2 dex, such as UMi 28104.
IV.1. Contamination of an existing star in the proximity of a single SNIa
It is possible that the unusual composition of COS 171, dominated by a sub-Chandrasekhar mass SNIa, may have been due to direct accretion of ejecta from a nearby supernova. In this scenario, COS 171 would have been the outer star in a triple system orbiting a pair of merging low-mass WDs. Assuming an envelope mass for COS 171 of 0.4 M⊙, then at [Fe/H]=1.35 dex, it contains 2.810-5M⊙ of iron, of which 6.310-6M⊙ was due to the pre-existing, [Fe/H]2 dex, material. If 0.5 M⊙ of Fe was produced by the SNIa event, then a fraction of only 4.310-5 of the SNIa iron was captured by COS 171. If COS 171 was a main sequence star at the time of the accretion, with roughly solar radius, and assuming that the accretion radius was equal to the physical radius, then COS 171 must have been separated from the SNIa event by 76 R⊙, roughly 0.4 AU, in order to reach [Fe/H]=1.35 dex. This distance is smaller than the radius of the RGB star phase of the WD progenitors, so seems unlikely.
On the other hand, if COS 171 was an RGB star, of 20R⊙ radius, at the time of accretion then the separation from the SNIa event would have been approximately 7 AU, which is larger than the maximum radius of the AGB phase (roughly 1.5 AU) of the progenitor WDs. These separations seem small considering that merger of two WDs would be required for the SNIa event in an even smaller region, and must also have accommodated the previous RGB and AGB phases for both WD progenitors. Thus, if this mechanism did occur, there may well have been a reduction in the size of the COS 171 orbit prior to the accretion and supernova event. Furthermore, in the RGB accretion scenario the SNIa event must have occurred relatively recently. Given these constraints, we do not favor this scenario.
IV.2. Contamination of a typical molecular cloud by many SNIa
In order to reach the chemical composition of COS 171 by pollution of a giant molecular cloud, near 106 M⊙, ejecta from approximately 100 SNIa are required. The difficulty with such a scenario is that with many SNe one might expect to see an averaging of element yields from other nucleosynthesis events, in particular SNII and Chandrasekhar-mass SNIa, in which case the unusual abundance ratios seen in COS 171 might not be expected. For such a scenario a systematic modulation of the polluting supernova ejecta appears to be necessary in order to obtain the COS 171 composition, dominated by sub-Chandrasekhar mass SNIa ejecta.
To circumvent this problem, one could propose that only sub-Chandrasekhar mass SNIa occurred, during a late phase of chemical enrichment in UMi, perhaps from the last epoch of iron-peak enrichment by the longest-lived progenitors, which led to the SNIa in UMi dominated by the merger of sub-Chandrasekhar mass WD stars.
Evidence for large-scale enrichment by low-metallicity sub-Chandrasekhar mass SNIa in other dwarf galaxies could be construed, qualitatively, from the deficiencies of V, Mn, Co, Ni, Cu and Zn, relative to Fe, in the Sagittarius dwarf galaxy by Hasselquist et al. (2017), Sbordone et al. (2007), and McWilliam et al. (2003), Ni deficiencies in LMC stars found by Van der Swaelmen et al. (2013), and Ni deficiencies in the Fornax dwarf galaxy by Letarte et al. (2010). However, the element deficiencies in these other dwarf galaxies are much less extreme than those seen in COS 171, as if mixing with a range of supernova yields occurred in these systems, unlike COS 171.
Detailed investigation into the less extreme deficiencies, seen elsewhere, is required before they are taken as solid evidence of sub-Chandrasekhar mass SNIa nucleosynthesis; and, they likely require dilution with element yields from other supernova types. Thus, it is possible that sub-Chandrasekhar mass SNIa nucleosynthesis is common among dwarf galaxies, and therefore that a sub-Chandrasekhar mass SNIa dominated phase might have occurred in UMi, but it is not yet proven.
In this pollution scenario, we would expect many other stars sharing the chemical composition of COS 171 to be present in UMi; such objects may yet be found among the lower luminosity UMi stars. Indeed, the frequency of stars in UMi that share the chemical composition of COS 171 would provide strong constraints on the three scenarios outlined here.
IV.3. Contamination of interstellar gas by a single SNIa
One possibility is that the iron-peak composition of COS 171 resulted from pollution of interstellar gas by a single SNIa event. Since individual SNIa events typically yield approximately 0.5 M⊙ of iron, this must be diluted with 9,000 M⊙ of [Fe/H]=2 dex gas, in order to reach the COS 171 metallicity, at [Fe/H]=1.35 dex. This amount of gas dilution corresponds to a relatively low-mass molecular cloud.
Detailed modelling of the evolution of supernova remnants (henceforth SNR), by Chevalier (1974), show that the amount of interstellar material (ISM) swept-up by a SNR depends on many factors, including the energy of the explosion, the density of the ISM, the strength of the local magnetic fields, and cooling from metals and grains.
Equations describing SNR growth, in Chevalier (1974), indicate that at an ISM density of 1.0 cm-3 (characteristic of the warm ISM) the typical SNR shell velocity drops to the dispersion of interstellar clouds at a radius near 44pc, indicating a swept-up mass of 104 M⊙. This is completely consistent with the detailed SNR treatment of Cioffi et al. (1988), also including metal-dependent cooling, which gives a radius of 42pc, again with an implied swept-up mass near 104 M⊙.
A more recent calculation, by Asvarov (2014), is also consistent with these results, and estimated the largest SNR radius of 45pc for a remnant expanding into an ISM with uniform density of 1.0 cm-3, over 4105 yr. A radius of 34pc was found when the magnetic field pressure was increased by a factor of 4. Notably, Asvarov (2014) employed a relatively small critical velocity, at Mac 2.
These predictions are consistent with the distribution of SNR sizes in nearby galaxies, for example as found by Badenes et al. (2010), who found a sharp cut-off at a radius near 30pc, and the largest SNR radii near 60pc.
The formation of molecular clouds out of enriched warm interstellar gas is the subject of on-going research (e.g., see Vázquez-Semadeni et al. 2007); however, it appears that molecular clouds are short-lived objects within an on-going, equilibrium, process of rapid formation by gravitational instability and equally rapid disruption by stellar feedback (e.g., Mac Low, Burkert, & Ibáñez-Mejía 2017).
Given these considerations, it seems reasonable that as UMi ran-out of gas and star formation in the galaxy drew to a close, that a single, stochastic, event might have enriched 104 M⊙ of warm interstellar gas, all or part of which subsequently formed into a star-forming molecular cloud, producing the last few stars in UMi, including COS 171. Such an event might be more likely to result from a long-lived progenitor, delayed from a previous star formation epoch, such as a sub-Chandrasekhar-mass SNIa. Given the requirement for mixing of the SNIa ejecta with 104 M⊙ of hydrogen, in order to produce COS 171, and that this is the natural outcome for a SNR mixing into warm interstellar gas, this is our favored scenario for the origin of COS 171.
V. Summary
We have investigated the highly unusual chemical composition, found by CH10, of star COS 171 in the UMi dwarf galaxy. We confirm the stellar atmosphere parameters and LTE iron and other element abundances found by CH10, based on their published EWs. However, for oxygen abundances we employ the 6300Å [O I] line, from the CH10 spectra, corrected for telluric contamination. We also revise the potassium abundance in COS 171 down by 0.37 dex, based on an EW re-measurement of the somewhat saturated K I line at 7699.0Å in the CH10 spectrum.
The composition of COS 171 is unlike any MW halo star, with uniquely low X/Fe ratios for O, Mg, Si, Ca, Ti, Sc, V, Mn, Ni, Cu and Zn. Abundance ratio plots reveal that this unusual chemical composition seems to result from the addition of 0.7 dex of iron-peak material to a pre-existing composition, near [Fe/H]=2.05 dex. Other UMi stars, slightly more metal-poor than COS 171, do not share the same iron-peak chemical locus, although an r-process enrichment in those stars is also seen in COS 171. The r-process enrichment appears to be disconnected and separate from the iron-peak peculiarity of COS 171.
We adopt star UMi 28104, with [Fe/H]=2.08 dex, as a standard for comparison with COS 171, since UMi 28104 has a metallicity close to our estimate of the pre-existing [Fe/H] prior to COS 171. The similarity of the atmosphere parameters of COS 171 and UMi 28104 also results in a mitigation of systematic measurement errors, from various effects, in a differential comparison of abundance ratios.
Where possible, we have applied non-LTE corrections for the abundance ratios in COS 171 relative to UMi 28104, based on a variety of currently available non-LTE studies. However, no non-LTE corrections were available for vanadium.
An abundance ratio plot, of COS 171 over UMi 28104, shows the 0.7 dex Fe enhancement, and clear enhancements of Si, Ca, Cr in COS 171; mild or zero enhancements of C, Ti, Mn, Ni and Co are present. However, O, Na, Mg, K, Sc, V, Cu and Zn show no evidence of production between UMi 28104 and COS 171.
We have compared the composition of COS 171 with a variety of supernova nucleosynthesis predictions for a range of metallicities: low and high-mass core-collapse SNII; Chandrasekhar-mass SNIa; sub-Chandrasekhar mass SNIa; and pair instability supernovae. We find, in particular, that the Mn/Fe and Ni/Fe abundance ratios in COS 171 can only be reproduced in low-metallicity sub-Chandrasekhar mass SNIa nucleosynthesis. Chandrasekhar-mass SNIa fail to reproduce the low Mn/Fe ratios, due to pre-explosive simmering that increases the neutron excess and the yield of neutron-rich species like Mn. Furthermore, the low Ni/Fe, Cu/Fe and Zn/Fe suggest an absence of alpha-rich freeze-out nucleosynthesis, which indicates a relatively low-mass sub-Chandrasekhar mass SNIa. Our best estimate for the mass of the WD SNIa progenitor to COS 171, based on the predictions of Bravo (unpublished), is 0.94 M⊙.
We conclude that COS 171 shows direct evidence of sub-Chandrasekhar mass SNIa nucleosynthesis.
We find that in order to reproduce the COS 171 metallicity by adding a a single SNIa event into the pre-existing UMi composition (near [Fe/H]=2.05 dex), dilution with approximately 104 M⊙ of hydrogen is required. Detailed calculations show that supernova remnants expanding into a warm interstellar medium, with a density near 1.0 cm-3, must mix with 104 M⊙ for the expansion velocity to reduce to the observed velocity dispersion of interstellar clouds, and could naturally explain the measured [Fe/H] of COS 171.
In our favored scenario for the chemical evolution of UMi and formation of COS 171, as UMi ran-out of gas and star formation in the galaxy drew to a close, a single, stochastic, low-metallicity sub-Chandrasekhar mass SNIa, with WD mass near 0.94 M⊙, enriched roughly 104 M⊙ of warm interstellar gas, all or part of which subsequently formed into a star-forming molecular cloud, resulting in the last few stars in UMi, including COS 171.
A. Sub-Chandrasekhar Mass SNIa Nucleosynthesis Yields
In Tables 4–7 below, we give the element yields for sub-Chandrasekhar mass SNIa from the calculations of Bravo (unpublished), introduced in Yamaguchi et al. (2015), for a range of masses and metallicities.
| Elem./Z | 0.00025 | 0.0025 | 0.01 | 0.025 | 0.075 |
|---|---|---|---|---|---|
| C | 5.164e-03 | 5.167e-03 | 5.170e-03 | 5.148e-03 | 5.028e-03 |
| N | 6.051e-06 | 5.441e-06 | 4.852e-06 | 4.400e-06 | 4.102e-06 |
| O | 1.041e-01 | 1.068e-01 | 1.112e-01 | 1.153e-01 | 1.189e-01 |
| Ne | 3.609e-03 | 3.547e-03 | 3.496e-03 | 3.498e-03 | 3.702e-03 |
| Mg | 3.114e-02 | 2.828e-02 | 2.266e-02 | 1.654e-02 | 9.179e-03 |
| Si | 1.531e-01 | 1.572e-01 | 1.609e-01 | 1.626e-01 | 1.597e-01 |
| S | 9.769e-02 | 9.780e-02 | 9.874e-02 | 9.867e-02 | 8.860e-02 |
| Ar | 2.650e-02 | 2.576e-02 | 2.458e-02 | 2.280e-02 | 1.786e-02 |
| Ca | 3.333e-02 | 3.162e-02 | 2.879e-02 | 2.489e-02 | 1.613e-02 |
| Sc | 8.913e-07 | 9.088e-07 | 9.374e-07 | 1.047e-06 | 2.029e-06 |
| Ti | 4.380e-04 | 4.271e-04 | 3.981e-04 | 3.588e-04 | 2.702e-04 |
| V | 4.140e-06 | 1.441e-05 | 3.769e-05 | 6.605e-05 | 1.105e-04 |
| Cr | 1.188e-02 | 1.173e-02 | 1.122e-02 | 1.043e-02 | 8.422e-03 |
| Mn | 1.184e-04 | 1.751e-03 | 4.293e-03 | 7.216e-03 | 1.207e-02 |
| Fe | 4.128e-01 | 4.090e-01 | 4.057e-01 | 4.060e-01 | 4.201e-01 |
| Co | 9.950e-07 | 4.802e-06 | 3.575e-06 | 7.092e-06 | 8.623e-05 |
| Ni | 8.124e-05 | 4.168e-04 | 1.735e-03 | 4.773e-03 | 1.720e-02 |
| Cu | 8.800e-07 | 1.859e-06 | 1.197e-05 | 3.472e-05 | 8.641e-05 |
| Zn | 8.800e-07 | 7.718e-06 | 5.012e-05 | 1.120e-04 | 9.344e-05 |
| Elem./Z | 0.00025 | 0.0025 | 0.01 | 0.025 | 0.075 |
|---|---|---|---|---|---|
| C | 2.673e-03 | 2.673e-03 | 2.668e-03 | 2.646e-03 | 2.563e-03 |
| N | 5.214e-06 | 4.515e-06 | 3.761e-06 | 3.054e-06 | 2.355e-06 |
| O | 7.320e-02 | 7.532e-02 | 7.791e-02 | 8.045e-02 | 8.264e-02 |
| Ne | 1.414e-03 | 1.387e-03 | 1.365e-03 | 1.364e-03 | 1.463e-03 |
| Mg | 2.044e-02 | 1.830e-02 | 1.425e-02 | 1.003e-02 | 5.308e-03 |
| Si | 1.219e-01 | 1.254e-01 | 1.280e-01 | 1.291e-01 | 1.256e-01 |
| S | 7.818e-02 | 7.822e-02 | 7.912e-02 | 7.907e-02 | 7.123e-02 |
| Ar | 2.118e-02 | 2.055e-02 | 1.980e-02 | 1.852e-02 | 1.490e-02 |
| Ca | 2.635e-02 | 2.484e-02 | 2.293e-02 | 1.999e-02 | 1.331e-02 |
| Sc | 9.746e-07 | 9.997e-07 | 1.007e-06 | 1.061e-06 | 1.495e-06 |
| Ti | 3.605e-04 | 3.592e-04 | 3.375e-04 | 3.037e-04 | 2.307e-04 |
| V | 4.806e-06 | 1.185e-05 | 3.057e-05 | 5.261e-05 | 8.691e-05 |
| Cr | 8.849e-03 | 8.751e-03 | 8.337e-03 | 7.665e-03 | 6.192e-03 |
| Mn | 1.081e-04 | 1.294e-03 | 3.218e-03 | 5.301e-03 | 8.423e-03 |
| Fe | 5.995e-01 | 5.978e-01 | 5.903e-01 | 5.787e-01 | 5.464e-01 |
| Co | 9.889e-04 | 5.310e-05 | 2.814e-04 | 4.666e-04 | 8.119e-04 |
| Ni | 8.199e-03 | 8.242e-03 | 1.442e-02 | 2.923e-02 | 8.383e-02 |
| Cu | 1.015e-04 | 2.195e-05 | 7.503e-06 | 1.934e-05 | 4.863e-05 |
| Zn | 1.846e-04 | 1.921e-04 | 8.754e-05 | 1.471e-04 | 1.906e-04 |
| Elem./Z | 0.00025 | 0.0025 | 0.01 | 0.025 | 0.075 |
|---|---|---|---|---|---|
| C | 1.453e-03 | 1.445e-03 | 1.432e-03 | 1.409e-03 | 1.346e-03 |
| N | 4.559e-06 | 3.716e-06 | 2.895e-06 | 2.281e-06 | 1.678e-06 |
| O | 4.123e-02 | 4.443e-02 | 4.779e-02 | 4.972e-02 | 5.100e-02 |
| Ne | 6.186e-04 | 6.101e-04 | 6.010e-04 | 6.002e-04 | 6.494e-04 |
| Mg | 1.017e-02 | 9.263e-03 | 7.123e-03 | 4.852e-03 | 2.452e-03 |
| Si | 8.820e-02 | 9.143e-02 | 9.410e-02 | 9.432e-02 | 9.004e-02 |
| S | 6.102e-02 | 5.997e-02 | 5.939e-02 | 5.866e-02 | 5.256e-02 |
| Ar | 1.732e-02 | 1.623e-02 | 1.503e-02 | 1.409e-02 | 1.187e-02 |
| Ca | 2.231e-02 | 2.000e-02 | 1.732e-02 | 1.510e-02 | 1.038e-02 |
| Sc | 1.104e-06 | 1.091e-06 | 1.110e-06 | 1.137e-06 | 1.317e-06 |
| Ti | 3.003e-04 | 2.994e-04 | 2.827e-04 | 2.570e-04 | 1.961e-04 |
| V | 4.999e-06 | 9.989e-06 | 2.554e-05 | 4.399e-05 | 7.216e-05 |
| Cr | 7.209e-03 | 7.170e-03 | 6.847e-03 | 6.334e-03 | 5.179e-03 |
| Mn | 1.123e-04 | 1.041e-03 | 2.625e-03 | 4.440e-03 | 8.340e-03 |
| Fe | 7.882e-01 | 7.874e-01 | 7.767e-01 | 7.570e-01 | 6.952e-01 |
| Co | 1.417e-03 | 1.491e-04 | 4.509e-04 | 6.932e-04 | 7.318e-04 |
| Ni | 1.145e-02 | 1.158e-02 | 2.164e-02 | 4.455e-02 | 1.244e-01 |
| Cu | 1.220e-04 | 2.539e-05 | 4.476e-06 | 9.157e-06 | 2.098e-05 |
| Zn | 2.385e-04 | 2.216e-04 | 7.440e-05 | 1.039e-04 | 1.256e-04 |
| Elem./Z | 0.00025 | 0.0025 | 0.01 | 0.025 | 0.075 |
|---|---|---|---|---|---|
| C | 7.354e-04 | 7.340e-04 | 7.319e-04 | 7.233e-04 | 6.917e-04 |
| N | 3.312e-06 | 2.970e-06 | 2.415e-06 | 1.918e-06 | 1.430e-06 |
| O | 2.028e-02 | 2.089e-02 | 2.180e-02 | 2.248e-02 | 2.301e-02 |
| Ne | 2.353e-04 | 2.320e-04 | 2.311e-04 | 2.340e-04 | 2.651e-04 |
| Mg | 4.516e-03 | 3.949e-03 | 2.890e-03 | 1.875e-03 | 9.078e-04 |
| Si | 5.642e-02 | 5.769e-02 | 5.911e-02 | 5.960e-02 | 5.784e-02 |
| S | 3.969e-02 | 3.966e-02 | 3.984e-02 | 3.929e-02 | 3.444e-02 |
| Ar | 1.106e-02 | 1.081e-02 | 1.040e-02 | 9.743e-03 | 7.778e-03 |
| Ca | 1.374e-02 | 1.317e-02 | 1.216e-02 | 1.072e-02 | 7.203e-03 |
| Sc | 1.204e-06 | 1.162e-06 | 1.179e-06 | 1.189e-06 | 1.258e-06 |
| Ti | 2.178e-04 | 2.196e-04 | 2.073e-04 | 1.849e-04 | 1.317e-04 |
| V | 4.644e-06 | 7.757e-06 | 1.984e-05 | 3.393e-05 | 5.454e-05 |
| Cr | 5.163e-03 | 5.171e-03 | 4.959e-03 | 4.579e-03 | 3.930e-03 |
| Mn | 1.021e-04 | 7.557e-04 | 1.957e-03 | 3.313e-03 | 9.813e-03 |
| Fe | 9.726e-01 | 9.718e-01 | 9.570e-01 | 9.280e-01 | 8.413e-01 |
| Co | 1.525e-03 | 2.890e-04 | 6.190e-04 | 8.838e-04 | 6.237e-04 |
| Ni | 1.387e-02 | 1.503e-02 | 2.916e-02 | 6.072e-02 | 1.579e-01 |
| Cu | 1.076e-04 | 2.199e-05 | 2.902e-06 | 4.689e-06 | 8.404e-06 |
| Zn | 2.257e-04 | 1.878e-04 | 5.592e-05 | 6.754e-05 | 7.518e-05 |
References
- Arnett (1971) Arnett, W.D. 1971, ApJ, 166, 153
- Asplund (2005) Asplund, M. 2005, ARA&A, 43, 481
- Asvarov (2014) Asvarov, A.I. 2014, A&A, 561, A70
- Badenes et al. (2003) Badenes, C., Bravo, E., Borkowski, K.J., & Domínguez, I. 2003, ApJ, 593, 583
- Badenes et al. (2008a) Badenes, C., Bravo, E., & Hughes, J.P. 2008a, ApJ, 680, 33
- Badenes et al. (2008b) Badenes, C., Hughes, J.P., Cassam-Chenaï, G., & Bravo. E. 2008b, ApJ, 680, 1149
- Badenes et al. (2010) Badenes, C., Maoz, D., & Draine, B.T. 2010, MNRAS, 407, 1301
- Barklem et al. (2005) Barklem, P.S., Christlieb, N., Beers, T.C., Hill, V., Bessell, M.S. et al. 2005, A&A, 439, 129
- Bergemann & Gehren (2008) Bergemann, M. & Gehren, T. 2008, A&A, 492, 823
- Bergemann & Cescutti (2010) Bergemann, M., & Cescutti, G. 2010, A&A, 522, 9
- Bergemann et al. (2010) Bergemann, M. Pickering, J.C., & Gehren, T. 2010, MNRAS, 401, 1334
- Bergemann (2011) Bergemann, M. 2011, MNRAS, 413, 2184
- Bergemann et al. (2012) Bergemann, M., Lind, K., Collet, R. Magic, Z., & Asplund, M. 2012, MNRAS, 427, 27
- Bergemann et al. (2016) Bergemann, M., Collet, R., Amarsi, A.M., Kovalev, M., Ruchti, G., & Magic, Z. 2016, ApJ, submitted (arXiv:1612.07355)
- Bravo (2013) Bravo, E. 2013, A&A, 550, 24
- Bravo & Martínez-Pinedo (2012) Bravo, E., & Martínez-Pinedo, G. 2012, Phys. Rev. C., 85, 055805
- Chamulak et al. (2008) Chamulak, D.A., Brown, E.F., Timmes, F.X., & Dupczak, K. 2008, ApJ, 677, 170
- Chevalier (1974) Chevalier, R.A. 1974, ApJ, 188, 501
- Cioffi et al. (1988) Cioffi, D.F., McKee, C.F., & Bertschinger, E. 1988, ApJ, 334, 252
- Cohen & Huang (2010) Cohen, J.G. & Huang, W. 2010 , ApJ, 719, 931 (CH10)
- Collet et. al. (2005) Collet, R., Asplund, M. & Thévenin, F. 2005, A&A, 442, 643
- Dave et. al. (2017) Dave, P., Kashyap, R., Fischer, R., Timmes, F., Townsley, D., & Byrohl, C. 2017, ApJ, 841, 58
- Filippenko (1997) Filippenko, A.V. 1997, ARA&A, 35, 309
- Fink et al. (2007) Fink, M., Hillebrandt, W., & Röpke, F.K. 2007, A&A, 476, 1133
- Fulbright (2000) Fulbright, J.P. 2000, AJ, 120, 1841
- Hartwick (1976) Hartwick, F.D.A. 1976, ApJ, 209, 418
- Hasselquist et al. (2017) Hasselquist, S., Shetrone, M., Smith, V., Holtzman, J., McWilliam, A. et al. 2017, ApJ, 845, 162
- Heger & Woosley (2002) Heger, A. & Woosley, S.E., 2002, ApJ, 567, 532 (HW02)
- Heger & Woosley (2010) Heger, A. & Woosley, S.E., 2010, ApJ, 724, 341
- Iben & Tutukov (1984) Iben, I., Jr., & Tutukov, A.V., 1984, ApJS, 54, 335
- Ivanova & Shimanskii (2000) Ivanova, D.V. & Shimanskiĭ, V.V. 2000, Astronomy Reports, 44, 376
- Ji et al. (2016) Ji, A.P., Frebel, A., Simon, J.D., & Chiti, A. 2016, ApJ, 830, 93
- Kobayashi et al. (2006) Kobayashi, C., Umeda, H., Nomoto, K., Tominaga, N., & Ohkubo, T., 2006, ApJ, 653, 1145 (K06)
- Kobayashi et al. (2015) Kobayashi, C., Nomoto, K., & Hachisu, I. 2015, ApJ, 804, L24
- Koch et al. (2008) Koch, A., McWilliam, A., Grebel, E.K., Zucker, D.B., & Belokurov, V. 2008, ApJ, 688, L13
- Kozyreva et al. (2014) Kozyreva, A., Yoon, S.-C., & Langer, N. 2014, A&A, 566, A146 (KYL14)
- Lawler et al. (2017) Lawler, J.E., Sneden, C., Nave, G., Den Hartog, E.A., Emrahoğlu, N., Cowan, J.J. 2017, ApJS, 228, 10
- Letarte et al. (2010) Letarte, B., Hill, V., Tolstoy, E., Jablonka, P., Shetrone, M. et al. 2010, A&A, 523, A17
- Mac Low et al. (2017) Mac Low, M.M., Burkert, A., & Ibáñez-Mejía, J.C. 2017, ApJaccepted, (arXiv:1706.09561)
- Maoz et al. (2014) Maoz, D., Mannucci, F., & Nelemans, G. 2014, ARA&A, 52, 107
- Martínez-Rodrígues et al. (2016) Martínez-Rodríguez, H., Piro, A.L., Schwab, J., & Badenes, C. 2016, ApJ, 825, 57
- Martínez-Rodrígues et al. (2017) Martínez-Rodríguez, H., Badenes, C., Yamaguchi, H., Bravo, E., Timmes, F.X. et al. 2017, ApJ, 843, 35
- Mashonkina (2013) Mashonkina, L. 2013, A&A, 550, 28
- Mashonkina et al. (2016) Mashonkina, L., Sitnova, T., & Pakhomov, Y. 2016, Astronomy Letters, 42, 606
- Matteucci & Brocato (1990) Matteucci, F., & Brocato, E. 1990, ApJ, 365, 539 (MB90)
- McWilliam et al. (2003) McWilliam, A., Rich, R.M., & Smecker-Hane, T.A. 2003, ApJ, 592, L21
- North et al. (2013) North, P., Cescutti, G., Jablonka, P., Hill, V., Shetrone, M. et al. 2013, A&A,541, 45
- Osorio & Barklem (2016) Osorio, Y., & Barklem, P.S. 2016, A&A, 586, 120
- Piersanti et al. (2017) Piersanti, L., Bravo, E., Cristallo, S., Domínguez, I., Straniero, O. et al. 2017, ApJ, 836, L9
- Piro & Bildsten (2008) Piro, A.L., & Bildsten, L. 2008, ApJ, 673, 1009
- Reddy et al. (2006) Reddy, B.E., Lambert, D.L., & Allende Prieto, C. 2006, MNRAS, 367, 1329
- Sadakane et al. (2004) Sadakane, K., Arimoto, N., Ikuta, C., Aoki, W., Jablonka, P., & Tajitsu, A. 2004, PASJ, 56, 1041
- Sbordone et al. (2007) Sbordone, L., Bonifacio, P., Buonanno, R., Marconi, G., Monaco, L., & Zaggia, S., 2007, A&A, 465, 815
- Seitenzhal et al. (2013) Seitenzhal, I.R., Cescutti, G., Röpke, F.K., Ruiter, A.J., & Pakmor, R. 2013, A&A, 559, L5
- Seitenzhal & Townsley (2017) Seitenzhal, I. & Townsley, D. 2017, in “Handbook of Supernovae”, edited by A. Alsabti and P. Murdin, Springer. (arXiv:1704.00415)
- Shen et al. (2017) Shen, K.J., Kasen, D., Miles, B.J., & Townsley, D.M. 2017, ApJ(submitted) arXiv:1706.01898
- Shetrone et al. (2001) Shetrone, M.D., Côté, P., & Sargent, W.L.W. 2001, ApJ, 548, 592
- Shetrone et al. (2003) Shetrone, M.D., Venn, K.A., Tolstoy, E., Primas, F., Hill, V., & Kaufer, A. 2003, AJ, 125, 684
- Shi et al. (2014) Shi, J.R., Gehren, T., Zeng, J.L., Mashonkina, L., & Zhao, G. 2014, ApJ, 782, 80
- Sneden (1973) Sneden, C. 1973, ApJ, 184, 839
- Takeda et al. (2005) Takeda, Y., Hashimoto, O., Taguchi, H., et al. 2005, PASJ, 57, 751
- Thielemann & Arnett (1985) Thielemann, F.-K., & Arnett, W.D. 1985, ApJ, 295, 604
- Timmes et al. (2003) Timmes, F.X., Brown, E.F., & Truran, J.W. 2003, ApJ, 590, L83
- Truran & Arnett (1971) Truran, J.W., & Arnett, W.D. 1971, Astrophys. and Space Sci., 11, 430
- Webbink (1984) Webbink, R.F. 1984, ApJ, 277, 355
- Van der Swaelmen et al. (2013) Van der Swaelmen, M., Hill, V., Primas, F., & Cole, A.A. 2013, A&A, 560, A44
- Vázquez-Semadeni et al. (2007) Vázquez-Semadeni, E., Gómez, G.C., Jappsen, A.K., Ballesteros-Paredes, J., González, R.F. & Klessen, R.S. 2007, ApJ, 657, 870
- Whelan & Iben (1973) Whelan, J., & Iben, I.,Jr. 1973, ApJ, 186, 1007
- Wood et al. (2014) Wood, M.P., Lawler, J.E., Sneden, C., & Cowan, J.J. 2014, ApJS, 211, 20
- Woosley & Weaver (1995) Woosley, S.E., & Weaver, T.A. 1995, ApJS, 101, 181 (WW95)
- Yamaguchi et al. (2015) Yamaguchi, H., Badenes, C., Foster, A.R., Bravo, E., Williams, B.J. et al. 2015, ApJ, 801, L31
- Yan et al. (2015) Yan, H.L., Shi, J.R., & Zhao, G. 2015, ApJ, 802, 36
- Yan et al. (2016) Yan, H.L., Shi, J.R., Nissen, P.E., & Zhao, G. 2016, A&A, 585, 102