An overview of and decays at BESIII††thanks: This article is supported in part by National Natural Science Foundation of China (NSFC) under Contract No. 11565006, 11675184, 11735014
Abstract
The world’s largest sample of 1.31 billion events accumulated at the BESIII detector, provides a unique opportunity to investigate and physics via two body radiative or hadronic decays. For many decay channels the low background data samples are up to three orders of magnitude larger than collected in any previous experiment. Here we review the most significant results on and obtained at BESIII so far. The analyses range from detailed studies of the common decays dynamics, observations of new radiative and Dalitz decays, and search for rare/forbidden decays with sensitivity up to . Finally, prospects of the forthcoming runs at peak for the and physics are discussed.
keywords:
decays, the BESIII detectorpacs:
13.20.-v, 14.40.Be
1 Introduction
More than half a century after [1] and [2, 3] discoveries, the mesons still attract attention of both theory and experiment. As the neutral members of the ground state pseudoscalar nonet, they play an important role in understanding low energy Quantum Chromodynamics (QCD). The main properties of and mesons are firmly established and their main decay modes are fairly well known. Decays of the probe a wide variety of physics issues e.g. mixing, light quark masses and pion-pion scattering. In particular the meson, much heavier than the Goldstone bosons of broken chiral symmetry, plays a special role as predominantly the singlet state arising from the strong axial anomaly. In addition the decays of both mesons are used to search for processes beyond any considered extension of the Standard Model (SM) and to test fundamental discrete symmetries.
The main decays of the meson are hadronic and radiative processes. Alternatively one can divide the decays into two following classes. The first class consists of hadronic decays into three pseudoscalar mesons, such as . Those processes are already included in the lowest order, , of chiral perturbation theory (ChPT) [4]. The second class includes anomalous processes involving odd number of pseudoscalar mesons, such as and . They are driven by the Wess-Zumino-Witten (WZW) term [5, 6] which enters at order [7]. Dynamics of decays remains a subject of extensive studies aiming at precision tests of ChPT in sector (i.e. involving quark). Model-dependent approaches for describing low energy meson interactions, such as Vector Meson Dominance (VMD) [8, 9], and the large number of colors, , extensions of ChPT [10] together with dispersive methods could be extensively tested in decays.
| Decay Mode | () [17] | events |
|---|---|---|
| Decay Mode | Yield | (%) | () | Ref. | Comment |
|---|---|---|---|---|---|
| 6067 91 | 25.3 | [11] | previously 20 events | ||
| 6580 130 | 26.2 | [11] | first measurement | ||
| 1231 98 | 24.8 | [11] | first measurement | ||
| 2015 47 | 8.8 | [11] | previously 235 events | ||
| 864 36 | 24.5 | [12] | first measurement | ||
| 6611 | 5.45 | [13] | first measurement | ||
| 33187 351 | 21.9 | [13] | |||
| 655 68 | 15.9 | [14] | first measurement | ||
| 199 16 | 34.5 | [15] | first measurement | ||
| 84 16 | 7.0 | [15] | first measurement |
The BESIII detector [16], operating at the Beijing Electron Positron Collider (BEPCII), is a general purpose facility designed for -charm physics studies in annihilation with high precision. Since its commissioning in 2008, a series of important results have been achieved, including charmonium decays, light hadron spectroscopy and charm meson decay, with the world’s largest data samples in the -charm region. Due to high production rate of light mesons in the charmonium, e.g., , decays, the BESIII experiment also offers a unique possibility to investigate the light meson decays. Radiative decays and provide clean and efficient sources of mesons for the decay studies. The accompanying radiative photon, with energy of 1.5 GeV/ and 1.4 GeV/ respectively, is well separated from the decay products. An alternative source of the () is the hadronic two-body process of () where is identified via decay could be used to tag () decays where not all decay products are reconstructed.
With two runs in 2009 and in 2012 a total data sample of events [18, 19] was collected at the BESIII detector, the available and events are summarized in Table. 1 from radiative decays of , , and hadronic decays of , .
The review presents a recent progress on decays at the BESIII experiment. Unless specifically mentioned the analyses are based on the full data sample of events. However, some earlier analyses use data from 2009 run only with events. A summary of some branching fractions measured by BESIII and the collected data samples using full data set is presented in Table 2. For the common three body and processes results on the decay distributions are reported. In addition the upper limits at 90% confidence level (C.L.) for rare and forbidden decay modes are presented. Finally the prospects for the analyses based on the events to be collected at BESIII in the near future are discussed.
2 hadronic decays
2.1 and [20]
Decays of the meson into 3 violate isospin symmetry and were first considered to be electromagnetic transitions. However, it turns out the electromagnetic contribution is strongly suppressed [21, 22, 23, 24]. Therefore the decays provide a unique opportunity for a precision determination of quark mass ratio in a strong process [25]. The challenge for the theory is to provide a model independent description of the process based on ChPT, supplemented by general analytic properties of the amplitudes (dispersive methods). This approach keeps the promise to finally resolve long standing discrepancy between the lowest order ChPT prediction for the decay width of of 66 eV [26] and the experimental value of eV [17]. This would conclude several years of efforts put by several theory groups to understand the problem, see e.g. [27, 28, 29, 30, 31, 32, 33, 34, 35]. However, now there is a need for high statistics Dalitz plot distributions of to test and/or constrain the theory predictions.
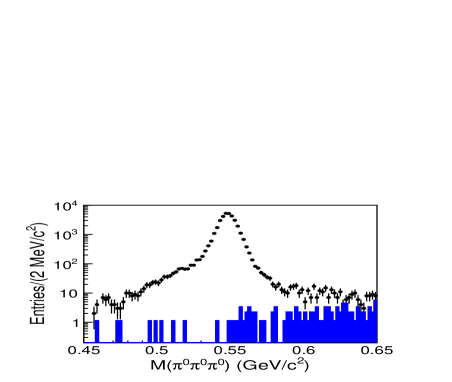
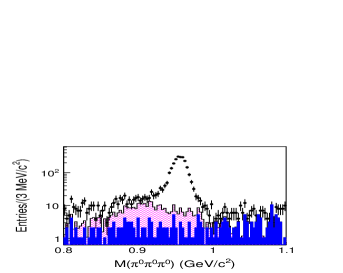
With the radiative decay , a clean sample of candidate events was selected at BESIII. Figure 1(a) shows the invariant mass, with the pronounced peak and % background.

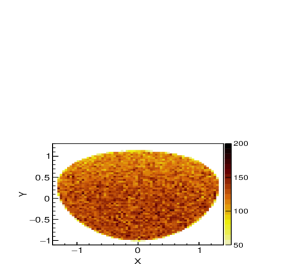
The two Dalitz plot variables are defined as and , where denotes the kinetic energy of a pion in the rest frame and is the excess energy of the reaction. The distributions of and are shown in Figs. 1 (b) and (c). Using the same parameterization as in Ref. [36], the decay amplitude squared is expressed as
| (1) |
where the coefficients are the Dalitz plot parameters. Terms with odd powers of ( and parameters) are included only to test charge conjugation () conservation. An unbinned maximum likelihood fit to data gives the Dalitz plot parameters shown in Table. 3 where they are compared to the results from previous measurements and theoretical calculations. The effect of including and parameters was tested in an alternative fit. The , , and parameters are almost unchanged, while the parameters and are consistent with zero within one standard deviation.
| Theory/Exp. | ||||
|---|---|---|---|---|
| ChPT NLO[27] | ||||
| ChPT NNLO[30] | ||||
| Dispersive Theory[28] | ||||
| Absolute Dispersive[37] | ||||
| UA[38] | ||||
| NREFT[31] | ||||
| Layter[39] | ||||
| CBarrel[40] | ||||
| KLOE08[36] | ||||
| WASA-at-COSY[41] | ||||
| BESIII[20] | ||||
| KLOE16[42] |
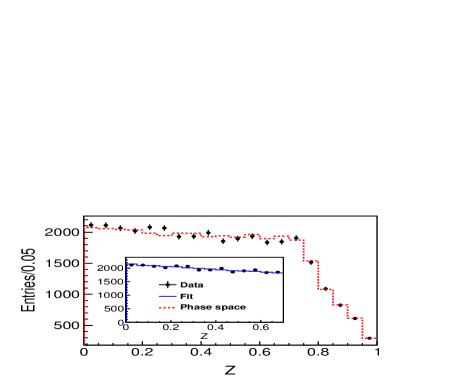
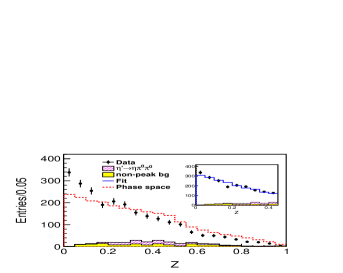
For , the amplitude squared is nearly constant and the deviation can be parameterized in the lowest order using just one variable , where and denotes the kinetic energy of each in the rest frame. The Dalitz plot density distribution could be parameterized using a linear term,
| (2) |
where is the slope parameter.
The mass spectrum is shown in Fig. 2.1(a), with the peak and the background estimated to be less than 1%. The distribution of the variable is displayed in Fig. 2.1(b). Due to the kinematic boundaries and the cusp at the threshold [43, 31], only the interval of is used to extract the slope parameter from the data. In analogy to the measurement an unbinned maximum likelihood fit, as displayed in the inset of Fig. 2.1(b), yields the Dalitz plot slope parameter , which is compatible with the recent results from other experiments.
2.2 [50] and [51]
The combined branching fraction of the two main hadronic decays of : and is nearly . The ratio should be exactly two in the isospin limit. The decays involve both and pions in the final state and therefore allows to extract information about interactions. However, the excess energy of the processes is relatively small: 130 MeV and 140 MeV for and respectively. This means precision high statistics experimental studies of the Dalitz plots together with an appropriate theory framework for extraction of the phase shifts are needed.
The two Dalitz plot variables, and , are usually defined as and , where denote the kinetic energies of the mesons in the rest frame and = .
Two different parametrizations of the Dalitz plot distribution are used. The historically first one assumes a linear amplitude in variable:
| (3) |
the other representation is just a general polynomial expansion:
| (4) |
where, is complex and , , , are real parameters. These two representations are equivalent in case of .
Initial BESIII Dalitz plot analysis [50] was based on 2009 data and the above two representations was used. The extracted parameters are generally consistent with the previous measurements and theoretical predictions. The negative value of parameter indicates, with an uncertainty of 30%, that the two representations may not be equivalent. The most recent BESIII analysis [51] uses nearly background free samples of events and events from . The goal was determination of the Dalitz plot parameters for the two decay modes and a search for the cusp at the threshold in . And the fit results for the above two representations, which are shown in Fig. 3 and Fig. 4, and the corresponding fitted parameters are summarized in Table 5.
For the decay, the results, superseding the previous BESIII measurement [50], are not consistent with the measurement from VES and the theoretical predictions within the framework of chiral effective field theory in combination with a relativistic coupled-channels method (Chiral Unitary Approach – ChUA) [38]. In particular for the cofficient , the discrepancies are about four standard deviations. On the other hand large- ChPT prediction at next-to-next-to-leading order [52] is consistent with the measured value due to the large theoretical uncertainty. For the cofficient violating charge conjugation, the fitted values are consistent with zero within one standard deviation for both representations.
In case of , the results are in general consistent with the previous measurements and theoretical predictions within the uncertainties from both sides. The latest results [55] reported by the A2 experiment are also in agreement with those obtained from BESIII. We notice a discrepancy of 2.6 standard deviations for parameter between and modes. The present results are not precise enough to firmly establish isospin violation and additional effects, e.g., radiative corrections [56] and mass difference should be considered in the future experimental and theoretical studies.
It was also found that the linear representation could not describe data. The discrepancies between data and the fit are evident in the projection for the both decay modes, which is yet another indication that the linear and general representations are not equivalent. In addition, a search for the cusp in performed by inspecting the mass spectrum close to mass threshold, reveals no statistically significant effect. Most recent theoretical dispersive analysis of the cusp in the [57] uses Dalitz plot parameters from VES and 2009 BESIII[50] data. However, the amplitudes from Ref. [57] should be preferably fitted directly to the Dalitz plot data for the two decay modes.
2.3 [20]
The isospin violating decay of was first observed in [58]. In a later experiment the Dalitz plot slope parameter was extracted to be with limited statistics of around 60 events [59], and in 2008 GAMS-4 analysis updated to using events [54]. Using the 2009 data sample BESIII has reported the branching fraction of the decay which is about two times larger than Ref. [58, 59, 54] (average for the three experiments). However, in this first BESIII analysis the Dalitz plot slope parameter was not reported [60].
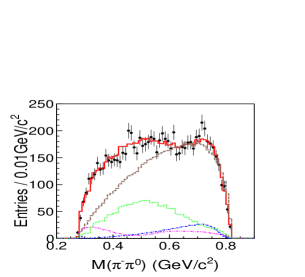
With the full data set a determination of the Dalitz plot slope was possible [20]. The signal is clearly observed in mass spectrum, Fig. 2.3(a), where the hatched and shaded histograms show the background contributions from the inclusive decays and , respectively. As shown in Fig. 2.3(b), a maximum-likelihood fit to the events with in the region of gives the Dalitz plot slope parameter: , much more precise than previous measurements as summarized in Table. 2.3. The value deviates significantly from zero, which implies that final state interactions play an important role. Up to now, there are only few theory predictions to compare the parameter value. One exception are the ChUA calculations of Ref. [38]. The predicted value of the coefficient is in the to range, consistent with the BESIII measurement.
2.4 Amplitude analysis of [11]
At first, the low intensity process may be considered to come from mixing in the dominating decay [61]. This would offer a possibility to determine precisely quark mass difference from the branching fraction ratio of the two processes. However, a recent analysis shows that even at tree level other terms are needed [62]. In addition the decay amplitudes are strongly affected by the intermediate resonances. Therefore the mixing of and quark mass difference cannot be extracted in a simple way.
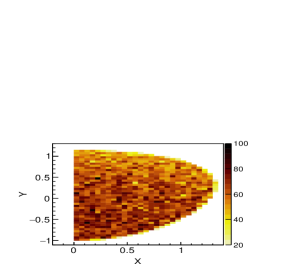
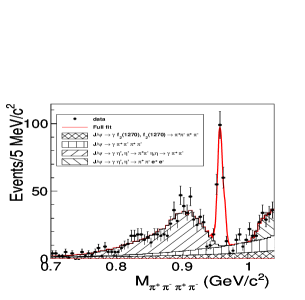
The decay was first observed by the CLEO experiment [63] in 2008. BESIII has reported the branching fraction measurement using 2009 data set [60] but the amplitude analysis was only possible with the full data set. In particular it was expected that contribution of could be identified. This expectation is supported by the experimental distributions shown in the Dalitz plot of versus in Fig. 2.4, where the two clusters corresponding to the contribution are seen.
The common amplitude analysis of the decays and is performed using isobar model. The fit results illustrated by the invariant mass spectra of , and (Fig. 7) show significant -wave contribution from in . The branching fraction is determined to be . In addition to the non-resonant -wave, the resonant - -wave with a pole at MeV, interpreted as the broad meson, plays essential role in the decays. Due to the large interference between non-resonant and resonant -waves, only the sum is used to describe the -wave contribution, and the branching fraction is determined to be .
For , the -wave contribution in two-body rescattering is forbidden by Bose symmetry. The Dalitz plot for is shown in Fig. 2.4 (a) and the amplitude fit is displayed in Fig. 2.4 (b). The corresponding branching fraction is measured to be .
The branching fractions of and are in good agreement with and supersede the previous BESIII measurements [60]. The value for is two times larger than GAMS measurement of [59]. The significant resonant -wave contribution also provides a reasonable explanation for the negative slope parameter of the Dalitz plot [20]. The ratio between the -wave components of the two decay modes, , is determined to be , where the common systematic cancels. With the branching fractions of taken from Particle Data Group (PDG) [17], and are calculated to be and , respectively.
![[Uncaptioned image]](/html/1710.05173/assets/x14.png)
![[Uncaptioned image]](/html/1710.05173/assets/x18.png)
![[Uncaptioned image]](/html/1710.05173/assets/x19.png)
2.5 [15]
In ChPT anomalous hadronic decays are related to WZW pentagon contribution. In the VMD model or intermediate state should provide dominant contribution. Using a combination of ChPT and VMD the branching fractions were calculated to be and [64].
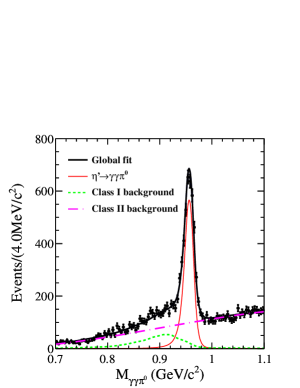
The invariant mass distributions for the BESIII analysis are shown in Figs. 9(a) and (b), respectively, where the peak is clearly seen. The results of background simulations are indicated by the hatched histograms in Figs. 9(a) and (b). None of the background sources produces a peak in the invariant mass spectrum near the mass.
In order to measure the branching fractions, the signal efficiency was estimated using a signal MC sample using two assumptions: the flat phase space and the decay amplitudes from Ref. [64]. For , each of the combinations was divided into 38 bins in the region of [0.28, 0.66] GeV/. With the procedure described above, the number of the events in each bin is obtained by fitting the mass spectrum in this bin, and then the background-subtracted is obtained as shown in Fig. 9 (c) (four entries per event), where the errors are statistical only. The comparison of the experimental distribution and two models is shown in Fig. 9(c). The amplitude of Ref. [64] provides better description of the data than the phase space. Therefore this amplitude is used in the simulation to determine the detection efficiency for decays.
The signal yields are obtained from extended unbinned maximum likelihood fits to the and invariant mass distributions and the statistical significances for and are calculated to be 18 and 5, respectively. The branching fractions of are determined to be and , which are in agreement with the predictions in Ref. [64], but not with an older estimate based on broken- quark model [65].
3 Radiative and Dalitz decays
3.1 (preliminary results)
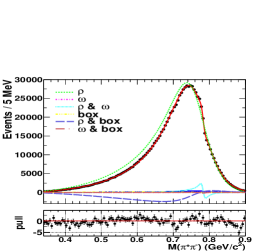
The anomalous process is the second most probable decay of the meson ( % [17]) and frequently used for tagging. In the VMD model the main contribution to the decay comes from [66]. In the past the di-pion mass distribution was studied by several experiments e.g. JADE [67], CELLO [68], PLUTO [69], TASSO [70], TPC/ [71], and ARGUS [72]. A peak shift of about 20 MeV with respect to the expected position from the contribution was consistently observed. Dedicated [73] analysis using 2000 events concluded that contribution is not sufficient to describe the di-pion mass spectrum. This discrepancy could be attributed to the WZW box anomaly contribution which should be included as an extra non resonant term in the decay amplitude. It was suggested that the fits to the shape of the di-pion distribution will allow to determine the ratio of the two contributions [74]. The evidence for the box anomaly with a significance of 4 was reported in 1997 by the Crystal Barrel experiment [75] using a sample of 7490180 events but this observation was not confirmed by the subsequent measurement by the L3 Collaboration [76] using 212353 events. Recently proposed model-independent approach, based on ChPT and a dispersion theory, describes the decay amplitudes as a product of an universal and a reaction specific part [77]. The universal part could be extracted from the pion vector form factor measured precisely in . The reaction specific part was determined experimentally for the decay by WASA-at-COSY [78] and KLOE [79]. It was shown the di-pion distribution for the decay can not be described by the pion vector form factor only. In Ref. [80] it was hypothesized that the reaction specific part could be similar for the and decays.
For BESIII analysis a low background data sample of decays candidates is selected. The distribution of the invariant mass, , is displayed in Fig. 10. The interference is seen for first time in this decay. In the model-dependent approach the data can not be described with Gounaris-Sakurai parameterisation [81] of the and the contributions including the interference. The fit performance gets much better after including the box anomaly, Fig. 10(a), with a statistical significance larger than 37. An alternative fit was performed by replacing the box anomaly with , Fig. 10(b), by fixing its mass the width to the world average values. The fit is slightly worse but it still provides a reasonable description of the data.
Using model-independent approach of Ref. [77] and including mixing the pion vector form factor (where ) and amplitudes for decays are proportional to where is a reaction specific term, , is the Omnes function describing interactions with [82, 80]. For only the linear term GeV-2 [78, 79] is needed. The fit to the BESIII data is shown in Fig. 10(c), it yields GeV-2, GeV-4, with the fit goodness ndf=145/109. The presence of the quadratic term is consistent with recent calculations including intermediate state [83].
3.2 [84]
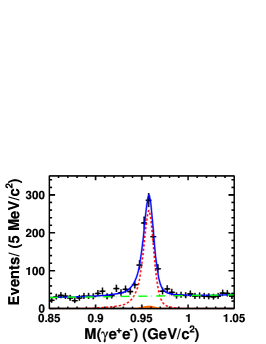
The first observation of the conversion decay was reported in 2009 by the CLEO [63] Collaboration. The decay is directly related to and involves virtual photon, . The conversion process provides a more stringent test of the models. Predictions for the decay are given within VMD model and unitarized ChPT [85, 86, 87]. In the invariant mass () distribution for a conversion decay the contribution of the photon propagator translates to the pole-like dependence close to the lower kinematic boundary of (see also Sec. 3.3). For the decay a dominant contribution in the is also expected. The CLEO measurement based on just signal events was unable to explore these distributions. However, the measured branching fraction [63], is consistent with the predicted value of . The corresponding conversion decay with a pair are suppressed by two orders of magnitude due to cutoff. In the CLEO analysis an upper limit of , at 90% C.L. was set.
The finished BESIII analysis is based only on 2009 data. Figure 3.2 displays the mass spectrum by requiring GeV/, where the background from following the photon conversion in the detector material could be clearly seen. The peak close to corresponds to the signal and the second peak around 0.015 GeV/ comes from the background. For the selected data sample any other background is negligible and the efficiency for the signal is 16.9%. The number of signal events is taken from a fit of the two contributions to the distribution. The corresponding branching fraction of is in good agreement with theoretical predictions and with the CLEO result. The mass spectra of and are consistent with the expected domination in distribution and the peak in the distribution just above 2 threshold with a long tail.
![[Uncaptioned image]](/html/1710.05173/assets/x26.png)
Figure 3.2 shows the invariant mass of , where no signal is observed. The remaining events in the mass region are consistent with the contributions from the background estimated with MC simulations. The upper limit of at the 90% C.L. is set.
![[Uncaptioned image]](/html/1710.05173/assets/x27.png)
3.3 [12]
Dalitz decays of light pseudoscalar mesons, where , , , play an important role in revealing structure of the hadrons and the interaction mechanism between photons and the hadrons [9]. The decay rates can be calculated in Quantum Electrodynamics (QED) where the inner structure of the mesons is encoded by the transition form factor (TFF), , where is the invariant mass of the lepton pair squared. A recent summary and discussion of this subject can be found in Ref. [88].
The knowledge of the TFF is also important in studies of the muon anomalous magnetic moment, , which is one of the most precise low-energy test of the Standard Model and an important probe for new physics. The theoretical uncertainty on the SM calculation of is dominated by hadronic corrections and therefore limited by the accuracy of their determination [89]. In particular, the hadronic light-by-light (HLbL) scattering contribution to includes two meson-photon-photon vertices that can be related to the TFF. Thus, models describing these transitions should be tested to reduce the uncertainty in the SM prediction for .
The conversion decay is closely related to , and in particular the transition form factor could be predicted from the invariant mass distribution of the two pions and the branching ratio of the decay in a model independent way using a dispersive integral [80].
The differential decay width [9] is calculated with,
| (5) |
where represents the QED part for a point-like meson which includes term due to photon propagator. Therefore for conversion decays involving electron-positron pair the distribution peaks at the lowest invariant masses . The TFF can be experimentally determined from the ratio of the measured di-lepton invariant mass spectrum and the term. In the VMD model, it is assumed that interactions between virtual photon and hadrons are described by a superposition of neutral vector meson states [8, 90]. The dominant contribution is expected to come from meson and the form factor could be described by:
| (6) |
where is a factor ensuring that and , where , is the mass and width of the meson respectively. In the case of the , the mass of the pole lies within the kinematic boundaries of the decay an therefore the term cannot be neglected. A parameter often extracted experimentally is the slope of the form factor, , defined as
| (7) |
Before the BESIII result, only the process has been observed with the TFF slope measured to be GeV-2 [9, 91]. In the VMD model, [87] to be compared to 1.8% if the TFF is set to one. The TFF slope is expected to be GeV-2 [92, 93] in the VMD model, while in ChPT it is GeV-2 [94]. A recent calculation based on a dispersion integral gives GeV-2 [80].
In the BESIII experiment the largest background comes from QED processes and decays. For these channels, the combination of the with any final-state photon produces a smooth ) distribution. The primary peaking background comes from the decay followed by a conversion in the material in front of the main drift chamber. The distance from the reconstructed vertex point of the electron-positron pair to the axis is used to reduce the background down to events. The resulting distribution after the selection criteria is shown in Fig. 13(a) and exhibits a clear peak at the mass. A fit is performed to determine the signal yield with the signal shape represented by the MC. The non-peaking background is described by a first-order Chebychev polynomial. The fraction of the peaking background is fixed from the simulation. The signal yield and the detection efficiency is summarized in Table 2. The decay from the same data set is used for normalization and the result is quoted in terms of the ratio . Using the branching fraction of in PDG [17], we obtain the first measurement of the branching fraction reported in Table 2.
The TFF is extracted from the bin-by-bin efficiency corrected signal yields for eight bins for GeV/c2. The bin widths of 0.1 GeV are used and are much wider than the resolution (56 MeV depending on ). The signal yield in each bin is obtained by repeating the fits to the mass distributions.
The result for is obtained by dividing the acceptance corrected yields by the integrated QED prediction in each bin and it is shown in Figs. 13 (b) and (c). The parameters from the fit of the TFF to the parametrization of Eq. 6 are GeV and GeV. The single pole parameterization provides a good description of data as shown in Fig. 13 (b). The corresponding value of the slope parameter is GeV-2, in agreement with the result from [9]. The slope agrees also within errors with the VMD model predictions and the uncertainty matches the best determination in the space-like region from the CELLO collaboration GeV-2 [95].
3.4 [13]
The decay [84] is dominated by , in agreement with theoretical predictions [85, 86]. The corresponding decay was not observed before BESIII measurements. Theoretical models [85, 96] predict the branching fraction to be around .
A parallel analysis of and decays allows to reduce the impact of systematic errors for the ratio of the branching fractions. For decay, candidate events with four well-reconstructed charged tracks and at least three photons are selected. The external conversion background from is removed by requiring the distance of the vertex from the axis to be less than 2 cm (according to simulation only background events will survive the cut). In the selected data sample both the peak in and the peak in is clearly seen in the scatter plot shown in Fig. 3.4(a). The best identification of the process is achieved in the distribution. This distribution is used in a fit to extract the signal yields as indicated in Fig. 3.4(b). The decay of is observed with a statistical significance of 8, and its branching fraction is measured to be , consistent with theoretical predictions [85, 96].
![[Uncaptioned image]](/html/1710.05173/assets/x31.png)
3.5 [14]
The decay should be dominated by the sequential process . The interesting question is to determine a non-resonant contribution to the decay. At present there is only a preliminary theoretical analysis which uses combination of the linear sigma model and VMD. The prediction for branching fraction of is [97, 98]. This is quite puzzling result giving two times larger value than the sequence. The first observation of is reported by the BESIII experiment. Fig. 15(a) shows the invariant mass spectrum, where the clear peak is observed. By assuming that the inclusive decay can be attributed to the vector mesons and and the non-resonant contribution, a unbinned maximum likelihood fit to the invariant mass [Fig. 15 (b)] is performed to determine the signal yields for the non-resonant decay using the signal events with MeV/c2. In the fit, the - interference is considered, but possible interference between the () and the non-resonant process is neglected.
The branching fraction of the inclusive decay is measured to be , which is much lower than the theoretical predictions [97, 98]. In addition, the branching fraction for the non-resonant decay is determined to be = , which agrees with the upper limit measured by the GAMS-2000 experiment [59]. As a validation of the fit, the product branching fraction with the omega intermediate state involved is obtained to be = , which is consistent with the PDG value [17]. Hopefully this first result will trigger new theory analyses of the decay. In particular a combined analysis of this decay with might provide more details about role of isoscalar mesons and isospin violating processes to the transition form factor.
4 Rare decays
4.1 Invisible decays [99]
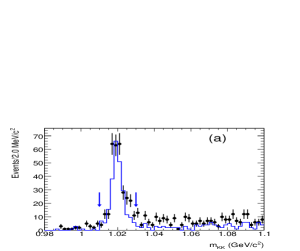
Studies of , decays where one or more products escape detection is a sensitive probe for new light particles beyond the SM. A two-body hadronic decay is well suited to tag production of mesons since the presence of undetected particles could be established by missing four-momentum. The meson is reconstructed efficiently and with good resolution from the decay. The method was first applied for searches of the invisible decays of (i.e. where none of the decay products is observed) at BESII experiment in 2005 [100].
At BESIII the search for the invisible decays of and was repeated using 2009 data set i.e. with the statistics of four times larger than BESII. The event selection requires exactly two tracks with opposite charges, identified as kaons. Figure 4.1(a) shows invariant mass of the kaons, , with a clear peak, while no evident or signal is observed in the mass spectrum for the recoil system as shown in Fig. 4.1(b). To reduce the systematic uncertainty, the decay is also identified in , and the ratios of to are determined. Using the world averages [17] for the two photon branching fractions of and , the following 90% C.L. upper limits are obtained and .
4.2 [101]
Within the framework of the chiral perturbation theory, the upper bound of the branching fraction is predicted to be . After considering scalar or vector type interaction, the branching fraction of was estimated to be [102, 103], which is a few orders of magnitudes higher than that in the SM. Therefore, searches for the and at the branching fractions level of and below will provide information on the new physics beyond the SM.
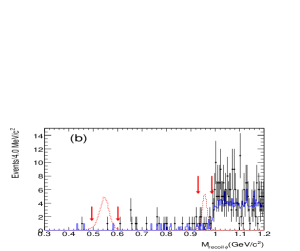
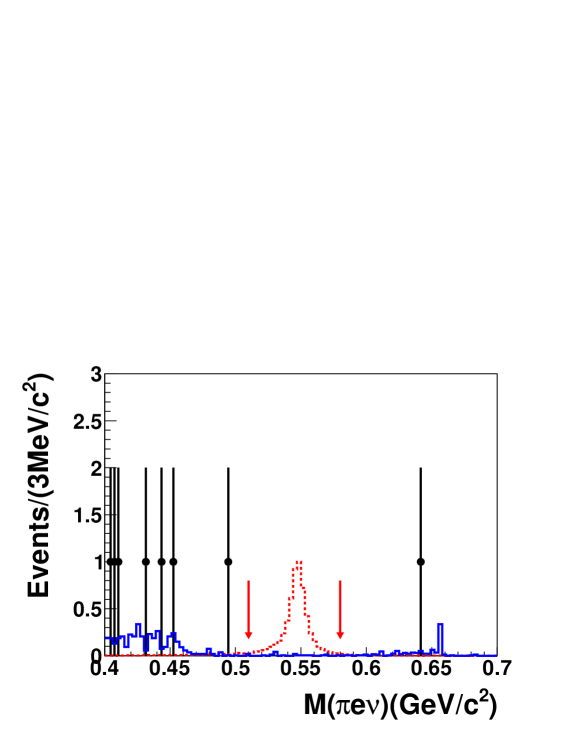
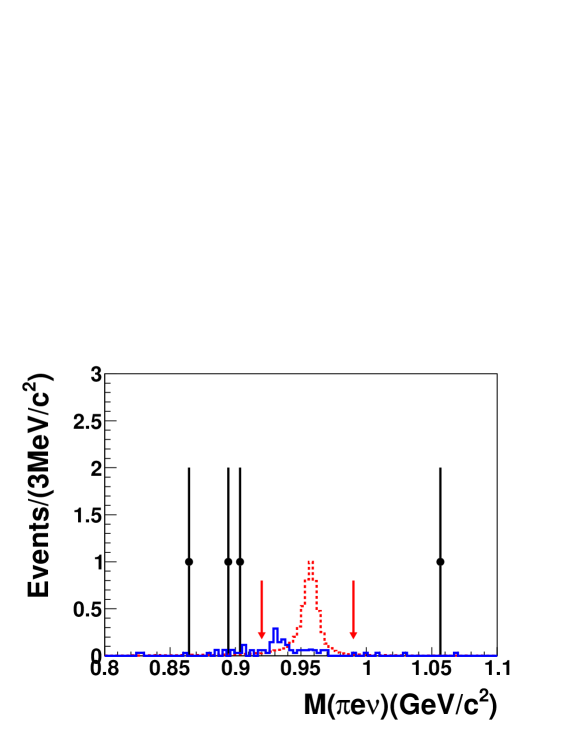
At BESIII the searches for the decays of and were performed using and with the meson reconstructed using decay. No signals are observed in the mass spectrum shown in Fig. 4.2 for either or , and upper limits at the 90% C.L. are determined to be and for the ratios and , respectively. Using the known values of and , the 90% C.L. upper limits for the semileptonic decay rates are and .
4.3 [104]
In the SM, these processes can proceed via the weak interaction with a branching fraction of order according to Ref. [105]. Higher branching fractions are possible either by introducing a violating term in the QCD lagrangian (a branching fraction up to can be obtained in this scheme) or allowing violation in the extended Higgs sector (with up to ), as described in Ref. [105]. The detection of these decays at any level accessible today would signal and violations from new sources, beyond any considered extension of the SM.
In BESIII analysis of the 2009 data set, the and violating decays of and were searched in radiative decays. The mass spectra of and are shown in Fig. 4.3 and Fig. 4.3, respectively. No significant or signal is observed. Using the Bayesian method, the 90% C.L. upper limits are determined to be , , and .
![[Uncaptioned image]](/html/1710.05173/assets/x40.png)
![[Uncaptioned image]](/html/1710.05173/assets/x41.png)
![[Uncaptioned image]](/html/1710.05173/assets/x42.png)
![[Uncaptioned image]](/html/1710.05173/assets/x43.png)
4.4 [106]
Non-leptonic weak decays are valuable tools for exploring physics beyond the SM. Among the non-leptonic decays, the decay is of special interest due to the long-standing problem of the rule in weak non-leptonic interactions. The branching fraction of decay is predicted to be of the order of or higher [107], with a large long-range hadronic contribution expected.
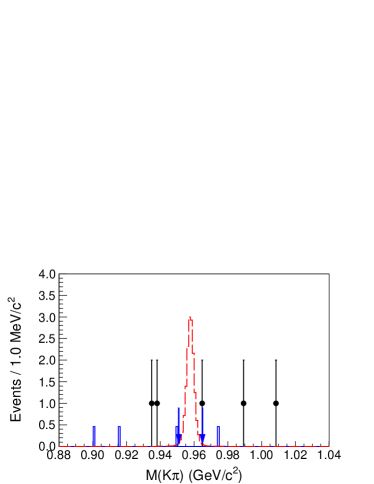
A search for the non-leptonic weak decay is performed for the first time through the decay, while no evidence for is seen in the mass spectrum (Fig. 4.4). Thus the 90% C.L. upper limit on of is reported.
5 Summary
decays provide a clean source of for the decay studies. Based on the world largest sample of events, the recent results on decays achieved at the BESIII experiment are presented. In addition to the improved accuracy on the branching fractions of , observation of new decay modes, including , , and , were reported for the first time. Precision of distribution from BESIII with clear interference is comparable to the data and allows to compare these two reactions in both model dependent and model independent way. In particular a competitive extraction of branching fraction is possible. It is found that an extra contribution is necessary to describe data besides the contributions from and .
Despite the impressive progress, many decays are still to be observed and explored. The BESIII detector will collect a sample of events in the near future, which offers great prospects for research in physics with unprecedented precision.
A list of the specific decay channels where important impact of the new data is expected includes:
-
•
Larger data samples of and decays from BESIII experiment are needed to provide independent check of the analyses carried out at other experiments. The Dalitz plot distributions will be made available for the direct fits to theory. In particular data from the planned run will allow to collect approximately events of with negligible background. In addition one could probably also use other decay modes as sources of mesons. Some possible examples are () and ().
-
•
For and decays the analysis could be extended not only by using the new data but also by reconstructing the final states with three pion decay modes of in addition to . The increased statistics would allow e.g. to search for the cusp in and provide further information about scattering [57]. In addition the use of the same final state topology and will enable to determine ratio of the two decay modes with low systematic uncertainty.
-
•
For and larger statistics is crucial to carry out amplitude analysis of the processes. At present it is impossible to differentiate between and waves. A detailed understanding of this process dynamics is a prerequisite for a program of light quark masses determination from comparison to the processes, a method which do not rely on the full decay width value. Several theory groups has expressed interest in description of the decay within dispersive approach. The overall goal is understanding of all parity even processes of and .
-
•
Hadronic parity odd processes , offers a window to study double off shell transition form factor of . The ultimate goal would be to carry out amplitude analysis of the reactions. The new data with expected about 1200 events would allow for a first stage of such analysis. However, the collected data on these decays together with decay will already provide unique constraints and checks for the models of the double off shell transition form factor. In addition, since the predicted branching fraction for the related process is about , the decay likely will be observed with the new data. The branching fraction value of this decay is sensitive to the transition form factor.
-
•
For decay much progress is expected. A combined analysis of 2012 and the new run data will allow for a sample close to events. In particular a symmetry test by measurement of asymmetry between the lepton and the pion decay planes [108, 109] as well as studies of the and distributions would be possible.
-
•
Among the discussed in this review very rare decays of the largest impact of the new data is expected for invisible decays, and where no background was observed. Therefore the sensitivity should scale with luminosity. In addition the results for the first two decay modes are based on the 2009 data set only.
Both and decays are important tools for studies of strong interactions in non-perturbative region and for determination of some SM parameters. In addition they provide an indirect way to probe physics beyond the standard model. In particular the pursued at BESIII and decay program, where the data collected at are used for wealth of other studies, represents smart and resource efficient research strategy.
References
- [1] A. Pevsner et al., Phys. Rev. Lett. 7, 421 (1961).
- [2] G. R. Kalbfleisch et al., Phys. Rev. Lett. 12, 527 (1964).
- [3] M. Goldberg et al., Phys. Rev. Lett. 12, 546 (1964).
- [4] J. Gasser and H. Leutwyler, Annals Phys. 158, 142 (1984).
- [5] J. Wess and B. Zumino, Phys. Lett. 37B, 95 (1971).
- [6] E. Witten, Nucl. Phys. B223, 422 (1983).
- [7] J. Bijnens, A. Bramon and F. Cornet, Z. Phys. C46, 599 (1990).
- [8] J. J. Sakurai, Annals Phys. 11, 1 (1960).
- [9] L. G. Landsberg, Phys. Rept. 128, 301 (1985).
- [10] R. Kaiser and H. Leutwyler, Eur. Phys. J. C17, 623 (2000).
- [11] M. Ablikim et al. (BESIII), Phys. Rev. Lett. 118, 012001 (2017).
- [12] M. Ablikim et al. (BESIII), Phys. Rev. D92, 012001 (2015).
- [13] M. Ablikim et al. (BESIII), Phys. Rev. D92, 051101 (2015).
- [14] M. Ablikim et al. (BESIII), Phys. Rev. D96, 012005 (2017).
- [15] M. Ablikim et al. (BESIII), Phys. Rev. Lett. 112, 251801 (2014), [Addendum: Phys. Rev. Lett.113,039903(2014)].
- [16] M. Ablikim et al. (BESIII), Nucl. Instrum. Meth. A614, 345 (2010).
- [17] C. Patrignani et al. (Particle Data Group), Chin. Phys. C40, 100001 (2016).
- [18] M. Ablikim et al. (BESIII), Chin. Phys. C36, 915 (2012).
- [19] M. Ablikim et al. (BESIII), Chin. Phys. C41, 013001 (2017).
- [20] M. Ablikim et al. (BESIII), Phys. Rev. D92, 012014 (2015).
- [21] D. G. Sutherland, Phys. Lett. 23, 384 (1966).
- [22] J. S. Bell and D. G. Sutherland, Nucl. Phys. B4, 315 (1968).
- [23] R. Baur, J. Kambor and D. Wyler, Nucl. Phys. B460, 127 (1996).
- [24] C. Ditsche, B. Kubis and U.-G. Meissner, Eur. Phys. J. C60, 83 (2009).
- [25] H. Leutwyler, Phys. Lett. B378, 313 (1996).
- [26] H. Osborn and D. J. Wallace, Nucl. Phys. B20, 23 (1970).
- [27] J. Gasser and H. Leutwyler, Nucl. Phys. B250, 539 (1985).
- [28] J. Kambor, C. Wiesendanger and D. Wyler, Nucl. Phys. B465, 215 (1996).
- [29] A. V. Anisovich and H. Leutwyler, Phys. Lett. B375, 335 (1996).
- [30] J. Bijnens and K. Ghorbani, JHEP 11, 030 (2007).
- [31] S. P. Schneider, B. Kubis and C. Ditsche, JHEP 02, 028 (2011).
- [32] K. Kampf, M. Knecht, J. Novotny and M. Zdrahal, Phys. Rev. D84, 114015 (2011).
- [33] G. Colangelo, S. Lanz, H. Leutwyler and E. Passemar, PoS EPS-HEP2011, 304 (2011).
- [34] G. Colangelo, S. Lanz, H. Leutwyler and E. Passemar, Phys. Rev. Lett. 118, 022001 (2017).
- [35] P. Guo et al., Phys. Rev. D92, 054016 (2015).
- [36] F. Ambrosino et al. (KLOE), JHEP 05, 006 (2008).
- [37] J. Bijnens and J. Gasser, Phys. Scripta T99, 34 (2002).
- [38] B. Borasoy and R. Nissler, Eur. Phys. J. A26, 383 (2005).
- [39] J. G. Layter et al., Phys. Rev. D7, 2565 (1973).
- [40] A. Abele et al. (Crystal Barrel), Phys. Lett. B417, 197 (1998).
- [41] P. Adlarson et al. (WASA-at-COSY), Phys. Rev. C90, 045207 (2014).
- [42] A. Anastasi et al. (KLOE-2), JHEP 05, 019 (2016).
- [43] C. O. Gullstrom, A. Kupsc and A. Rusetsky, Phys. Rev. C79, 028201 (2009).
- [44] F. Ambrosino et al. (KLOE), Phys. Lett. B694, 16 (2011).
- [45] C. Adolph et al. (WASA-at-COSY), Phys. Lett. B677, 24 (2009).
- [46] S. Prakhov et al. (Crystal Ball at MAMI, A2), Phys. Rev. C79, 035204 (2009).
- [47] M. N. Achasov et al., JETP Lett. 73, 451 (2001), [Pisma Zh. Eksp. Teor. Fiz.73,511(2001)].
- [48] A. Abele et al. (Crystal Barrel), Phys. Lett. B417, 193 (1998).
- [49] D. Alde et al. (Serpukhov-Brussels-Annecy(LAPP), Soviet-CERN), Z. Phys. C25, 225 (1984), [Yad. Fiz.40,1447(1984)].
- [50] M. Ablikim et al. (BESIII), Phys. Rev. D83, 012003 (2011).
- [51] M. Ablikim et al. (BESIII), arXiv:1709.04627.
- [52] R. Escribano, P. Masjuan and J. J. Sanz-Cillero, JHEP 05, 094 (2011).
- [53] V. Dorofeev et al., Phys. Lett. B651, 22 (2007).
- [54] A. M. Blik et al., Phys. Atom. Nucl. 71, 2124 (2008), [Yad. Fiz.71,2161(2008)].
- [55] P. Adlarson et al., arXiv:1708.04230.
- [56] B. Kubis and S. P. Schneider, Eur. Phys. J. C62, 511 (2009).
- [57] T. Isken, B. Kubis, S. P. Schneider and P. Stoffer, Eur. Phys. J. C77, 489 (2017).
- [58] F. G. Binon et al. (Serpukhov-Brussels-Annecy(LAPP)), Phys. Lett. 140B, 264 (1984).
- [59] D. Alde et al. (Serpukhov-Brussels-Los Alamos-Annecy(LAPP)), Z. Phys. C36, 603 (1987).
- [60] M. Ablikim et al. (BESIII), Phys. Rev. Lett. 108, 182001 (2012).
- [61] D. J. Gross, S. B. Treiman and F. Wilczek, Phys. Rev. D19, 2188 (1979).
- [62] B. Borasoy, U.-G. Meissner and R. Nissler, Phys. Lett. B643, 41 (2006).
- [63] P. Naik et al. (CLEO), Phys. Rev. Lett. 102, 061801 (2009).
- [64] F.-K. Guo, B. Kubis and A. Wirzba, Phys. Rev. D85, 014014 (2012).
- [65] D. Parashar, Phys. Rev. D19, 268 (1979).
- [66] M. Gell-Mann, D. Sharp and W. G. Wagner, Phys. Rev. Lett. 8, 261 (1962).
- [67] W. Bartel et al. (JADE), Phys. Lett. 113B, 190 (1982).
- [68] H. J. Behrend et al. (CELLO), Phys. Lett. 114B, 378 (1982), [Erratum: Phys. Lett.125B,518(1983)].
- [69] C. Berger et al. (PLUTO), Phys. Lett. 142B, 125 (1984).
- [70] M. Althoff et al. (TASSO), Phys. Lett. 147B, 487 (1984).
- [71] H. Aihara et al. (TPC/Two Gamma), Phys. Rev. D35, 2650 (1987).
- [72] H. Albrecht et al. (ARGUS), Phys. Lett. B199, 457 (1987).
- [73] S. I. Bityukov et al., Z. Phys. C50, 451 (1991).
- [74] M. Benayoun et al., Z. Phys. C58, 31 (1993).
- [75] A. Abele et al. (Crystal Barrel), Phys. Lett. B402, 195 (1997).
- [76] M. Acciarri et al. (L3), Phys. Lett. B418, 399 (1998).
- [77] F. Stollenwerk, C. Hanhart, A. Kupsc, U. G. Meissner and A. Wirzba, Phys. Lett. B707, 184 (2012).
- [78] P. Adlarson et al. (WASA-at-COSY), Phys. Lett. B707, 243 (2012).
- [79] D. Babusci et al. (KLOE), Phys. Lett. B718, 910 (2013).
- [80] C. Hanhart, A. Kupsc, U. G. Meißner, F. Stollenwerk and A. Wirzba, Eur. Phys. J. C73, 2668 (2013), [Erratum: Eur. Phys. J.C75, 242(2015)].
- [81] G. J. Gounaris and J. J. Sakurai, Phys. Rev. Lett. 21, 244 (1968).
- [82] R. Garcia-Martin, R. Kaminski, J. R. Pelaez, J. Ruiz de Elvira and F. J. Yndurain, Phys. Rev. D83, 074004 (2011).
- [83] B. Kubis and J. Plenter, Eur. Phys. J. C75, 283 (2015).
- [84] M. Ablikim et al. (BESIII), Phys. Rev. D87, 092011 (2013).
- [85] A. Faessler, C. Fuchs and M. I. Krivoruchenko, Phys. Rev. C61, 035206 (2000).
- [86] B. Borasoy and R. Nissler, Eur. Phys. J. A33, 95 (2007).
- [87] T. Petri, Anomalous decays of pseudoscalar mesons, Master’s thesis Julich, Forschungszentrum 2010 arXiv:1010.2378 [nucl-th].
- [88] MesonNet Workshop on Meson Transition Form Factors 2012 arXiv:1207.6556 [hep-ph].
- [89] T. Blum et al. (2013), arXiv:1311.2198 [hep-ph].
- [90] V. M. Budnev and V. A. Karnakov, Pisma Zh. Eksp. Teor. Fiz. 29, 439 (1979).
- [91] R. I. Dzhelyadin et al., Phys. Lett. 88B, 379 (1979), [JETP Lett.30,359(1979)].
- [92] A. Bramon and E. Masso, Phys. Lett. B104, 311 (1981).
- [93] L. Ametller, L. Bergstrom, A. Bramon and E. Masso, Nucl. Phys. B228, 301 (1983).
- [94] L. Ametller, J. Bijnens, A. Bramon and F. Cornet, Phys. Rev. D45, 986 (1992).
- [95] H. J. Behrend et al. (CELLO), Z. Phys. C49, 401 (1991).
- [96] C. Terschlüsen, S. Leupold and M. F. M. Lutz, Eur. Phys. J. A48, 190 (2012).
- [97] R. Jora, Nucl. Phys. Proc. Suppl. 207-208, 224 (2010).
- [98] R. Escribano, PoS QNP2012, 079 (2012).
- [99] M. Ablikim et al. (BESIII), Phys. Rev. D87, 012009 (2013).
- [100] M. Ablikim et al. (BES), Phys. Rev. Lett. 97, 202002 (2006).
- [101] M. Ablikim et al. (BESIII), Phys. Rev. D87, 032006 (2013).
- [102] P. Fayet, Phys. Rev. D74, 054034 (2006).
- [103] P. Fayet, Phys. Rev. D75, 115017 (2007).
- [104] M. Ablikim et al. (BESIII), Phys. Rev. D84, 032006 (2011).
- [105] C. Jarlskog and E. Shabalin, Phys. Scripta T99, 23 (2002).
- [106] M. Ablikim et al. (BESIII), Phys. Rev. D93, 072008 (2016).
- [107] L. Bergstrom and H. R. Rubinstein, Phys. Lett. B203, 183 (1988).
- [108] C. Q. Geng, J. N. Ng and T. H. Wu, Mod. Phys. Lett. A17, 1489 (2002).
- [109] D. N. Gao, Mod. Phys. Lett. A17, 1583 (2002).