The intrinsic shape of bulges in the CALIFA survey
Abstract
Context. The intrinsic shape of galactic bulges in nearby galaxies provides crucial information to separate bulge types.
Aims. We intended to derive accurate constraints to the intrinsic shape of bulges to provide new clues on their formation mechanisms and set new limitations for future simulations.
Methods. We retrieved the intrinsic shape of a sample of CALIFA bulges using a statistical approach. Taking advantage of GalMer numerical simulations of binary mergers we estimated the reliability of the procedure. Analyzing the -band mock images of resulting lenticular remnants, we studied the intrinsic shape of their bulges at different galaxy inclinations. Finally, we introduced a new (, ) diagram to analyze possible correlations between the intrinsic shape and the properties of bulges.
Results. We tested the method on simulated lenticular remnants, finding that for galaxies with inclinations we can safely derive the intrinsic shape of their bulges. We found that our CALIFA bulges tend to be nearly oblate systems (), with a smaller fraction of prolate spheroids () and triaxial ellipsoids (). The majority of triaxial bulges are in barred galaxies (). Moreover, we found that bulges with low Sérsic indices or in galaxies with low bulge-to-total luminosity ratios form a heterogeneous class of objects; additionally, also bulges in late-type galaxies or in less massive galaxies have no preference in being oblate, prolate, or triaxial. On the contrary, bulges with high Sérsic index, in early-type galaxies, or in more massive galaxies are mostly oblate systems.
Conclusions. We concluded that various evolutionary pathways may coexist in galaxies, with merging events and dissipative collapse being the main mechanisms driving the formation of the most massive oblate bulges and bar evolution reshaping the less massive triaxial bulges.
Key Words.:
galaxies: bulges - galaxies: evolution - galaxies: formation - galaxies: fundamental parameters - galaxies: photometry - galaxies: structure1 Introduction
In observational extragalactic astrophysics, our measurements of the light distribution of galaxies are confined to the two-dimensional framework of the sky plane. Although observations can only access the projected rather than intrinsic luminosity density of galaxies, we can disentangle their different luminous components, including bulges. Constraining the three-dimensional light distribution of the galaxy components, and therefore their intrinsic shape, is a crucial piece of information in our understanding of how galaxies form and evolve.
Several studies addressed the intrinsic shape of the elliptical galaxies (Sandage et al., 1970; Tremblay & Merritt, 1996; Rodríguez & Padilla, 2013). Although many of ellipticals were initially thought to be oblate or prolate spheroids, some photometric (i.e., the twisting of the isophotes; Carter, 1978; Bertola & Galletta, 1979) and kinematic properties (i.e., the low rotation of stars or the kinematic misalignment; Bertola & Capaccioli, 1975; Illingworth, 1977; Krajnović et al., 2011) promptly supported the idea that some of them could be triaxial ellipsoids. In general, faint ellipticals are more flattened with a tendency to be oblate spheroids, whereas bright ellipticals are rounder and more frequently triaxial ellipsoids (Weijmans et al., 2014). It should be noticed that most of the works about the intrinsic shape of ellipticals deal with the distribution function of the intrinsic axial ratios of the whole population of ellipticals through statistical analyses of their apparent flattenings (see Méndez-Abreu, 2016, for a review). As a matter of fact, it is not possible to recover the intrinsic shape of an individual elliptical galaxy by only studying its light distribution (Statler et al., 2001). Indeed, deprojecting the apparent shape of an elliptical into its intrinsic shape represents a typical ill-posed problem, caused by the lack of observational constraints on the three Euler angles (, , ) that provide the transformation. Further details about the galaxy structure, like the presence of dust lanes, gaseous disks or embedded stellar disks (e.g., NGC~5077, Bertola et al. 1991a) or the knowledge of the stellar velocity field (e.g., NGC~4365, van den Bosch et al. 2008) are needed to overcome this problem.
On the contrary, in disk galaxies it is possible to derive the intrinsic shape of individual bulges because of the presence of the disk component, whose observed ellipticity provides a proxy for the bulge inclination, under the assumptions that both the bulge and disk share the same equatorial plane of symmetry and that disks are highly-flattened oblate spheroids (but see also Ryden, 2004, 2006).
The bulge is photometrically defined as the structural component responsible for the light excess measured in the galaxy central regions, above the inward extrapolation of the exponential surface-brightness profile of the disk (Andredakis et al., 1995; Balcells et al., 2007). The main concern for bulges is separating their light contribution from that of the other galaxy components. This is usually done by means of the photometric decomposition of the galaxy surface brightness into the contribution of the bulge and disk, and possibly of a lens, a bar, inner or outer rings, nuclear unresolved components, and the spiral arms (Peng et al., 2002; Laurikainen et al., 2005; Gadotti, 2009; Benítez et al., 2013; Erwin, 2015).
Nowadays, it is widely accepted that bulges are not simple axisymmetric structures in the center of galaxies (see Méndez-Abreu, 2016, for a review). The misalignment between the bulge and disk isophotes observed in many spirals (e.g., M31, Lindblad, 1956; Williams & Schwarzschild, 1979) resembles the isophotal twist of ellipticals and it is similarly interpreted as the signature of bulge triaxiality. The first quantitative estimate of the triaxiality of bulges was carried out by Bertola et al. (1991b) by studying the misalignment between the major axes of the bulge and disk in a sample of 32 early-type disk galaxies. They found that the mean intrinsic axial ratio of bulges in the disk plane is , while their mean intrinsic flattening in the plane perpendicular to the disk plane is , where , , and are the lengths of the semi-axes of the bulge ellipsoid. This result was later confirmed by Fathi & Peletier (2003), who analyzed the deprojected axial ratio of the galaxy isophotes within the bulge radius in a sample of 70 disk galaxies, ranging from lenticulars to late-type spirals. They found and for the bulges in earlier and later morphological types, respectively. By means of a two-dimensional photometric decomposition, Méndez-Abreu et al. (2008) measured the structural parameters of both bulges and disks in a sample of 148 early-to-intermediate spirals, increasing the statistics of Bertola et al. (1991b) by an order of magnitude. They found that about of the sample bulges are triaxial ellipsoids with . More recently, Méndez-Abreu et al. (2010) introduced a novel statistical method to constrain the intrinsic shape of individual bulges. The knowledge of the geometric properties (i.e., the apparent ellipticity and major-axis position angle) of the bulge and disk makes it possible to simultaneously compute the probability distribution function of the intrinsic axial ratios and for every single bulge. They revisited the galaxies of the sample of Méndez-Abreu et al. (2008) and concluded that of them host oblate triaxial bulges while the remaining ones have prolate triaxial bulges.
Nevertheless, further efforts are required to better characterize the intrinsic shape of bulges and, in particular, a higher number statistics is needed to investigate the correlations between the bulge shape and galaxy properties. Knowing the intrinsic shape of bulges completes our understanding of the potential well and orbital distribution of the stars in the inner regions of galaxies. This will also help us to explain the origin of the different populations of classical and disk-like bulges as well as to address the assembly processes of their host galaxies. (e.g., Athanassoula, 2005; Brooks & Christensen, 2016). The general agreement on bulge formation is that rapid dissipative collapses (Eggen et al., 1962; Sandage, 1990) or the violent relaxation by galactic major merger events (Toomre, 1977; Kauffmann, 1996) form classical bulges, resembling oblate spheroids with intermediate or low flattening and with a certain degree of triaxiality. Numerical simulations have also demonstrated the relevance of minor mergers in the build up of a classical bulge (Aguerri et al., 2001; Eliche-Moral et al., 2006). In the context of galaxy formation, cosmological simulations highlighted that the actual population of galaxies can be represented only by the proper combination of major and minor, gas-rich and gas-poor mergers (Oser et al., 2012; Naab et al., 2014). Moreover, the recurring coalescence of long-lived giant star-forming clumps at high redshift was also proposed as a mechanism for the formation of classical bulges (Dekel et al., 2009; Ceverino et al., 2015). On the contrary, secular processes linked to the evolution of galactic substructures (i.e., bars, lenses, ovals, etc.) reshape the center of galaxies into either boxy/peanut components (Erwin & Debattista, 2013; Laurikainen et al., 2014) or more flattened disk-like bulges (Kormendy & Kennicutt, 2004; Kormendy, 2016). In this scenario, disk-like bulges are expected to be axisymmetric systems, whereas boxy/peanut structures show some degree of triaxiality (Athanassoula & Beaton, 2006), being the vertically-thick inner parts of bars resulting from buckling or resonant effects (Combes & Sanders, 1981; Lütticke et al., 2000). Another possible mechanism invoked for disk-like bulge growth is the fast disruption of short-lived giant clumps at high redshift, if no relaxation processes affect the central region of the galaxy (Hopkins et al., 2012; Bournaud, 2016).
Currently, the observational separation between classical and disk-like bulges is usually done by analyzing their observed photometric, kinematic, or stellar population properties (Morelli et al., 2008; Coelho & Gadotti, 2011). However, the demarcation lines are often blurred making difficult to understand the actual frequency of different bulge types (Costantin et al., 2017). Furthermore, bulges can suffer from different processes during their lifetime with some of them giving rise to similar observational properties. As a consequence, different kind of bulges can coexist in the same galaxy (Athanassoula, 2005; Méndez-Abreu et al., 2014; Erwin et al., 2015). Nonetheless, the measurements of the intrinsic shape of bulges might provide a fundamental additional constraint to separate bulge types, as well as limitations for future numerical simulations willing to reproduce realistic galaxies.
In this paper, we analyze the intrinsic shape of the bulges of some of the disk galaxies observed in the Calar Alto Legacy Integral Field Area survey Data Release 3 (CALIFA DR3; Sánchez et al., 2016). We aim at investigating the possible links between the intrinsic shape of bulges and their observed photometric properties. Here, we improve the previous results by Méndez-Abreu et al. (2008, 2010) by testing the reliability of their statistical method and setting limits on the galaxy inclination to its successful application with the help of mock images of a set of simulated remnant galaxies. The paper is organized as follows. We present the galaxy sample in Sect. 2. We summarize the statistical method for retrieving the intrinsic shape of bulges in Sect. 3. We make use of mock images of simulated remnant galaxies seen at different inclinations to understand the limits of our analysis in Sect. 4. We derive the intrinsic shape of the bulges of the sample galaxies in Sect. 5. We discuss the possible implications of our results for galaxy formation in Sect. 6. We summarize our findings in Sect. 7. We adopt = 70 km s-1 Mpc-1, = 0.3, and = 0.7 as cosmological parameters throughout this work.
2 Sample selection
We selected our galaxies sample from the final sample of galaxies included in the CALIFA DR3, which was drawn from the Sloan Digital Sky Survey (SDSS) DR7 (Abazajian et al., 2009) and comprises 667 nearby galaxies () with an angular isophotal diameter between 45 and 79.2 arcsec at a surface brightness level of mag arcsec-2 in the band.
First, we focussed onto the 314 disk galaxies of CALIFA DR3, not interacting or merging, with a photometric decomposition obtained by Méndez-Abreu et al. (2017). These galaxies were fitted with either bulge and disk only (177 galaxies), or with a bar in addition to bulge and disk (137 galaxies) using the GAlaxy Surface Photometry 2 Dimensional Decomposition code (GASP2D; Méndez-Abreu et al., 2008, 2014).
Then, we took into account only the galaxies with good imaging, that is the absence of either strong fluctuations of the local sky background around the galaxy or other bright component affecting the photometric decomposition (e.g., a lens, inner and/or outer rings, and spiral arms), and all the structural parameters of the bulge, disk, and bar left free to vary during the fitting process (i.e., the galaxies flagged as 1,a in Table 1 of Méndez-Abreu et al. 2017). This allowed us to obtain a subsample of 118 robustly fitted galaxies (67 unbarred and 51 barred galaxies), with no bias on the measured structural parameters that could hamper our analysis of the bulge intrinsic shape.
Finally, we set a limit onto the galaxy inclination () to exclude both the low-inclined galaxies, for which it is not possible to constrain the bulge shape along the direction perpendicular to the disk plane, and the highly-inclined ones, for which the results of the GASP2D photometric decomposition are not reliable (Méndez-Abreu et al., 2017) and the bulge shape on the disk plane is unconstrained (see Sect. 4.3 for a discussion). This selection criterion reduced the galaxy sample to 83 objects (43 unbarred and 40 barred galaxies), as shown in Table 6 and 7.
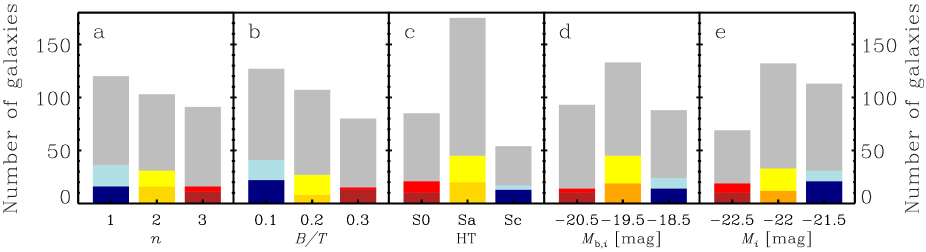
We considered only galaxies with -band images to better resolve the bulge component minimizing the dust effects with respect to the other SDSS passbands. The choice of band assured a sufficient spatial resolution ( arcsec) and depth (out to mag arcsec-2), as retrieved from Méndez-Abreu et al. (2017). Their basic properties (i.e., Sérsic index of the bulge , bulge-to-total luminosity ratio , Hubble type HT, -band absolute magnitude of the bulge , and -band absolute magnitude of the galaxy from Méndez-Abreu et al. 2017) are shown in Fig. 1 and compared with those of the selected sample of 314 disk galaxies from CALIFA DR3. This final sample is not complete in volume. However, we thought that the selection in diameter of the CALIFA sample should not introduce any major bias in our results, since the distribution of bulge observed properties is well sampled, as shown in Fig. 1.
3 Bulge intrinsic shape
The full description of the statistical method adopted to derive the intrinsic shape of the bulges of our galaxy sample is given in Méndez-Abreu et al. (2010). Here, for the sake of clarity, we summarized the main hypotheses and gave the most relevant equations that link the intrinsic axial ratios of the bulge to the observed properties of the galaxy. In particular, we rewrote the description of the probability function (Eq. 34 in Méndez-Abreu et al. 2010) and we revised the equation linking the axial ratios and (Eq. 59 in Méndez-Abreu et al. 2010).
| Galaxy | |||||||||
|---|---|---|---|---|---|---|---|---|---|
| () | () | () | () | () | () | () | () | ||
| (1) | (2) | (3) | (4) | (5) | (6) | (7) | (8) | (9) | |
| gE0gSbo5 | 1.00 | 1.00 | 1.00 | 1.00 | 1.00 | 0.99 | 0.59 | 0.59 | |
| gE0gSdo5 | 0.79 | 0.79 | 0.91 | 0.89 | 0.86 | 0.46 | 0.26 | 0.26 | |
| gS0dE0o98 | 0.46 | 0.49 | 0.49 | 0.64 | 0.56 | 0.51 | 0.21 | 0.36 | |
| gS0dE0o99 | 0.46 | 0.46 | 0.54 | 0.59 | 0.69 | 0.64 | 0.64 | 0.64 | |
| gS0dE0o100 | 0.46 | 0.46 | 0.49 | 0.54 | 0.56 | 0.59 | 0.14 | 0.39 | |
| gS0dS0o99 | 0.59 | 0.59 | 0.56 | 0.61 | 0.76 | 0.64 | 0.41 | 0.21 | |
| gS0dSao103 | 0.51 | 0.51 | 0.51 | 0.56 | 0.56 | 0.96 | 0.21 | 0.34 | |
| gS0dSbo106 | 0.44 | 0.44 | 0.41 | 0.46 | 0.61 | 0.69 | 0.39 | 0.29 | |
| gS0dSdo100 | 0.51 | 0.51 | 0.49 | 0.51 | 0.74 | 0.54 | 0.41 | 0.24 | |
| gSbgSbo9 | 0.71 | 0.71 | 0.76 | 0.76 | 0.76 | 1.06 | 0.74 | 0.54 | |
| gSbgSdo5 | 0.81 | 0.84 | 0.84 | 0.81 | 0.84 | 0.36 | 0.26 | 0.21 | |
3.1 Bulge and disk geometry
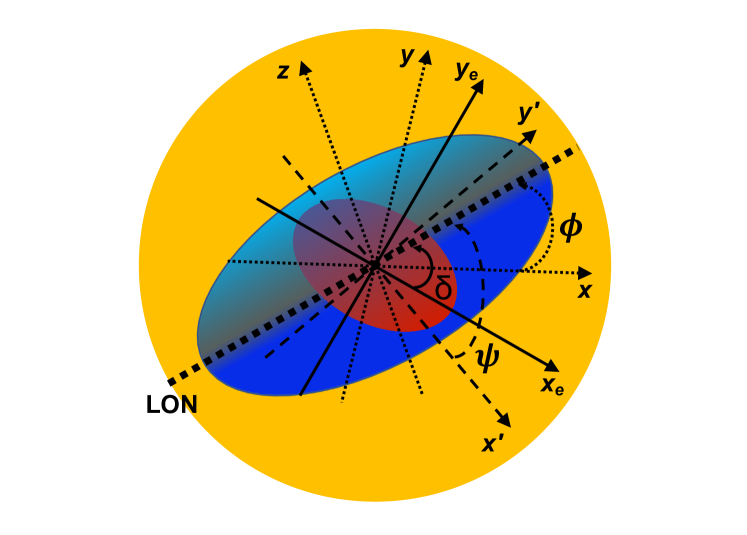
In order to characterize the intrinsic shape of a bulge, we assumed it to be a triaxial ellipsoid with the same equatorial plane as the disk, which we supposed to be infinitesimally thin. Moreover, the bulge and disk share the same center, which coincides with the galaxy center (Fig. 2).
Let (, , ) be the Cartesian coordinates in the reference system of the galaxy. The origin of the system is in the galaxy center, the -axis and -axis correspond to the bulge principal axes in the equatorial plane, while the -axis corresponds to the common polar axis of both the bulge and disk. The equation of the bulge in its own reference system is given by
| (1) |
where , , and are the lengths of the bulge intrinsic semi-axes.
Let (, , ) be the Cartesian coordinates in the reference system of the observer. The origin of the system is in the galaxy center, the polar -axis is along the line of sight (LOS) and points toward the galaxy, while (, ) confines the sky plane.
The intersection between the bulge equatorial plane (, ) and the sky plane (, ) is the so-called line of nodes (LON). The angle between the polar -axis and the polar -axis defines the bulge inclination. Let be the angle between the -axis and the LON in the bulge equatorial plane and let be the angle between the -axis and the LON in the sky plane. The three Euler angles (, , ) allow for the transformation from the reference system of the sky to that of the galaxy. If the -axis coincides with the LON, consequently it is .
The projection onto the sky plane of the triaxial ellipsoid given in Eq. 1 is an ellipse which corresponds on the galaxy image to the photometric bulge. It is given by
| (2) |
where and are taken along the symmetry axes of the bulge ellipse, while and are lengths of the ellipse semi-major and semi-minor axis, respectively. The twist angle between the -axis and the LON indicates the bulge orientation. We always consider such that can be either the major or the minor semi-axis.
The twist angle and apparent axial ratio of the bulge () depend only, and unambiguously, on the direction of the LOS (i.e., on , , and ) and on the intrinsic shape of the bulge (i.e., on , , and ). Thus, by means of the Euler angles it is possible to impose further constraints to the equations that relate the intrinsic parameters of the bulge in the reference system of the galaxy to the observed properties of the galaxy in the reference system of the observer (Simonneau et al., 1998; Méndez-Abreu et al., 2008). Introducing physical constraints on the accessible viewing angles (e.g., imposing that , , and must be definite positive), it is possible to statistically derive the intrinsic axial ratios of the bulge from its observed properties. Unfortunately, the problem is not analytically solved because of the unknown spatial position of the bulge (i.e., the angle ), which constitutes the basis of the statistical analysis (see Méndez-Abreu et al., 2010, for all the details).
3.2 Statistical analysis
The theoretical framework based on the statistical analysis of the angle allows us to retrieve the intrinsic shape of individual bulges in disk galaxies from the bulge apparent shape (i.e., the bulge ellipticity ), the disk apparent shape (i.e., the disk ellipticity , where is the apparent axial ratio of the disk), and the bulge twist angle (i.e., the difference between the position angles of the bulge and disk ; see Méndez-Abreu et al. 2010 for all details).
The apparent axial ratio of a circular and infinitesimally thin disk is a measure of the bulge inclination
| (3) |
when both the bulge and disk share the same equatorial plane. However, disks are not infinitely thin structures (Sandage et al., 1970; Ryden, 2004). To account for this, we computed the inclination of our galaxies accounting for the distribution function of the intrinsic axial ratio of the disks . We adopted a normal distribution function with mean intrinsic axial ratio and standard deviation following Rodríguez & Padilla (2013). Thus, the statistical value of the galaxy inclination is
| (4) |
where the value is randomly drawn from the previous normal distribution.
We took into account for the uncertainties in , , and derived from the error analysis of the photometric decomposition (Méndez-Abreu et al., 2017). We randomly generated 1000 geometric configurations by adopting for each parameter a Gaussian distribution centered on its measured value and with a standard deviation equal to its uncertainty. A similar analysis was introduced by Corsini et al. (2012) to recover the intrinsic shape of the polar bulge of NGC~4698. For each geometric configuration, we calculated 5000 values of using Monte Carlo simulations and according to its probability function
| (5) |
where and are the angles where the length of the intrinsic semi-axis and are zero, respectively. Since and are both functions of the same variable , their probabilities and are equivalent; thus, after sampling the value of using Eq. 5, we calculated the value of using
| (6) |
where , , and are functions of the observed quantities , , , and (see Méndez-Abreu et al., 2010, for a full description of the different variables).
4 Bulge intrinsic shape of the simulated lenticular remnants
4.1 Simulated lenticular remnants from numerical experiments of binary mergers
In order to test our statistical method for recovering the intrinsic shape of bulges and to understand its limitations, we measured the intrinsic axial ratios of the bulge against different galaxy inclinations. To this aim, we used a subset of 11 numerical simulations from the GalMer database222The GalMer database is a public library of hydrodynamics N-body simulations of galaxy mergers with intermediate resolution available at http://www.project-horizon.fr/. (Chilingarian et al., 2010). We used remnant galaxies of a variety of merger experiments between pairs of galaxies with different mass, morphology, gas content, and orbital parameters. These remnant galaxies strongly resemble lenticular galaxies, according to their morphological, photometric, and kinematic properties (Borlaff et al., 2014; Querejeta et al., 2015a, b; Tapia et al., 2017, Eliche-Moral et al. in prep.).
We chose to analyze simulated lenticular remnants resulting from binary mergers instead of N-body realizations of analytical expressions, as those adopted for building the progenitor galaxies of the remnants, because we required a certain degree of bulge triaxiality. Such a triaxiality is a common feature of merger remnants, although their progenitors could be axisymmetric by construction (Cox et al., 2006; Tapia et al., 2014). All the simulated lenticular remnants of the analyzed merger experiments are either unbarred galaxies if resulting from a major merger, or weakly barred galaxies if resulting from a minor merger (Eliche-Moral et al. in prep.). We discarded the merger experiments producing elliptical or E/S0 remnants, in order to have simulated galaxies with a well-defined bulge embedded into a large disk, similarly to the observed CALIFA galaxies.
| IDorb | spin-orbit | |||
|---|---|---|---|---|
| [P/R] | [∘] | [kpc] | [ km2 s-2] | |
| (1) | (2) | (3) | (4) | (5) |
| 5 | P | 0 | 16 | 0 |
| 9 | P | 0 | 24 | 0 |
| 98 | P | 33 | 8 | 2.5 |
| 99 | P | 33 | 8 | 5 |
| 100 | P | 33 | 8 | 15 |
| 103 | R | 33 | 8 | 0 |
| 106 | R | 33 | 8 | 15 |
The progenitor galaxies were modeled with a spherical non-rotating dark-matter halo, which contains a stellar and/or a gaseous disk and/or a central non-rotating bulge, depending on their morphological type. The primary galaxy consisted of a giant galaxy (hereafter gE0 for a giant-like elliptical, gS0 for a giant-like lenticular, gSa for a giant-like Sa spiral, gSb for a giant-like Sb spiral, and gSd for a giant-like Sd spiral) interacting either with another giant galaxy of similar mass or with a dwarf galaxy (hereafter dE0, dS0, dSa, dSb, and dSd), whose total mass is ten times smaller than that of the giant galaxy. Several simulations were performed varying the initial orbital energy, pericenter distance and inclination with respect to the orbital plane of the interacting galaxies. Indeed, for each interacting pair the disk (when present) of one of the two galaxies is kept in the orbital plane, while the companion disk can have a different inclination. Direct and retrograde orbits were also taken into account, where direct or retrograde spin-orbit coupling refer to progenitors having either parallel or antiparallel spins, respectively. The merger experiments have a total of 240 000 and 528 000 particles for the major and minor merger events, respectively. The particles have a mass – M☉ each. The merger experiments have a duration of 3–3.5 Gyr and were evolved using a Tree-SPH code (Semelin & Combes, 2002), adopting the same softening length for all particle types pc for the giant-giant galaxy mergers and pc for the giant-dwarf galaxy mergers. The effects of gas and star formation (SF; such as the stellar mass loss, metallicity enrichment of the interstellar medium, and energy injection due to supernova explosions) were considered using the method described in Mihos & Hernquist (1994). The stellar mass of the lenticular remnants is in the range – M☉ for major mergers and – M☉ for minor ones.
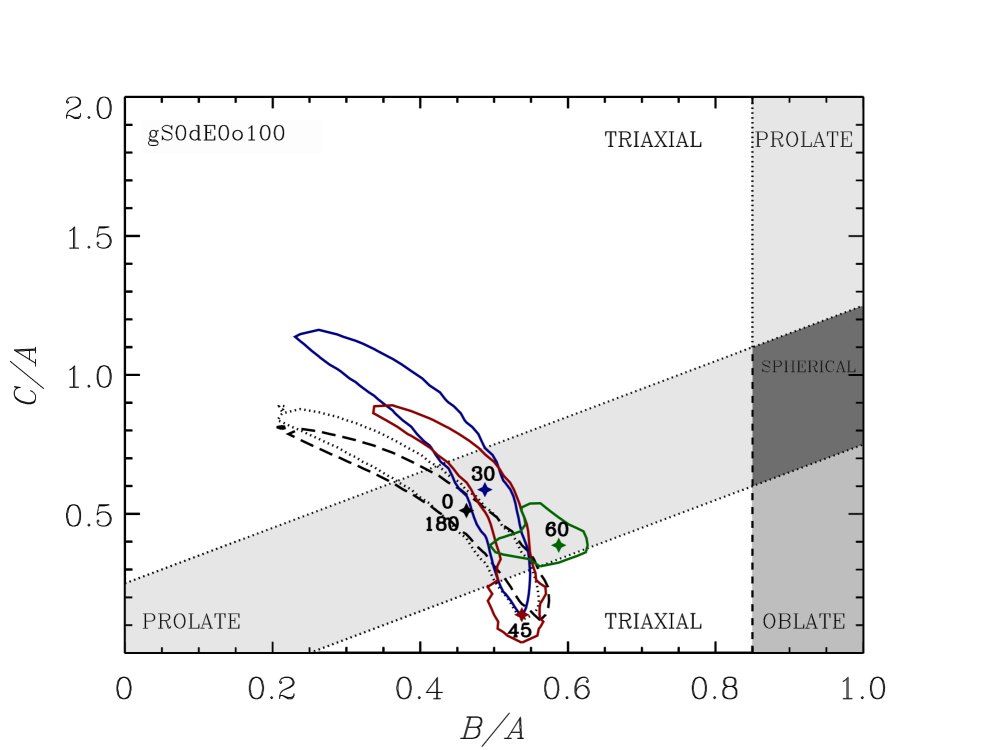
The merger experiments we analyzed were chosen to cover the whole range of morphologies, mass ratios, and orbital configurations of the progenitors. They are listed in Table 1 and labelled considering both the morphological type of the progenitors and the unique numerical identifier given to the orbit in the GalMer database. The orbital configuration of each merger experiment is provided in Table 3. For example, the experiment gS0dE0o100 corresponds to the accretion of a dwarf elliptical by a giant-like lenticular. It follows the orbit tagged as 100 in the GalMer database with an inclination of with respect to the orbital plane, a pericenter distance of 8 kpc, and a initial energy of km2 s-2 in a prograde spin-orbit coupling.
4.2 Photometric decomposition of the simulated lenticular remnants seen at different inclinations
To perform a fair comparison between the results from our sample of simulated bulges and the final observed sample from CALIFA, we built mock images of the simulated lenticular remnants under the observing setup of the CALIFA galaxies.
Therefore, we mimicked SDSS -band images of the simulated lenticular remnants assuming they are at a distance of 67 Mpc, which corresponds to the median distance of the CALIFA DR3 galaxies. We modeled the point spread function (PSF) with a circular Moffat profile (Moffat, 1969) with arcsec and , which represent typical values for the SDSS images of the galaxies in CALIFA DR3 (Méndez-Abreu et al., 2017). Moreover, we considered a Poissonian photon noise to yield signal-to-noise ratio at a limiting magnitude of mag arcsec-2. We chose a pixel scale of 0.396 arcsec pixel-1 and, for simplicity, we assumed a gain of ADU-1 and a readout noise of 1 rms.
We converted the mass of each particle of the simulated lenticular remnants into light by adopting the -band mass-to-light ratio corresponding to the stellar population of the same age and metallicity of the particle. For the old stellar particles, we assumed that they have evolved previous to the merger following a typical star formation history (SFH), according to the morphological type of the progenitors as found in real galaxies (Eliche-Moral et al., 2010). Since the SF is transferred to the hybrid particles at the start of the merger simulation, the SFH of the old stellar particles is stopped at that moment and they are assumed to evolve passively since then. We have thus adopted a present-day age of 11 Gyr for the old stellar component because it is the average age of the old stellar population in the disks of nearby lenticular galaxies (Sil’chenko et al., 2012; Sil’chenko, 2013). The SFHs were estimated using the stellar population synthesis models by Bruzual & Charlot (2003) with a Chabrier initial mass function (Chabrier, 2003), and the evolutionary tracks by Bertelli et al. (1994). Concerning the hybrid particles, the SF in the galaxies that merge is transferred to them during the simulation. So, part of their initial mass (totally gaseous at the start of the simulation) turns into stellar mass during the merger depending on the local gas concentration. The SFH of these particles is specifically computed during the experiment and it is different for each particle (Chilingarian et al., 2010). Although it may be quite complex, most of their SF accumulates into one or two short peaks occurred soon after the first pericenter passage and the full merger, mostly in this last one (see Di Matteo et al., 2007, 2008; Lotz et al., 2008, and Eliche-Moral et al., in prep.). Therefore, we have approximated the complex SFH of each hybrid particle by simple stellar populations (SSPs), assuming the mean age and metallicity that each hybrid particle presents at the end of the simulation, to estimate a ratio for each one and convert their newly formed stellar mass into luminosity. For this goal, we have used the same stellar population synthesis models commented before. We transformed the intrinsic physical values of lengths into projected angular values and we corrected the resulting surface brightness by cosmological dimming (see Tapia et al., 2017, for more details).
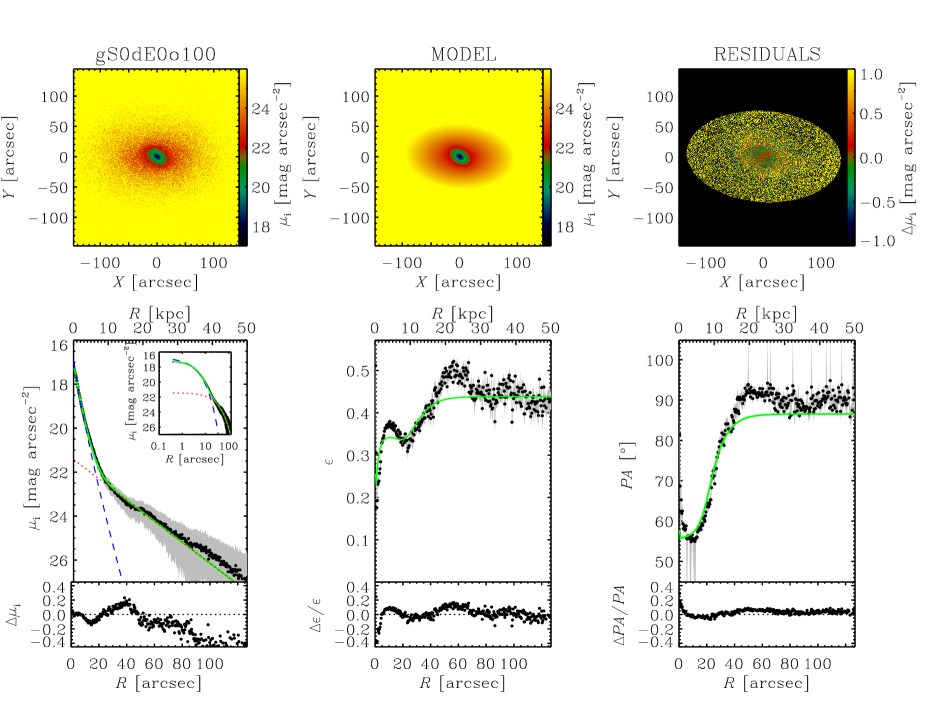
For each simulated lenticular remnant, we created 6 mock images corresponding to different inclinations with respect to the direction of the total angular momentum vector of the simulated lenticular remnant (i.e., , , , , , and ). The face-on views and correspond to the cases where the angular momentum vector points towards to and away from the observer, respectively. This allowed us to compare the reliability of the photometric decomposition results of both cases (which should be identical) and the dependence of our method to derive the intrinsic shape of bulges on the galaxy inclination. We analyzed the mock images of the simulated lenticular remnants as if they were real by performing a photometric decomposition with GASP2D. We modeled the surface brightness of the bulge with a Sérsic law (Sérsic, 1968), the surface brightness of the disk either with a single exponential (Freeman, 1970) or with a double-exponential law (van der Kruit, 1979), and the surface brightness of the bar with a Ferrers law (Ferrers, 1877; Aguerri et al., 2009). An example of the GASP2D photometric decomposition of the mock images of the simulated galaxies is shown in Fig. 3 for the lenticular remnant resulting from the merger experiment gS0dE0o100 seen at an inclination .
We listed the more relevant best-fitting structural parameters (i.e., the effective radius , Sérsic index , and axial ratio of the bulge, the scale-length and axial ratio of the disk, and the difference between the position angles of bulge and disk ) of the mock images of the simulated lenticular remnants seen at different inclinations in Table 5 for the giant-giant galaxy mergers, Table 4 for the giant-dwarf galaxy mergers, and Table 5 for the giant S0-dwarf E0 galaxy mergers with different orbital parameters. Following Méndez-Abreu et al. (2017), we adopted and as uncertainties on the axial ratio and position angle of both bulge and disk, respectively.
4.3 Bulge intrinsic shape of the simulated lenticular remnants seen at different inclinations
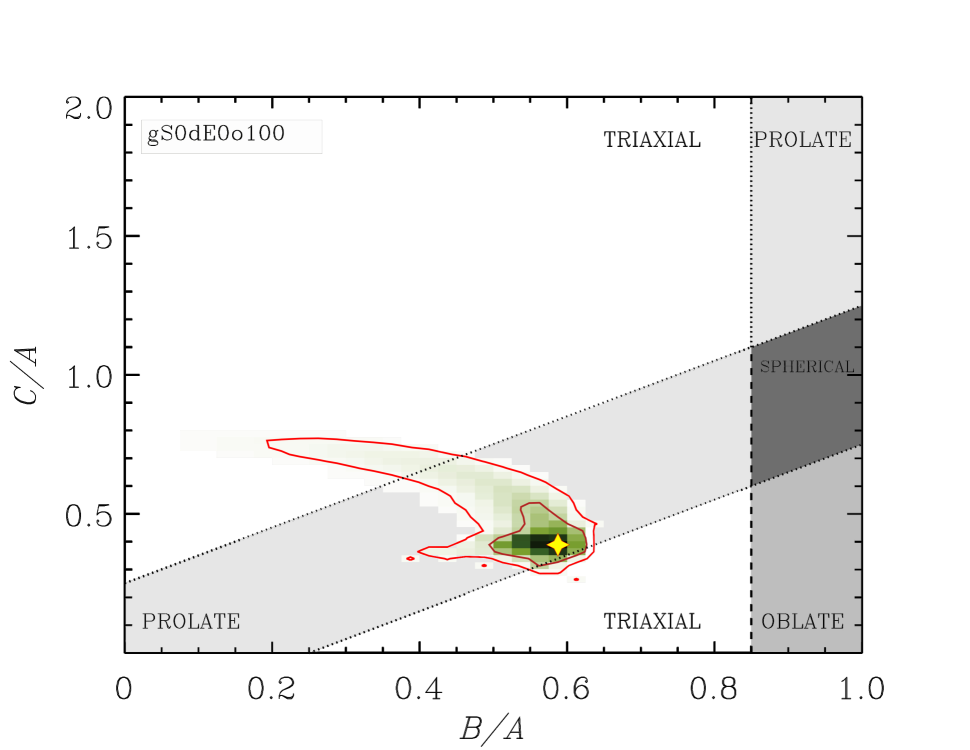
We made use of our statistical method to retrieve from the mock images the probability distribution of the intrinsic axial ratios and of the bulges of the simulated lenticular remnants seen at different inclinations (, and ). We excluded from the analysis the edge-on configurations () because they do not allow us to constrain and due to the unknown orientation of the triaxial bulge in the disk plane. The probability distribution of and for the bulge of the simulated lenticular remnants resulting from the merger experiment gS0dE0o100 and seen at an inclination is shown as an example in Fig. 4.
The face-on configurations of the simulated lenticular remnants ( and ) provided the same result in terms of the probability distribution of and for all the simulated bulges, as expected if no observational and theoretical bias affected the adopted statistical method. Furthermore, we confirmed that the tightest constraints for are given when galaxies are seen face on, whereas remains unconstrained for these galaxies. We also found consistent probability distributions of and for the same simulated lenticular remnant seen at intermediate inclinations (, , and ). This made us confident of having correctly recovered the bulge intrinsic shape and suggested us to set a limit on the inclination of real galaxies () to robustly apply our statistical method to their bulges (see Sect. 2). In general, the probability distribution of and is tighter at with respect to or . Therefore, we considered this inclination as the ideal viewing angle for future analyses of the bulge intrinsic shape in real galaxies.
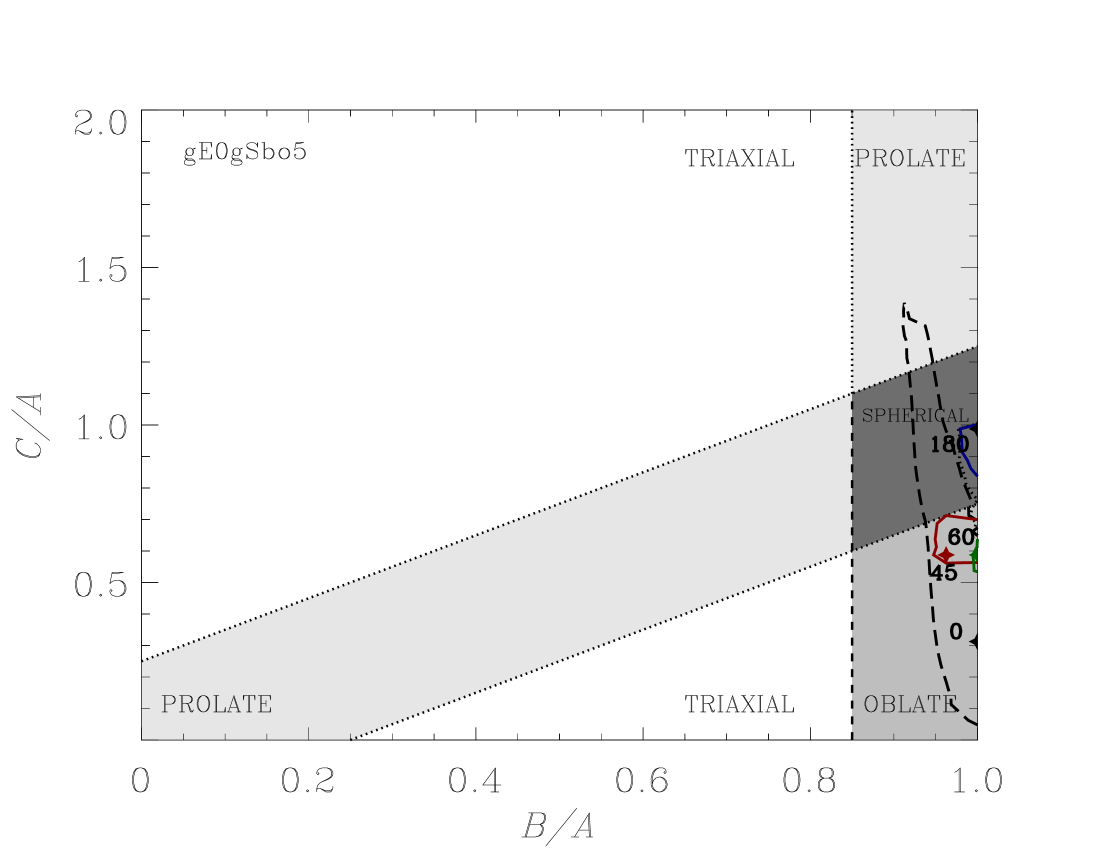
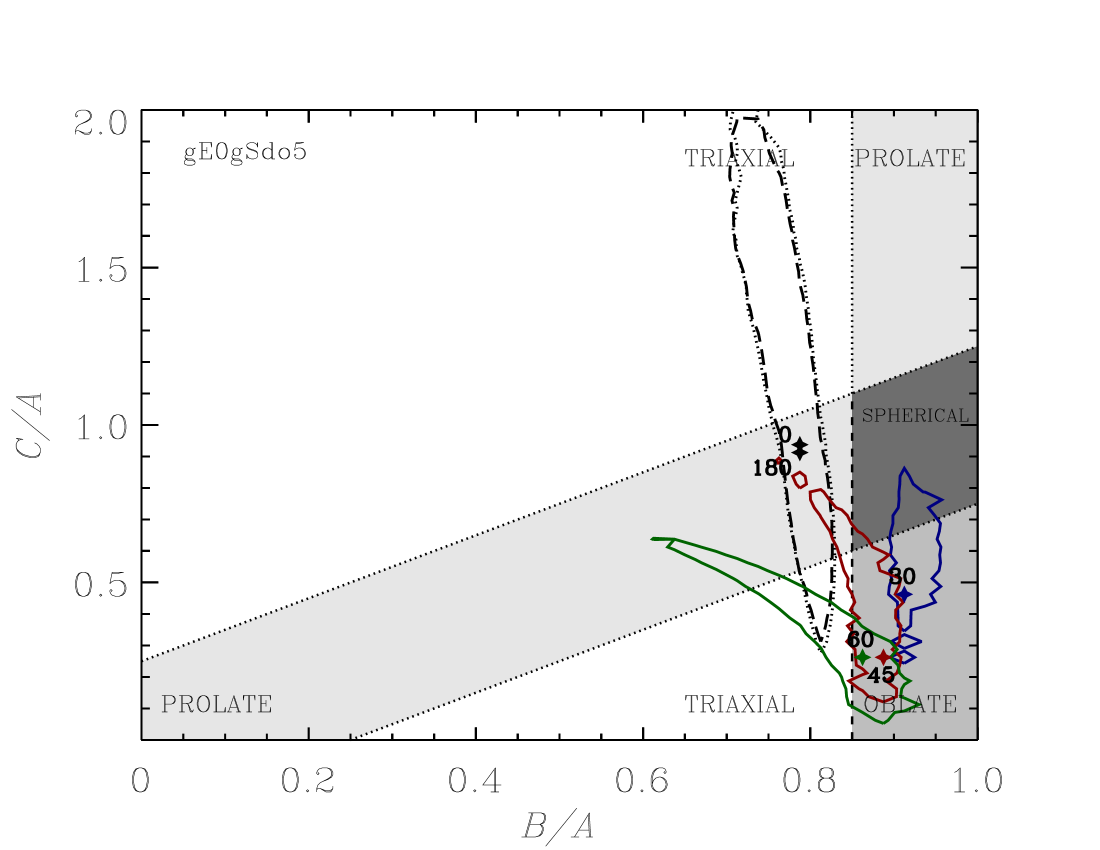
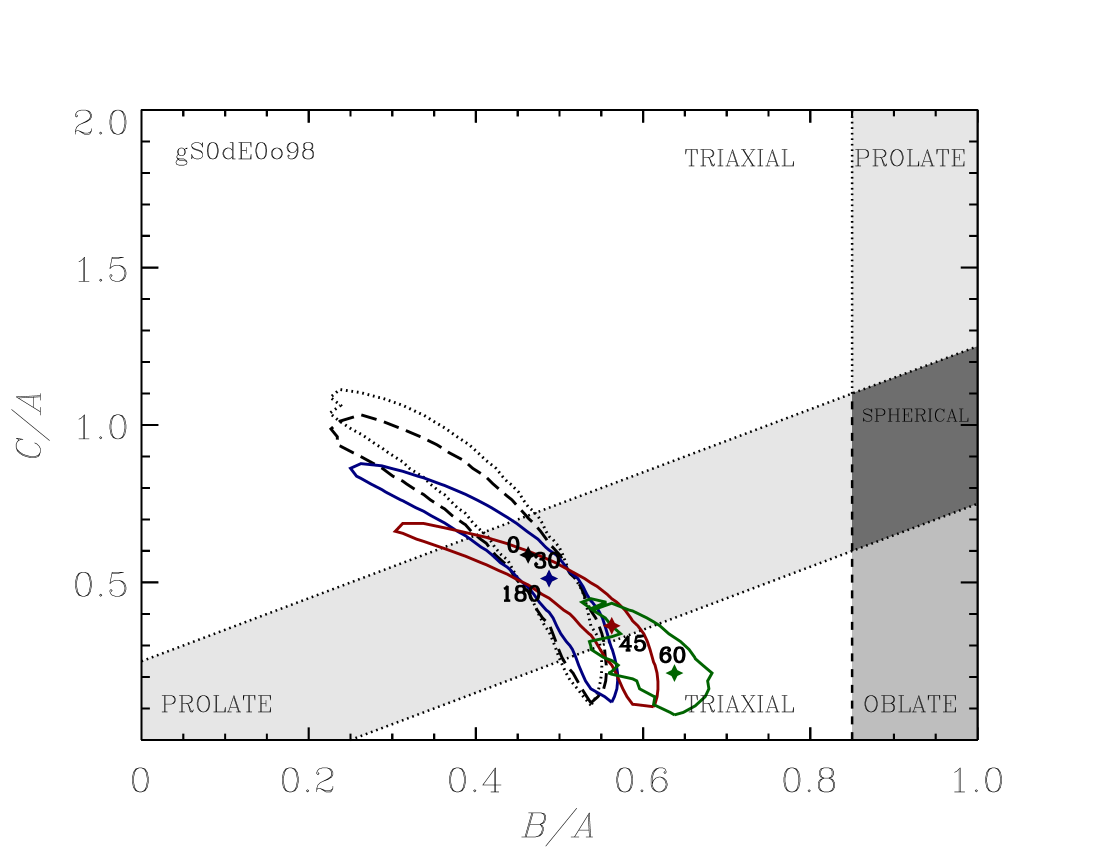
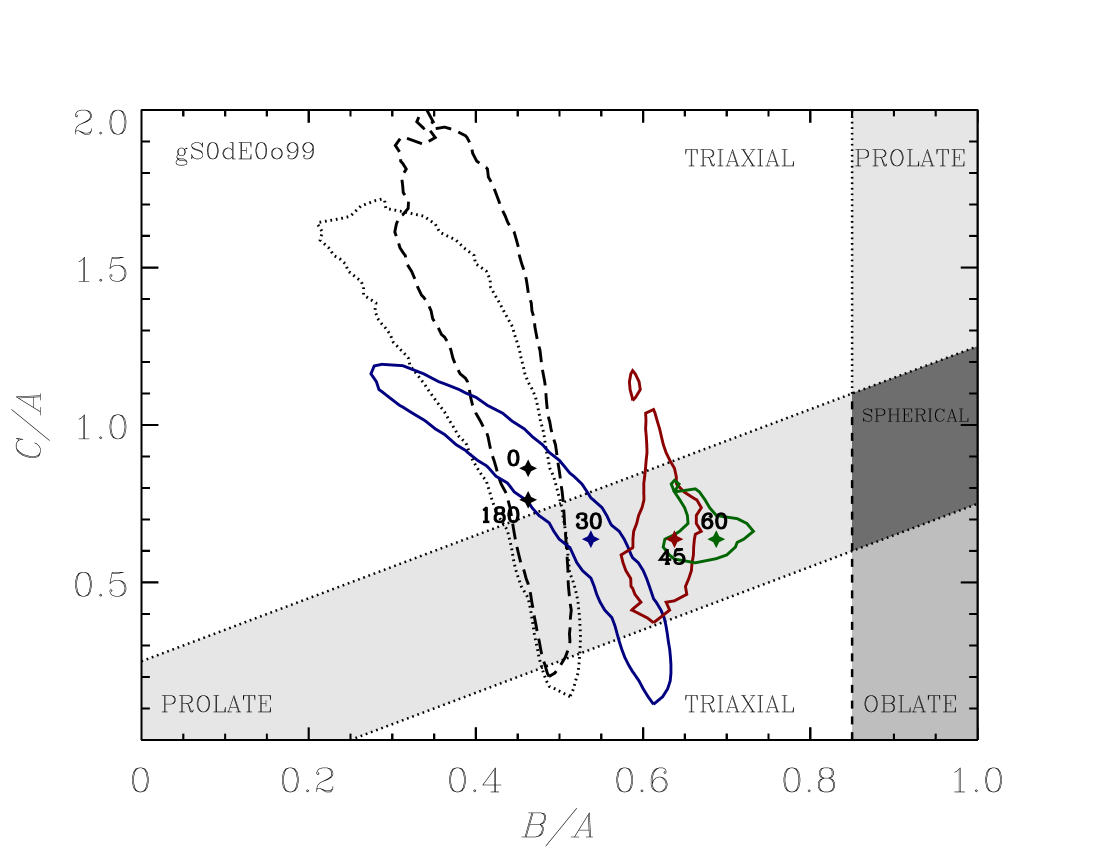
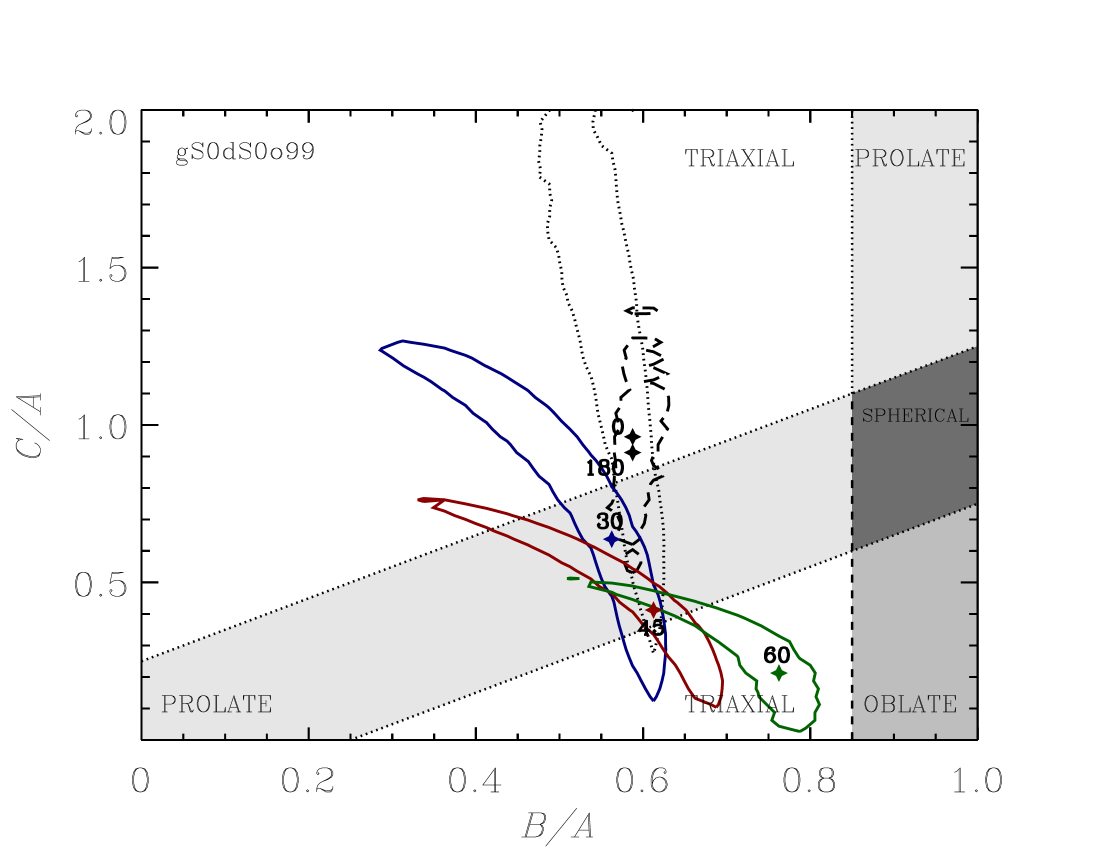
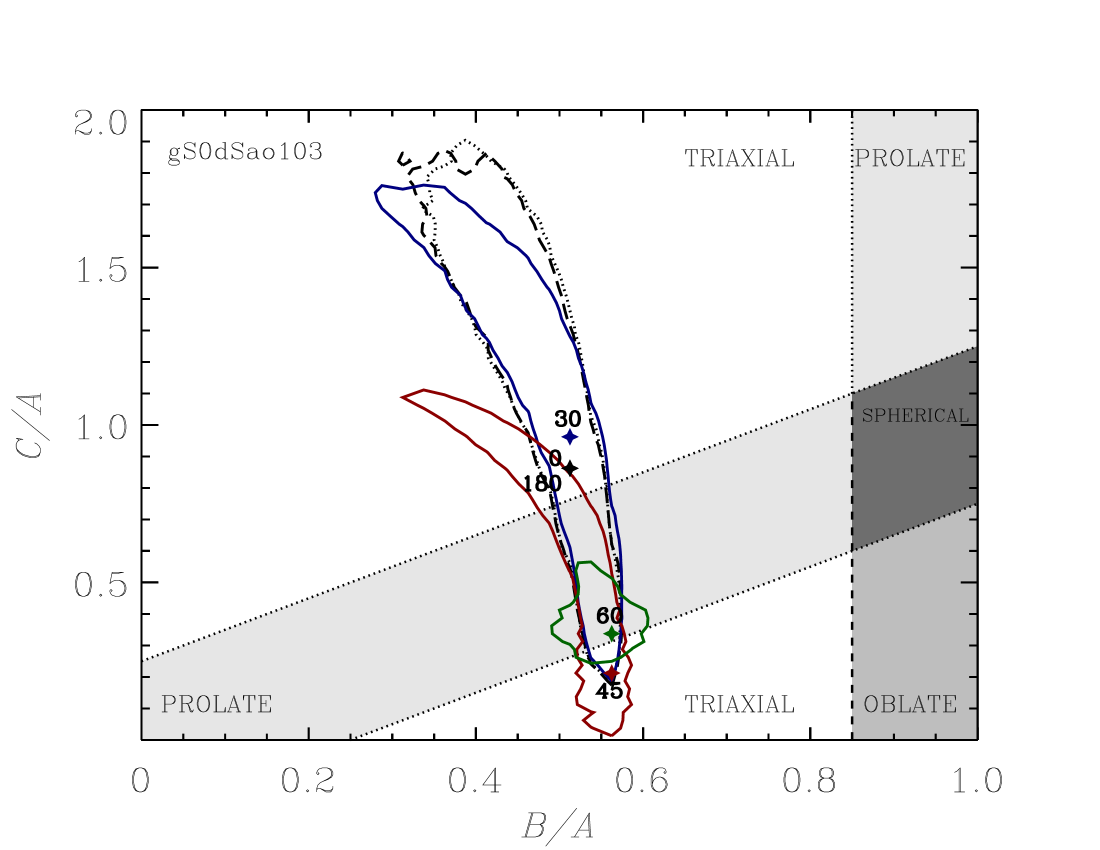
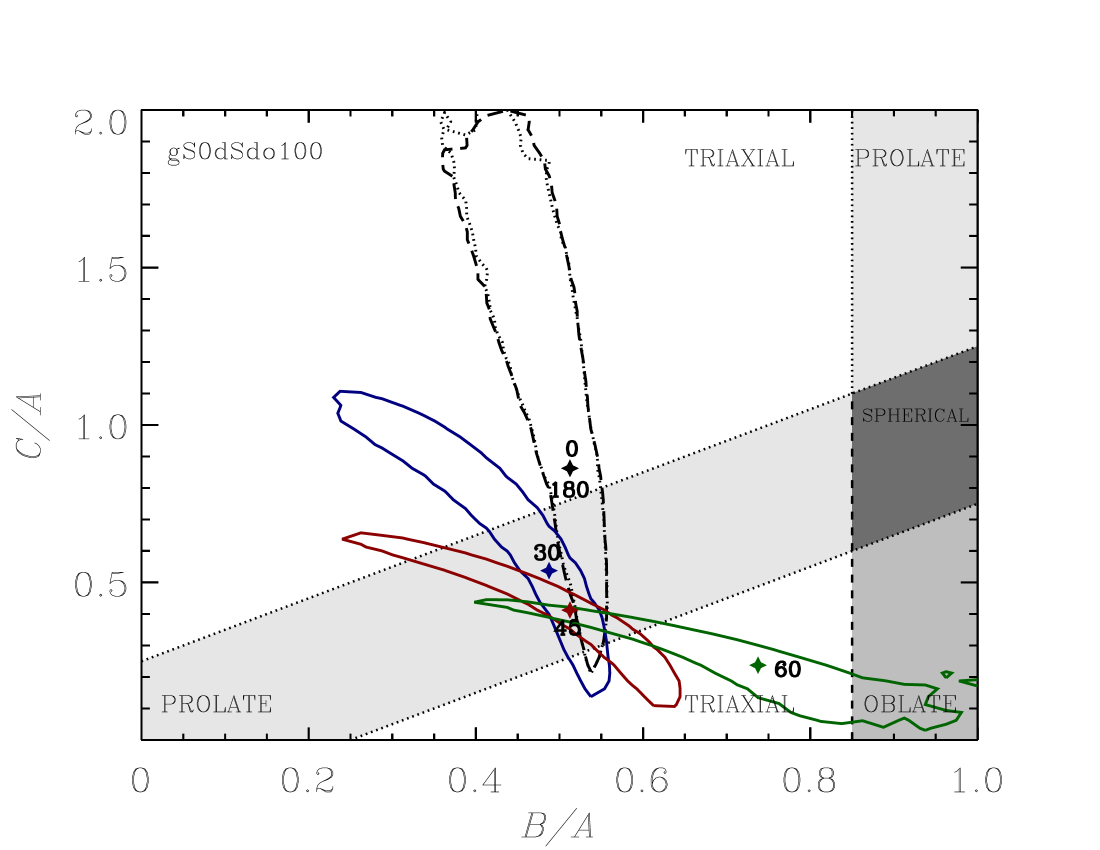
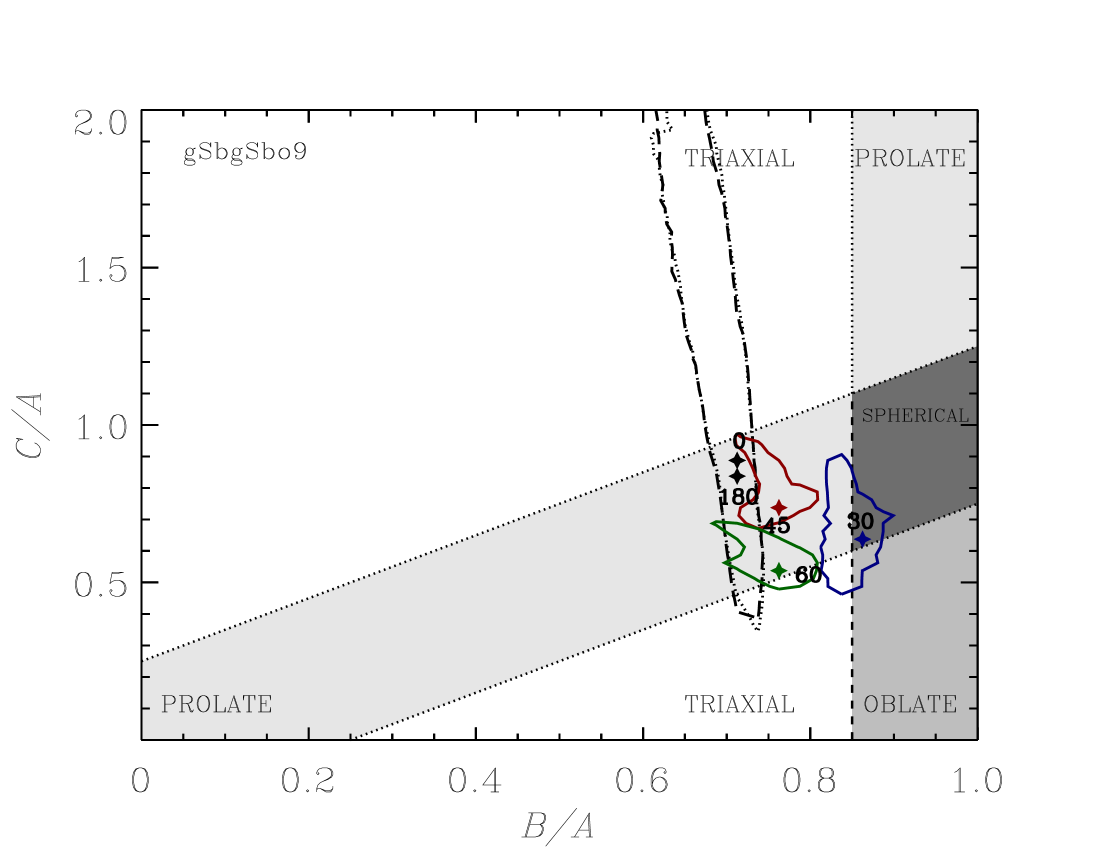
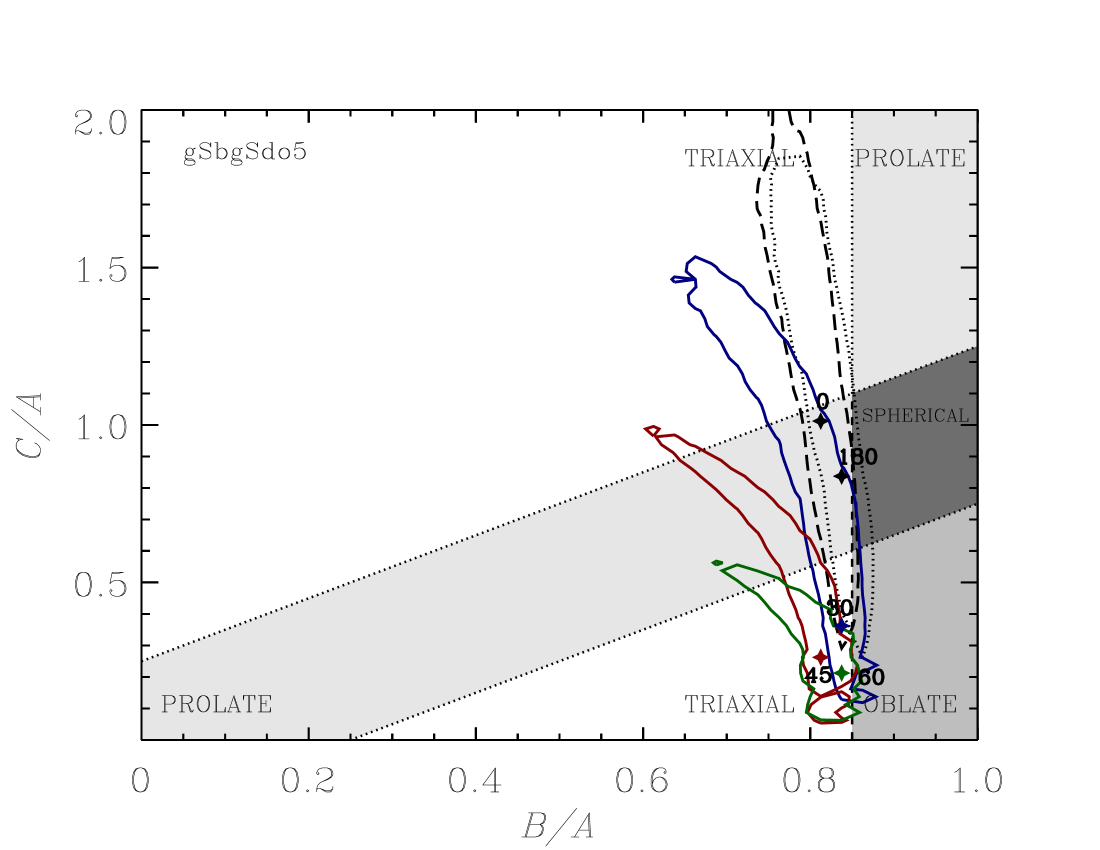
The probability distributions of and of the bulge of the simulated lenticular remnant resulting from the merger experiment gS0dE0o100 seen at different inclinations are shown in Fig. 5, while the remaining galaxies are in Appendix B (Fig. 13). The values of and derived for all the simulated lenticular remnants seen at different inclinations are listed in Table 1.
We realized that the accuracy of the photometric decomposition is critical to successfully constrain the bulge intrinsic shape. We let free to vary all the structural parameters of the bulge, disk, and bar in the photometric decomposition of the mock images with GASP2D. For a few galaxies, we found that the level contours of the probability distributions of and obtained at different inclinations did not overlap. We double checked the photometric decomposition of these galaxies and noticed that the ellipticity and/or position angle of their disks were not well fitted by the model. As a matter of fact, we fitted the surface brightness distribution of all these disks with a double-exponential profile and assumed they had the same ellipticity and position angle both in the inner and outer regions. We found that in some cases (e.g., gE0gSbo5) the change in the ellipticity and position angle measured at the break radius was probably due to the fact that there were two distinct structural components (i.e., a lens and a disk) with different geometrical parameters, instead of a single down- or up-bending exponential disk. As a consequence, the adopted photometric model did not exquisitely match the surface brightness distribution of the simulated lenticular remnant. In other cases (e.g., gSbgSdo5), the change was due a moderate degree of granularity observed in the mock images at large galactocentric distances caused by light spots coming from isolated group of stellar particles orbiting the galaxy outskirts. To address these issues, we refined the estimate of and by assuming the average ellipticity and position angle of the galaxy isophotes fitted at large radii with the IRAF444Image Reduction and Analysis Facility is distributed by the National Optical Astronomy Observatory (NOAO), which is operated by the Association of Universities for Research in Astronomy (AURA), Inc. under cooperative agreement with the National Science Foundation. task ellipse (nominal values in Table 5).
5 Bulge intrinsic shape of our CALIFA galaxies
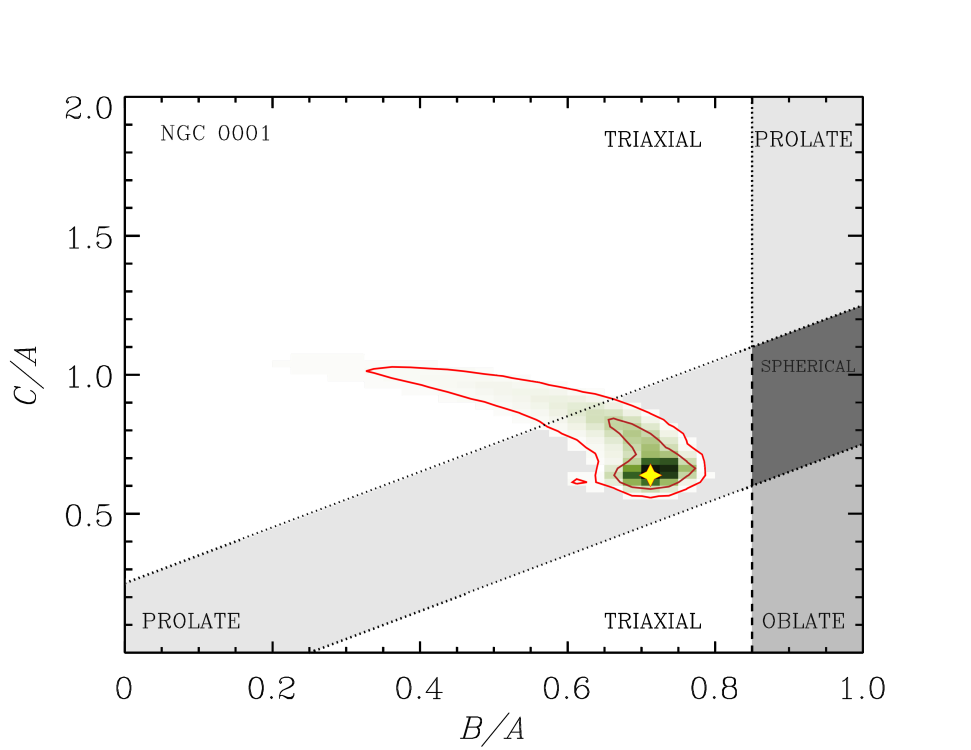
We made use of our statistical method to retrieve the probability distribution of and of the bulges of our CALIFA galaxy sample. The probability distribution of and for the bulge of NGC~1 is shown as an example in Fig. 6, while the most probable values of and of our CALIFA bulges in Fig. 7 and Table 6 and 7.
We derived for each of our CALIFA bulges the projection of the contour along the and axes and adopted the median values of such projections as the uncertainties on the derived values of and . We estimated and , respectively. At this point, we considered as oblate spheroids all the bulges with and (oblate in-plane) or with ¡ 0.85 and 0.75 ¡ ¡ 1.25 (oblate off-plane), as prolate spheroids all the bulges with both and (prolate in-plane) or with and (prolate off-plane), as spherical all the bulges with both and , and as triaxial all the remaining bulges. Spherical bulges will be treated as oblate spheroids in the analysis below.
It is worth noting that 4 of our CALIFA bulges are oblate spheroids off-plane, while there are none prolate spheroids off-plane. Such rare central structures swelling out the disk plane have been recently studied by Corsini et al. (2012), who found a slightly triaxial polar bulge with axial ratios and in NGC~4698. We inspected the probability distribution of our 4 bulges and found that they presented a great scatter compatible also with being triaxial, as expected. Therefore, due to the peculiarity and the great uncertainty in the properties and formation mechanisms of polar bulges, they should be considered as a particular kind of bulges and not include them in the main groups described in the forthcoming analysis. Thus, the final sample of our CALIFA bulges comprises 79 objects (41 in unbarred galaxies and 38 in barred galaxies).
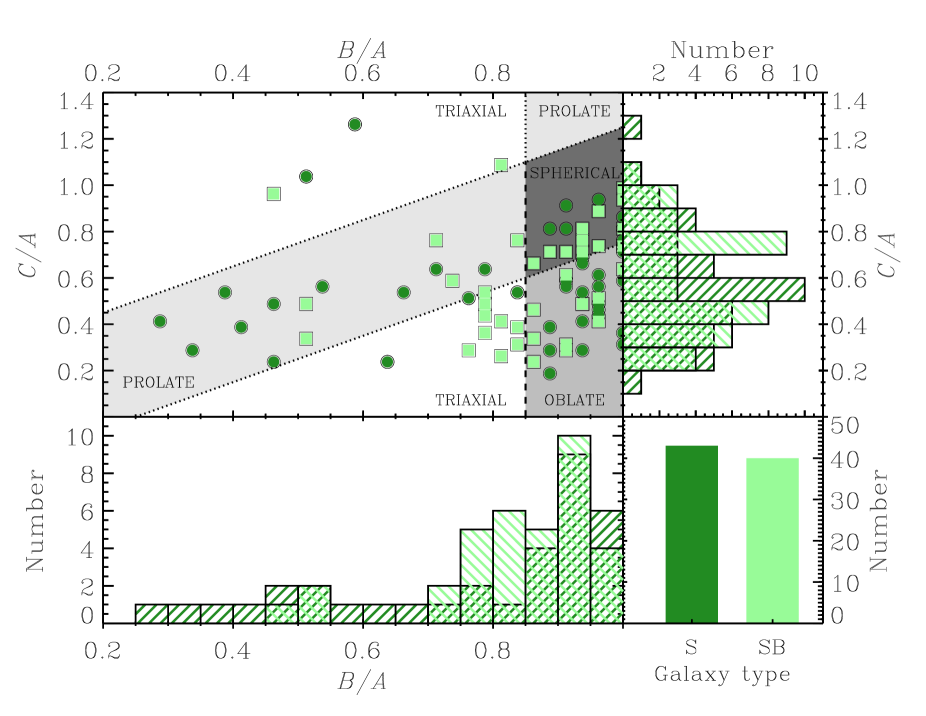
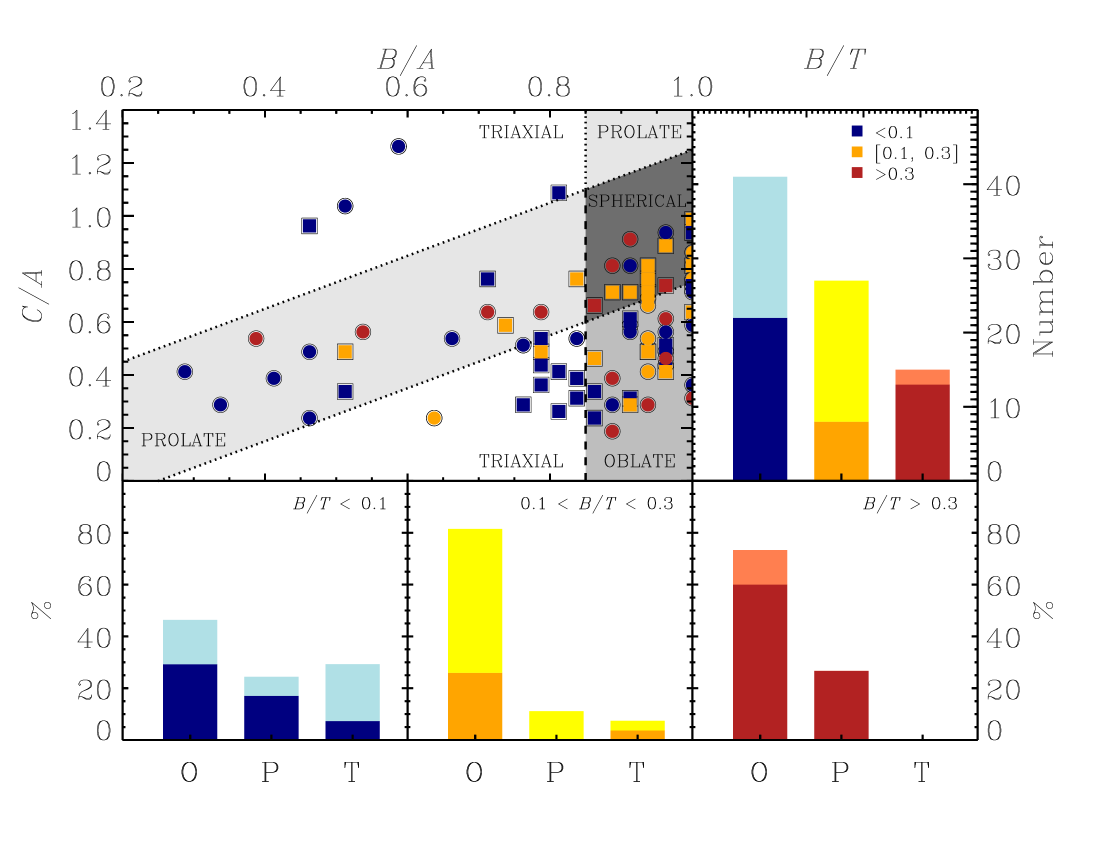
We distinguished all different bulges intrinsic shapes (oblate, prolate, or triaxial) in the new diagram according to the properties of their host galaxies. As a general behaviour, we found that most of our CALIFA bulges tend to be oblate (), with a smaller fraction of prolate () or triaxial bulges (). The majority of triaxial bulges are in barred galaxies (). The and distribution peaks at and , respectively.
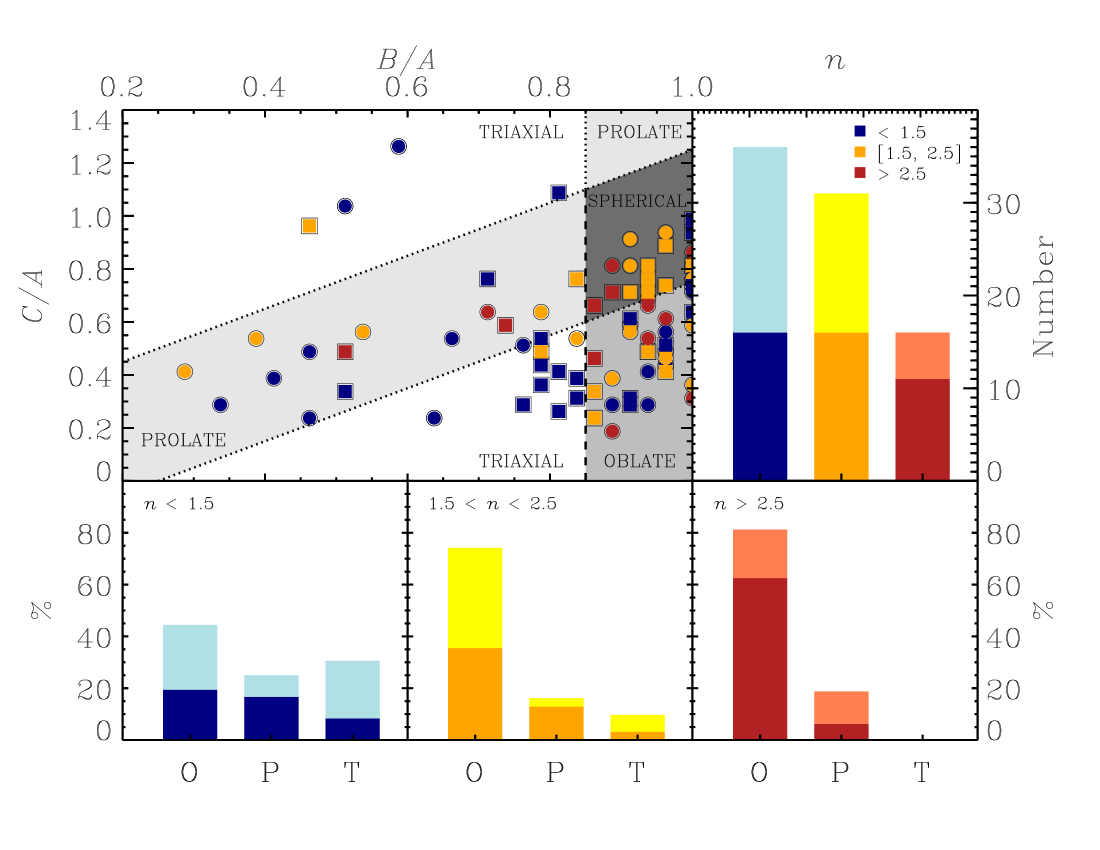
We divided our CALIFA bulges according to their Sérsic index in the bins , , and (Fig. 8). The vast majority of our bulges () is characterized by a small Sérsic index (). A substantial fraction of bulges with () is observed in unbarred galaxies. The bulges with have a variety of intrinsic shapes, with comparable fractions of triaxial (), oblate (), and prolate bulges (). By contrast, most of the bulges with () and () are oblate. Finally, we noticed that almost all the triaxial bulges show very small values of Sérsic index (). The same trends were seen by dividing our CALIFA bulges in the bins , , and , according to the bulge-to-total luminosity ratio of their host galaxy (Fig. 9). Most of the larger bulges are oblate (74%), while the smaller ones show a variety of intrinsic shapes. We also pointed out that the bulges with small values of intrinsic flattening have systematically small values of and .
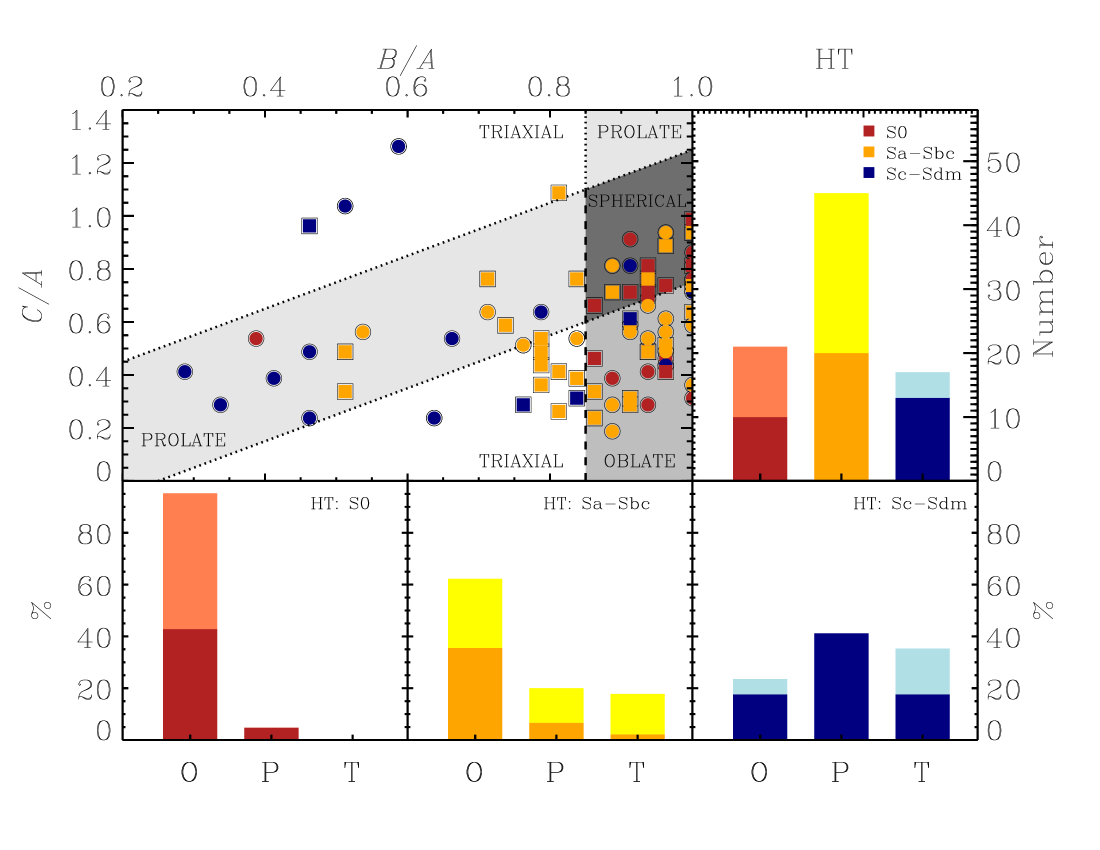
We also analysed the bulge intrinsic shape to highlight possible correlations with the morphology of the host galaxy (Fig. 10). We separated our CALIFA bulges into three bins by taking into account the bulges in S0 galaxies, bulges in Sa, Sab, Sb, and Sbc galaxies, and bulges in Sc, Scd, Sd, and Sm galaxies. Most of the bulges belong to galaxies in the Sa–Sbc bin (56%). Almost all the bulges in S0 galaxies () are oblate, with a different degree of intrinsic flattening . We did not find any triaxial bulge among the S0 galaxies. On the contrary, the bulges of spiral galaxies present a variety of intrinsic shapes, with oblate bulges () dominating the Sa–Sbc bin. Moreover, we noticed that bulges with small values of are more frequently observed in late-type spirals.
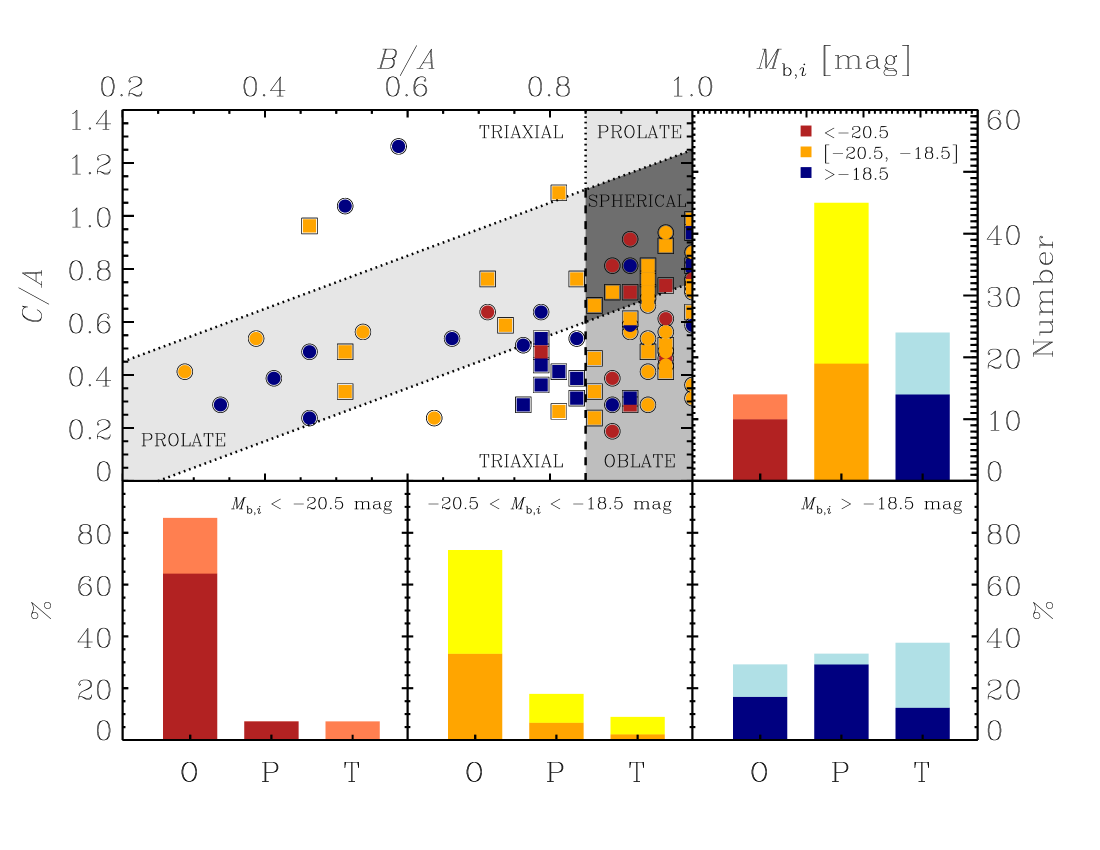
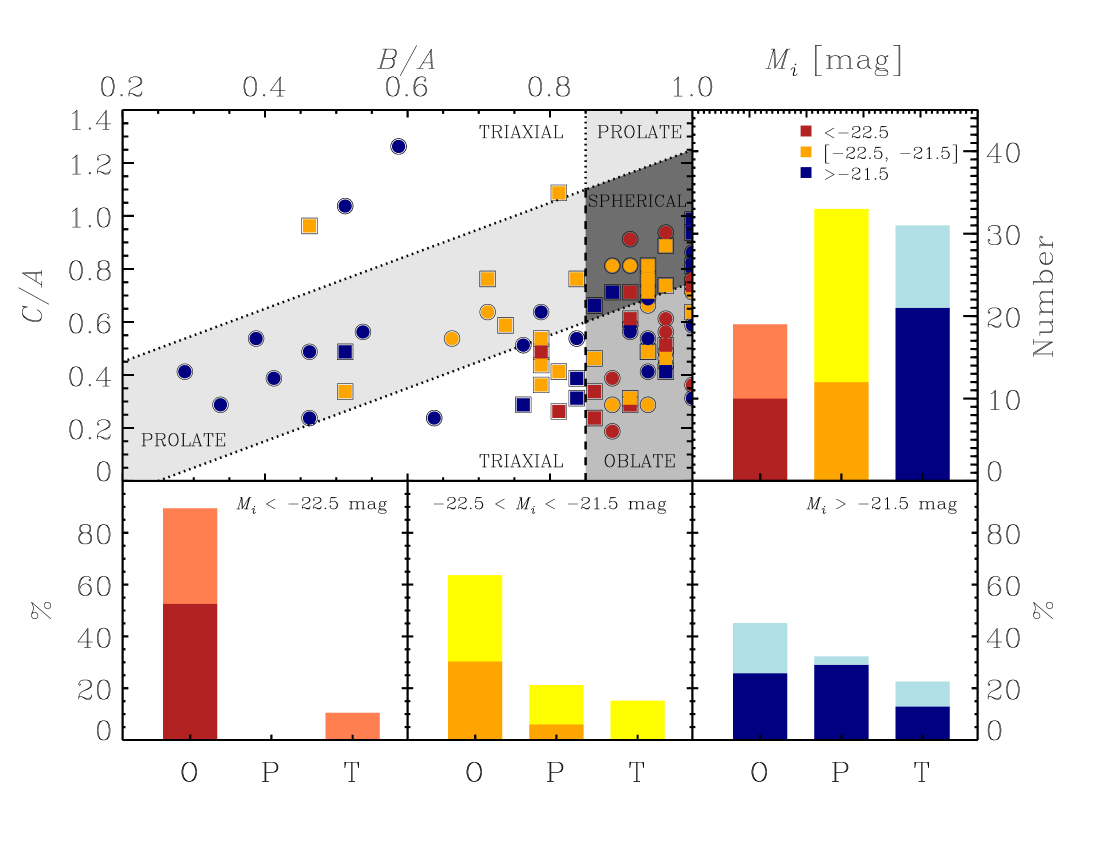
Finally, we studied the bulge intrinsic shape as a function of -band absolute magnitude of the bulge (Fig. 11) and of the host galaxy (Fig. 12). Almost all the most massive bulges ( mag) are oblate (), whereas the less massive one ( mag) are more heterogeneous with a similar fraction of triaxial (), oblate (), and prolate systems (). We obtained the same results when the total galaxy absolute magnitude was examined.
6 Discussion
The statistical analysis presented in this work allowed us to individually constrain the intrinsic shape of a sample of bulges in relation to their observed properties. We projected the (, ) values in order to compare the bulge shape distribution with previous results (see Fig. 7). We found that the mean axial ratio of our CALIFA bulges is and , respectively. This result is in agreement with previous analyses by Bertola et al. (1991b), Fathi & Peletier (2003), and Méndez-Abreu et al. (2008).
Since the cumulative projected distribution mixes all different shapes (oblate, prolate, and triaxial), we preferred to distinguish the properties of our CALIFA bulges in the () diagram. Indeed, the actual position of bulges in the () diagram is a powerful tool for disentangling bulge types. We found that some of our CALIFA bulges (6%) are very flattened oblate systems ( and ), which are possible candidate to be disk-like bulges. Moreover, since barred galaxies are found to host the majority of triaxial bulges, they could be interpreted as the signature of boxy/peanut structures. Indeed, the secular evolution of the bar via buckling or resonants effects is known to result in thick triaxial components. Even the inclusion of the bar in the photometric decomposition can not avoid a mild contamination from boxy/peanut structures. Thus, it is not surprising that barred galaxies show a large fraction of triaxial bulges. It is worth noting that in discussing the shape of the sample bulges obtained from the () diagram, it was considered the statistical meaning of the intrinsic axial ratios we derived and the empiric definition we adopted for the oblate, spherical, prolate, and triaxial bulges. The contour level of the distribution of the intrinsic axial ratios of a bulge can tightly or loosely circle the most probable values of its shape (see Fig. 5, for an example). Therefore, a certain degree of triaxiality is allowed also for the bulges we classified as oblate or prolate. On the other hand, the definition of the boundaries of the regions marking the different bulge shapes in the () diagram might be very conservative.
These results are consistent with a major role of a certain mechanism in the buildup of the most massive bulges (usually identified by higher , higher , earlier types, more massive systems) which has not significantly contributed to those forming the less massive ones (usually identified by lower , lower , later types and in less massive galaxies). Some evolutionary mechanisms may have taken place in all mass ranges similarly (such as internal secular evolution or cluster-related processes), but it is obvious from these results that there are some specific processes that have contributed much more in the most massive bulges to make them more homogeneous in shape (i.e., all oblate) than in the bulges with lower masses. These processes must impose over others and have occurred more frequently in massive systems than in less massive ones, as well as they have also contributed to increase and in the galaxy at the same time, i.e., they must transform the system towards an earlier type.
In the less massive bulges, the interplay of different evolutionary mechanisms can explain the wide variety of shapes, as they can be more or less relevant in a galaxy depending on its evolutionary history and environment. However, the presence of the bar seems to drive the evolution of low-mass triaxial bulges. Indeed, triaxial bulges are mostly hosted in barred galaxies with low values of , , and . These bulges could be contaminated by the residual light of the low-inclined counterparts of boxy/peanut structures. The lack of triaxial bulges in lenticular barred galaxies could be explained by the larger mass of their bulges: their deep potential well seems to reshape the central region into a more axisymmetric structure, where the bar has a marginal role in perturbing the bulge. Thus, the bulge mass could play a role also in driving the evolution of bulges in barred galaxies.
Many studies report observational evidence on a major role of both major and minor merging and dissipative collapse in the buildup of the most massive galaxies (e.g., Rudick et al., 2009; Eliche-Moral et al., 2010; Thomas et al., 2010; Kaviraj et al., 2011; Bernardi et al., 2011; Méndez-Abreu et al., 2012; Barway et al., 2013; Prieto et al., 2013; Morelli et al., 2016; Leja et al., 2015; Prieto & Eliche-Moral, 2015). Numerical simulations have shown that gas-poor major and minor mergers tend to introduce some triaxiality in bulges that originally were spheroidal (Cox et al., 2006; Tapia et al., 2014). However, the bulges of dry minor-merger remnants also exhibit higher rotational support at their centers, even though the global rotational support of the galaxy decreases, making the bulge more oblate (Tapia et al., 2014). This happens because part of the orbital angular momentum of the encounter is transferred to the inner regions (see Eliche-Moral et al., 2006, 2011), contributing to the flattening of the material at the galaxy center. High gas amounts in the progenitors only contribute to make the remnant more axisymmetric (Jesseit et al., 2007), so the trend of dry mergers to make remnant bulges more oblate can be extrapolated to wet ones. Therefore, our results would be consistent with a higher relevance of merging in the formation and evolution of the most massive bulges.
7 Conclusions
We derived the intrinsic shape of 83 bulges of a sample of nearby galaxies from CALIFA DR3. To this aim we applied the statistical method by Méndez-Abreu et al. (2008) to the structural parameters obtained by Méndez-Abreu et al. (2017) with a two-dimensional photometric decomposition of the SDSS -band images of the sample galaxies.
We made use of a set of simulated galaxies resulting from merger experiments, that closely resembling lenticular galaxies, to test the reliability of the method by Méndez-Abreu et al. (2008). For each simulated lenticular remnant, we created a set of mock SDSS -band images at different galaxy inclinations to mimic the observing setup of SDSS images of CALIFA DR3 galaxies. We performed a two-dimensional photometric decomposition of all the mock images applying the same procedure as for real galaxies, in order to retrieve the geometrical parameters of bulge and disk which we used to recover the bulge intrinsic shape. The probability distributions of the axial ratios and obtained for different inclinations for the same simulated lenticular remnant overlap at level. We concluded that the adopted method allows us to successfully constrain the bulge intrinsic shape when the galaxy inclination is . We also realized that a very accurate photometric decomposition is mandatory to retrieve the bulge intrinsic shape and that a galaxy inclination of returns the tightest constraints on the intrinsic axial ratios and of the bulge.
We divided our CALIFA bulges according to their intrinsic axial ratios and into oblate (in-plane or off-plane), prolate (in-plane or off-plane), and triaxial. We looked for possible correlations between the intrinsic shape of our bulges and some of the basic properties of their host galaxies (i.e., Sérsic index of the bulge , bulge-to-total luminosity ratio , Hubble type HT, -band absolute magnitude of the bulge , and -band absolute magnitude of the galaxy ) as derived by Méndez-Abreu et al. 2017. Our analysis pointed out that bulges with a small value of or could be equally axisymmetric or triaxial ellipsoids, while most of the bulges with large values of or are mostly oblate spheroids. Moreover, less massive bulges and bulges in late-type galaxies presented heterogeneous intrinsic shapes, while more massive bulges and bulges in lenticular galaxies are mostly oblate. Finally, we found the majority of triaxial bulges in barred galaxies.
We concluded that merging events and dissipative collapse could be responsible of driving the formation and evolution of our most massive bulges, although other physical mechanisms, i.e., the internal secular evolution caused by the presence of the bar, may be acting at the same time. The coexistence of different pathways is more clear in less massive bulges, where the bar seems to reshape low-mass triaxial bulges. In this context, the role of simulations result crucial in unveiling various evolution pathways in nearby galaxies. Nevertheless, very few numerical studies have focused on the bulge evolution and in particular on the intrinsic shape. Thus, our results imposed further limitations on forthcoming numerical simulations and may help to disentangle different formation scenarios.
Acknowledgements.
We would like to thank the anonymous referee for the suggestions that helped us to improve the way we presented our results. This work is supported by Padua University through grants 60A02-4434/15, DOR1699945, and DOR1715817. E.M.C. and L.M. acknowledge financial support from Padua University through grants BIRD164402/16 an CPS0204, respectively. J.M.A. want to thank the support of this work by the Spanish Ministerio de Economia y Competitividad (MINECO) under the grant AYA2013-43188-P. L.C. thanks the IAC for hospitality while this paper was in progress. We would also like to acknowledge I. Chilingarian, P. Di Matteo, F. Combes, A.-L. Melchior, and B. Semelin for creating the GalMer database, and the HORIZON project for supporting it (http://www.projet-horizon.fr/\-rubrique3.html). This research made use of Sloan Digital Sky Survey (SDSS) data (http://www.sdss.org) and NASA/IPAC Extragalactic Database (NED) (http://ned.ipac.caltech.edu/).References
- Abazajian et al. (2009) Abazajian, K. N., Adelman-McCarthy, J. K., Agüeros, M. A., et al. 2009, ApJS, 182, 543
- Aguerri et al. (2001) Aguerri, J. A. L., Balcells, M., & Peletier, R. F. 2001, A&A, 367, 428
- Aguerri et al. (2009) Aguerri, J. A. L., Méndez-Abreu, J., & Corsini, E. M. 2009, A&A, 495, 491
- Andredakis et al. (1995) Andredakis, Y. C., Peletier, R. F., & Balcells, M. 1995, MNRAS, 275, 874
- Athanassoula (2005) Athanassoula, E. 2005, MNRAS, 358, 1477
- Athanassoula & Beaton (2006) Athanassoula, E. & Beaton, R. L. 2006, MNRAS, 370, 1499
- Balcells et al. (2007) Balcells, M., Graham, A. W., & Peletier, R. F. 2007, ApJ, 665, 1104
- Barway et al. (2013) Barway, S., Wadadekar, Y., Vaghmare, K., & Kembhavi, A. K. 2013, MNRAS, 432, 430
- Benítez et al. (2013) Benítez, E., Méndez-Abreu, J., Fuentes-Carrera, I., et al. 2013, ApJ, 763, 136
- Bernardi et al. (2011) Bernardi, M., Roche, N., Shankar, F., & Sheth, R. K. 2011, MNRAS, 412, L6
- Bertelli et al. (1994) Bertelli, G., Bressan, A., Chiosi, C., Fagotto, F., & Nasi, E. 1994, A&AS, 106
- Bertola et al. (1991a) Bertola, F., Bettoni, D., Danziger, J., et al. 1991a, ApJ, 373, 369
- Bertola & Capaccioli (1975) Bertola, F. & Capaccioli, M. 1975, ApJ, 200, 439
- Bertola & Galletta (1979) Bertola, F. & Galletta, G. 1979, A&A, 77, 363
- Bertola et al. (1991b) Bertola, F., Vietri, M., & Zeilinger, W. W. 1991b, ApJ, 374, L13
- Borlaff et al. (2014) Borlaff, A., Eliche-Moral, M. C., Rodríguez-Pérez, C., et al. 2014, A&A, 570, A103
- Bournaud (2016) Bournaud, F. 2016, in Galactic Bulges, ed. E. Laurikainen, R. Peletier, & D. Gadotti (Springer, Berlin), 355
- Brooks & Christensen (2016) Brooks, A. & Christensen, C. 2016, in Galactic Bulges, ed. E. Laurikainen, R. Peletier, & D. Gadotti (Springer, Berlin), 317
- Bruzual & Charlot (2003) Bruzual, G. & Charlot, S. 2003, MNRAS, 344, 1000
- Carter (1978) Carter, D. 1978, MNRAS, 182, 797
- Ceverino et al. (2015) Ceverino, D., Dekel, A., Tweed, D., & Primack, J. 2015, MNRAS, 447, 3291
- Chabrier (2003) Chabrier, G. 2003, PASP, 115, 763
- Chilingarian et al. (2010) Chilingarian, I. V., Di Matteo, P., Combes, F., Melchior, A.-L., & Semelin, B. 2010, A&A, 518, A61
- Coelho & Gadotti (2011) Coelho, P. & Gadotti, D. A. 2011, ApJ, 743, L13
- Combes & Sanders (1981) Combes, F. & Sanders, R. H. 1981, A&A, 96, 164
- Corsini et al. (2012) Corsini, E. M., Méndez-Abreu, J., Pastorello, N., et al. 2012, MNRAS, 423, L79
- Costantin et al. (2017) Costantin, L., Méndez-Abreu, J., Corsini, E. M., et al. 2017, A&A, 601, A84
- Cox et al. (2006) Cox, T. J., Dutta, S. N., Di Matteo, T., et al. 2006, ApJ, 650, 791
- Dekel et al. (2009) Dekel, A., Sari, R., & Ceverino, D. 2009, ApJ, 703, 785
- Di Matteo et al. (2008) Di Matteo, P., Bournaud, F., Martig, M., et al. 2008, A&A, 492, 31
- Di Matteo et al. (2007) Di Matteo, P., Combes, F., Melchior, A.-L., & Semelin, B. 2007, A&A, 468, 61
- Eggen et al. (1962) Eggen, O. J., Lynden-Bell, D., & Sandage, A. R. 1962, ApJ, 136, 748
- Eliche-Moral et al. (2006) Eliche-Moral, M. C., Balcells, M., Aguerri, J. A. L., & González-García, A. C. 2006, A&A, 457, 91
- Eliche-Moral et al. (2011) Eliche-Moral, M. C., González-García, A. C., Balcells, M., et al. 2011, A&A, 533, A104
- Eliche-Moral et al. (2010) Eliche-Moral, M. C., Prieto, M., Gallego, J., et al. 2010, A&A, 519, A55
- Erwin (2015) Erwin, P. 2015, ApJ, 799, 226
- Erwin & Debattista (2013) Erwin, P. & Debattista, V. P. 2013, MNRAS, 431, 3060
- Erwin et al. (2015) Erwin, P., Saglia, R. P., Fabricius, M., et al. 2015, MNRAS, 446, 4039
- Fathi & Peletier (2003) Fathi, K. & Peletier, R. F. 2003, A&A, 407, 61
- Ferrers (1877) Ferrers, N. M. 1877, Quart. J. Pure Appl. Math, 14, 1
- Freeman (1970) Freeman, K. C. 1970, ApJ, 160, 811
- Gadotti (2009) Gadotti, D. A. 2009, MNRAS, 393, 1531
- Hopkins et al. (2012) Hopkins, P. F., Kereš, D., Murray, N., Quataert, E., & Hernquist, L. 2012, MNRAS, 427, 968
- Illingworth (1977) Illingworth, G. 1977, ApJ, 218, L43
- Jesseit et al. (2007) Jesseit, R., Naab, T., Peletier, R. F., & Burkert, A. 2007, MNRAS, 376, 997
- Kauffmann (1996) Kauffmann, G. 1996, MNRAS, 281, 487
- Kaviraj et al. (2011) Kaviraj, S., Tan, K.-M., Ellis, R. S., & Silk, J. 2011, MNRAS, 411, 2148
- Kormendy (2016) Kormendy, J. 2016, in Galactic Bulges, ed. E. Laurikainen, R. Peletier, & D. Gadotti (Springer, Berlin), 431
- Kormendy & Kennicutt (2004) Kormendy, J. & Kennicutt, Jr., R. C. 2004, ARA&A, 42, 603
- Krajnović et al. (2011) Krajnović, D., Emsellem, E., Cappellari, M., et al. 2011, MNRAS, 414, 2923
- Laurikainen et al. (2014) Laurikainen, E., Salo, H., Athanassoula, E., Bosma, A., & Herrera-Endoqui, M. 2014, MNRAS, 444, L80
- Laurikainen et al. (2005) Laurikainen, E., Salo, H., & Buta, R. 2005, MNRAS, 362, 1319
- Leja et al. (2015) Leja, J., van Dokkum, P. G., Franx, M., & Whitaker, K. E. 2015, ApJ, 798, 115
- Lindblad (1956) Lindblad, B. 1956, StAn, 19
- Lotz et al. (2008) Lotz, J. M., Jonsson, P., Cox, T. J., & Primack, J. R. 2008, MNRAS, 391, 1137
- Lütticke et al. (2000) Lütticke, R., Dettmar, R.-J., & Pohlen, M. 2000, A&A, 362, 435
- Méndez-Abreu (2016) Méndez-Abreu, J. 2016, in Galactic Bulges, ed. E. Laurikainen, R. Peletier, & D. Gadotti (Springer, Berlin), 15
- Méndez-Abreu et al. (2012) Méndez-Abreu, J., Aguerri, J. A. L., Barrena, R., et al. 2012, A&A, 537, A25
- Méndez-Abreu et al. (2008) Méndez-Abreu, J., Aguerri, J. A. L., Corsini, E. M., & Simonneau, E. 2008, A&A, 478, 353
- Méndez-Abreu et al. (2014) Méndez-Abreu, J., Debattista, V. P., Corsini, E. M., & Aguerri, J. A. L. 2014, A&A, 572, A25
- Méndez-Abreu et al. (2017) Méndez-Abreu, J., Ruiz-Lara, T., Sánchez-Menguiano, L., et al. 2017, A&A, 598, A32
- Méndez-Abreu et al. (2010) Méndez-Abreu, J., Simonneau, E., Aguerri, J. A. L., & Corsini, E. M. 2010, A&A, 521, A71
- Mihos & Hernquist (1994) Mihos, J. C. & Hernquist, L. 1994, ApJ, 437, 611
- Moffat (1969) Moffat, A. F. J. 1969, A&A, 3, 455
- Morelli et al. (2016) Morelli, L., Parmiggiani, M., Corsini, E. M., et al. 2016, MNRAS, 463, 4396
- Morelli et al. (2008) Morelli, L., Pompei, E., Pizzella, A., et al. 2008, MNRAS, 389, 341
- Naab et al. (2014) Naab, T., Oser, L., Emsellem, E., et al. 2014, MNRAS, 444, 3357
- Oser et al. (2012) Oser, L., Naab, T., Ostriker, J. P., & Johansson, P. H. 2012, ApJ, 744, 63
- Peng et al. (2002) Peng, C. Y., Ho, L. C., Impey, C. D., & Rix, H.-W. 2002, AJ, 124, 266
- Prieto & Eliche-Moral (2015) Prieto, M. & Eliche-Moral, M. C. 2015, MNRAS, 451, 1158
- Prieto et al. (2013) Prieto, M., Eliche-Moral, M. C., Balcells, M., et al. 2013, MNRAS, 428, 999
- Querejeta et al. (2015a) Querejeta, M., Eliche-Moral, M. C., Tapia, T., et al. 2015a, A&A, 573, A78
- Querejeta et al. (2015b) Querejeta, M., Eliche-Moral, M. C., Tapia, T., et al. 2015b, A&A, 579, L2
- Rodríguez & Padilla (2013) Rodríguez, S. & Padilla, N. D. 2013, MNRAS, 434, 2153
- Rudick et al. (2009) Rudick, C. S., Mihos, J. C., Frey, L. H., & McBride, C. K. 2009, ApJ, 699, 1518
- Ryden (2004) Ryden, B. S. 2004, ApJ, 601, 214
- Ryden (2006) Ryden, B. S. 2006, ApJ, 641, 773
- Sánchez et al. (2016) Sánchez, S. F., García-Benito, R., Zibetti, S., et al. 2016, A&A, 594, A36
- Sandage (1990) Sandage, A. 1990, JRASC, 84, 70
- Sandage et al. (1970) Sandage, A., Freeman, K. C., & Stokes, N. R. 1970, ApJ, 160, 831
- Semelin & Combes (2002) Semelin, B. & Combes, F. 2002, A&A, 388, 826
- Sérsic (1968) Sérsic, J. L. 1968, Atlas de Galaxias Australes (Observatorio Astronomico de Cordoba, Cordoba)
- Sil’chenko (2013) Sil’chenko, O. K. 2013, AN, 334, 781
- Sil’chenko et al. (2012) Sil’chenko, O. K., Proshina, I. S., Shulga, A. P., & Koposov, S. E. 2012, MNRAS, 427, 790
- Simonneau et al. (1998) Simonneau, E., Varela, A. M., & Munoz-Tunon, C. 1998, Nuovo Cimento B, 113, 927
- Statler et al. (2001) Statler, T. S., Lambright, H., & Bak, J. 2001, ApJ, 549, 871
- Tapia et al. (2017) Tapia, T., Eliche-Moral, M. C., Aceves, H., et al. 2017, A&A, 604, A105
- Tapia et al. (2014) Tapia, T., Eliche-Moral, M. C., Querejeta, M., et al. 2014, A&A, 565, A31
- Thomas et al. (2010) Thomas, D., Maraston, C., Schawinski, K., Sarzi, M., & Silk, J. 2010, MNRAS, 404, 1775
- Toomre (1977) Toomre, A. 1977, in Evolution of Galaxies and Stellar Populations, ed. B. M. Tinsley & R. B. G. Larson, D. Campbell (Yale University Press, New Haven), 401
- Tremblay & Merritt (1996) Tremblay, B. & Merritt, D. 1996, AJ, 111, 2243
- van den Bosch et al. (2008) van den Bosch, R. C. E., van de Ven, G., Verolme, E. K., Cappellari, M., & de Zeeuw, P. T. 2008, MNRAS, 385, 647
- van der Kruit (1979) van der Kruit, P. C. 1979, A&AS, 38, 15
- Walcher et al. (2014) Walcher, C. J., Wisotzki, L., Bekeraité, S., et al. 2014, A&A, 569, A1
- Weijmans et al. (2014) Weijmans, A.-M., de Zeeuw, P. T., Emsellem, E., et al. 2014, MNRAS, 444, 3340
- Williams & Schwarzschild (1979) Williams, T. B. & Schwarzschild, M. 1979, ApJ, 227, 56
Appendix A
Galaxy [∘] [arcsec] [arcsec] [∘] (1) (2) (3) (4) (5) (6) (7) (8) gE0gSbo5 0 0.8 3.8 9.0 0.95 0.98 90 180 0.8 3.8 9.0 1.00 0.98 32 30 0.9 4.9 9.1 1.00 0.97 19 45 0.9 3.9 9.4 0.86 0.78∗ 4 60 1.0 4.1 9.7 0.78 0.67∗ 1 gE0gSdo5 0 1.0 1.1 8.7 0.80 0.99 6 180 1.0 1.1 8.7 0.80 0.99 6 30 0.9 1.2 8.7 0.90 0.90∗ 23 45 0.9 1.3 8.9 0.81 0.83∗ 18 60 0.8 1.5 9.1 0.64 0.70∗ 7 gSbgSbo9 0 1.3 3.5 10.9 0.72 0.97 90 180 1.3 3.5 10.9 0.72 0.97 90 30 1.2 3.8 11.0 0.78 0.87 63 45 1.1 4.2 11.3 0.81 0.74 42 60 1.1 4.9 11.6 0.73 0.57 18 gSbgSdo5 0 2.3 3.6 18.0 0.83 0.99 58 180 2.4 4.0 18.1 0.84 0.99 59 30 2.3 3.8 18.0 0.82 0.92 29∗ 45 2.2 3.6 17.4 0.75 0.82 21∗ 60 2.1 3.5 17.4 0.64 0.67 12∗ 555(1) Identifier of the simulated lenticular remnant. (2) Galaxy inclination. (3) Effective radius of the bulge. (4) Sérsic index of the bulge. (5) Scale length of the disk. (6), (7) Apparent axial ratio of the bulge and disk, respectively. (8) Difference of the position angles of bulge and disk. Nominal values are marked with ∗.
Galaxy [∘] [arcsec] [arcsec] [∘] (1) (2) (3) (4) (5) (6) (7) (8) gS0dS0o99 0 7.0 1.1 18.9 0.60 0.97 59 180 7.0 1.1 19.2 0.60 0.96 82 30 6.8 1.1 18.9 0.59 0.89 33 45 6.6 1.1 18.8 0.57 0.76 18 60 6.3 1.1 18.5 0.53 0.59 11 gS0dSao103 0 7.7 1.5 22.1 0.54 0.97 20 180 7.8 1.5 22.1 0.54 0.98 20 30 7.4 1.5 21.6 0.56 0.93 46 45 6.9 1.6 21.5 0.60 0.80 47 60 6.2 1.6 21.1 0.63 0.63 37 gS0dSdo106 0 7.7 1.1 24.1 0.46 0.93 83 180 7.7 1.0 24.1 0.46 0.93 83 30 7.4 1.1 22.2 0.46 0.92 36 45 6.8 1.0 21.2 0.45 0.77 20 60 8.3 1.3 30.1 0.43 0.59 9 gS0dSdo100 0 7.9 1.6 26.3 0.53 0.93 73 180 7.9 1.6 26.3 0.53 0.93 74 30 7.9 1.6 24.9 0.50 0.91 13 45 8.0 1.7 25.1 0.47 0.76 4 60 8.3 1.7 25.7 0.44 0.56 1
Galaxy [∘] [arcsec] [arcsec] [∘] (1) (2) (3) (4) (5) (6) (7) (8) gS0dE0o98 0 7.8 1.1 21.5 0.49 0.90 9 180 7.9 1.1 21.6 0.49 0.91 13 30 7.4 1.1 21.7 0.52 0.82 30 45 6.8 1.2 21.9 0.54 0.70 26 60 6.4 1.2 22.4 0.54 0.53 19 gS0dE0o99 0 7.8 1.1 20.8 0.49 0.99 16 180 7.8 1.1 20.7 0.49 0.97 16 30 6.7 1.1 18.5 0.56 0.91 7 45 5.9 1.2 18.5 0.66 0.89 54 60 4.9 1.2 18.7 0.76 0.66 40 gS0dE0o100 0 8.0 1.1 21.2 0.48 0.85 1 180 8.0 1.1 21.1 0.47 0.87 1 30 7.3 1.2 20.9 0.53 0.87 38 45 6.6 1.2 22.1 0.59 0.74 44 60 5.8 1.2 22.9 0.65 0.56 31
Appendix B

Appendix C
Galaxy ) (1) (2) (3) (4) (5) (6) (7) (8) NGC 0001 10.6 0.79 0.02 127 3 0.64 0.01 94 1 0.71 0.64 NGC 0160 10.9 0.71 0.02 50 4 0.508 0.003 48.4 0.2 0.96 0.61 NGC 0237 10.2 0.45 0.02 47 3 0.60 0.01 178 1 0.29 0.41 NGC 0234 10.6 0.92 0.02 77 4 0.861 0.003 76.8 0.2 1.00 0.71 NGC 0257 10.8 0.68 0.01 96 2 0.621 0.008 94.1 0.6 0.96 0.44 NGC 0496 10.3 0.86 0.05 46 5 0.57 0.01 33.4 0.8 0.91 0.81 NGC 0677 10.9 0.92 0.01 31 2 0.820 0.008 171.2 0.6 0.91 0.91 NGC 0873 10.2 0.63 0.01 129 2 0.840 0.008 140.2 0.6 0.66 0.54 NGC 1070 10.8 0.97 0.02 28 4 0.814 0.003 1.5 0.2 0.96 0.94 NGC 1094 10.6 0.76 0.03 97 4 0.688 0.008 93.1 0.4 0.96 0.49 NGC 1349 10.8 0.95 0.02 98 3 0.88 0.01 98 1 1.00 0.76 NGC 1665 10.5 0.80 0.01 54 2 0.559 0.008 48.1 0.6 0.94 0.69 NGC 2476 10.5 0.71 0.02 144 4 0.664 0.003 148.7 0.2 0.96 0.46 IC 2341 10.8 0.55 0.03 5 4 0.533 0.008 1.8 0.4 0.94 0.29 NGC 2592 10.3 0.80 0.01 58 2 0.803 0.008 57.9 0.6 1.0 0.31 NGC 2916 10.5 0.82 0.02 7 4 0.651 0.003 15.0 0.2 0.94 0.66 NGC 3106 11.0 0.96 0.01 144 2 0.901 0.008 135.3 0.6 1.00 0.81 NGC 3158 11.6 0.78 0.01 70 2 0.868 0.008 71.0 0.6 0.89 0.39 UGC 05520 9.5 0.34 0.03 112 4 0.53 0.02 100 1 0.46 0.24 UGC 07012 9.1 0.43 0.05 159 5 0.58 0.01 13.8 0.8 0.34 0.29 IC 0776 9.3 0.64 0.05 40 5 0.54 0.01 91.2 0.8 0.46 0.49 NGC 4711 10.3 0.66 0.03 48 4 0.476 0.008 41.9 0.4 0.84 0.54 NGC 5376 … 0.72 0.02 59 4 0.577 0.003 65.3 0.2 0.91 0.56 UGC 09110 10.1 0.65 0.02 19 3 0.44 0.01 21 1 0.94 0.54 NGC 5732 9.9 0.72 0.05 39 5 0.57 0.01 40.1 0.8 1.00 0.59 NGC 5772 10.8 0.80 0.01 38 2 0.531 0.008 36.9 0.6 1.00 0.74 NGC 6060 10.8 0.51 0.01 100 2 0.435 0.008 100.4 0.6 1.00 0.36 NGC 6155 10.1 0.45 0.03 118 4 0.707 0.008 146.6 0.4 0.41 0.39 NGC 6301 10.8 0.63 0.03 110 4 0.603 0.008 109.6 0.4 1.00 0.36 NGC 6314 11.1 0.51 0.02 173 3 0.56 0.01 175 1 0.89 0.19 NGC 7047 10.7 0.52 0.03 111 4 0.491 0.008 107.0 0.4 0.89 0.29 UGC 12224 9.9 0.56 0.02 103 3 0.84 0.01 34 1 0.51 1.04 IC 5309 10.2 0.41 0.03 14 4 0.50 0.02 26 1 0.64 0.24 NGC 7653 10.5 0.89 0.02 20 3 0.84 0.01 164 1 0.89 0.81 NGC 7782 11.1 0.71 0.01 179 2 0.556 0.008 176.5 0.6 0.96 0.56 NGC 5481 10.3 0.93 0.02 114 4 0.738 0.003 114.8 0.1 1.00 0.86 UGC 09708 10.1 0.81 0.05 138 6 0.76 0.04 151 3 0.91 0.59 UGC 01370 10.6 0.55 0.05 156 5 0.43 0.01 156.5 0.8 0.94 0.41 NGC 5145 9.9 0.58 0.01 88 2 0.807 0.008 56.0 0.6 0.54 0.56 MCG 0152012 10.3 0.47 0.02 86 3 0.80 0.01 43 1 0.39 0.54 UGC 09837 9.1 0.61 0.05 31 5 0.81 0.01 137.7 0.8 0.59 1.26 NGC 2526 10.2 0.68 0.05 142 5 0.51 0.01 130.9 0.8 0.76 0.51 MCG 0922053 9.4 0.79 0.05 93 5 0.77 0.01 127.9 0.8 0.79 0.64
Galaxy ) (1) (2) (3) (4) (5) (6) (7) (8) NGC 0171 10.4 0.73 0.02 124 3 0.885 0.004 97.6 0.3 0.71 0.76 NGC 0309 10.7 0.88 0.03 136 3 0.894 0.007 108.4 0.3 0.91 0.61 NGC 0364 10.6 0.88 0.05 45 6 0.73 0.01 33.3 0.7 0.93 0.76 NGC 0551 10.6 0.64 0.05 126 6 0.44 0.01 135.9 0.7 0.78 0.53 NGC 0842 10.8 0.64 0.02 137 3 0.525 0.004 145.1 0.3 0.86 0.46 NGC 1666 10.5 0.88 0.02 138 3 0.880 0.004 147.5 0.3 0.96 0.41 NGC 1667 10.7 0.57 0.03 171 3 0.687 0.007 172.1 0.3 0.81 0.26 UGC 03253 10.4 0.65 0.05 92 6 0.60 0.01 78.4 0.7 0.78 0.43 NGC 2486 10.6 0.83 0.04 85 5 0.591 0.009 90.7 0.5 0.93 0.76 UGC 04145 10.6 0.60 0.05 135 6 0.50 0.01 138.2 0.7 0.93 0.48 NGC 2572 10.9 0.59 0.07 126 13 0.43 0.02 137.4 0.9 0.51 0.33 NGC 2880 10.4 0.79 0.02 129 3 0.571 0.003 143.2 0.1 0.86 0.66 NGC 3381 9.6 0.70 0.05 80 6 0.83 0.01 45.2 0.7 0.76 0.28 NGC 4185 10.6 0.67 0.02 173 3 0.666 0.004 167.0 0.3 0.91 0.31 NGC 4210 10.3 0.75 0.02 78 3 0.731 0.004 94.1 0.3 0.83 0.38 NGC 4961 9.6 0.67 0.04 111 5 0.692 0.009 99.9 0.5 0.83 0.31 NGC 5056 10.6 0.58 0.05 97 6 0.55 0.01 179.4 0.7 0.46 0.96 NGC 5157 11.1 0.73 0.05 114 6 0.78 0.01 105.7 0.7 0.91 0.28 NGC 5473 10.6 0.92 0.01 137 2 0.787 0.003 155.0 0.1 0.93 0.81 IC 0994 11.1 0.78 0.05 19 6 0.51 0.01 14.6 0.7 0.91 0.71 NGC 5602 10.5 0.83 0.08 163 8 0.52 0.03 167 2 1.00 0.81 NGC 5720 10.8 0.82 0.05 125 6 0.65 0.01 129.2 0.7 1.00 0.73 NGC 5735 10.1 0.78 0.05 73 6 0.90 0.01 32.6 0.7 0.78 0.36 UGC 09492 11.1 0.65 0.05 47 6 0.45 0.01 54.2 0.7 0.78 0.48 IC 4534 10.7 0.65 0.04 158 5 0.564 0.009 162.9 0.5 0.93 0.48 NGC 5888 11.2 0.69 0.04 154 5 0.596 0.009 153.2 0.5 0.96 0.51 UGC 09777 10.2 0.95 0.05 129 5 0.61 0.02 145.9 0.9 1.00 0.93 NGC 6278 10.7 0.81 0.02 123 3 0.531 0.004 126.8 0.3 0.96 0.73 NGC 6941 10.9 0.68 0.05 118 6 0.72 0.01 130.5 0.7 0.86 0.23 UGC 11649 10.4 0.82 0.05 132 6 0.86 0.01 71.8 0.7 0.81 1.00 NGC 7321 10.9 0.63 0.05 15 6 0.65 0.01 22.2 0.7 0.86 0.33 UGC 12185 10.5 0.71 0.05 141 5 0.46 0.02 155.0 0.9 0.73 0.58 NGC 7591 10.7 0.85 0.05 167 6 0.48 0.01 148.4 0.7 0.83 0.76 NGC 7671 10.7 0.83 0.02 142 3 0.596 0.004 135.1 0.3 0.93 0.71 NGC 7716 10.3 0.51 0.04 56 5 0.822 0.008 39.4 0.4 0.51 0.48 UGC 04455 10.9 0.73 0.08 174 8 0.74 0.03 11 2 0.81 0.41 NGC 6977 10.9 0.94 0.05 171 6 0.83 0.01 152.7 0.7 0.96 0.88 UGC 12250 11.1 0.78 0.04 13 5 0.626 0.009 12.7 0.5 1.00 0.63 NGC 5947 10.6 0.88 0.04 39 5 0.811 0.009 63.7 0.5 0.88 0.71 NGC 2767 10.8 1.00 0.04 178 5 0.733 0.009 169.6 0.5 1.0 0.98