Spectroscopy of excited states of unbound nuclei 30Ar and 29Cl
Abstract
Several states of proton-unbound isotopes 30Ar and 29Cl were investigated by measuring their in-flight decay products, 28S+proton+proton and 28S+proton, respectively. A refined analysis of 28S-proton angular correlations indicates that the ground state of 30Ar is located at MeV above the two-proton emission threshold. The theoretical investigation of the 30Ar ground state decay demonstrates that its mechanism has the transition dynamics with a surprisingly strong sensitivity of the correlation patterns of the decay products to the two-proton decay energy of the 30Ar ground state and the one-proton decay energy as well as the one-proton decay width of the 29Cl ground state. The comparison of the experimental 28S-proton angular correlations with those resulting from Monte Carlo simulations of the detector response illustrates that other observed 30Ar excited states decay by sequential emission of protons via intermediate resonances in 29Cl. Based on the findings, the decay schemes of the observed states in 30Ar and 29Cl were constructed. For calibration purposes and for checking the performance of the experimental setup, decays of the previously-known states of a two-proton emitter 19Mg were remeasured. Evidences for one new excited state in 19Mg and two unknown states in 18Na were found.
pacs:
23.50.+z, 25.10.+s, 27.30.+tI Introduction
Two-proton (2p) radioactivity is an exotic nuclear decay mode resulting in the simultaneous emission of two protons. It was proposed for the first time by Goldansky in the early 1960s Goldansky1960NP . In this pioneering work, simultaneous two-proton emission was predicted to appear in the even-proton number () isotopes beyond the proton drip-line, in which one-proton (1p) emission is energetically prohibited but the ejection of two protons is energetically allowed due to the pairing interaction. More than 40 years after its prediction, ground-state radioactivity was discovered in 2002 Pfutzner2002EPJA ; Giovinazzo2002PRL . Two experiments independently observed that the ground state (g.s.) of 45Fe decays by simultaneous emission of two protons. Later 54Zn Blank2005PRL , 19Mg Mukha2007PRL , 48Ni Pomorski2011PRC , and 67Kr Goigoux2016PRL were found to be other g.s. 2p radioactive nuclei.
Among the g.s. 2p emitters hitherto observed, the half-lives of 45Fe, 48Ni, and 54Zn are in the range of several ms, which can be accessed by the conventional implantation-decay method. In the case of 19Mg, whose half-life was predicted in the range from a few ps to a few ns Grigorenko2003PRC , a technique based on particle tracking of decays in flight (see details in Ref. Mukha2010PRC ) was applied in order to investigate its decay properties. In this experiment, the trajectories of 2p decay products of 19Mg were measured by double-sided silicon micro-strip detectors. The 2p-decay vertices and fragment correlations were reconstructed. The 2p decay energy and half-life of 19Mg g.s. were determined, which represented the first case of 2p radioactivity in - shell nuclei Mukha2007PRL . In a recent work Voss2014PRC , the half-life of 2p decay of 19Mg g.s. was measured by another experimental technique, the extracted half-life value is consistent with the first measurements.
After the discovery of 2p radioactivity several theoretical efforts were dedicated to predictions of the 2p radioactivity landscape. In a systematic study of lifetime dependencies on the decay energy and three-body correlations applied to a number of isotopes by using a three-body model Grigorenko2003PRC , dozens of prospective true 2p emitters were predicted. Among these candidates, 19Mg, 48Ni, and 54Zn have been proven to be indeed true 2p emitters. In a recent study, the global landscape of g.s. 2p radioactivity has been quantified by the energy density functional theory Olsen2013PRL . The main conclusion of this work is that 2p-decaying isotopes exist in almost every isotopic chain between elements Ar and Pb, which indicates that g.s. 2p radioactivity is a typical feature for the proton-unbound isotopes with even atomic numbers. Those theoretical predictions provide guidance for the experimental search of 2p radioactive nucleus. For instance, 30Ar was predicted to be an - shell true 2p emitter by the three-body model Grigorenko2003PRC . The prediction for the 30Ar g.s. half-life was ps and the predicted separation energies were MeV and MeV, respectively. Considering its short lifetime, the in-flight decay method was applied. Several states in 30Ar and its 1p-decay daughter nucleus 29Cl were investigated. The observation of 30Ar and 29Cl low-lying states, including their g.s., was reported in Ref. Mukha2015PRL . The assigned ground and first excited states of 29Cl were found at MeV and MeV above the threshold, respectively. The g.s. of 30Ar was found to be at MeV above the 2p emission threshold Mukha2015PRL . A sophisticated data analysis together with theoretical investigations revealed that the g.s. of 30Ar is located at MeV above the 2p emission threshold Golubkova2016PLB . Due to a strong Thomas-Ehrman shift, the lowest states in 30Ar and 29Cl point to a violation of isobaric mirror symmetry in the structure of these unbound nuclei. Detailed investigations of the decay mechanism of the 30Ar ground state show that it is located in a transition region between simultaneous 2p decay and sequential emission of protons. Such an interplay between the true three-body and the sequential two-body decay mechanism is the first-time observation for nuclear ground state decays. For the first excited state of 30Ar, the hint on so-called fine structure in the 2p decay was obtained by detecting two decay branches either into the ground state or first excited state of 28S Mukha2015PRL .
Besides the g.s. and first excited states, several higher-lying excited states of 30Ar and 29Cl were also populated in this experiment. The present manuscript describes the details of the experiment and reports the first spectroscopy of observed excited states. The structure of the present manuscript is organized in the following way. To begin with, the experimental setup is introduced with the emphasis on the employed special ion-optic settings. Then the nuclear structure information on several observed states of the known 2p emitter 19Mg is presented. Afterwards, the detailed analysis of the angular correlations between decay products and the extraction of the decay properties of several excited states of 30Ar as well as 29Cl is described. Finally, discussions on the transition dynamics of 30Ar g.s. decays and the decay mechanisms of observed excited states of 30Ar are presented.
II Experiment
The 30Ar experiment was performed at the Fragment Separator (FRS) Geissel1992NIMB at GSI (Darmstadt, Germany). The FRS was operated with ion-optical settings in a separator-spectrometer mode. The primary 885 MeV/u 36Ar beam with an intensity up to impinged on a 8 9Be production target. The 620 MeV/u 31Ar fragments with an average intensity of 50 were selected as a secondary beam and transported by the first half of the FRS to bombard a 9Be reaction target located at the middle focal plane F2 of the FRS. The thickness and the transverse dimension of the reaction target is 4.8 and , respectively. At the first focal plane F1 of the FRS, an aluminum wedge degrader was installed in order to achieve an achromatic focusing of 31Ar at the reaction target. 30Ar nuclei were produced via one-neutron (1n) knockout from the 31Ar ions. The decay products of 30Ar were tracked by a double-sided silicon micro-strip detector array placed just downstream of the reaction target. The projectile-like outgoing particles from the reaction target were analyzed by the second half of the FRS, which was operated as a magnetic spectrometer. The magnet settings between the focal planes F2 and F4 were tuned to transmit the targeted heavy ion (HI) fragments (e.g., 28S) down to the last focal plane F4.
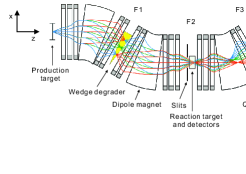
The above-mentioned operation mode of the FRS requires a special ion-optical setting. Since the transverse dimensions of the reaction target and the tracking detectors are small, a focused secondary beam is required in order to have a small beam spot on the reaction target. Such a requirement was fulfilled by employing a wedge-shaped aluminum degrader to compensate the momentum deviation (from the reference particle) of the secondary beam. The thickness of the degrader along the optical axis was 5 and the wedge angle was 194 mrad. Fig. 1 shows the ion-optical setting of the FRS used in the experiment, which was calculated with the code GICOSY Berz1987NIMA ; GICOSY . The colored lines show the trajectories of 31Ar ions at three different energies, each at five different angles after production by fragmenting a 36Ar beam on the 9Be production target. By combining the ion-optical elements of the FRS (dipole magnets and quadrupole magnets) and the energy loss in the degrader, the optical system TA–F2 was tuned to spatially separate the 31Ar fragment beam from other fragments and to provide an achromatic image at the middle focal plane F2. The horizontal (X) slits at F1 (not shown in Fig. 1) and F2 were employed to assist in rejecting the unwanted ions at F2. The second half of the FRS was operated in a dispersive mode and the 28S ions were transmitted as the centered beam down to F4, where the full Particle IDentification (PID) in A and Z can be performed. The transmission properties of the FRS may be described by the calculated longitudinal momentum () and angular acceptance. For the section TA–F2, the momentum acceptance () was limited by closing the slits at F1 to . The corresponding angular acceptance in the horizontal plane (X plane) was mrad, while the angular acceptance in the vertical plane (Y plane) was mrad. For a beam between F2 and F4, the momentum acceptance was and the angular acceptance was mrad in both X and Y planes.
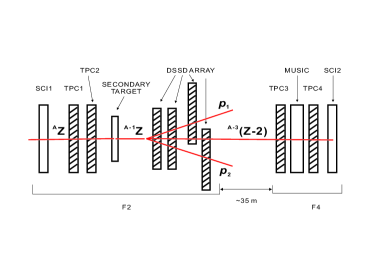
The detectors employed in the present experiment are sketched in Fig. 2. The locations of tracking detectors were mainly at the FRS middle focal plane, F2. Two Time-Projection Chambers (TPC1 and TPC2) were used to track the positions of incoming 31Ar (or 20Mg) projectiles. A double-sided silicon micro-strip detector (DSSD) array, which consists of four large-area DSSDs Stanoiu2008NIMB was employed to measure hit coordinates of the two protons and the recoil heavy ion (28S or 17Ne) resulting from the in-flight 2p decay. The high-precision position measurement by DSSDs allowed us to reconstruct fragment trajectories and to derive the decay vertex together with angular HI-proton and proton-proton correlations. In the second half of the FRS, the heavy ions arriving at the final focal plane of the FRS F4 were unambiguously identified by their magnetic rigidity , time-of-flight (TOF), and energy deposition . The of the ion was determined from the FRS magnet setting and the ion’s position measured with TPCs. The TOF for the ion traveling from F2 to F4 was measured by using the scintillator SCI1 at F2 and scintillator SCI2 at F4. Then the ion’s velocity () can be deduced from its TOF. Once the is obtained, the mass-to-charge ratio () can be determined by using the following equation
| (1) |
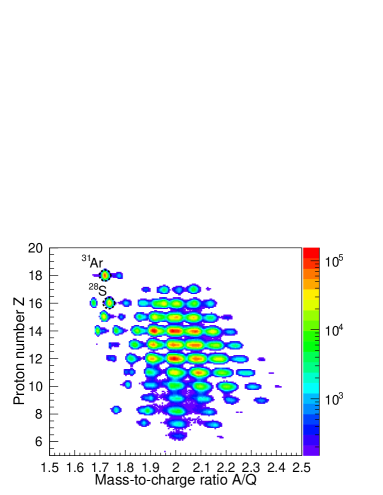
where is the electron charge, is the speed of light, is the atomic mass unit, is the ion’s velocity in unit of (), is the Lorentz factor (). Given the fact that the energy deposition () of the HI in the MUltiple Sampling Ionizing Chamber (MUSIC) is nearly proportional to the square of the ion’s charge , the can be calculated form the measured by the MUSIC detector. At the high energies used in the present experiment (several hundred MeV/u), most of ions are fully stripped, thus we assume . Therefore, the HI’s proton number can be determined from measurements. By plotting the distribution of versus , the identification of HI can be achieved since each isotope has a unique combination of and . Fig. 3 shows a two-dimensional PID plot for the ions which reached F4. In this plot, each nuclide occupies a unique position according to its proton number and mass-to-charge ratio. Therefore, the heavy ion of interest can be identified unambiguously. The ions of interest including 28S and 31Ar are well separated from other species and they are highlighted by the circles.
For each identified 28S nucleus, the coincident protons were identified by registering their impact position in several DSSD’s and by requiring a “straight-line” trajectory in the analysis. Afterwards, several conditions and thresholds were applied in order to identify the 28S+p+p coincidence. The procedure can be divided into three steps. First, the trajectories of protons and of 28S were reconstructed by using the coordinates measured by DSSDs. Second, the closest approach between proton trajectory and 28S ion trajectory was measured and tested by checking whether it is a vertex for a 28S + p double coincidence. Third, the difference between the Z coordinates of two vertices (Zdiff) derived from two 28S + p double coincidences was calculated and the Zdiff was tested by another threshold to identify the triple coincidence. If a triple coincidence was identified, an 30Ar 2p decay event was assumed to be found. The detailed description of the search procedure for the 2p decay events can be found in Ref. Xu2016thesis .
III Investigation of Known Two-Proton Emitter 19Mg
For calibration purposes, the previously-known 2p radioactive nuclei 19Mg were also produced by a knockout reaction from 20Mg ions obtained by fragmenting a 685 MeV/u 36Ar beam. The 2p decay properties of 19Mg were remeasured. By following the same procedure applied in previous studies of 19Mg Mukha2007PRL ; Mukha2010PRC ; Mukha2012PRC , the decay properties of the precursors 19Mg and 30Ar were investigated on the basis of angular correlations between the HI daughter nucleus and the protons. In this section, the angular 17Ne-proton correlations obtained from 2p decays of 19Mg are described. Based on the measured trajectories of 17Ne and two protons which were emitted by the 2p decay of 19Mg, the angle between the 17Ne and proton’s trajectories () as well as the angle between both protons’ trajectories () can be obtained. The corresponding 17Ne-p angular correlations were reconstructed for all coincidences. Fig. 4(a) shows the scatter plot (, ) for the measured angles between 17Ne and both protons. Since the two protons cannot be distinguished, the distribution is symmetrized with respect to proton permutations, and proton indexes are given for illustration purpose only. In this angular correlation plot, there are several intensity enhancements which provide the information on the 2p states in 19Mg and 1p resonances in 18Na.
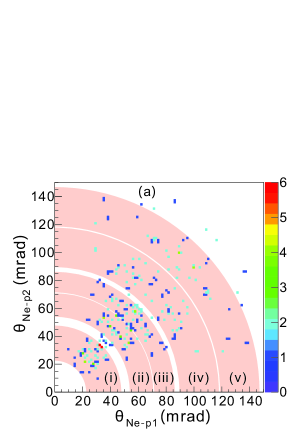
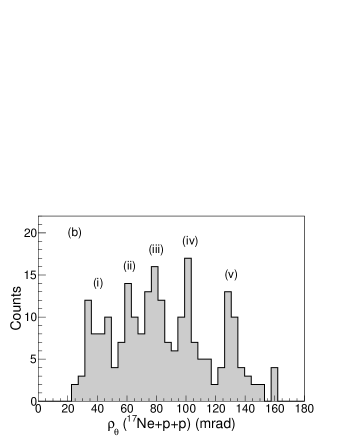
In order to better reveal the decay properties from the measured 17Ne-proton angular correlations shown in Fig. 4 (a), one may use the fact that the two protons emitted by one state of 19Mg share the total decay energy. Thus correlations from 2p decays of the same narrow state are accumulated along the arc with the radius
Since is related to the energy sum of both emitted protons and therefore to the of the parent state by the relation Mukha2012PRC , one can obtain the indication of the parent state and its 2p-decay energy by studying the distribution of . The spectrum has a few peaks which allow us to select specific excitation-energy regions for the investigation. In the present study, the distribution measured for 19Mg 2p decays is displayed in Fig. 4 (b). Several well-separated intense peaks, which indicate the 2p decays of various states in 19Mg, are clearly seen and labeled by Roman numerals. The peak in Fig. 4 (b) corresponds to the arc in Fig. 4 (a) labeled with the same Roman numeral. By gating on a particular peak, the decay events from a certain 19Mg state can be selected. In the following, the states observed in 19Mg will be investigated by comparing the measured 17Ne-p angular correlations with the Monte Carlo (MC) simulations of the detector response.
III.1 Reference case: 1p and 2p decays of known states in 18Na and 19Mg
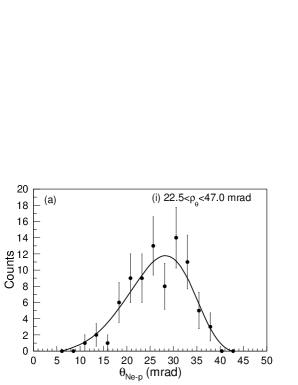
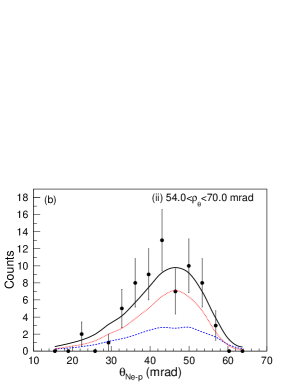
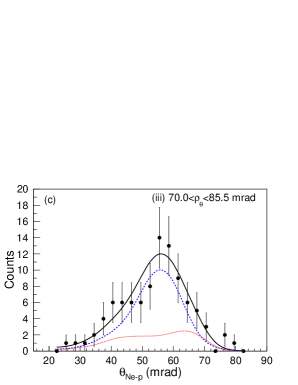
By comparing the angular correlations [Fig. 4(a)] with those obtained in the previous experiment (see Figure 2(c) in Ref. Mukha2012PRC ), it was found that several known states of 19Mg including its g.s. and several low-lying excited states were observed in the present experiment. They are shown by the peaks and arcs (i), (ii), (iii), and (iv) in Fig. 4. In order to quantitatively interpret the 17Ne-p angular correlations obtained from the decays of these known states, MC simulations were performed by assuming the simultaneous 2p decay of the 19Mg g.s. and the sequential 2p decay of 19Mg excited states via low-lying 18Na states. The simulated distributions were compared with the data obtained by choosing events with the gates (i), (ii), (iii), and (iv) indicated in Fig. 4 (b). The corresponding results are shown in the panels (a), (b), (c) and (d) of Fig. 5, respectively. One can see that the simulations reproduce the data well. The deduced 2p-decay energy () of the g.s. shown in (i) is MeV, which is consistent with the previous result of 0.76(6) MeV Mukha2012PRC . The deduced values of the excited state (ii) and excited state (iv) are MeV and MeV, respectively, which agree within the errors with the previous data on the respective states at 2.14(23) MeV and 5.5(2) MeV Mukha2012PRC . The determined for the broad peak (iii) is MeV, which matches the previously-measured states at 2.9(2) and 3.6(2) MeV. However, these two states cannot be resolved in the present experiment.
III.2 Hints to so far unknown 1p- and 2p- unbound states in 18Na and 19Mg
In Fig. 4(b), besides the known excited states of 19Mg shown by the peaks (ii), (iii), and (iv), evidence on a new excited state of 19Mg is displayed by the peak (v) which is located around mrad. The corresponding versus distribution is shown by the arc (v) in Fig. 4(a). One can see that most events fall into several clusters which indicate sequential emission of protons from one excited state of 19Mg via intermediate resonances of 18Na. It is worth mentioning that the hints to sequential proton emission from such an unknown excited state of 19Mg can be also found in the experimental spectrum obtained from a previous study of 19Mg (see Fig. 2(c) of Mukha2012PRC ). Despite the low counts, the peak (v) and multiple-cluster structure in the corresponding arc (v) are quite evident, which may be attributed to a different detection scheme being applied thus leading to a better signal to noise ratio in the present experiment. The angular spectrum obtained by imposing the arc gate (v) ( mrad) is shown by the black dots in Fig. 5(e). Such a multiple peak structure cannot be described by a sequential 2p decay via any previously-known 18Na state because the characteristic pattern generated from 1p decay of the known state in 18Na does not fit any peak shown in Fig. 5(e). In order to interpret such experimental spectrum, the existence of two new 18Na levels has to be assumed.
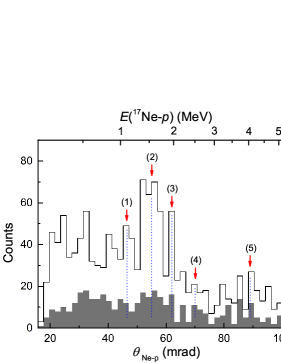
The hints of two new states expected for 18Na can be found in Fig. 6, which displays the comparison of angular correlations obtained from the measured and coincidences in the present experiment. In the former case, parent 18Na states may be populated via several possible reactions on 20Mg, while the latter distribution is presumably due to the 2p emission from 19Mg states. Five peaks (1-5) which coexist in both histograms suggest the states of 18Na. According to the previous knowledge on the angular correlations obtained from the decays of known 18Na states Mukha2012PRC , the peaks 1-3 correspond to the the 18Na states at 1.23 MeV, 1.55 MeV, and 2.084 MeV, respectively. The peaks 4 and 5 provide indications of two unknown excited states in 18Na, which are located at 2.5 MeV and 4.0 MeV above the 1p threshold, respectively.
The two above-discussed new states in 18Na provide a possible explanation for the observed distribution shown in Fig. 5(e), i.e., such a 17Ne-proton angular correlations may originate from the decays of a previously unknown excited state in 19Mg by sequential emission of protons via the above-mentioned two 18Na excited states To verify such a tentative assignment, MC simulations were performed. By varying the decay energies and lifetimes of 19Mg state and 18Na levels, we found that the simulation of sequential emission of protons from the 19Mg excited state at MeV via the excited states of 18Na at MeV and MeV can reproduce the data. The corresponding two components are displayed by the dashed and dotted curves in Fig. 5(e), respectively. The summed fit generally agrees with the data. In particular, the multiple-peak structure of the experimental pattern is reasonably described. The energy level of 18Na around 2.5 MeV has been predicted in a theoretical work Fortune2007PRC . Given the fact that the limited amount of 19Mg 2p decay events identified in the present experiment provides only hints of a new 19Mg excited state and two new 18Na excited states, future experiments with improved conditions (e.g., better statistics) are desirable.
IV Spectroscopy of States Observed in 30Ar and 29Cl
IV.1 28S-proton angular correlations
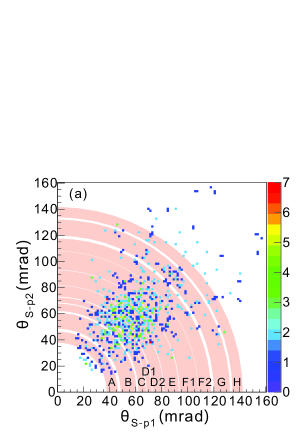
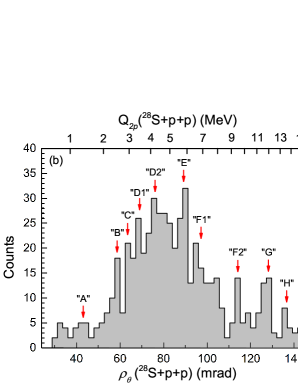
As described in Sec. II, the decays of 30Ar were identified by tracking the coincident trajectories. Following a similar procedure to that conducted for 2p decays of 19Mg, we measured the angles between the decay products of 30Ar (i.e., and ) and then reconstructed the 28S-proton angular correlations as well as the decay vertices. The scatter plot of versus for all identified coincidences is shown in Fig. 7(a). Here proton indexes are given for illustration purposes only. Several intensity enhancements can be observed in this angular correlation plot, and they indicate on the 2p states in 30Ar and 1p resonances in 29Cl. The arcs labeled “A-H” in Fig. 7(a) correspond to peaks in the spectrum shown in Fig. 7(b), where As demonstrated in the previous chapter, the distribution is helpful in order to identify the states of 30Ar and to discriminate transitions of interest. In Fig. 7(b), the peaks labeled “A-H” suggest several states in 30Ar, and the corresponding arcs in Fig. 7(a) illustrate the 28S-proton angular correlation patterns. These arcs and peaks demonstrate the first observation of 2p decays from several states of the nucleus 30Ar. In order to deduce the nuclear structure information on these states and investigate their decay properties, careful analysis of patterns and detailed theoretical calculations as well as MC simulations were performed.
IV.2 distributions of states observed in 30Ar
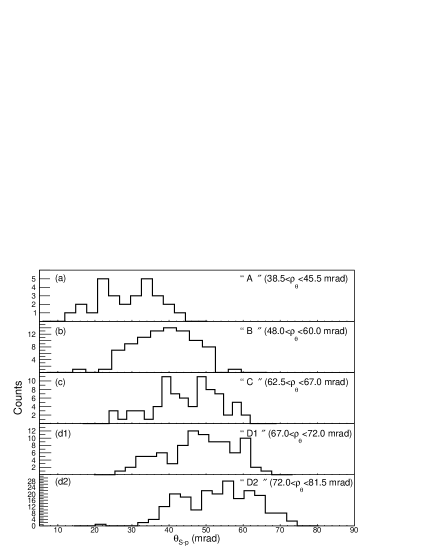

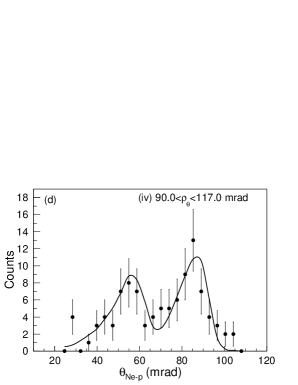
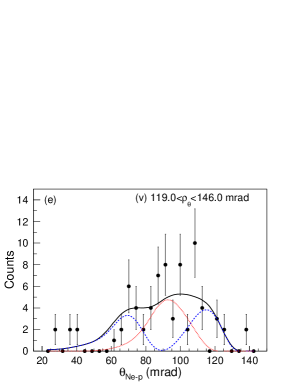
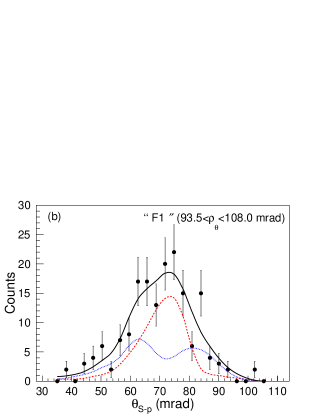
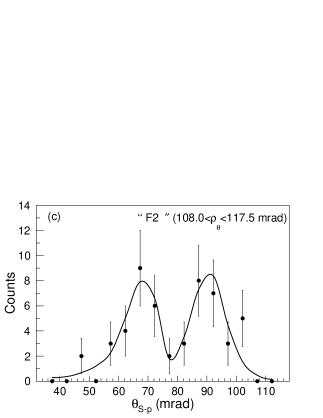
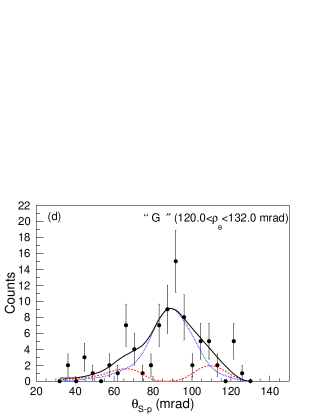
Since the distributions reflect energy spectra of protons emitted from the 2p decay of 30Ar states, they provide insight into the decay mechanisms of the parent states. The pattern of the distribution carries information on the decay branches of the 30Ar state. Fig. 8 displays the spectra obtained from the measured coincidences which are selected by imposing the gates “A”, “B”, “C”, “D1”, “D2”, “E”, “F1”, “F2”, “G”, and “H” shown in Fig. 7. The proton spectrum of a simultaneous 2p decay of a state exhibits a relatively broad peak which corresponds to the half of the total 2p-decay energy In the case of the sequential emission of protons, a typical double-peak structure appears in the proton spectrum, and the two peaks are related to the decay energies of two 1p decays, i.e., one peak is located at the decay energy of the intermediate state of 1p-decay daughter nucleus () and the other peak is located around the 1p-decay energy of the mother nucleus (i.e., ). Moreover, multiple-peak structures may also be present in the proton spectrum, which indicate two or more decay branches. Therefore, one can obtain hints of the decay mechanism on the basis of the angular distribution. In the case of 30Ar, one can see in Fig. 8 that except the state “B”, all other 30Ar states show two or more peaks, which indicate a sequential decay mechanism. Concerning peak “B”, the angular 28S-proton spectrum presents a relatively broad peak which is almost twice more wide than that expected for a simultaneous 2p decay. On the other hand, the spectrum does not point to a sequential 2p emission, where the typical double-peak structure appears. Such an unexpected pattern was carefully studied in our previous work Mukha2015PRL . There, the peak “B” has been assigned to the g.s. of 30Ar. Its decay mechanism was identified in a transition region between simultaneous 2p decay and sequential emission of protons. The peak “C” was regarded as the first excited state of 30Ar. The decay of this state presents the first hint of a fine structure in the 2p decay, which provides the natural interpretation of the peak “A” and peak “C” Mukha2015PRL . In the present work, we will discuss the excited states of 30Ar with decay energies higher than that of the peak “C” and deduce their decay properties and decay mechanisms. Regarding the state “H” which is located at about 15 MeV above the 2p threshold, we will not discuss it further due to a few decay events observed from this state. Before investigating the 2p decay properties of the 30Ar states, the states of its 1p decay daughter nucleus 29Cl must be studied.
IV.3 Decay energies of low-lying 29Cl states
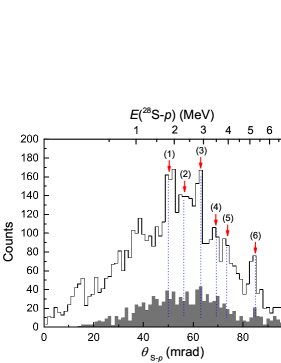
As shown in Ref. Mukha2015PRL , the comparison of the distribution obtained from the measured double coincidence and that from triple coincidences provide some guidance on the states in 29Cl, which were populated in the experiment. Such a comparison is displayed in Fig. 9. In the case (the unfilled histogram in Fig. 9), the 29Cl states may be populated via several possible reactions on 31Ar, e.g., the two-step reaction followed by , or via the direct fragmentation Concerning the spectrum obtained from the coincidence (grey-filled histogram in Fig. 9), population of 29Cl states are presumably due to the 2p emission from 30Ar states. Therefore, one may expect that the peaks in both distributions indicate the possible 29Cl states. In Fig. 9, several peaks (indicated by arrows) with decent intensities coexist in both spectra, which suggest the possible 29Cl resonances.
Concerning the 1p-decay energies of the 29Cl states indicated by the arrows in Fig. 9, one can deduce their values by employing the approximate linear relation between the and . The energies of the observed 29Cl levels (1-6) are 1.8(1) MeV, 2.3(1) MeV, MeV, MeV, MeV, and MeV, respectively. In order to assign the g.s. of 29Cl, the isobaric symmetry of mirror nuclei was considered, see Sec. V.2.
IV.4 Decay schemes of 30Ar and 29Cl
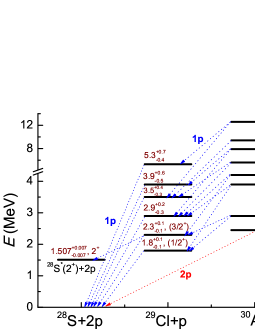
As shown in Fig. 7, several states of 30Ar were populated in the present experiment. The decay energy of observed 30Ar states can be deduced from the distribution shown in Fig. 7(b). The comparison of spectrum obtained from coincidences and that deduced from coincidences suggests several states in 29Cl. By combining these results, we derived a tentative level scheme together with the decay branches for the observed 30Ar and 29Cl states. It is shown in Fig. 10. The g.s. and first excited state of 30Ar and 29Cl have been discussed in the Ref. Mukha2015PRL . The decay scheme of higher excited states is interpreted below.
V Discussion
In the previous section a quite detailed energy level and decay scheme was deduced. Such an assignment is based on the limited kinematic information derived from the angular distributions. The data also have limited statistical significance, which is a common situation for extreme exotic nuclear systems near and beyond the driplines. Therefore, the interpretation of the data is partly based on some speculations, which require detailed explanation. Our interpretation of the data is based on reasonable arguments, which take into account present knowledge. It is self-consistent, no alternative self-consistent interpretation which covers all aspects of the observed picture is achieved. Different issues which one had to elaborate in order to arrive to the interpretation shown in Fig. 10 are discussed in this section. Some of these issues have already been considered in Ref. Mukha2015PRL . All arguments are presented below in a systematic way.
V.1 Signature of 30Ar ground state
Identification of the 29Cl and 30Ar g.s. energies is the most important assignment on which the whole interpretation is based. The low-energy peaks in the 28S- and 28S-- correlations spectra may arise from decay channels populating the excited states of , which are instantaneously de-excited by -emission. In the present experiment the reaction target area was observed by an ancillary -ray detector. With its total registration efficiency of about , this information could be useful for counting rates, say, an order of the magnitude higher than those available for 29Cl and 30Ar.
The candidates for 30Ar g.s. in Fig. 7 are peak “A” at mrad (corresponding to MeV) and peak “B” at mrad (corresponding to MeV). We point to three reasons which make the peak “B” preferable prescription for the 30Ar ground state.
The first argument is connected with a population cross section for the peak “A”. It comprises less than of the total population intensity of all 30Ar states, and this value is unexpectedly low for the ground state. For comparison, one may look at some examples of corresponding values obtained in the nucleon-knockout experiments populating - shell nuclei beyond the dripline. They are: for 19Mg Mukha2007PRL , for 16Ne Brown2015PRC , for 26O Kondo2016PRL . These values and also other examples, which can be found in the literature, vary quite broadly demonstrating strong sensitivity to the individual structure of the precursor nucleus. However, such values never seem to be extremely small.
The second argument is connected with systematics of odd-even energy staggering (OES) and proton correlation pattern for the peak “A”. The OES is defined as
where and are separation energies for two nucleons in the system with mass number and for one nucleon in its subsystem. This can be interpreted as a phenomenological paring energy value computed with the assumption that the structure of the nuclear with mass number is represented by two valence nucleons populating single-particle configurations corresponding to system ground state. It was demonstrated in Fig. 6 of Ref. Mukha2015PRL that the systematics of OES is very similar for the isotone chain leading to 30Ar and its mirror 30Mg isobar. The extrapolated value for 30Ar is MeV. However, it is known that such a systematics breaks near the borderline of the nucleon stability Comay1988PLB . Therefore, the actually expected value of should be a factor smaller.
Several reasonable prescriptions for proton and two-proton decay energies of 29Cl and 30Ar, respectively, are shown in Table 1. By considering the 28S- angular correlations in Fig. 8, the double-peak structure for the 1.4 MeV peak “A” can be interpreted as the result of the sequential emission of two protons with the energies of 0.6 and 0.8 MeV. As far as the emission order of protons is not known, one has to consider both prescriptions for the 29Cl value, which is marked as P1 and P2 in Table 1. Both variants provide the OES values far beyond the range expected from systematics. Let’s assume that the double-peak structure of the - correlations is actually connected with a statistical “staggering” due to low data statistics and in reality a single peak characteristic for “true” emission should exist. Then one should assume the higher reasonable 29Cl g.s. position which value can be found as MeV from Fig. 9. For this prescription, marked as P3, the OES value is somewhat overestimated. If one correlates the 30Ar g.s. with the peak “B” in Fig. 7 (at MeV), and assume MeV (the prescription P4), then the obtained OES value nicely fits the expected range. The relative population intensity of the peak “B” ( of the total) is also reasonably consistent with expectation for the ground state. An additional argument for the choice of MeV prescription comes from systematics of Coulomb displacement energies is described in the next section.
| Expected | P1 | P2 | P3 | P4 | |
|---|---|---|---|---|---|
| (30Ar) | 1.4 | 1.4 | 1.4 | 2.45 | |
| (29Cl) | 0.6 | 0.8 | 1.8 | 1.8 | |
| 0.9–1.6 | -0.2 | 0.2 | 2.2 | 1.15 |
The plausible explanation of the “A” structure at 1.4 MeV is that this is a “fine-structure peak” for emission from the first excited (probably ) state in 30Ar into the first excited state of 28S ( at 1.507 MeV, see Fig. 10). The further discussion of this issue needed for a consistent description of the 29Cl and 30Ar decay schemes (see, Fig. 10) is provided in the Sec. V.4.
V.2 Thomas-Ehrman effect in 29Cl-29Mg
If one assume the single-particle nature of the 29Cl low-lying states, their energies can be reliably evaluated basing on the spectrum of the isobaric mirror partner, the 29Mg nucleus. The g.s. of 29Mg is known to have spin-parity NNDC and it is reasonable to assume the single-particle -wave structure of this state. The first excited state is separated just by 54 keV, see Fig. 11. According to shell model calculations with Brown-Wildenthal USDB Hamiltonian Brown2006PRC , this can be expected to be an -wave state. For such a situation of practically degenerated - and -wave states in 29Mg, one may expect a strong modification of the level scheme due to the Thomas-Ehrman effect Thomas1952PR ; Ehrman1951PR , which can be evaluated by using a simple potential model.
There are two major parameters, which controls the Coulomb displacement energies of nucleons in the potential model: (i) the charge radius of the core nucleus, which is a major characteristic of the charge distribution, and (ii) the radius parameter of the potential, which controls the nucleon orbital size. For the 28S- channel, the Woods-Saxon potential is used with two parameter sets, see Table 2. The first set (P1 and P2 cases) is quite typical for light nuclei, it was also employed in the work on radioactivity Pfutzner2012RMP . The second set (P3–P5) uses potential parameters of a global parameterization destined to obtain single-particle states for shell-model calculations Schwierz2007arXiv . The charge radius of 28S is not known but can be extrapolated using the known values for 32-36S Angeli2013ADNDT , which are in the range 3.26–3.30 fm. We consider the range fm as a realistic value for 28S. For each nuclear potential set we use the upper and lower charge radius values (see Table 2) to define the Coulomb potential of the homogeneously charged sphere of radius by the following expression
where fm is the proton charge radius. The obtained values are in the range MeV, which is consistent with the prescription of MeV for the peak denoted “(1)” in Fig. 9 in order to correspond to 29Cl ground state.
One may evaluate how strongly should one modify the potential model input to obtain MeV or which is required to associate the 1.4 MeV peak “A” with the 30Ar g.s. The P5 case in Table 2 shows how large should be the charge radius of 28S in order to get the value within the above-mentioned range. It is found that a value as large as fm is needed. However, charge radii as large as 5 fm become available for nuclei heavier than neodymium and mass numbers twice larger than that of 30Ar. Thus the decay energies MeV are unrealistic for 29Cl.
| P1 | P2 | P3 | P4 | P5 | |
| , , fm | 1.2, 0.65 | 1.26, 0.662 | |||
| , fm | 3.18 | 3.26 | 3.18 | 3.26 | 5.0 |
| , MeV | |||||
| , MeV | 1.785 | 1.755 | 1.715 | 1.685 | 0.818 |
The 29Mg ground state and the 1.638 keV state (which may be assumed to be according to shell model calculations) belong to a -wave doublet (it will be shown below that the actual situation may be more complicated, see discussion in Sec. V.4). The states with such a structure have considerably larger ( MeV) Coulomb displacement energies in comparison with the -wave state, see Fig. 10, and thus they provide different level ordering in 29Cl compared to 29Mg. Then the prescription for peak “(2)” with MeV, and the prescription for peak “(4)” with MeV are possible as well (see Fig. 9).
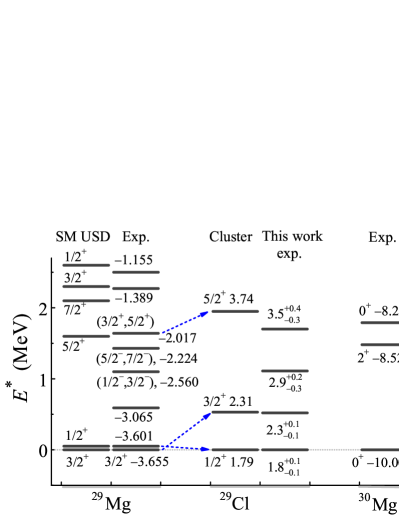
Fig. 10 shows the level scheme of 30Ar compared to that of the isobaric mirror partner 30Mg. There is an important difference in these schemes, which could be an evidence for strong Thomas-Ehrman effect in this isobaric mirror pair as well. Another origin could be a quite specific structure of the first excited state in 30Ar, as it is argued in Sec. V.4.
V.3 Transition dynamics of 30Ar ground state decay
As we have shown above, the assignment of peak “B” in Fig. 7 to 30Ar ground state is plausible from the point of view of different energy systematics. However, the corresponding 28S- angular correlations of this peak [see Fig. 8 (b)] show the pattern which we first found problematic to interpret. There is neither a single narrow “central” peak, typical for “true” emission, nor a double (or other even-number) peak structure associated with the sequential emission of protons. Estimates of Ref. Mukha2015PRL demonstrated that the natural explanation of this fact is connected with the peculiar “transitional” decay dynamics which is exactly on the borderline between “true” and sequential decay. The behavior of physical observables in such a “transitional” region demonstrates features analogous to phase transitions. Namely there is a very high sensitivity of observables to minor variations of parameters. The parameters of nuclear decays are not subject of free variation from outside like in phase transitions considered e.g. in thermodynamics. However, if our system of interest appears to belong to “transitional” decay dynamics case, then strong sensitivity to parameters paves the way to precise determination of parameters (or some of their combinations) based on observables.
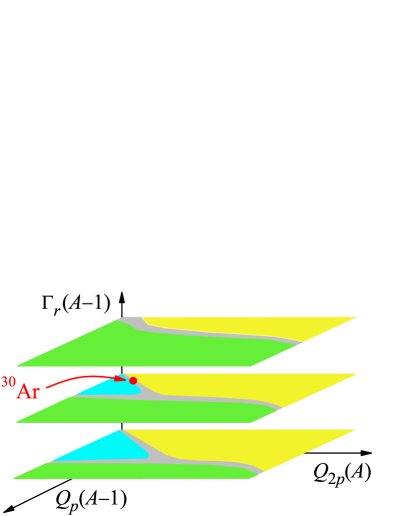
Transitions between different regimes of three-body decays have been discussed in detail in Ref. Golubkova2016PLB . There exist three distinct mechanisms of such decays — “true”, democratic, and sequential — which all are characterized by the distinct pictures of three-body correlations and different systematic of the lifetimes Ref. Pfutzner2012RMP . In the most common case the transitions between these regimes are defined by three parameters: three-body decay energy , two-body decay energy of the ground state in the core- subsystem , and the width of the core- ground state resonance . Qualitative illustration of the transition phenomenon in the three-body systems is provided in Fig. 12.
Based on the direct-decay model which was improved in the content of the present work, theoretical and simulation studies of the 30Ar decay dependence on three general decay parameters have been performed in Golubkova2016PLB . The strong dependence of lifetime systematics in the transition region on the parameter values is illustrated in Fig. 13. The lifetime curves demonstrate a kink at the transition situation. This kink is more expressed for small values of the two-body widths. Different curves are evaluated based on different assumption about proton width of the 29Cl g.s. The gap between lifetime curves is much larger in the true decay part of the plots. This is connected with the fact that the sequential decay width linearly depends on the 29Cl g.s. width, while the true decay width depend on that quadratically. Consequently, a stronger kink for smaller width values is needed to compensate for this effect in the transition region.
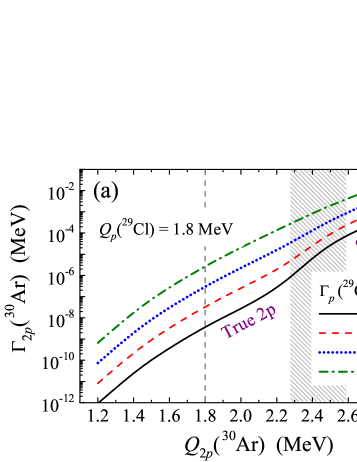
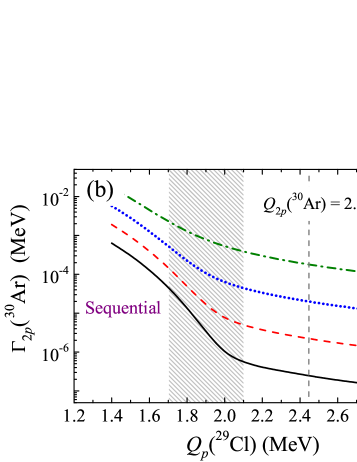
The observables, which were found of considerable practical interest in the context of the present work, are three-body correlations among the heavy fragment and the protons. Fig. 14 (a) displays the calculated energy distributions between the 28S and one of the emitted protons. In the calculations, the resonant energy of 29Cl g.s., is set to 1.8 MeV and the is fixed at 92 keV. One may clearly see that the shape and width of the spectrum profile change dramatically with the variation of , which represents a strong sensitivity of the decay mechanism to the . In the case of small , e.g., 2.35 MeV, the energy distribution between 28S and proton [blue dashed curve in Fig. 14 (a)] is mainly characterized by a bell-like spectrum centered at , which indicates the true 2p decay. In contrast, the spectrum with a bit larger value [e.g., MeV, the green dashed-dotted curve in Fig. 14(a)] is mainly featured by a double-peak pattern (with two peaks at and at ), which typically corresponds to the sequential 2p emission. Therefore, the correlation pattern is extremely sensitive to calculation parameters, where small variations of cause dramatic changes of the shapes of distributions. Similarly, the sensitivity of the energy distribution to was also investigated. The corresponding results are shown in Fig. 14(b). Here 2.45 MeV and 1.8 MeV. With the increase of , an obvious change from a sequential two-body decay case to a true three-body decay situation can be observed.
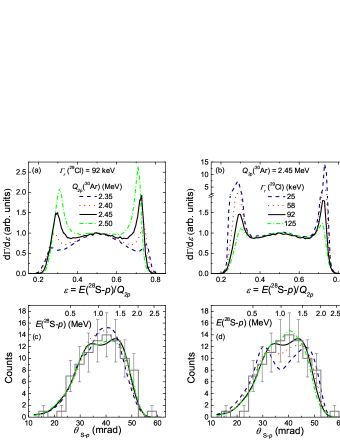
In order to compare the model predictions of the 28S-p angular correlations with the experimental data, Monte Carlo simulations of the detector response to the 2p decay of 30Ar g.s. were performed. The momenta of three decay products used in the simulations were taken from the predictions of the direct decay model Golubkova2016PLB . The corresponding results are shown in panels (c) and (d) of Fig. 14, which illustrate the dependence of the simulated spectrum on and , respectively. In comparison of experimental distribution (grey histogram with statistical uncertainties) and various simulations, the model prediction with MeV and keV (black solid curves in panels (c) and (d) of Fig. 14) reproduces the data.
The sensitivity of energy distributions of decay products to reasonable combinations of the parameters {, , } was systematically investigated in Golubkova2016PLB . A statistical analysis allowed to find the preferable combination of three parameters: MeV and MeV, keV. The result MeV is somewhat different compared to the first-reported value MeV from Ref. Mukha2015PRL , but consistent within the error bars. The determination of the width in an indirect way, based on the 30Ar correlation data, should be regarded as a novel result of the proposed approach.
Three aspects of the current analysis should be emphasized. (i) The current studies were performed based on the data with quite limited statistics. Just fact of such opportunity is already very encouraging. Thus they should be regarded more as a proof-of-concept rather than a final result. It was not evident in advance that differences in the observed patterns would be sufficient to put restrictions on the physical parameters. (ii) It is demonstrated that the method is working even utilizing kinematically very limited information (angular distributions in the (heavy ion)- channel. The application of the method to complete kinematics where the momenta vectors of all outgoing decay products are measured, should produce results of higher precision. (iii) To perform width measurements, standard experiments with quite high statistics are required. For example, the determination of in a standard RIB experiment on resonance scattering of 28S on a hydrogen target would require the availability of a quite intense 28S beam and registration of hundreds or thousands of decay events. The sensitivity of the proposed method even for low statistics can be understood as a result of kind of “quantum amplification”: the observed spectrum is not 29Cl spectrum by itself, but the result of interference of 29Cl decay amplitudes with other amplitudes involved in 30Ar decay.
V.4 Structure of the first excited states in 29Cl and 30Ar
It was mentioned in Sec. V.1 that it could be reasonable to assume that the 1.4 MeV “A” structure in Fig. 8 is connected with emission from the first excited (probably ) 30Ar state into the first excited state of 28S ( at 1.507 MeV, see Fig. 10). We demonstrate in this section that such an assumption leads to strong restrictions on the structure of the first excited states both in 29Cl and 30Ar as well as to a consistent description of the decay scheme for the low-lying states in 29Cl and 30Ar.
Within the above assumption one may associate the whole feeding to the peak “A” with the decay sequence
| (2) |
while about 3/4 of the peak “C” corresponds to the sequence
| (3) |
If one compares population intensities in Fig. 8 (a) and (c), then the sequence (3) is about 2 times more intense than sequence (2). If one sticks to the prescription for the 2.3 MeV 29Cl state then the structure of its wave function (WF) can be schematically presented as
| (4) | |||||
The estimate of the penetration factors provides the ratio
This means that the coefficient should be as large as . Therefore, the structure of the first excited state of 29Cl is totally dominated by the WF component with the 28S subsystem in the state (the availability of some terms can only increase the above estimate).
Next we must check whether this assumption is consistent with the decay scheme of 2.9 MeV state of 30Ar. For the decay of the MeV state there are two branches: (i) via the 1.8 MeV g.s. of 29Cl (assumed to be ) and (ii) via the 2.3 MeV state of 29Cl (assumed to be ). These branches are populated with a ratio around 3:1, see Fig. 8 (c). Let’s assume that MeV is a state. In a schematic notation the state WF can be represented as
The estimate of penetration factors for the most probable decay branches provides
To match the observed ratio around 3, one should assume
which actually means that the weight of the excited 28S configuration in the structure of the 2.9 MeV state of 30Ar is larger than 0.75 (the decay schemes cannot provide information about coefficient). The large weight of the excited 28S configuration in the structure of this state is also required to explain transitions to the 2.3 MeV state of 29Cl, which is dominated by the excited 28S configuration as well.
The structure of the 29Cl first excited state discussed here seems to contradict the discussion of Sec. V.2 about Thomas-Ehrman shifts: the valence nucleon can be in a -wave configuration relative to the core (coefficient ) in Eq. (4). This should produce much smaller TES values. There may be two explanations here. One is that the term with is dominant in the structure of the 29Cl . The other point is that the s-wave component should be much more compact in the WF (4), because the state is more bound (due to the excitation energy of 28S ).
The decay of the MeV state via the 1.8 MeV g.s. of 29Cl is dominant, while the decay path via the 2.3 MeV state is suppressed. This situation is naturally explained by the assumption that the state decays via the g.s. of 29Cl by the emission of a -wave proton. The assumption of , , and level ordering in 30Ar is in agreement with the ordering expected from isobaric symmetry based on the 30Mg level scheme, see Fig. 11. All other possible prescriptions of spins and energies of the and MeV state fail to describe the overall situation with reasonable physics assumptions.
V.5 Sequential emission of protons from higher excited states in 30Ar
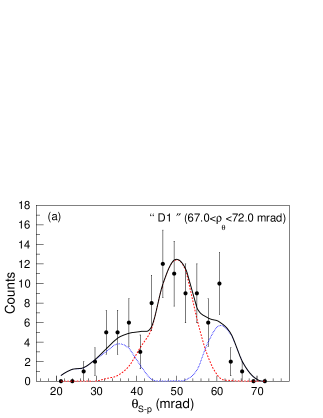
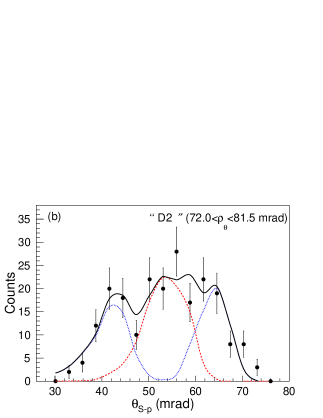
In order to establish decay mechanisms of the 30Ar states located above the state “C”, we inspected the distribution resulting from the decays of such states by imposing the respective arc gates on the 30Ar 2p-decay events. In Fig. 8(d1), the spectrum derived from the peak “D1” exhibits a triple-peak structure, in which the middle and the right-most peaks match the 1.8 MeV (peak (1) in Fig. 9) and 2.9 MeV (peak (3) in Fig. 9) states observed in 29Cl, respectively. Therefore, a natural interpretation for the experimental spectrum is the sequential proton emission of the 30Ar state “D1” via the above-mentioned two 29Cl states. To test such an explanation, MC simulations were performed and the resulting spectra were compared with the data displayed in Fig. 15(a). There the dashed and dotted curves represent the simulations of the detector response to the 2p decay of the 3.9 MeV 30Ar state via the 29Cl resonances at 1.8 MeV and 2.9 MeV, respectively. The weighted sum of these two components is shown by the solid curve, and the contributions of the 1.8 MeV and 2.9 MeV components are 60% and 40%, respectively. One can see that simulations with our hypothesis reproduce the data rather well. In a similar manner, the 28S-p angular correlations from the peak “D2” shown in Fig. 7 were analyzed. It was found that this 30Ar state decays by sequential 2p emission via the 29Cl states at 2.3 MeV and 2.9 MeV, respectively. Corresponding MC simulations are shown in Fig. 15(b) and reproduce data well.
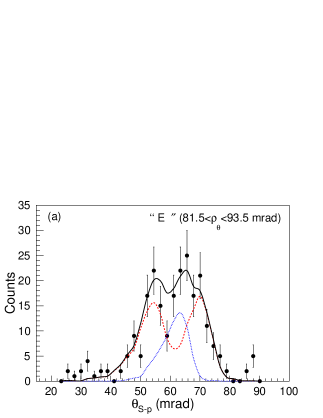
Regarding other observed excited states of 30Ar, namely the peaks “E”, “F1”, “F2”, and “G” shown in Fig. 7, one can clearly see from Fig. 8 that their 28S-proton angular correlation spectra display multiple-peak structures. For instance, the distribution obtained from peak “E” has a triple-peak pattern, in which the second and third peaks correspond to the 2.9 MeV and 3.5 MeV state of 29Cl respectively. Naturally, the decay pattern shown in the Fig. 8(e) can be attributed to the sequential emission of protons of one 30Ar state via the above-mentioned two 29Cl states. Such a hypothesis was tested by performing MC simulations of the detector response to the decays of this 30Ar∗ state. The input parameter of the 30Ar state is MeV. The resonance energies of two states in 29Cl are 2.9 MeV and 3.5 MeV respectively. The branching ratios for the two above-mentioned decay branches are 30% and 70%, respectively. The simulated distributions are displayed by the dotted and dashed curves in Fig. 16(a). The solid curve represents the summed fit which reproduces the data quantitatively. Following a similar analysis of decay patterns from other excited states in 30Ar, one may tentatively suggest that all these excited states decay by sequential emission of protons via intermediate resonances in 29Cl. In order to verify such a hypothesis, MC simulations of the detector response to the 2p decays from these states were performed. Fig. 16 shows a comparison between the simulated spectra and the respective experimental distributions. One can see that all simulations agree with the data.
VI Summary
The present work has investigated two proton-unbound nuclei 30Ar and 29Cl, which were identified by measuring the trajectories of their in-flight decay products and , respectively.
For calibration purposes, the decays of the previously-known true 2p emitter 19Mg were remeasured. The 2p radioactivity of the 19Mg ground state and the sequential emission of protons from several known excited states in 19Mg were confirmed. The deduced 2p decay energies are consistent with previous data. Evidence for a new excited state in 19Mg at MeV above the 2p threshold was found. We tentatively suggest that this new 19Mg state decays by sequential emission of protons via two so far unknown 18Na resonances at MeV and MeV above the 1p threshold, respectively.
By analyzing the 28S- and 28S-- angular correlations, the 30Ar g.s. was found to be located at MeV above the 2p-emission threshold and the 29Cl g.s. was found to be MeV above the p-emission threshold. The level and decay schemes of the observed states in 30Ar and 29Cl were reconstructed up to 13 and 6 MeV of excitation respectively.
Several problems relevant to the interpretation of the data were also discussed in this work. These include: Thomas-Ehrman shift in the states of 29Cl and 30Ar; transition character of decay dynamics of the 30Ar g.s. and the possibility to improve the determination of 29Cl and 30Ar ground states properties; evidence for that the structure of the first excited states of 29Cl and 30Ar is dominated by the 28S core in the state; decay schemes of higher excited states of 30Ar.
The performed experimental studies are on the edge of modern experimental opportunities. Because of the limited statistics of the data, several issues of the corresponding nuclear structure cannot be elaborated completely, which leaves these aspects for future investigations.
Acknowledgements.
This work was supported in part by the Helmholtz International Center for FAIR (HIC for FAIR), the Helmholtz Association (grant IK-RU-002), the Russian Ministry of Education and Science (grant No. NSh-932.2014.2), the Russian Science Foundation (grant No. 17-12-01367), the Polish National Science Center (Contract No. UMO-2011/01/B/ST2/01943), the Polish Ministry of Science and Higher Education (Grant No. 0079/DIA/2014/43, Grant Diamentowy), the Helmholtz-CAS Joint Research Group (grant HCJRG-108), the FPA2009-08848 contract (MICINN, Spain), the Justus-Liebig-Universität Gießen (JLU) and GSI under the JLU-GSI strategic Helmholtz partnership agreement. This article is a part of PhD thesis of X.-D. Xu. The authors acknowledge the help of D. Kostyleva in the preparation of the manuscript.References
- (1) V. Goldansky, Nucl. Phys. 19, 482 (1960).
- (2) M. Pfützner, et al., Eur. Phys. J. A 14, 279 (2002).
- (3) J. Giovinazzo, et al., Phys. Rev. Lett. 89, 102501 (2002).
- (4) B. Blank, et al., Phys. Rev. Lett. 94, 232501 (2005).
- (5) I. Mukha, et al., Phys. Rev. Lett. 99, 182501 (2007).
- (6) M. Pomorski, et al., Phys. Rev. C 83, 061303 (2011).
- (7) T. Goigoux, et al., Phys. Rev. Lett. 117, 162501 (2016).
- (8) L. V. Grigorenko and M. V. Zhukov, Phys. Rev. C 68, 054005 (2003).
- (9) I. Mukha, et al., Phys. Rev. C 82, 054315 (2010).
- (10) P. Voss, et al., Phys. Rev. C 90, 014301 (2014).
- (11) E. Olsen, M. Pfützner, N. Birge, M. Brown, W. Nazarewicz, and A. Perhac, Phys. Rev. Lett. 110, 222501 (2013).
- (12) I. Mukha, et al., Phys. Rev. Lett. 115, 202501 (2015).
- (13) T. Golubkova, X.-D. Xu, L. Grigorenko, I. Mukha, C. Scheidenberger, and M. Zhukov, Phys. Lett. B 762, 263 (2016).
- (14) H. Geissel, et al., Nucl. Instrum. Methods Phys. Res., Sect. B 70, 286 (1992).
- (15) M. Berz, H. Hoffmann, and H. Wollnik, Nucl. Instrum. Methods Phys. Res. A 258, 402 (1987).
- (16) URL http://web-docs.gsi.de/ weick/gicosy/.
- (17) M. Stanoiu, et al., Nucl. Instrum. Methods Phys. Res., Sect. B 266, 4625 (2008).
- (18) X.-D. Xu, Ph.D. thesis, Justus-Liebig-Universität, Gießen (2016).
- (19) I. Mukha, et al., Phys. Rev. C 85, 044325 (2012).
- (20) H. T. Fortune and R. Sherr, Phys. Rev. C 76, 014313 (2007).
- (21) M. S. Basunia, Nucl. Data Sheets 114, 1189 (2013).
- (22) K. W. Brown, et al., Phys. Rev. C 92, 034329 (2015).
- (23) Y. Kondo, et al., Phys. Rev. Lett. 116, 102503 (2016).
- (24) E. Comay, I. Kelson, and A. Zidon, Phys. Lett. B 210, 31 (1988).
- (25) URL http://www.nndc.bnl.gov.
- (26) B. A. Brown and W. A. Richter, Phys. Rev. C 74, 034315 (2006).
- (27) R. G. Thomas, Phys. Rev. 88, 1109 (1952).
- (28) J. B. Ehrman, Phys. Rev. 81, 412 (1951).
- (29) M. Pfützner, M. Karny, L. V. Grigorenko, and K. Riisager, Rev. Mod. Phys. 84, 567 (2012).
- (30) N. Schwierz, I. Wiedenhover, and I. A. Volya, arXiv: 0709.3525 (2007).
- (31) I. Angeli and K. Marinova, At. Data Nucl. Data Tables 99, 69 (2013).