Probing The Local Environment of the Supernova Remnant HESS J1731347 with CO and CS Observations
Abstract
The shell-type supernova remnant HESS J1731347 emits TeV gamma-rays, and is a key object for the study of the cosmic ray acceleration potential of supernova remnants. We use 0.5-1 arcminute Mopra CO/CS(1-0) data in conjunction with HI data to calculate column densities towards the HESS J1731347 region. We trace gas within at least four Galactic arms, typically tracing total (atomic+molecular) line-of-sight H column densities of 2-31022 cm-2. Assuming standard X-factor values and that most of the HI/CO emission seen towards HESS J1731347 is on the near-side of the Galaxy, X-ray absorption column densities are consistent with HI+CO-derived column densities foreground to, but not beyond, the Scutum-Crux Galactic arm, suggesting a kinematic distance of 3.2 kpc for HESS J1731347. At this kinematic distance, we also find dense, infrared-dark gas traced by CS(1-0) emission coincident with the north of HESS J1731347, the nearby HII region G353.430.37 and the nearby unidentified gamma-ray source HESS J1729345. This dense gas lends weight to the idea that HESS J1729345 and HESS J1731347 are connected, perhaps via escaping cosmic-rays.
keywords:
supernova remnants – cosmic rays – clouds – gamma-rays1 Introduction
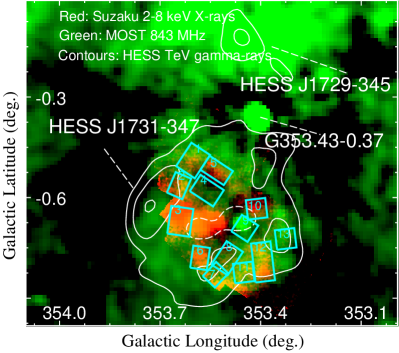
HESS J1731347 is a TeV gamma-ray source (Aharonian et al., 2008a; Abramowski et al., 2011) believed to be associated with the shell-type supernova remnant (SNR) G353.60.7 (Tian et al., 2008), while the nearby gamma-ray source HESS J1729345 was more recently detected in gamma-rays and is yet to be identified (Abramowski et al., 2011). These objects, which are displayed in Figure 1, are both candidates in the search for cosmic-ray hadron (hereafter ‘CR’ refers to cosmic ray hadrons unless otherwise stated) sources within the Galaxy.
Much progress has been made in identifying individual Galactic CR sources. To explain the Galactic Centre TeV gamma-ray distribution, it has been proposed that Sagittarius A* is a past accelerator of CRs up to PeV energies (Abramowski et al., 2016), while GeV gamma-ray spectral studies have revealed ‘smoking-gun’ CR sources SNRs W44 and IC 443 (Ackermann et al., 2013). Multi-wavelength studies expose other supernova remnants as probable CR sources (e.g. W28, W49B and HESS J1640465 Aharonian et al., 2008b; Nicholas et al., 2011; Nicholas et al., 2012; Maxted et al., 2016; Abdalla et al., 2016; Lau et al., 2017). Even when accounting for these objects, the origin of the total flux of observed Galactic CRs still remains an open question. In the search for current TeV CR accelerators, young SNRs (e.g. SNR RX J1713.73946, Fukui et al. 2012; Gabici & Aharonian 2014) are a key target.
With a gamma-ray flux of 10% the Crab flux above 1 TeV, HESS J1731347 was one of the brightest TeV objects without an identified counterpart until Tian et al. (2008) discovered corresponding radio continuum and X-ray emission counterparts, both displayed in Figure 1. The radio emission is non-thermal and shell-like in structure, and soft X-ray emission measured with ROSAT is only seen from the hemisphere of the TeV-SNR farthest from the Galactic Plane, suggesting absorption by a foreground molecular cloud in the hemisphere nearest to the plane (see Section 1.1). The authors proposed a potential association of the SNR with molecular gas connected with the HII region G353.430.37, then calculated a radiative SNR age of 2.7104 yr. This was noted to be consistent with the non-thermal X-ray flux relative to the TeV gamma-ray flux according to Yamazaki et al. (2006), but later studies suggest a younger age (e.g. 103 yr, Acero et al., 2015; Cui et al., 2016). Follow-up studies incorporated XMM-Newton X-ray observations to study the compact central object (CCO), XMMS J173203344518 (Tian et al., 2010), which had a detected pulsation that was later shown to be tenuous (Halpern & Gotthelf, 2010b), then absent (Halpern & Gotthelf, 2010a). A Suzaku study found hard and featureless non-thermal X-ray emission and confirmed that the foreground X-ray absorption column density varies across the SNR shell (Bamba et al., 2012), suggesting that the SNR is behind molecular gas of the Scutum-Crux arm.
The CCO has been the laboratory for a number of neutron star studies (e.g. Klochkov et al., 2013; Ofengeim et al., 2015; Klochkov et al., 2015), and recent work by Doroshenko et al. (2016) suggests that the HESS J1731347 candidate progenitor may be part of a binary system.
HESS J1731347 shares many qualities in common with young (103 yr) shell-type SNRs - RX J1713.73946, RX J0852.04622, RCW 86 and SN 1006, suggesting a common TeV gamma-ray emission mechanism (Acero et al., 2015). Like these remnants, observations of the HESS J1731347 non-thermal X-ray emission has shown the remnant to be accelerating electrons (leptons) (Tian et al., 2008, 2010; Bamba et al., 2012), possibly via a diffusive-shock mechanism (see e.g. Bell, 1978). It logically follows that HESS J1731347 may also accelerate hadrons beyond TeV energies, such that part of the observed gamma-ray shell or nearby gamma-ray sources may be a by-product of CRs interacting with matter, producing neutral pions which decay into gamma-ray photons (hadronic scenario). If such a hadronic mechanism was demonstrated to be occurring towards HESS J1731347, the SNR would be shown to be a CR accelerator. This scenario is confused by presence of a competing mechanism for gamma-ray production, inverse Compton scattering, whereby the same population of X-ray-emitting electrons up-scatters stellar/CMB background photons to create the observed gamma-ray emission (leptonic production).
Upper limits placed on GeV emission (Yang et al., 2014), at first glance, do not seem to support a hadronic scenario due to the non-detection of a so-called ‘pion-bump’ in the GeV-part of high-energy spectrum, but this does not rule out CR acceleration within HESS J1731347. CRs may contribute to a component of the gamma-ray spectrum, a scenario that becomes more likely if localised regions containing large magnetic fields and dense clumps of gas are present. In such cases, higher energy CRs more successfully access CR target material than lower energies, resulting in a hadronic gamma-ray spectrum that lacks a characteristic pion-bump (Fukuda et al., 2014), as has been suggested for SNR RX J1713.73946 (Gabici et al., 2009; Zirakashvili & Aharonian, 2010; Inoue et al., 2012; Fukui et al., 2012; Maxted et al., 2012; Gabici & Aharonian, 2014). Fukuda et al. (2014) find a correlation between proton density (at a kinematic distance of 5.2-6 kpc) and TeV gamma-ray emission across HESS J1731347 leading them to advocate for a HESS J1731347 hadron-dominated (80%) gamma-ray emission scenario. No thermal X-ray emission from the deposition of the HESS J1731347 shock energy into diffuse gas is observed, but this is consistent with the scenario of a SNR evolving into an inhomogeneous clumpy medium, like that of a wind-blown bubble (Inoue et al., 2012).
Modelling by Cui et al. (2016) does not assume the existence of the hadronic component suggested by the TeV-gas correlation found by Fukuda et al. (2014), and uses the measured gamma-ray spectrum to favour a lepton-dominated scenario arising from a 20-25 M⊙ progenitor for HESS J1731347. Cloud geometry was then invoked as a possible explanation for a hadronic origin for HESS J1729345, consistent with CO emission from gas at 3.2 kpc. A key aspect that allows such a hadronic feature from ‘runaway’ CRs for HESS J1731347 is the larger proton interaction mean-free path as compared to high energy electrons which quickly lose energy via the synchrotron process, meaning CRs are able to produce gamma-rays via pion production/decay farther away from the SNR shell than electrons are able to produce gamma-rays via bremsstrahlung or inverse-Compton. A preliminary detection of a TeV gamma-ray extension between HESS J1731347 and HESS J1729345 is suggestive of runaway CRs from HESS J1731347 (Capasso et al., 2017). Either a clear case of runaway CRs outside the boundary of HESS J1731347 or the detection of hadronic gamma-ray components within a seemingly lepton-dominated HESS J1731347 gamma-ray spectrum would expose the remnant as a CR accelerator.
1.1 Distance
Fukuda et al. (2014) argued that the HESS J1731347 SNR is associated with a void in HI-traced atomic gas on the near side of the 3 kpc-expanding arm at a kinematic distance of 5.2-6 kpc (line of sight velocity km s-1). This scenario is consistent with previous work comparing the X-ray absorption column density distribution towards HESS J1731347 with CO and HI-derived column densities to conclude that the SNR lies behind the Scutum-Crux arm gas, which is at a Galactic kinematic distance of 3.20.8 kpc (18 km s-1) (Tian et al., 2010), and is at a similar kinematic distance to the HII region G353.430.37 (Bronfman et al., 1996; Quireza et al., 2006). This distance is consistent with new work by Doroshenko et al. (2017), who find a spatial pattern of X-ray absorption in XMM-Newton data that matches the 3.2 kpc kinematic distance gas, reinforcing previous lower limits.
The gas analysis in this paper offers higher spectral and spatial resolution CO(1-0) data than previous molecular surveys towards HESS J1731347 and HESS J1729345. A key component of this investigation is to utilise Mopra CO data in conjunction with SGPS HI data (McClure-Griffiths et al., 2005) and X-ray absorption column densities (Bamba et al., 2012) to derive a HESS J1731347 kinematic distance (see Section 4.1). Additionally, a new multi-wavelength morphological study of the coincident CO-traced molecular gas is undertaken. 13CO, CS and C34S complement the data-set by probing dense gas that may contribute to a hadronic gamma-ray emission in the region.
2 Observations
2.1 The Mopra CO Galactic Plane Survey at 3 mm
Spectral data of the J1-0 transition of CO isotopologues was taken as part of the Mopra Galactic Plane CO Survey111http://phys.unsw.edu.au/mopraco/ (see Burton et al., 2013, for the full data-reduction description), which will be made public in stages (see Braiding et al., 2015, for the first data release)222see www.mopra.org/data/. Four isotopologues are targeted in this survey: CO, 13CO, C18O and C17O. The former two are the most abundant, so are exploited in this paper.
The Mopra Galactic Plane CO Survey data-set has an angular resolution and a velocity resolution of 35′′ and 0.1 kms-1, respectively, across 8 4096-channel dual-polarisation bands. After data reduction, the longitude range presented in this paper has a full velocity coverage of 185 kms-1 v115 kms-1, with negative and positive velocity extensions of 60 kms-1 in the north and south of the field, respectively. The extended beam efficiency used to scale-up the antenna temperature of Mopra at 115 GHz is 0.55 (Ladd et al., 2005). Typical 1 noise values are 0.8 K channel-1. Full details of the CO data reduction are presented in Braiding et al. (2015).
CO(1-0) and 13CO(1-0) integrated intensity images are shown alongside CS(1-0) images in Figure 2. Velocity-integration ranges were chosen to highlight four Galactic arm structures illustrated in Figure 3.
2.2 The Mopra 7 mm Survey Targeting CS
The 7 mm Mopra survey of HESS J1731347 and HESS J1729345 is comprised of a mixture of 26 partial and full OTF (on the fly) maps towards 7 different 2121′ fields, which were taken between March 2011 and May 2014.
The Mopra spectrometer, MOPS, is capable of recording sixteen tunable, 4096-channel (137.5 MHz) bands simultaneously when in ‘zoom’ mode, as used here. The data were co-added to produce 16 data-cubes with 2 spatial (long/lat) and 1 spectral (velocity) dimension at 7 mm wavelengths. Typical antenna noise values are 0.1 K for the CS(1-0) transition at 48.990957 GHz, but the exposure varies over the mapped field leading to some variation of this value on a scale of 50%.
Mopra mapping data have a cycle time of 2.0 s and the spacing between scan rows is 26′′. The velocity resolution of the 7 mm zoom-mode data is 0.2 kms-1. The beam FWHM and the pointing accuracy of Mopra at 7 mm are 592′′ and 6′′, respectively. Beam efficiencies presented in Urquhart et al. (2010) were applied to convert antenna intensity into main-beam intensity (0.56 for extended CS(1-0) emission at 49 GHz).
Data were reduced using the software packages Livedata, Gridzilla (Gooch, 1996) and Miriad (Sault et al., 1995). Livedata software performed a bandpass calibration on each row, using the preceding off-scan as a reference, then applied a linear fit to the baseline. Gridzilla software weighted the data by the system temperature, smoothed the data using a gaussian of FWHM equal to the Mopra beam (1′, extending outwards 3′) and averaged the data from individual scans into data cubes. The resultant cubes are in fits-file format and have pixels of size ()=(15″, 15″, 0.2 km s-1). Mopra data fits files, and ds9 region/contour files presented in this paper will be made publicly available333www.physics.adelaide.edu.au/astrophysics/MopraGam/.
2.3 21 cm SGPS HI data
Publicly-available 21 cm HI data from the Southern Galactic Plane Survey (see McClure-Griffiths et al., 2005, for details) was exploited in this analysis. The HI data were taken with the Parkes single-dish telescope and the ATCA interferometer, and the resultant fits-file probed atomic gas at an angular resolution and a velocity resolution of 2′ and 0.8 km s-1, respectively. The HI data used in this analysis have had radio-continuum sources removed.
3 Spectral Line Analyses
This paper utilises three techniques to calculate column density from CO, 13CO and CS data cubes. Results from these three techniques are displayed in Figure 4. In addition an investigation of HESS J1731347, we are taking steps towards a comprehensive publicly-available molecular density map of the inner Galactic Plane.
In sections 3.2 and 3.3, methods that allow the probing of dense molecular gas are outlined. Values from these methods are exploited in Section 4.2.4 to examine masses of potential CR target material. Firstly, in Section 3.1, we describe the use of X-factors, which form a consistent prescription for an unbiased examination of mass components towards sight-lines without accounting specifically for chemically unique environments (i.e. without large star-formation cores).
3.1 X-factor Analysis
In the X-factor analysis (Lang, 1980), emission is converted into column density via the equation [cm-2(K km s-1)-1], where is the velocity-integrated emission, is the X-factor and is the atomic or molecular column density for HI or CO(1-0) emission, respectively. This method effectively utilises a Galactic average for abundance, optical depth and temperature, assumptions that naturally arise from the X-factor derivation that infers a conversion factor from large-scale observations.
3.2 13CO Analysis
13CO molecules are 69 less abundant than CO, thus 13CO(1-0) emission suffers less attenuation than CO(1-0). 13CO emission was analysed via the prescription in Wilson et al. (2013). In this procedure, CO(1-0) emission was used to create an excitation temperature map, which was then used to derive the 13CO(1-0) optical depth. An implicit assumption is that 13CO and 12CO emission are both detected from the same region. The 13CO column density, calculated from the 13CO optical depth and CO excitation temperature, was then converted to H2 column density assuming a 13CO abundance of 2.810-6 (or more commonly quoted as the H2 abundance relative to 13CO of 3.6105, Frerking et al., 1982; Bachiller & Cernicharo, 1986; Cernicharo & Bachiller, 1984).
3.3 CS Analysis
For velocity ranges with strong detections of CS(1-0) emission, dense molecular gas could be probed. Column densities were generated from CS(1-0) maps by applying Eq. 9 of Goldsmith & Langer (1999) to convert CS(1-0) integrated emission into CS(J=1) column density,
| (1) |
where CS is described as a linear rotor where , , , , are the CS(1-0) frequency, Einstein coefficient for spontaneous emission, beam filling factor, integrated intensity and CS(1-0) optical depth, respectively. In the maps presented in this paper, the beam-filling factor is assumed to be equal to 1. CS(1-0) emission was assumed to be optically thin unless a detection of C34S(1-0) emission was recorded in the same location, in which case optical depth was estimated (see e.g. appendix of Maxted et al., 2012) assuming a CS/C34S ratio equivalent to the solar system elemental abundance of 22.5. We note that there is some indication of a deviation from this value towards the Galactic centre (Chin et al., 1996), but this is not considered since C34S is only detected within the nearest Galactic arm in this study (see section 4.2). With the assumption of Local Thermodynamic Equilibrium (LTE) at a temperature of 20 K (consistent with dust temperatures towards the region, Schlafly & Finkbeiner, 2011)444http://irsa.ipac.caltech.edu/applications/DUST/, the CS(J=1) column density was converted into total CS column density, , (CS column density 5 CS(J=1) column density). A 50% error in the assumed temperature of 20 K would result in a % systematic error in the column density using this method.
Assuming an abundance of CS with respect to molecular hydrogen, [CS]/[H2]10-9, a hydrogen column density map could be generated, allowing the estimation of H2 mass. This assumption is generally representative of available data and variation by more than an order of magnitude is uncommon (Frerking et al., 1980; Linke & Goldsmith, 1980; Shirley et al., 2003; Tafalla et al., 2004), but possible (e.g. Beuther et al., 2002; Shirley et al., 2003).
3.4 Mass estimations
By applying each of the three analyses outlined above (X-factor, 13CO, CS), three H2 column density maps were created for each velocity range under scrutiny (Figure 4). These were treated as independent measurements, although the 13CO analysis is semi-dependent, due to a CO excitation temperature estimation.
Mass values are quoted where relevant in this paper. H2 column density maps were converted to maps of mass/pixel by , where is the mass of a H atom, is the area of a fits file pixel and is the H2 column density, allowing regions to be simply summed using region statistics functions of a fits-file viewer555http://ds9.si.edu.We note that we rejected false emission components that resulted from systematic baseline effects in CS-derived mass maps by subtracting affected regions.
4 Molecular Gas Towards HESS J1731347 and HESS J1729345
Gas components at line of sight velocities ranging between 100 and 20 kms-1 towards the HESS J1731347 region are presented in Figure 3, which displays CO(1-0) emission corresponding to the local/Sagittarius (0 kms-1), Scutum-Crux (17 kms-1), Norma-Cygnus (50 kms-1) and 3kpc-Expanding/Perseus (80 kms-1) arms, consistent with spiral arm modelling by Vallée (2014, 2016) and previous HESS J1731347 gas analyses (e.g. Fukuda et al., 2014). Such a clear distinction between Galactic arms in Mopra CO(1-0) data so close (6-7∘) to the Galactic centre is notable.
The velocity components seen in Figure 3 are individually mapped in Figure 2 in CO(1-0), 13CO(1-0) and CS(1-0). CO(1-0) traces molecular gas, while 13CO(1-0) can probe regions where CO(1-0) has become optically thick. CS(1-0) has a similar advantage in CO-optically-thick regions, but also has a critical density for excitation (104 cm-3) that is an order of magnitude larger than CO. It follows that CS only highlights the densest molecular regions. The characteristics of CO, 13CO and CS are reflected in Figure 2, where CO(1-0) emission is most intense and extensive across the field, while 13CO(1-0) emission is only seen to emanate from regions intense in CO(1-0). CS(1-0) is seen to be even less extensive than 13CO(1-0), highlighting dense molecular cores in 3 Galactic arms.
Molecular gas in each of the Galactic arms - the Scutum-Crux, the 3kpc-Expanding and the Norma-Cygnus arms are addressed individually in Subsections 4.2, 4.3 and 4.4, respectively. In the following subsection (4.1) the cumulative column density of all of these arms is examined in detail to derive a kinematic distance to HESS J1731347. The sections after utilise a Scutum-Crux arm association for HESS J1731347 to guide a multi-wavelength investigation of the local environment of HESS J1731347.
4.1 Column densities towards X-ray emission
Figures 5 and 6 display graphs of the cumulative column density along the line of sight towards 14 regions with X-ray absorption column densities calculated by Bamba et al. (2012). These regions are displayed in Figure 1. X-ray column densities were found through the modelling of photoelectric absorption of non-thermal X-ray photons from a simple absorbed power-law model at 0.5-8 keV. A comparison of these values with column densities derived from Mopra CO(1-0) emission and SGPS HI emission can help to constrain the kinematic distance to HESS J1731347. We note that the fourteen X-ray emission regions examined have scales of 3-4′, making the fine angular resolution of Mopra CO and SGPS HI data (35′′ and 2′, respectively) a precise comparative tool at arcmintute scales.
When calculating column densities (see Section 3.1) it was assumed that all the spectral emission towards HESS J1731347 is near-side, and that emission with velocity centroids decreasing from 10 to 100 km s-1 correspond to increasing distance from 0.5 to 6 kpc, consistent with previous analyses (Tian et al., 2008, 2010; Fukuda et al., 2014). This assumption is also supported by the presence of HI dips corresponding to self-absorption at local/Sagittarius and Scutum-Crux arm velocities (10 to 25 km s-1). We note that if this assumption leads to the inclusion of a component of far-side gas in cumulative column density calculations, the conclusions will still hold in the case that such a component does not greatly exceed 20% (see Appendix A).
Figures 5 and 6 display both X-ray absorption-derived H column densities (hereafter ), and CO+HI-derived H column densities (hereafter ). In principle, traces all of the spectral components foreground to the HESS J1731347 X-ray emission, hence the velocity of the point of convergence of the values derived from the two techniques offers a way to uniquely determine the velocity corresponding to HESS J1731347 (hence kinematic distance).
Towards all but one region, converges with at typical values between 1.0 and 2.51022 cm-2 at velocities between 5 and 25 km s-1, indicating that HESS J1731347 is probably associated with this velocity component. Figure 7 summarises the results of the comparison of and for all of the regions scrutinised. The weighted arithmetic mean line of sight velocity is 15 km s-1, consistent with the velocity of the Scutum-Crux arm at 3.2 kpc.
We note that one out of the 14 tested positions (‘Xray9’ in Figure 6) would favour an association with the gas component at 80 km s-1 (3 kpc Expanding arm) if the result was taken in isolation, however this value has the largest 90% certainty interval (1.21 cm-2), hence it does not significantly contribute to the weighted arithmetic mean velocity (of 15 km s-1). We further note, that recent work by Doroshenko et al. (2017) benefit from better statistics towards ‘Xray9’ leading the authors to revise the value of absorption column density down to 1.6 cm-2, consistent with the 3.2 kpc kinematic distance solution. Other X-ray absorption column density values towards HESS J1731347 are consistent with the corresponding Doroshenko et al. values.
We explore the effect of systematic errors in Appendix A and conclude that a Scutum-Crux arm association still holds even if sources of uncertainty up to 20% exist. Larger unaccounted-for systematic errors may affect the derived kinematic distance, but this depends on the direction of the systematic error.
Our technique does not necessarily have sufficient precision to probe the location of HESS J1731347 beyond a simple flagging of an associated arm (Scutum-Crux), because local velocity components and turbulence probably dominate velocities at the scale of the spectral line-width, unlike peak spectral line velocities which more clearly reflect Galactic kinematic motions that correspond to Galactic model-dependent kinematic distance.
4.2 Gas in the Scutum-Crux Arm
Our analysis suggests that gas of the Scutum-Crux arm at 3.2 kpc (15 km s-1) is associated with HESS J1731347, and the analysis following finds an association of Scutum-Crux arm gas with infrared dark regions and possibly radio-continuum emission from HESS J1731347.
CO(1-0), 13CO(1-0) and CS(1-0) images of the Scutum-Crux arm, spanning the velocity 25 to 5 km s-1, are displayed in Figure 2 alongside emission from other Galactic arms. We examine the Scutum-Crux range in 5 km s-1 slices in Figure 8.
4.2.1 HII region G353.430.37, HESS J1729345 and the Surrounding Infrared-dark Gas
Scutum-Crux gas harbours a HII region, G353.420.37, which has an estimated kinematic distance of 3.2 kpc (Tian et al., 2008). A filament of infrared-dark gas labelled “Dark Filament Scutum-Crux arm gas” in 24, 8.0, 5.8 and 4.5 m images of Figure 9 contains G353.420.37. A dense clump associated with this HII region can be clearly observed in CO, 13CO and CS images in Figure 8, while the velocity centroid of the encompassing molecular cloud is at 17 km s-1, as evidenced by CS isotopologues, SiO, CH3OH and HC3N emission (see Appendix B for spectral line fit parameters). The optical extinction666calculated at http://irsa.ipac.caltech.edu/applications/DUST/ of this region reaches 90 (assuming a visual extinction to reddening ratio of 3.1, Schlafly & Finkbeiner, 2011), suggesting a column density of 21023 cm-2 (using cm-2, Güver & Özel, 2009). This infrared-derived value is consistent with the mean column density of 2.11023 cm-2 derived from the dense gas tracer, CS(1-0), strongly supporting a connection between the infrared-dark feature and the Scutum-Crux arm gas.
The rich chemistry of the cloud suggests a warm, dense environment that is commonly associated with star-formation or gas irradiated/warmed by stellar activity. The spectral profile of the gas towards the HII region is broad (CS FWHM5.8 km s-1) and can be seen in 3 velocity slices of Figure 8 (3 top-most images).
A filament of infrared-dark gas labelled “Dark Filament HESS J1729345” can be seen to cross HESS J1729345 at a 45∘-angle to the Galactic Plane. The feature, which is seen in all infrared images of Figure 9 but most prominently in 8 and 5.8 m bands, may correspond to Scutum-Crux arm gas at 3.2 kpc that is seen most clearly in CS(1-0) emission at to 15 km s-1 in Figure 8. The infrared opacity-derived column density of 2.61022 cm-2 (12), is consistent with the CS(1-0)-derived value of 2.51022 cm-2. With the detection of this dense gas component towards HESS J1729345, weight is added to the runaway CR scenario for the origin of HESS J1729345 presented by Cui et al. (2016). We note that de Wilt et al. (2017) also find a good correspondence between the HESS J1729345 gamma-ray emission and another dense gas tracer, namely NH3(1,1) emission.
An infrared-dark filament, labelled “Dark Filament HESS J1731347 north” in Figure 9, over-laps with the north of HESS J1731347. Like the aforementioned infrared-dark features, the CS(1-0)-derived column densities are approximately consistent with the opacity-derived measurements (6 and 41022 cm-2, respectively). This specific filament is addressed further in the next section, but we note that there is a good correspondence between CS-traced filaments and all infrared-dark filaments discussed in this region, as illustrated in Figure 9. Zoomed-in images of both ‘Dark Filament HESS J1729345” and ‘Dark Filament HESS J1731347 north” are displayed in Appendix B.
4.2.2 Radio-continuum Correspondance and a Molecular Void
Tian et al. (2008) identified SNR G353.60.7, a non-thermal radio continuum structure at 843 and 1420 MHz that is likely to be associated with HESS J1731347 (see Section 1). The northern rim of the G353.60.7/HESS J1731347 radio continuum has a good correspondence with a dense molecular clump traced by 13CO(1-0) and CS(1-0) at [][353.60.45∘] in Figure 10. The correspondence is suggestive of a shock-compression at a kinematic distance of 3.2 kpc. We further note that this dense gas component, which corresponds to the infrared dark cloud labelled “Dark Filament HESS J1731347 north” in Figure 9 is the only CS(1-0) detection in the line of sight. The gas is foreground to much of the line-of-sight infrared emission. CO(1-0) emission at the same velocity is more spatially extended than CS(1-0) and 13CO(1-0), but also peaks in the northern region of HESS J1731347 corresponding to peaks of the tracers of the denser gas.
This campaign did not detect SNR-shock triggered thermal SiO(1-0) emission above an antenna sensitivity of 10.8 K, and no thermal X-ray emission has been detected towards HESS J1731347. SiO(1-0) is a shock-tracer and the detection of this would have been ‘smoking gun’ for a shock interaction with molecular gas. With the confirmed 3.2 kpc kinematic distance for HESS J1731347, calculations employing this kinematic distance to yield a SNR Sedov age of 2-6103 yr (Acero et al., 2015; Cui et al., 2016) are increasingly likely, making HESS J1731347 potentially one of the older objects in the category of TeV shell morphology SNRs (RX J1713.73946, RX J08524622, RCW 86 and SN 1006 are 1.6, 2-4, 1.8 and 1 kyr, respectively).
On the ‘red-side’ of the CO-traced Scutum-Crux arm (i.e. 10 to 5km s-1), a void in molecular gas may exist towards HESS J1731347 (see bottom-left image of Figure 8), while a dense gas clump to the SNR’s north-west is traced by 13CO and CS emission. We considered the possibility that this is the wind-blown bubble of the HESS J1731347 progenitor into which the supernova remnant expanded, but it is difficult to resolve this scenario with our other lines of evidence favouring the 3.2 kpc kinematic distance solution for HESS J1731347 (i.e. X-ray absorption analysis), because this void is probably on the near-side edge of the Scutum-Crux arm. A proportion of the Scutum-Crux arm gas is required to be the X-ray photon-absorbing column density, so local intra-arm gas motions of 5-10 km s-1 would need to be invoked to reconcile this molecular void scenario with the other lines of evidence for the 3.2 kpc kinematic distance. Alternatively, a systematic shift in the calculated column density, as discussed in Appendix A might allow the CO void scenario to be resolved with X-ray absorption measurements.
4.2.3 CH3OH emission
Locations of CH3OH(7-6) emission (Maxted et al., 2014, and this paper) are indicated in Figure 8 and all correspond to dense gas traced by CO/13CO/CS(1-0) emission. So-called ‘class I’ CH3OH masers are commonly associated with the molecular shocks of HII regions (e.g. Haschick et al., 1990), but in some cases have been suggested to be triggered by molecular shocks associated with old (104 yr) supernova remnants (e.g. W28, Nicholas et al., 2012). The CH3OH detections in this survey are unlikely to be triggered by HESS J1731347 due to their spatial separation from the HESS J1731347 shock, although a connection with the C-shock is unclear for W28, where indirect ionisation by CRs may play a role (e.g. Maxted et al., 2017). The CH3OH masers towards HESS J1731347 do illustrate the star-formation activity within the Scutum-Crux arm molecular gas that is traced by CO/13CO/CS(1-0) in this study. CH3OH lines are parametrised in Appendix B, alongside other detected emission lines.
4.2.4 The molecular mass towards HESS J1731347
The calculated molecular hydrogen column density peaks at 81023 cm-2 (as derived from CS) within the Scutum-Crux arm at the approximate location ([][353.41,0.36]) of the HII region G353.430.37 (see Figure 4). CS(1-0) and 13CO(1-0) optical depth reach 5 and 0.6, respectively, towards this clump.
We estimate that the Scutum-Crux arm gas featured in Figure 8 surveyed in this study has a total molecular mass of 9.3-16 M⊙, as traced by CO and 13CO. Approximately 4.3-5.1 M⊙ of Scutum-Crux arm molecular gas is traced towards HESS J1731347.
An implication of the gas study by Fukuda et al. (2014) was the attribution of most of the gamma-ray emission to hadronic processes in a region containing a mass of 6.4104 M⊙ at a kinematic distance of 5.2 kpc. A simple distance-squared-scaling of this analysis to the distance of the Scutum-Crux Arm gas (3.2 kpc) would imply that only a few104 M⊙ would be required for an analogous hadronic scenario in the Scutum-Crux Arm. Generally though, a significant leptonic component for HESS J1731347 is expected (see e.g. Acero et al., 2015; Cui et al., 2016), even in hadron-dominated models (20% Fukuda et al., 2014).
If the 3.2 kpc kinematic distance solution (discussed in previous sections) for HESS J1731347 holds, the SNR would be at a similar kinematic distance to the HII region G353.430.37. CS(1-0) emission reveals a dense cloud component associated with this object, implying an available mass of target material of order 105 . The new maps of diffuse and dense molecular gas will help refine future CR diffusion models in the context of a run-away CR origin for HESS J1729345 in slow and fast diffusion scenarios (Cui et al., 2016). If the G353.430.37 cloud is penetrated by ‘runaway’ CRs accelerated by HESS J1731347, it would be illuminated by gamma-ray emission, as is suggested by new preliminary HESS gamma-ray analyses (Capasso et al., 2017). We note that dense gas can harbour strong frozen-in magnetic fields (e.g. Crutcher et al., 2010) that can inhibit CR diffusion (see e.g. Gabici et al., 2009). As a result, dense clumps embedded within a SNR shell can anti-correlate with X-ray emission as high energy electrons emit non-thermally at clump boundaries (e.g. Sano et al., 2010; Inoue et al., 2012). Further detailed investigation of such X-ray and ISM correlation with our Mopra data is left for future work.
4.3 Gas in the 3 kpc-Expanding Arm
Gas of the 3 kpc-Expanding Arm (5.2 kpc) has been argued as candidate for association with HESS J1731347 (see Sections 1 and 1.1, and Fukuda et al. 2014), however our Mopra CO(1-0) analyses (see Section 4.1) appear to favour the foreground Scutum-Crux arm (3.2 kpc).
If HESS J1731347 were in the 3kpc-Expanding arm, Mopra CO(1-0) measurements indicate that the molecular mass associated with this source would be 5.5104 M⊙. A lack of CS(1-0) detection and a 13CO-derived mass of 20% the CO mass suggests that the molecular gas is relatively diffuse, but the gas does extend south along the entire eastern edge of the SNR, and across the SNR’s northern rim. This is consistent with the structure seen by the Nanten2 telescope (Fukuda et al., 2014).
4.4 Gas in the Norma-Cygnus Arm
Approximately 8-11104 M⊙ of Norma-Cygnus arm molecular gas was traced in this survey. No component is seen to overlap HESS J1731347. CO, 13CO and CS(1-0) emission is coincident with the HII region GAL 353.5600.01 (Lockman, 1989) at a consistent velocity (57km s-1). On close inspection, the CS(1-0) spectrum towards this region has a dual peak structure with peak velocities at, km s-1 and km s-1.
CO/13CO/CS(1-0) emission also traces a clump at [][353.40,0.08] that has a coincident HII region GAL 353.3800.11 ( km s-1, Lockman, 1989). Furthermore, the Extended Green Object, EGO G353.400.07 (Chen et al., 2013), may indicate the presence of an outflow. The aforementioned infrared sources and the existence of several coincident young stellar objects (Robitaille et al., 2008) all point towards the dense CS(1-0)-traced gas of the Norma-Cygnus arm being an active region of star formation.
5 Conclusions
We surveyed the gamma-ray supernova remnant HESS J1731347 and nearby unidentified gamma-ray source HESS J1729345 with the Mopra radio telescope, targeting CO(1-0), 13CO(1-0) and CS(1-0) emission. We aimed to identify components of gas associated with HESS J1731347, and investigate the nature of HESS J1729345. We found that:
-
1.
when adopting a CO X-factor towards the mid-range of published values, X-ray absorption column densities derived from the HESS J1731347 X-ray emission are consistent with column densities foreground to the Scutum-Crux arm at a line of sight velocity of 15 km s-1, suggesting a kinematic distance of 3.2 kpc for HESS J1731347.
-
2.
Components of dense molecular gas at 3.2 kpc are coincident with the north of HESS J1731347, HESS J1729345 and a cloud associated with the HII region G353.430.37, as evidenced by CS(1-0) emission and infrared-dark features. The detection of dense gas towards gamma-ray emission to the north of HESS J1731347 is suggestive of a runaway CR scenario and flags a new component of target material mass to be included in future particle propagation models.
Acknowledgements
The Mopra Telescope is part of the Australia Telescope and is funded by the Commonwealth of Australia for operation as a National Facility managed by the CSIRO. The University of New South Wales Mopra Spectrometer Digital Filter Bank used for these Mopra observations was provided with support from the Australian Research Council, together with the University of New South Wales, University of Sydney, Monash University and the CSIRO. We thank the Australian Research Council for helping to fund this work through a Linkage Infrastructure, Equipment and Facilities (LIEF) grant (LE16010094).
References
- Abdalla et al. (2016) Abdalla H., et al., 2016, preprint, (arXiv:1609.00600)
- Abramowski et al. (2011) Abramowski A., et al., 2011, A&A, 531, A81
- Abramowski et al. (2016) Abramowski A., et al., 2016, Nature, 531, 476
- Acero et al. (2015) Acero F., Lemoine-Goumard M., Renaud M., Ballet J., Hewitt J. W., Rousseau R., Tanaka T., 2015, A&A, 580, A74
- Ackermann et al. (2013) Ackermann M., et al., 2013, Science, 339, 807
- Aharonian et al. (2008a) Aharonian F., et al., 2008a, A&A, 477, 353
- Aharonian et al. (2008b) Aharonian F., et al., 2008b, A&A, 481, 401
- Bachiller & Cernicharo (1986) Bachiller R., Cernicharo J., 1986, A&A, 166, 283
- Bamba et al. (2012) Bamba A., et al., 2012, ApJ, 756, 149
- Bell (1978) Bell A. R., 1978, MNRAS, 182, 147
- Beuther et al. (2002) Beuther H., Schilke P., Menten K. M., Motte F., Sridharan T. K., Wyrowski F., 2002, ApJ, 566, 945
- Bohlin et al. (1978) Bohlin R. C., Savage B. D., Drake J. F., 1978, ApJ, 224, 132
- Bolatto et al. (2013) Bolatto A. D., Wolfire M., Leroy A. K., 2013, ARA&A, 51, 207
- Braiding et al. (2015) Braiding C., et al., 2015, Publ. Astron. Soc. Australia, 32, e020
- Bronfman et al. (1996) Bronfman L., Nyman L.-A., May J., 1996, A&AS, 115, 81
- Burton et al. (2013) Burton M. G., et al., 2013, Publ. Astron. Soc. Australia, 30, e044
- Capasso et al. (2017) Capasso M., et al., 2017, AIP Conference Proceedings, 1792, 040026
- Carey et al. (2009) Carey S. J., et al., 2009, PASP, 121, 76
- Cernicharo & Bachiller (1984) Cernicharo J., Bachiller R., 1984, A&AS, 58, 327
- Chen et al. (2013) Chen X., Gan C.-G., Ellingsen S. P., He J.-H., Shen Z.-Q., Titmarsh A., 2013, ApJS, 206, 9
- Chin et al. (1996) Chin Y.-N., Henkel C., Whiteoak J. B., Langer N., Churchwell E. B., 1996, A&A, 305, 960
- Churchwell et al. (2009) Churchwell E., et al., 2009, PASP, 121, 213
- Crutcher et al. (2010) Crutcher R. M., Wandelt B., Heiles C., Falgarone E., Troland T. H., 2010, ApJ, 725, 466
- Cui et al. (2016) Cui Y., Pühlhofer G., Santangelo A., 2016, A&A, 591, A68
- Dickey (2013) Dickey J. M., 2013, in Burton M. G., Cui X., Tothill N. F. H., eds, IAU Symposium Vol. 288, Astrophysics from Antarctica. pp 135–138, doi:10.1017/S174392131201678X
- Dickey & Lockman (1990) Dickey J. M., Lockman F. J., 1990, ARA&A, 28, 215
- Doroshenko et al. (2016) Doroshenko V., Pühlhofer G., Kavanagh P., Santangelo A., Suleimanov V., Klochkov D., 2016, MNRAS, 458, 2565
- Doroshenko et al. (2017) Doroshenko V., Pühlhofer G., Bamba A., Acero F., Tian W. W., Klochkov D., Santangelo A., 2017, preprint, (arXiv:1708.04110)
- Frerking et al. (1980) Frerking M. A., Wilson R. W., Linke R. A., Wannier P. G., 1980, ApJ, 240, 65
- Frerking et al. (1982) Frerking M. A., Langer W. D., Wilson R. W., 1982, ApJ, 262, 590
- Fukuda et al. (2014) Fukuda T., Yoshiike S., Sano H., Torii K., Yamamoto H., Acero F., Fukui Y., 2014, ApJ, 788, 94
- Fukui et al. (2012) Fukui Y., et al., 2012, ApJ, 746, 82
- Gabici & Aharonian (2014) Gabici S., Aharonian F. A., 2014, MNRAS, 445, L70
- Gabici et al. (2009) Gabici S., Aharonian F. A., Casanova S., 2009, MNRAS, 396, 1629
- Goldsmith & Langer (1999) Goldsmith P. F., Langer W. D., 1999, ApJ, 517, 209
- Gooch (1996) Gooch R., 1996, in Jacoby G. H., Barnes J., eds, Astronomical Society of the Pacific Conference Series Vol. 101, Astronomical Data Analysis Software and Systems V. p. 80
- Green et al. (1999) Green A. J., Cram L. E., Large M. I., Ye T., 1999, ApJS, 122, 207
- Güver & Özel (2009) Güver T., Özel F., 2009, MNRAS, 400, 2050
- Halpern & Gotthelf (2010a) Halpern J. P., Gotthelf E. V., 2010a, ApJ, 710, 941
- Halpern & Gotthelf (2010b) Halpern J. P., Gotthelf E. V., 2010b, ApJ, 725, 1384
- Haschick et al. (1990) Haschick A. D., Menten K. M., Baan W. A., 1990, ApJ, 354, 556
- Haverkorn et al. (2006) Haverkorn M., Gaensler B. M., McClure-Griffiths N. M., Dickey J. M., Green A. J., 2006, ApJS, 167, 230
- Inoue et al. (2012) Inoue T., Yamazaki R., Inutsuka S.-i., Fukui Y., 2012, ApJ, 744, 71
- Klochkov et al. (2013) Klochkov D., Pühlhofer G., Suleimanov V., Simon S., Werner K., Santangelo A., 2013, A&A, 556, A41
- Klochkov et al. (2015) Klochkov D., Suleimanov V., Pühlhofer G., Yakovlev D. G., Santangelo A., Werner K., 2015, A&A, 573, A53
- Krčo & Goldsmith (2010) Krčo M., Goldsmith P. F., 2010, ApJ, 724, 1402
- Ladd et al. (2005) Ladd N., Purcell C., Wong T., Robertson S., 2005, Publ. Astron. Soc. Australia, 22, 62
- Lang (1980) Lang K. R., 1980, Astrophysical Formulae. A Compendium for the Physicist and Astrophysicist.
- Lau et al. (2017) Lau J. C., et al., 2017, MNRAS, 464, 3757
- Linke & Goldsmith (1980) Linke R. A., Goldsmith P. F., 1980, ApJ, 235, 437
- Liszt & Lucas (2002) Liszt H., Lucas R., 2002, A&A, 391, 693
- Liszt et al. (2010) Liszt H. S., Pety J., Lucas R., 2010, A&A, 518, A45
- Lockman (1989) Lockman F. J., 1989, ApJS, 71, 469
- Maxted et al. (2012) Maxted N., et al., 2012, MNRAS, 422, 2230
- Maxted et al. (2013) Maxted N., et al., 2013, MNRAS, 434, 2188
- Maxted et al. (2014) Maxted N., et al., 2014, in Proceedings, 3rd Meeting on Cosmic rays and their interstellar medium (CRISM 2014): Montpellier, France, June 24-27, 2014. p. 009 (arXiv:1503.06717)
- Maxted et al. (2016) Maxted N., de Wilt P., Rowell G., Nicholas B., Burton M., et al., 2016, MNRAS, 462, 532
- Maxted et al. (2017) Maxted N., Rowell G., de Wilt P., Burton M., Braiding C., Walsh A., Fukui Y., Kawamura A., 2017, AIP Conference Proceedings, 1792, 040034
- McClure-Griffiths et al. (2005) McClure-Griffiths N. M., Dickey J. M., Gaensler B. M., Green A. J., Haverkorn M., Strasser S., 2005, ApJS, 158, 178
- Nicholas et al. (2011) Nicholas B., Rowell G., Burton M. G., Walsh A., Fukui Y., Kawamura A., Longmore S., Keto E., 2011, MNRAS, 411, 1367
- Nicholas et al. (2012) Nicholas B. P., Rowell G., Burton M. G., Walsh A. J., Fukui Y., Kawamura A., Maxted N. I., 2012, MNRAS, 419, 251
- Ofengeim et al. (2015) Ofengeim D. D., Kaminker A. D., Klochkov D., Suleimanov V., Yakovlev D. G., 2015, MNRAS, 454, 2668
- Okamoto et al. (2017) Okamoto R., Yamamoto H., Tachihara K., Hayakawa T., Hayashi K., Fukui Y., 2017, ApJ, 838, 132
- Quireza et al. (2006) Quireza C., Rood R. T., Balser D. S., Bania T. M., 2006, ApJS, 165, 338
- Robitaille et al. (2008) Robitaille T. P., et al., 2008, AJ, 136, 2413
- Sano et al. (2010) Sano H., et al., 2010, ApJ, 724, 59
- Sault et al. (1995) Sault R. J., Teuben P. J., Wright M. C. H., 1995, in Shaw R. A., Payne H. E., Hayes J. J. E., eds, Astronomical Society of the Pacific Conference Series Vol. 77, Astronomical Data Analysis Software and Systems IV. p. 433 (arXiv:astro-ph/0612759)
- Schlafly & Finkbeiner (2011) Schlafly E. F., Finkbeiner D. P., 2011, ApJ, 737, 103
- Shirley et al. (2003) Shirley Y. L., Evans II N. J., Young K. E., Knez C., Jaffe D. T., 2003, ApJS, 149, 375
- Strong et al. (2004) Strong A. W., Moskalenko I. V., Reimer O., Digel S., Diehl R., 2004, A&A, 422, L47
- Tafalla et al. (2004) Tafalla M., Myers P. C., Caselli P., Walmsley C. M., 2004, A&A, 416, 191
- Tian et al. (2008) Tian W. W., Leahy D. A., Haverkorn M., Jiang B., 2008, ApJ, 679, L85
- Tian et al. (2010) Tian W. W., Li Z., Leahy D. A., Yang J., Yang X. J., Yamazaki R., Lu D., 2010, ApJ, 712, 790
- Urquhart et al. (2010) Urquhart J. S., et al., 2010, Publ. Astron. Soc. Australia, 27, 321
- Vallée (2014) Vallée J. P., 2014, AJ, 148, 5
- Vallée (2016) Vallée J. P., 2016, AJ, 151, 55
- Wilson et al. (2013) Wilson T. L., Rohlfs K., Hüttemeister S., 2013, Tools of Radio Astronomy. Springer, doi:10.1007/978-3-642-39950-3
- Yamazaki et al. (2006) Yamazaki R., Kohri K., Bamba A., Yoshida T., Tsuribe T., Takahara F., 2006, MNRAS, 371, 1975
- Yang et al. (2014) Yang R.-z., Zhang X., Yuan Q., Liu S., 2014, A&A, 567, A23
- Zirakashvili & Aharonian (2010) Zirakashvili V. N., Aharonian F. A., 2010, ApJ, 708, 965
- de Wilt et al. (2017) de Wilt P., Rowell G., Walsh A. J., Burton M., Rathborne J., Fukui Y., Kawamura A., Aharonian F., 2017, MNRAS, 468, 2093
Appendix A Systematic Uncertainty
A systematic calibration error in either X-ray absorption column density, , or spectral column density, , would shift the points of intercepts in Figures 5 and 6, which would result in a shifted line-of-sight velocity solution for HESS J1731347 in our analysis.
Bamba et al. (2012) discuss the potential effect of a 20% mis-estimation of spectral parameters in low surface-brightness regions, and conclude that the error introduced is smaller than statistical uncertainties, which itself is few-20% in most cases. We conduct an analysis of the potential effect of a systematic error in by repeating our analysis on a data-set with an artificially-injected offset of 20%. We find that an over/underestimation of by 20% would have little effect on the derived Scutum-Crux arm-association (preferred velocities of 11.80.2 and 201 km s-1 for 20% offsets, see Figure 11).
A similar argument can be made for the spectral column density, . The existence of an overestimation of by up to 20% would not change the derived Scutum-Crux arm-association, while a larger than 20% underestimation can be tolerated to still yield the same results.
Studies of HI disfavour a significant overestimation of atomic column density resulting from the assumed X-factor, but point towards the plausibility of underestimation. For example, cold HI cores contain a large component of mass not accounted for in an analysis of HI-emission alone due to self absorption (e.g. Krčo & Goldsmith, 2010; Fukui et al., 2012; Dickey, 2013). Indeed, HI absorption features are apparent in the Scutum-Crux arm in several regions in Figures 5 and 6 (e.g. see Region 1 at 17 km s-1 and Region 2 at 0 km s-1 for clear cases), so an underestimation of atomic column density is possible in this analysis.
Strong et al. (2004) used gamma-ray emission from hadronic interactions to estimate the CO X-factor applied in this analysis, and this CO X-factor value falls roughly in the mid-range of published values. A review by Bolatto et al. (2013) suggests that the average CO X-factor is with an uncertainty of 30%, which suggests that an overestimation of molecular column density in this study is unlikely. We note that recent measurements by Okamoto et al. (2017) suggest that the CO X-factor is 1 in the Perseus cloud. If such a value was valid for the region foreground to HESS J1731347, our X-ray analysis would be unable to discern between competing distance solutions.
Either an upwards shift in spectral column density, , or a downwards shift X-ray absorption column density, , would result in the preferred line of sight velocity shifting towards the near-side of the Scutum-Crux arm. A very large shift (60%) in these directions would be required to move the intercepts in Figures 5 and 6 towards velocities corresponding to the Sagittarius arm (0km s-1, 1 kpc).
We note that the results of an investigation of the molecular gas fraction towards HESS J1731347 X-ray regions are presented in Figure 12. The ratio of molecular to atomic gas is observed to be within normal ranges (([H2]/[H+H2])0.2-0.4), illustrating that it is important to include both atomic and molecular column density contributions.
Appendix B Infrared-dark clouds towards HESS J1731347 and HESS J1729345
In Section 4.2, infrared-dark features were shown to be coincident with dense gas in the Scutum-Crux arm, as traced by CS(1-0) and 13CO emission. In addition to Figure 9, we provide zoomed-in 8 m images towards HESS J1731347 and HESS J1729345 in Figure 13. No additional molecular tracers were seen towards these 2 infrared dark clumps. As described in the main body of this paper, detections of other molecular gas tracers SiO, CH3OH and HC3N are summarised in Table 1. This data will be made publicly-available alongside CS(1-0) data (see Section 3.3).
| Source | v | T | vσ |
|---|---|---|---|
| [km s-1] | [K] | [km s-1] | |
| CH3OH(70-61 A++) | |||
| A [353.21,0.24] | 15.400.03 | 0.43 0.06 | 0.170.03 |
| A | 5.920.05 | 0.220.05 | 0.13 0.04 |
| B [353.25,0.50] | 8.91 0.02 | 0.540.05 | 0.170.02 |
| C [353.34,0.32] | 17.970.02 | 0.370.03 | 0.220.02 |
| D [353.41,0.37] | 16.220.02 | 0.660.03 | 0.270.02 |
| D | 17.730.10 | 0.330.01 | 1.990.08 |
| SiO(1-0,v=0) | |||
| D | 17.00.1 | 0.2430.007 | 3.30.1 |
| HC3N(5-4) | |||
| D | 16.90.1 | 0.500.02 | 1.720.09 |
| D | 18.740.06 | 0.280.04 | 0.450.08 |
| 13CS(1-0) | |||
| D | 16.70.2 | 0.0990.008 | 1.90.2 |
| C34S(1-0) | |||
| D | -16.910.09 | 0.270.01 | 1.940.09 |
| CS(1-0) | |||
| D | -17.050.04 | 1.670.02 | 2.480.05 |
| SiO(1-0,v=2) | |||
| E [353.61,0.24] | 85.410.07 | 0.300.02 | 1.130.07 |