Nature of the low-energy, -like background for the Cherenkov Telescope Array
Abstract
The upcoming Cherenkov Telescope Array (CTA) project is expected to provide unprecedented sensitivity in the low-energy ( GeV) range for Cherenkov telescopes. Most of the remaining background in this energy range results from misidentified hadron showers. In order to fully exploit the potential of the telescope systems it is worthwhile to look for ways to further improve the available analysis methods for /hadron separation. We study the composition of the background for the planned CTA-North array by identifying events composed mostly of a single electromagnetic subcascade or double subcascade from a (or another neutral meson) decay. We apply the standard simulation chain and state-of-the-art analysis chain of CTA to evaluate the potential of the standard analysis to reject such events. Simulations show a dominant role of such single subcascade background for CTA up to energies GeV. We show that a natural way of rejection of such events stems from a shifted location of the shower maximum, and that the standard stereo reconstruction method used by CTA already exploits most of expected separation.
keywords:
-rays: general, Methods: observational, Instrumentation: detectors, Telescopes , Extensive air shower1 Introduction
The imaging air Cherenkov technique has been successfully used since the first -ray source (Crab Nebula) was discovered by Whipple collaboration (Weekes, 1989). The main idea of the technique is based on the measurement of Cherenkov photons produced in the atmosphere by the charged relativistic particles from an Extensive Air Shower (EAS). The two dimensional angular distribution of Cherenkov light appears on the telescope camera as the shower image. Due to the fact that the number of registered hadron-induced events (the so-called background) is several orders of magnitude larger than the number of registered -ray events from a source, the /hadron separation method plays a crucial role in the data analysis. The image parameterization that was suggested in Hillas (1985) allowed an effective -ray selection. More sophisticated selection methods are being used now (such as Krawczynski el al., 2006; Albert et al., 2008; Ohm et al., 2009; Parsons Hinton, 2014), but most of them are still based on the original Hillas parameters. In the last 30 years, the construction of larger mirror dish telescopes and employing stereoscopic technique allowed to lower the observation energy threshold. Currently three large IACT (Imagining Air Cherenkov Telescopes) instruments are in operation: H.E.S.S. (Aharonian et al., 2004), MAGIC (Aleksić et al., 2016a) and VERITAS (Weekes et al., 2002; Holder J et al., 2011).
The upcoming Cherenkov Telescope Array (CTA) (Actis et al., 2011; Acharya et al., 2013) was designed to study -ray sources in a broad energy range, from a few tens of GeV to hundreds of TeV. It will consist of two arrays: one in the Northern and one in the Southern hemisphere. The former one will be mostly focused on lower energy observations. CTA is expected to have an order of magnitude better sensitivity than the currently operating IACT systems (Bernlöhr et al., 2013). However at low energies the /hadron separation becomes more difficult, which results in the deterioration of the sensitivity. Apart from the fact that images are smaller, which results in a worsening of the telescope performance (the shower has to be reconstructed from information in only a few pixels), the decrease of the /hadron separation efficiency can be explained by a several physical effects. First, at low energies the geomagnetic field has more impact on -ray showers (making them appear more hadron-like) than hadron initiated showers thus the efficiency of primary particle selection is worse (see e.g. Bowden et al., 1992; Commichau et al., 2008; Szanecki et al., 2013). Second, larger fluctuations of the image parameters are expected due to the larger fluctuations of the Cherenkov light density at ground in the low energy region (Chitnis & Bhat, 1998; Sobczyńska, 2009). Third, the -ray events may be imitated by a specific type of a hadron-induced shower. It has been suggested in Maier & Knapp (2007) that hadronic events that survive the -ray selection criteria, transfer much of the primary’s energy to electromagnetic sub-cascades during the first few interactions. Furthermore, it has been shown in Sobczyńska (2007) that a large telescope can be triggered by light produced by a from only one or two electromagnetic sub-cascades, which are produced by a single decay in the hadron initiated shower. These images have very similar shapes to -ray events, therefore they can be called -like background. Both single sub-cascade and single events are mainly proton induced showers with relatively low primary energy (below GeV). The efficiency of the /hadron separation method based on the parameters describing the image shape, decreases at low energies due to the occurrence of this specific -like background events for the IACTs system (Sobczyńska, 2015; Sobczynska & Adamczyk, 2015).
It should be also noted that a primary electron or positron (Accardo et al., 2014) can induce an EAS that triggers the system of IACTs (Cortina & González, 2001; Aharonian et al., 2009). The background from a is hardly distinguished from a ray as both form pure electromagnetic cascades in the atmosphere. The cosmic ray electron spectrum is however steeper then the one of protons, resulting in a complicated energy dependence of this type of background.
We study the impact of such events on the Northern CTA array by using Monte Carlo (MC) simulations. In particular, we investigate the ability of the state-of-the-art CTA analysis methods to reject such a background. In Section 2 we describe the performed MC simulations and the analysis methods. In Section 3 we report the obtained results on the expected background structure for CTA North array. We discuss and summarize the results in Section 4.
2 Simulation pipeline
The simulations of atmospheric showers were performed with a modified code of CORSIKA 7.5 (Heck et al., 1998). We use UrQMD (Bass et al., 1998) and QGSJET-II-04 (Ostapchenko, 2011) as the low (particle energy GeV) and high energy hadronic models respectively. According to Maier & Knapp (2007) hadronic interactions with low multiplicity and high fraction in the first stage of the shower development may result in the occurrence of hadronic images that survive the selection. Thus the estimation of the hadronic background after the /hadron separation could depend on the chosen interaction model. However, Sobczyńska (2015) showed that the fractions of a single or events in protonic background obtained with different interaction models do not differ significantly for stereo systems. The author demonstrated that the effect of this hardly reducible background is more sensitive on the altitude of the observatory, telescope size and trigger conditions than on the interaction model.
The response of the telescopes was simulated using the sim_telarray code (Bernlöhr, 2008). The output was converted with Chimp (Hassan et al., 2015, 2017) to allow analysis using MAGIC Analysis and Reconstruction Software (MARS) (Zanin et al., 2013; Aleksić et al., 2016b).
2.1 MC samples
The EAS development was simulated, using the CORSIKA code, for the North CTA site, located at 2147 m a.s.l. on the Canary island of La Palma. We simulated rays and an order of magnitude more hadronic background events - composed of protons and He nuclei. We simulated also a sample of electron background events. Detailed information concerning the used EAS simulations settings are shown in Table 1.
| CORSIKA input | Input value | |||
|---|---|---|---|---|
| Primary Particle type | ray | Background components | ||
| Proton | Helium | Electron | ||
| Energy Range [GeV] | - | - | - | - |
| Energy power-law index | -2.0 | |||
| Impact Parameter [m] | 0 - 1100 | 0-1600 | ||
| Zenith Angle [∘] | 20 | |||
| Azimuth Angle (AZ) [∘] | 0 &180 | |||
| Event reusage | 5 | 20 | ||
| Viewcone [∘] | 0 | 10 | ||
| Number of events | ||||
| (per each AZ, not reused) | ||||
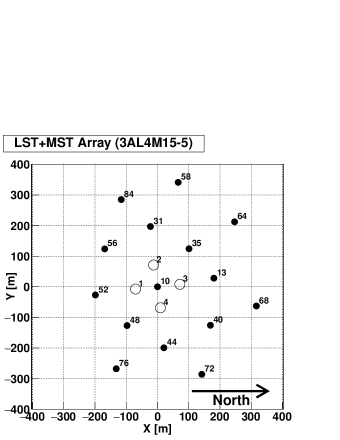
The geophysical parameters of the chosen La Palma site are set accordingly to the standard La Palma site configuration template of CORSIKA steering card used in the standard CTA simulation package - corsika_simtelarray. We use the official CTA configuration settings, the so-called Production-3. The individual telescopes’ position (see Fig. 1), takes into consideration also the orography of the La Palma site, i.e. the Z coordinate of the telescopes changes with the position to include the difference in altitude.
The simulated arrival zenith angle (ZA) is set to for rays, whereas for background events we use a diffuse viewcone with a half-opening angle of , centred at the same ZA=, (for details see Table 2). As the geomagnetic field (GF) affects the detection and reconstruction performance of IACT, to recover the impact of this effect, we simulated two opposite azimuth angles of arrival of primary particles AZ=0∘ and AZ=180∘, corresponding to the largest difference in magnitude of GF (see Szanecki et al., 2013).
To simulate the telescope response to EAS we used the standard CTA software sim_telarray. We studied the telescope array layout presented in Fig. 1 with baseline parameters from Production-3. The layout studied here is similar to the currently planned layout of telescopes for CTA North array. This array is composed of 4 Large Sized Telescopes (LST) and 15 Middle Sized Telescopes (MST) and is one of the most efficient ones studied for this site (Hofmann, 2017).
The most important parameters used in the simulations of both kinds of telescopes are summarized in Table 2.
| sim_telarray input | Input value | |
|---|---|---|
| Telescope type | LST | MST |
| Dish type | Parabolic | Davies Cotton |
| Camera Focal length | ||
| Total projected mirror area | ||
| Camera Field of view | ||
| Pixel size | ||
| Number of Pixels | ||
| Photomultipliers type/ | Hamamatsu R11920 | Hamamatsu R12992 |
| quantum efficiency | ||
| Telescope trigger type | Analog sum | |
| Trigger threshold | Sum of 43 phe | Sum of 46 phe |
| (amplitude) | in 21 pixels | in 21 pixels |
| Average NSB (per telescope) | 0.317 phe/ns | 0.276 phe/ns |
| Min. trigger multiplicity | 2 telescopes of the same kind | |
As our studies focus mainly on the lower energies, we also separately investigate the LST subarray (telescopes 1-2-3-4 in Fig. 1). All the analysis steps are done individually for both arrays.
2.2 Analysis
During the simulations of an air shower we mark the occurrence of a Single Electromagnetic Subcascade, hereafter SES and Single Subcascades, hereafter SS. We define SES as a particle (normally e± or a ray) undergoing an electromagnetic interaction, and all the secondary particles created in the electromagnetic cascade starting from that particle. Similarly we define SS as the primary particles created in a decay of a neutral particle (normally or ) and all the secondary particles created in the subshower started by these particles. Each new SES and SS generated in the shower have a unique number assigned to it. Each Cherenkov photon produced in the shower have two additional numbers propagated, to identify its corresponding SES and SS, unless it was created by a muon or by a charged hadron (e.g. the primary particle).
For the Cherenkov photons that are reflected from the telescope mirror dish and are converted into photoelectrons (phe) in the camera we calculate the statistics of SES and SS. A SES (or SS) is considered to contribute to the event if it produced at least 6 phe in at least one of the triggered telescopes. The value was selected to be similar to the cleaning level applied later on in the analysis. From the SES and SS that satisfy the above condition we calculate the numbers of SES and SS participating in a given event. For each SES we compute also a ratio of a number of phe originating from it to the total number of phe measured in all the triggered telescopes. We call SESmax the largest of these ratios (i.e. for the most dominating SES), and similarly SSmax for the most dominating SS. We call an event SES-dominated if SES and SS-dominated if SS. According to this definition the same event can be both SES-dominated and SS-dominated, and in fact if the largest SES in a SES-dominated event comes from a decay of e.g. it will automatically make it a SS-dominated event as well. On the other hand, an event composed of a similar amount of light registered from two separate SES will not qualify as SES-dominated as in this case SES. A SES-dominated event that is not SS-dominated event is as well possible (however not very common). An example of such a process is a produced high in the atmosphere decaying to which in turn decays to . The information about dominating SES and SS and about the total number of SESs and SSs that contribute to the event is then propagated through the analysis chain.
In Fig. 2 we show an example image of a SES-dominated event and an event composed of multiple SES.
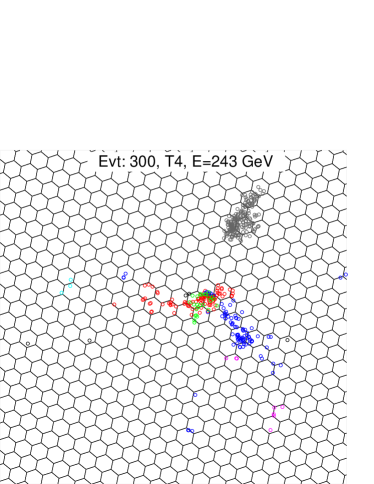
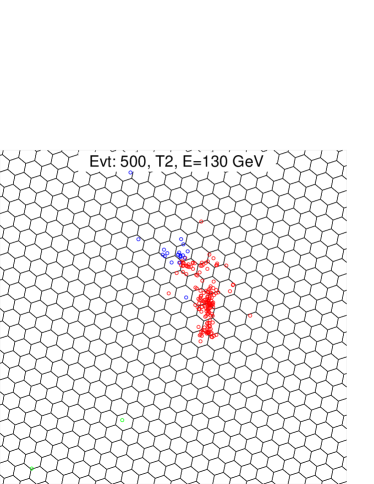
Events composed of multiple SES can show clear, distinct features connected with the development of individual SES through the atmosphere (compare e.g. red and blue points in the top panel of Fig. 2), however parts of the image produced by different SES might be also registered at similar angular direction (compare green and red points in the same panel). On the other hand events with a single dominating SES (see the bottom plot in Fig. 2) are more regular and will be able to imitate rays more effectively.
We perform the image cleaning procedure using the default chimp two-pass image cleaning. The algorithm first searches for pairs of neighboring pixels with phe each (core pixels). Pixels with phe and which have a core neighbor are also selected as part of the shower image (boundary pixels). The first pass is done with - threshold of 6-3 phe and 8-4 phe for LST and MST telescopes respectively. Next, the time structure of the event (i.e. a linear fit to the signal arrival time vs. position along major image axis) is reconstructed from the pixels surviving the first pass of the cleaning and the signal extraction is redone in all the pixels in a smaller region of interest. The extraction of the signal in smaller region of interest allows a second pass of cleaning with lower thresholds (4-2 phe). We then calculate the Hillas parameters of each cleaned image (Hillas, 1985). We exclude from the analysis images of poor quality by applying a cut in minimum size of the image of 50 phe. Afterwards stereo parameters are computed from the remaining images. The stereo reconstruction is performed using the standard chimp-MARS chain. The direction of the shower is estimated as the point on the camera which minimizes the sum of squares of distances to the main axes of the images. Next, from each telescope a line in the direction of the image COG is constructed. The height of the shower maximum is reconstructed by finding a plane that is minimizing dispersion of crossing points of those lines. In both minimization procedures each image is weighted according to its brightness and shape, since these are related to how accurately it matches the shower axis.
We perform the /hadron separation using multidimensional decision trees, the so-called Random Forest (RF) method (Albert et al., 2008). Hillas parameters of a given image (size, width, length, fraction of size in two brightest pixels) together with stereo reconstruction parameters from the whole event (impact and the height of the shower maximum) as well as estimated energy of the event are used to calculate the Hadronnessi value of i-th telescope. The global Hadronness value is computed from averaging individual Hadronnessi, weighted with the square root of the size (an empirical recipe to give more weight to better-defined shower images). The RF method is also used to estimate the energy of each event. The weighting of the global estimated energy of the event is done with the inverse square of the uncertainty of energy estimated from Hillas parameters of a given telescope together with the stereo parameters. As we are interested in -like background (at a given energy) we train the energy estimation on a subsample of rays and apply it to the samples of protons, helium and electrons. To account for the effect of the GF both the Hadronness and estimated energy training are done independently for each of the two simulated azimuths. To evaluate the effect of SES and SS on typical observations we calculate G80 cuts, i.e. a cut in Hadronness that at a given estimated energy preserves 80% of rays. In order to investigate background for typical CTA sources we apply a cut in the reconstructed source position of the background events in order for it to lie withing 1.5∘ from the camera center. In such region the angular acceptance is close to constant. For computation speed reasons, in order to have also significant statistics at higher energy part of the spectrum all the simulations were done with spectral index (see Table 2). To reproduce the proper energy spectrum of the background components we applied event-wise simulated energy depended weights. Unless specified otherwise proton, helium and electron events are reweighted to a power-law with a spectral slope of , and respectively and rays to a power-law with a spectral slope of .
SESmax, being a global parameter calculated from all the triggering telescopes, might in principle hide some information about telescope-wide distribution of SESs. An extreme example would be two SESs of similar energy produced high in the atmosphere with sufficient angular separation so each of them is seen by a different telescope. In order to evaluate if SESmax is sufficient to classify an event, or if an information from individual telescopes (i.e. SESmax,i, fraction of light produced by the most dominant in that telescope SES) is needed, we compare the distributions of SESmax,i for different SESmax (see Fig. 3)
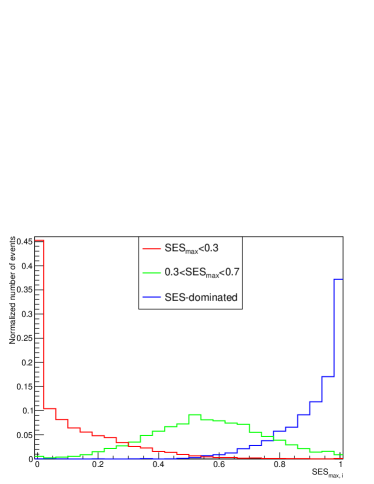
The distribution is mostly concentrated in the ranges defined by binning of SESmax. Only a small tail to higher or lower values of SESmax,i is observed, hence one can conclude that most of the information about the dominating SES is already given by SESmax.
3 Results
As a first step we compute the distribution of the aggregated /hadron separation parameter, Hadronness, for events with a different dominance of the largest SES. In Fig. 4 we show such distributions for the lowest energies accessible to the LST sub-array (top panel) and for the energy range from which the MST start to dominate in the full array (bottom panel).
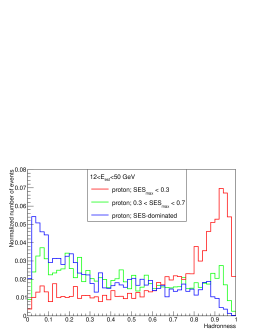
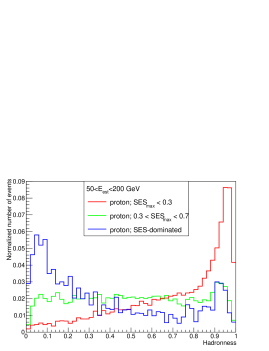
In both cases there is a clear difference between SES-dominated and SES-not-dominated events. The former produce a peak at low Hadronness and thus efficiently imitate showers initiated by rays. On the other hand, events without a dominating SES are classified with a Hadronness value mainly close to 1 and thus are easily rejected from the analysis. We have checked that a very similar trend is also observed for events with/without a dominating SS.
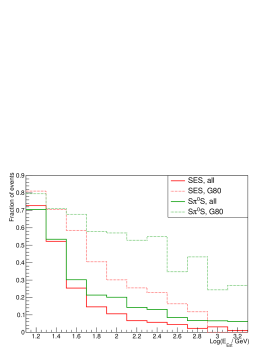
In Fig. 5 we show the distributions of SESmax and SSmax parameters for different bins of Hadronness parameter.
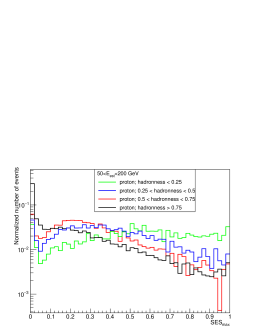
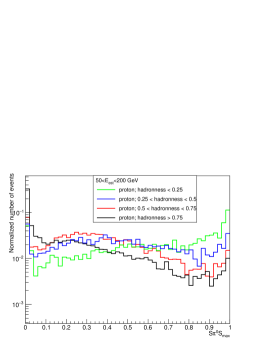
Consistently with what was shown in Fig. 4 events with low Hadronness value have often high SESmax (and SSmax). Comparing the two panels of Fig. 5, the SS peak for low Hadronness values is much more pronounced than the corresponding peak at SES. Such single SS events are most probably composed of two SES of comparable size.
In Fig. 6 we present the fraction of SES-dominated and SS-dominated events.
The fraction of both SES- and SS-dominated events drops down fast with increasing energy, as more individual SES and SS are produced in a shower and can be observed by the telescopes. As the showers composed of multiple SES or SS are much easier to separate, after a cut in Hadronness the fraction of SES- and SS-dominated events is much higher. At 100 GeV it reaches 34% and 57% respectively. In A we check if the applied by us cleaning algorithm has any significant impact on the computed fraction of SES-dominated events. No strong influence is found.
In Fig. 7 we present the separation power for different classes of events.
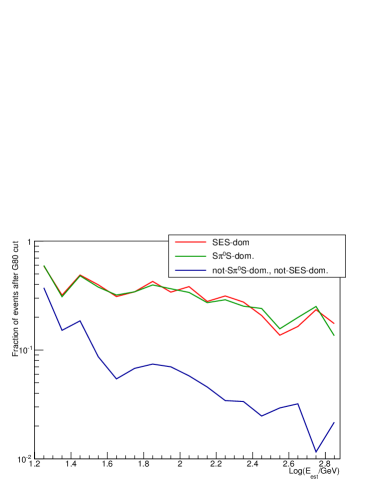
As expected from Fig. 6, both the SES-dominated and SS-dominated events are difficult to distinguish from -ray initiated shower. Only about 60% of such events are rejected with a G80 cuts (note that those cuts reject also 20% of rays). This is nearly an order of magnitude worse than for events without a dominating SS and improves only very slowly with energy. It is interesting to note that, despite about twice larger fraction of SS-dominated events than SES-dominated events, the separation power of both types of events is very similar. This suggests that such single-SS-double-SES events are still similar to a single SES-dominated events and thus hard to separate from primary rays.
3.1 SES- and SS-dominated events from protons and helium
In Fig. 8 we compare the distributions of SESmax for protons and helium.
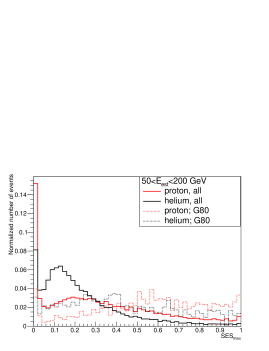
The sharp peak at zero is produced mostly by muon-dominated events. The distribution for helium-initiated showers is shifted to lower values. It is in line with the typical approximation of helium nuclei as a superposition of four protons with four times smaller energy. I.e. in helium a higher number of SESs is generated and hence a probability for obtaining a single dominant one is smaller. Interestingly, after Hadronness cut, which removes preferentially easier to separate low SESmax events, the two distributions are more similar. The smaller fraction of SES-dominated events in helium than in protons before the -ray selection seems to be thus one of the reasons why helium-initiated showers are much easier to separate from rays than proton-initiated ones.
Fig. 9 shows the Hadronness distribution for SES-dominated events stemming from protons and helium showers.
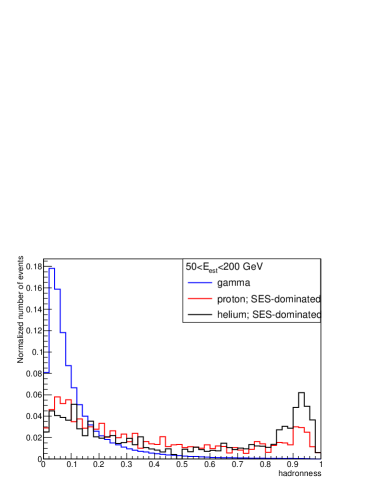
SES-dominated events originating from both proton and helium partially separate from rays (see the second peak at Hadronness). For helium events there is a small preference towards higher hadronness values. It is caused by a broader distribution of the reconstructed height of the shower maximum for helium than for protons (see Fig. 10).
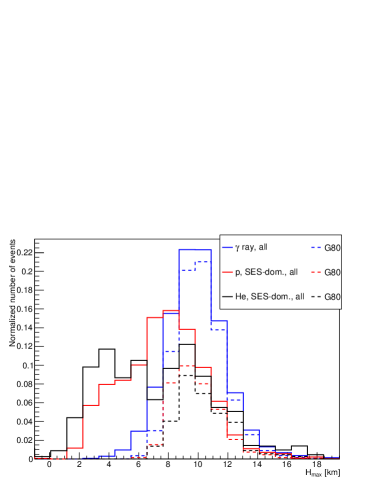
This might be connected with a higher chance of observing (and classifying as a SES-dominated event) a helium event composed mostly from a SES produced in the second, or later interaction.
3.2 Background composition
In order to derive the composition of the expected background events for the CTA-North observatory we introduce following classes of events:
-
1.
SES-dominated events (SES, as before)
-
2.
SS-dominated, but not SES-dominated events (SS, SES, i.e. events composed of a dominating or subcascade which decays into two (or three) SES, all observable by the telescopes)
-
3.
muon-dominated, i.e. events with a fraction of observed light produced due to muons above 70% (by definition those events cannot be SES- or SS- dominated)
-
4.
remaining hadronic background events, which are mainly a combination of multiple SES and muons.
We use a combination of proton and helium MCs in a ratio as measured by Haino et al. (2004). We include also contribution of cosmic ray electrons following Aguilar et al. (2014).
As can be seen in Fig. 11 the background composition is highly dependent on the estimated energy of the shower.
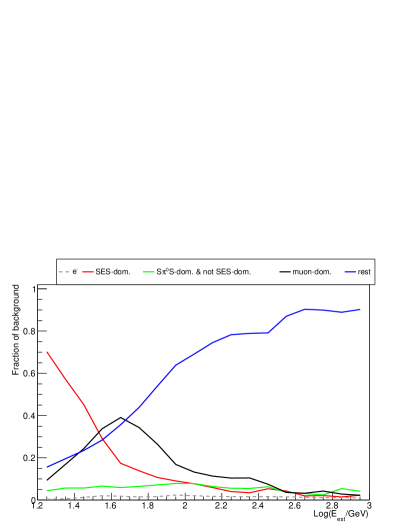
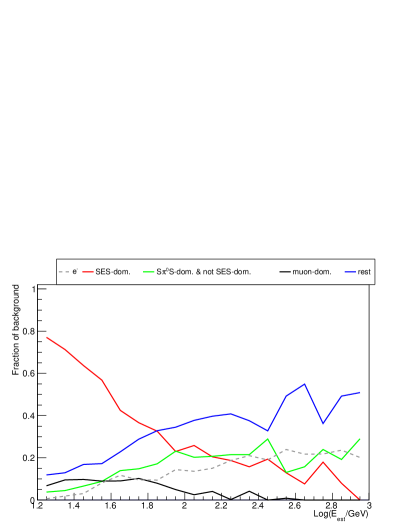
It also changes dramatically after applying /hadron separation cuts due to different separation power of such cuts for different event classes. At the lowest energies ( GeV) the most important background component is formed by SES-dominated events. As those events separate very badly from rays, after applying G80 cuts their importance is further enhanced, making them the dominant background up to 70 GeV. At energies GeV there is a large component of muon-dominated background (up to nearly 40%), which is however easily rejected by G80 cuts, resulting in the final contribution to remaining background at the level of about 10%. SS-dominated but not SES-dominated events form only a small fraction (5-10%) of the background before the cuts, however their poor rejection raises their importance after G80 cuts. They constitute about 20% of the remaining background above GeV. The contribution of mixed events raises fast with the energy. Even after the G80 cuts they contribute about 40% to the remaining background, similar fraction as SES- and SS-dominated events together. As expected after /hadron separation cuts the contribution of electrons raises with the energy. Above 100 GeV it reaches a similar fraction as SES-dominated events.
3.3 Rejection of SES-dominated events
A SES-dominated event is an electromagnetic cascade and hence it is expected that they are difficult to separate from ray initiated showers. For example the commonly used in IACT analysis Hillas parameters have very similar distributions for SES-dominated events and rays Sobczyńska (2007, 2015). Let us consider a simple case of a CR proton interacting with an air nucleus producing at depth a particle decaying into two rays, with energies of 100 GeV and GeV respectively. The first ray will interact with another air nucleus at depth and initiate an electromagnetic cascade. If the telescopes register light only from this sub-cascade, the image will be indistinguishable from a primary ray which due to fluctuations had its first interaction at the same depth of . As the first interaction depth cannot be measured directly, in such a case the only parameter which can be used to reject those events is related to the height of the shower maximum. The average depth of the first interaction for a 100 GeV proton is about (see e.g. Mielke et al., 1994), while the fluctuation of the shower maximum for a 100 GeV ray is about (dominated by the fluctuations of the first interaction). Hence, some separation of SES-dominated events from rays is possible on the base of the reconstructed height of the shower maximum, however with a large overlap of the two distributions. In fact such a parameter is already used in IACT analysis as it is also a powerful muon rejection tool (see e.g. Aleksić et al., 2012).
We want to test if the currently achieved in CTA simulations rejection power of SES-dominated events is already limited by physics of the showers, or can it be still improved by using e.g. better estimation of the height of the shower maximum. To evaluate how strong suppression of SES-dominated events with a cut in the height of the shower maximum is possible we first perform a toy MC study. Next we compare it with the results obtained with the full simulations. In the toy MC study for a given energy of ray, , we simulate 1000 showers using CORSIKA. The longitudinal distribution of each shower is fitted with a Gaisser-Hillas profile (Gaisser & Hillas, 1977; Heck et al., 1998) used in CORSIKA. We extract from the fit the depth of the shower maximum and construct a distribution of it, hereafter . In the toy MCs we assume that a SES-dominated event that can mimic a ray of energy must have also a similar energy to (note that most of the primary proton energy should go into a single subcascade if no other subcascade or muon is observed). We assume that the SES starts at the depth of the first interaction of protons, following the proton-air cross section of Mielke et al. (1994). As the energy dependence of the cross section is only logarithmic, the assumption about similar energies of rays and protons should not affect the results strongly. The depth of the shower maximum for a SES will then be a sum of the depth of the first interaction (drawn from an exponential function) and the depth of the shower maximum for a ray (drawn from ). We then construct a distribution of such computed depth of the shower maximum of SES events and compare it with . We calculate a cut value in the depth (or equivalently height) of the shower maximum that maximizes the so called Q-factor, i.e. fraction of surviving rays divided by the square root of the remaining SES events. The value of the Q-factor can be understood as the improvement of the sensitivity that such a cut can give if this type of events is the dominating one.
The distribution of the corresponding height of the shower maximum and the energy dependence of the Q-factor obtained from the toy MC are compared to the full simulations in the middle panel of Fig. 12.
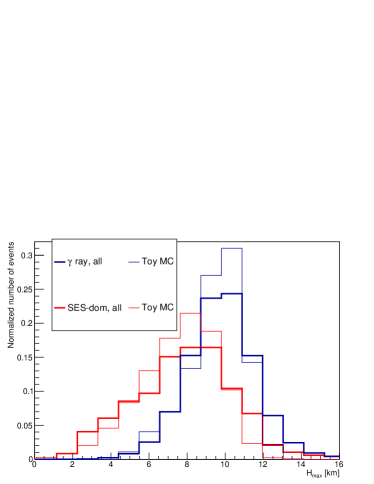
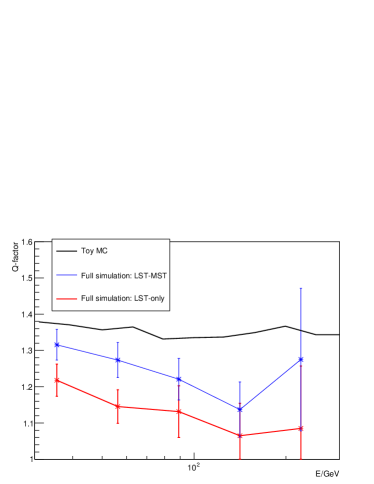
For the full simulation case the distributions of the reconstructed height of the shower maximum for gamma-rays and SES-dominated events are done in bins of estimated energy. The toy model is rather simple and does not take into account a few important effects. In particular, due to the atmospheric absorption, the height of the shower maximum observed in Cherenkov radiation shifts to lower heights (Sobczyńska, 2009). In addition, SES-dominated events that fluctuate deeper into the atmosphere will have an enhanced chance of detection, and if so, their energy is reconstructed as that of an even deeper developing ray; such effect will be most important close to the energy threshold of the telescopes. Nevertheless, at least for energies around GeV the toy MCs seem to describe relatively well the distribution of height of the shower maximum obtained from the full simulations. The expected Q-factor of the height of the shower maximum cut from toy MC is about 1.35 (see the right panel of Fig. 12). The obtained Q-factor from the full CTA-North array (i.e. LST and MST) simulation is 6% worse, while the Q-factor from the LST-subarray is 14% worse. Somewhat higher values obtained in Toy MC as well as the better performance of the full array with respect to the LST subarray is probably caused by a better stereo reconstruction due to larger multiplicity of telescopes observing a given event. It might be however also enhanced by the event selection bias of smaller MST telescopes. Events starting deeper into the atmosphere would preferentially trigger these telescopes. Such events are then easier to reject by a cut in the height of the shower maximum. That bias can be responsible for the hint of a higher Q-factor at the lowest energies, which is not reproduced in toy MC.
Comparing the distribution of the height of the shower maximum before and after G80 cuts (left panel of Fig. 12) it is clear that the RF is already efficiently exploiting the information of the height of the shower maximum.
In principle, the separation of SES-dominated events from rays might be also based on a search for signatures of direct Cherenkov radiation from the primary particle. Most of the SES-dominated events are produced by protons with energies of the order of 100 GeV. Hence, in the upper parts of the atmosphere their energy will be still below the threshold for the Cherenkov radiation. Even if a proton is above such threshold, contrary to higher Z elements, its direct Cherenkov radiation is very weak. Our simulations show that in more than a half of SES-dominated events not even a single phe is produced in any of the telescopes from a Cherenkov photon produced by a proton. Hence we conclude that any possible separation based on the search of direct Cherenkov light with CTA will be very inefficient.
4 Discussion and conclusions
Using standard CTA simulation software and state-of-the-art Cherenkov telescopes analysis methods we have studied different classes of low energy background events. In particular we have investigated events composed mainly by a single electromagnetic subcascade, or a pair of electromagnetic subcascades from a decay of a neutral particle. We performed full MC simulations of rays, protons, helium and electrons for one of the most promising arrays designed for CTA-North. As expected, SES-dominated and SS-dominated are very similar to -ray induced showers, and hence difficult to reject. Comparing proton and helium simulations, at a given energy the latter have a larger number of smaller SES, making it rarer to have one dominating SES. This can explain why helium and higher elements, while relatively abundant in the observed CR spectrum, have a rather small effect on the remaining background for Cherenkov telescopes.
After /hadron separation cuts SES- and SS-dominated events constitute 50% of the residual cosmic ray background mimicking rays with energies GeV. A SES-dominated event is formed by an electromagnetic cascade in the atmosphere, that is virtually indistinguishable from a ray if starting at the same depth in the atmosphere. As the SES-dominated events on average start deeper, some separation is possible, and already being done, based on the height of the shower maximum. By performing comparisons between the full MC simulations and a toy MC we have shown that the currently achieved rejection of SES-dominated events stemming from the height of the shower maximum estimation is close to the expected natural limit. Therefore, no big improvement in the background rejection at the lowest GeV energies is to be expected by using more elaborate analysis methods. On the other hand, at slightly higher energies of GeV, the fraction of SES-dominated events cross (at the level of 20%) the fraction of events that are SS-dominated, but not SES-dominated. SS-dominated events composed of two SES of a comparable size, contrary to SES-dominated events, are qualitatively different from rays, however it is intriguing that according to our studies their rejection power is still similar. Hence, it is possible that with a rejection method more focused on this type of background higher performance of /hadron separation might be achieved. One should note however that at those energies an even larger fraction of the background is produced by mixed events and a non-negligible amount by cosmic ray electrons.
Acknowledgements
This work is supported by the grant through the Polish Narodowe Centrum Nauki No. 2015/19/D/ST9/00616. DS is supported by the National Science Centre grant No. UMO-2016/22/M/ST9/00583. AM acknowledges the support of the MultiDark CSD2009-00064 project of the Spanish Consolider-Ingenio 2010 programme. We would like to thank CTA Consortium and MAGIC Collaboration for allowing us to use their software and Konrad Bernlöhr for helpful discussions. We would also like to thank the anonymous journal reviewer for his helpful comments.
This paper has gone through internal review by the CTA Consortium.
Appendix A Dependence on cleaning algorithm
While the classification of events as SES- or SS-dominated that we apply is cleaning independent, the rest of the analysis chain will clearly depend on it. For example let us consider an event composed of two SES, which are separated on the camera. If the cleaning algorithm excludes for some reason (e.g. lower photon density, or separation in arrival time) the pixels with the signal from one of those SES, the resulting event would behave during the reconstruction like a SES-dominated one, despite the fact that it does not have to be classified as such. In particular the effect of the double-pass cleaning with signal re-extraction explained in Section 2.2 can be quite complicated. On one hand, the re-extraction of signal in time bins determined from the core of the image allows us to include also lower intensity pixels into image, without increasing the influence of the NSB. This can reveal in a hadronic background events parts of the image produced by a separate SES, making the event less -like. On the other hand the re-extraction of signal could also clean away parts of the image produced by one of the SES, if they are separated in time/distance space from the rest of the image. To investigate if those effects are important for the composition of the -like background we performed a simplified study using the LST subarray and only one Azimuth angle. We processed this subsample with only the first stage of cleaning and compared the obtained results with the double-pass cleaning analysis used in the rest of the paper. Due to the different cleaning, the /hadron separation and energy estimation are trained separately for the 1-pass cleaning sample. For the fair comparison of both cleanings we use G80 cuts calculated separately for each of them.
In Fig. 13 we show the dependence of the fraction of SES- dominated events on the estimated energy for single-pass and double-pass analysis.
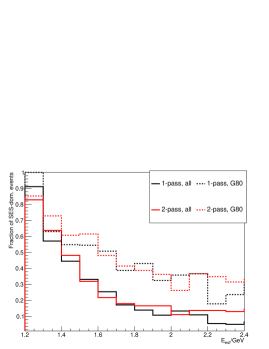
The fraction of SES-dominated events after the G80 cuts is similar for the two cleaning approaches. Thus, the cleaning method should not have a strong impact on the presented results.
References
- Accardo et al. (2014) Accardo L. et al. 2014, Phys. Rev. Lett. 113, 121101 (2014)
- Acharya et al. (2013) Acharya B. et al. 2013 Astroparticle Physic, 43, 3
- Actis et al. (2011) Actis M. et al. 2011, Experimental Astronomy, 32, 193
- Aguilar et al. (2014) Aguilar, M., Aisa, D., Alvino, A., et al. 2014, Physical Review Letters, 113, 121102
- Aharonian et al. (2004) Aharonian F. et al. 2004, A&A, 457, 899
- Aharonian et al. (2009) Aharonian F. et al. 2009 A&A, 508, 561
- Albert et al. (2008) Albert, J., Aliu, E., Anderhub, H., et al. 2008, Nuclear Instruments and Methods in Physics Research A, 588, 424
- Aleksić et al. (2012) Aleksić, J., Alvarez, E. A., Antonelli, L. A., et al. 2012, Astroparticle Physics, 35, 435
- Aleksić et al. (2016a) Aleksić, J., Ansoldi, S., Antonelli, L. A., et al. 2016, Astroparticle Physics, 72, 61
- Aleksić et al. (2016b) Aleksić, J., Ansoldi, S., Antonelli, L. A., et al. 2016, Astroparticle Physics, 72, 76
- Bass et al. (1998) Bass, S. A., Belkacem, M., Bleicher, M., et al. 1998, Progress in Particle and Nuclear Physics, 41, 255
- Bernlöhr et al. (2013) Bernlöhr, K. et al. 2013, Astroparticle Physics, 43, 171
- Bernlöhr (2008) Bernlöhr, K. 2008, Astroparticle Physics, 30, 149
- Bowden et al. (1992) Bowden, C. C. G., Bradbury, S. M., Chadwick, P. M., et al. 1992, Journal of Physics G Nuclear Physics, 18, L55
- Chitnis & Bhat (1998) Chitnis V. R. and Bhat P. N. 1998, Astroparticle Physics, 9, 45
- Commichau et al. (2008) Commichau et al. 2008, Nucl. Instrum. Methods Phys. Res. A, 592, 572
- Cortina & González (2001) Cortina, J., & González, J. C. 2001, Astroparticle Physics, 15, 203
- Gaisser & Hillas (1977) Gaisser, T. K., & Hillas, A. M. 1977, International Cosmic Ray Conference, 8, 353
- Hassan et al. (2015) Hassan, T., Arrabito, L., Bernlör, K., et al. 2015, arXiv:1508.06075
- Hassan et al. (2017) Hassan, T., Arrabito, L., Bernlöhr, K., et al. 2017, arXiv:1705.01790
- Haino et al. (2004) Haino, S., Sanuki, T., Abe, K., et al. 2004, Physics Letters B, 594, 35
- Heck et al. (1998) Heck, D., Knapp, J., Capdevielle, J. N., Schatz, G., & Thouw, T. 1998, CORSIKA: a Monte Carlo code to simulate extensive air showers., by Heck, D.; Knapp, J.; Capdevielle, J. N.; Schatz, G.; Thouw, T.. Forschungszentrum Karlsruhe GmbH, Karlsruhe (Germany)., Feb 1998, V + 90 p., TIB Hannover, D-30167 Hannover (Germany).
- Hillas (1985) Hillas, A. M. 1985, Proc. of the 19th ICRC, 3, 445
- Hofmann (2017) Hofmann, W. and the CTA Consortium, AIP Conference Proceedings 1792, 020014 (2017); doi: http://dx.doi.org/10.1063/1.4968899
- Holder J et al. (2011) Holder J et al., Proc of 32rd ICRC, Beijing, vol 12, p 137, 2011
- Krawczynski el al. (2006) Krawczynski H. et al. 2006, Astropart. Phys., 25, 380
- Maier & Knapp (2007) Maier G. & Knapp J. 2007, Astropart. Phys., 28, 72
- Mielke et al. (1994) Mielke, H. H., Foller, M., Engler, J., & Knapp, J. 1994, Journal of Physics G Nuclear Physics, 20, 637
- Ohm et al. (2009) Ohm S. et al. 2009, Astropart. Phys., 31, 383
- Ostapchenko (2011) Ostapchenko, S. 2011, Phys. Rev. D, 83, 014018
- Parsons Hinton (2014) Parsons R. Hinton J. 2014, Astropart. Phys., 56, 26
- Sobczyńska (2007) Sobczyńska, D. 2007, Journal of Physics G Nuclear Physics, 34, 2279
- Sobczyńska (2009) Sobczyńska, D. 2009, Journal of Physics G Nuclear Physics, 36, 04520
- Sobczyńska (2015) Sobczyńska, D. 2015, Journal of Physics G Nuclear Physics, 42, 095201
- Sobczynska & Adamczyk (2015) Sobczyńska, D. and Adamczyk K.., Proc of 34rd ICRC, Hague, The Netherlands, Id. 972, 2015, https://pos.sissa.it/cgi-bin/reader/conf.cgi?confid=236
- Szanecki et al. (2013) Szanecki, M., Bernlöhr, K., Sobczyńska, D., et al. 2013, Astroparticle Physics, 45, 1
- Ulrich et al. (2009) Ulrich, R., Blümer, J., Engel, R., Schüssler, F., & Unger, M. 2009, New Journal of Physics, 11, 065018
- Weekes (1989) Weekes T. et al. 1989, Astrophys. J., 342, 379
- Weekes et al. (2002) Weekes T. C. 2002, Astroparticle Physics, 17, 221
- Zanin et al. (2013) Zanin R. et al., Proc of 33rd ICRC, Rio de Janeiro, Brazil, Id. 773, 2013