Anomalous pairing of bosons: Effect of multi body interactions in optical lattice
Abstract
An interesting first order type phase transition between Mott lobes has been reported in Phys. Rev. Lett. 109, 135302 (2012) for a two-dimensional Bose-Hubbard model in the presence of attractive three-body interaction. We re-visit the scenario in a system of ultracold bosons in a one-dimensional optical lattice using the density matrix renormalization group method and show that an unconventional pairing of particles occurs due to the competing two-body repulsive and three-body attractive interactions. This leads to a pair superfluid phase sandwiched between the Mott insulator lobes corresponding to densities and in the strongly interacting regime. We further extend our analysis to a two dimensional Bose-Hubbard model using the self consistent cluster-mean-field theory approach and confirm that the unconventional pair superfluid phase stabilizes in the region between the Mott lobes in contrast to the direct first order jump as predicted before. In the end we establish connection to the most general Bose-Hubbard model and analyse the fate of the pair superfluid phase in presence of an external trapping potential.
pacs:
75.40.Gb, 67.85.-d, 71.27.+aUltracold atoms in optical lattices have lead to numerous exotic phenomena in recent years. An exquisite control over the system parameters such as the tunneling and interaction among atoms leads to the path breaking observation of the superfluid (SF)-Mott insulator (MI) transition in optical lattice followed by its theoretical prediction Bloch2 ; Zoller . This is an interesting manifestation of the many-body physics of simple Bose-Hubbard model. A strong on-site two-body repulsion which can be controlled by the technique of Feshbach resonance or by tuning the laser intensity, freezes the particle motion in the lattice and drives the system from the SF phase to MI phase. In addition to the two-body interaction, ultracold atomic systems in optical lattices also possess on-site three- and higher body interactions whose natural existence has been found in recent experiment SWill . Using the Feshbach resonance technique it is also possible, in principle, to tune the scattering length in such a way that the atomic interactions can become attractive in nature. It is to be noted that a small attractive interaction in an optical lattice leads to the collapse of all the atoms onto a single site Dalfovo . In such a scenario a tunable three or higher body interaction stabilises the system against collapse, e.g. a very strong three-body repulsion could prevent more than two atoms per site and an ensemble of pairs of bosons can be created. Under proper conditions of density and two-body interactions, the system exhibits a pair superfluid (PSF) phase which can be characterised by the finite off diagonal long range order (ODLRO) of composite particles or pairs. The infinitely strong three-body interaction can arise as a result of three-body loss process due to the elastic scattering of atoms Baranov .
Moreover, proposals have been made to engineer such three-body as well as higher order interactions in bosonic lattice systems in a controlled manner Petrov1 ; Petrov2 ; Daley2 . The effect of three-body interaction on the SF-MI transition has been studied extensively in the context of Bose-Hubbard model. As mentioned before, a critical two-body attraction between atoms and three-body hardcore constraint may lead to the PSF-SF (henceforth called atomic superfluid (ASF)) transition Baranov ; Wessel ; MSingh1 ; YZhang . On the contrary, for two-body repulsive interaction, the MI lobe for expands (shrinks) for repulsive (attractive) three-body interaction TSowinski1 ; MSingh1 . It is to be noted that the large three-body attraction will eventually lead to collapse. Hence, a strong four-body repulsion is required which can stabilize the system against such a collapse TSowinski1 .
Recently, in an interesting proposal, it was shown that the three-body interaction can be engineered in such a way that it affects only the triply occupied sites Sansone . This special form of the three-body interaction which is different from the conventional three-body interaction modifies the Bose-Hubbard model as;
| (1) | |||||
where is the bosonic creation (annihilation) operator, is the number operator for the site, and are site indices. and are the on-site two- and three-body interactions and is the hopping amplitude between the nearest neighbour sites .
It was shown that the model shown in Eq. 1 exhibits shrinking of the MI lobes for and (henceforth denoted as MI(2) and MI(4)) as a function of repulsive and attractive in a two-dimensional() Bose-Hubbard model eventually leading to a first-order transition from the MI(1) to MI(3) lobe Sansone . This first order transition was attributed to the suppression of double occupancy in favour of triply occupied sites in the limit of dominant three-body attraction. In this limit the doping of particles (holes) in MI(1) (MI(3)) lobe plays very important role. In such a scenario we ask a question, whether a similar phenomena can occur in one dimension where correlation effects are maximum?
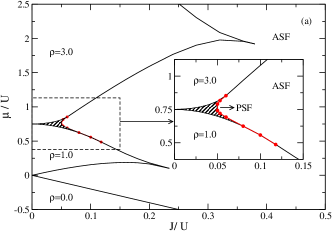
To address this question, we revisit the Bose-Hubbard model shown in Eq. 1 for a one dimensional optical lattice using the density matrix renormalization group (DMRG) method white . By considering repulsive and attractive , and for the specific value of , we obtain the complete phase diagram. Interestingly, in this case we see a counter intuitive situation where bosons pair up to form a pair superfluid phase (PSF). This anomalous PSF phase is sandwiched between the MI(1) and MI(3) lobes for large values of interaction strengths as shown in the DMRG phase diagram in Fig. 1(a). In our DMRG simulations we use system sizes up to sites and density matrix eigen states by keeping . We discuss about the details of the phases and phase transitions shown in the phase diagram of Fig. 1(a), in the following paragraphs.
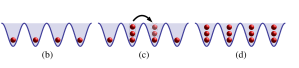
The phase diagram of Fig. 1(a) shows different quantum phases, namely, the MI(1), MI(3), the ASF and the PSF phases. We fix the ratio and vary to obtain the complete phase diagram by using the signatures from the chemical potential () vs. density () from our DMRG calculation TMishra1 . The gapped MI phases are characterised by the plateaus in the vs. plot, whereas, the superfluid phases appear around the Mott plateaus. The areas bounded by the black lines are the MI lobes, the shaded region bounded by red dots between the two MI lobes is the PSF phase and the remaining space is the ASF phase in the phase diagram in Fig.1(a). The existence of the PSF phase can be seen from the vs. curve as shown in Fig. 2 for a cut through the phase diagram at . It can be clearly seen that the MI(1) and MI(3) plateaus appear at and . In the region between the two MI phases the density jumps in discrete steps with respect to the chemical potential which is a signature of the superfluid phase. Within the superfluid region the PSF phase can be discerned by the characteristic finite system size behaviour which exhibits a series of jumps of , whereas, the jump of particle indicates the ASF phase. Here is the total particle number of the system. The insets of Fig. 2 show a zoomed in section of PSF and ASF regions.
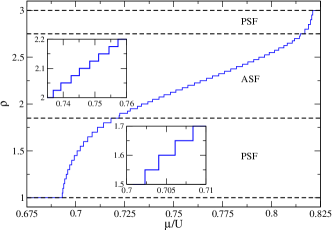
In order to further understand this pairing phenomena, we analyze the parity order which has been measured in the ultracold quantum gas experiments recently Bakr ; Endres . The parity order parameter is defined as
| (2) |
Here stands for the number operator at site. In Fig. 3 we plot the parity order as a function of for system sizes of at . It is clear from the figure that the value of is finite in the PSF phase and gradually vanishes in the ASF phase as the system size increases and the point of vanishing parity order parameter approaches the critical value for the PSF-ASF transition. This PSF-ASF transition is found to be of Ising universality class from the finite size scaling of the data. We plot with respect to in the inset of Fig. 3 for different lengths. Here represents the critical exponent corresponding to the universality class of the phase transition and is the correlation exponent. The complete collapse of the data for , and shows the Ising type PSF-ASF transition. The Ising nature of this transition is further complemented by calculating the fidelity susceptibility Gu which shows a divergent peak as one approaches the transition point (see supplementary material for details).
Although it seems intriguing to have a PSF phase in such a model with repulsive two-body interaction, one can understand this by analyzing the possible doping of particle (holes) from the MI(1) (MI(3)) phases in the region between the lobes. In general, when the system is in the Mott phases, any allowed doping should be in steps of single particle or hole for a purely repulsive Bose-Hubbard model. However, the presence of strong attractive favors an on-site three-particle state. As a result, when the chemical potential increases gradually, the system accumulates two particles at a time to minimize the energy. Eventually, the system enters into the MI(3) phase at skipping the MI(2) phase. As the uniform MI(1) phase in the background provides a constant repulsive interaction, a pair of particles can always hop around the lattice without any cost of energy. This process of two particles getting added at a time continues till the system reaches the MI(3) phase and these pairs of particles leads to the PSF phase. This phenomenon is depicted in Fig. 1(a, b and c). The MI(1)-PSF and PSF-MI(3) transitions are continuous phase transitions. This is confirmed from the absence of the discontinuous jump in the vs. curve. We also find that the MI(1)-ASF and ASF-MI(3) phase transitions are continuous in nature for the entire parameter space considered.
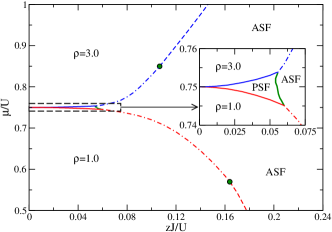
After getting the insight about the PSF phase in between the MI lobes for chain, one may ask why the above mentioned argument of boson pairing will not hold for a two dimensional optical lattice system ? To this end we re-investigate the two-dimensional Bose-Hubbard model for , using the self consistent cluster mean field theory (CMFT) approach McIntosh in the grand canonical ensemble. CMFT works very well for the simple models like Eq. 1 and matches fairly well with the Quantum Monte Carlo results. By using a four sites cluster and analyzing the ground state properties we obtain the complete phase diagram as shown in Fig.4. The MI(1) and MI(3) lobes are demarcated by the red and blue boundaries. Interestingly, in this case also we obtain a finite region of PSF phase which survives between the MI(1) and MI(3) phases bounded by the solid green line. This result is in contrast with the direct first order MI(1)-MI(3) phase transition shown in Ref. Sansone . The inset of Fig. 4 shows the zoomed in region depicting the PSF phase.
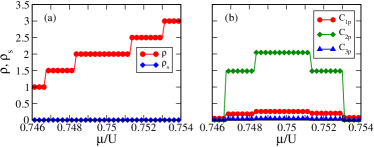
This phase diagram is obtained by using the behavior of density and the superfluid density (where is the superfluid order parameter) with respect to the chemical potential . We plot and with respect to along a cut through the CMFT phase diagram of Fig. 4 for which passes through the MI(1), PSF and MI(3) phases. The discrete jumps in the vs. plot(red circles) in steps of indicates the PSF phase as shown in Fig.5(a). The plateaus at and are due to the MI phases. The value of is zero throughout the cut which is shown as the blue diamonds. Further in Fig.5(b), we plot two-site correlation functions for single, pair and three particles of the form (red circles), (green diamond) and (blue triangles). It can be seen that is significantly larger than and which confirms the existence of the PSF phase. We identify the order of the phase transitions across the MI-ASF boundaries from the vs. behavior and from the hysteresis curves and mark them as dashed(dot-dashed) lines for first order (continuous) phase transitions in Fig. 4. The solid green circles correspond to the tricritical points. We also analyse the behaviour of the ground state energy with respect to the superfluid order parameter to verify the order of phase transitions(see supplementary material for details). Within our CMFT approach considered for model( 1), we could not clearly determine the order of MI(1)-PSF-MI(3) and the PSF-ASF transitions. However, a rigorous analysis of the order parameters, the ground state energy or a second order hopping term in the Hamiltonian is needed to understand these phase transitions which will be studied else where. We would like to mention that the CMFT results for the ASF-MI phase boundaries match fairly well with the QMC results in Ref. Sansone in the strong interaction limit. We verify this by performing finite size extrapolation with the data for , and sites clusters (see supplementary material details).
A simple strong coupling analysis shows that for , pair particles or paired holes move with an effective hopping amplitude . Hence, contrary to the mean field analysis, for any between the MI(1) and MI(3) lobes, an intermediate region of superfluid pairs may be found. For small the distance between MI(1) and MI(3) boundaries increases with as is clearly observed in Figs.1 and 4. The single site mean-field theory approach Sheshadri ; Stoof typically does not capture the PSF phase in such a model. For a single decoupled site, the density of the system becomes after a pair of particles is added to the MI(1) phase due to the strong three-body attraction, avoiding the double occupancy. This seems like a first order MI(1)-MI(3) transition. As the CMFT method treats a multi-site system exactly, it successfully captures the PSF phase in between the Mott lobes.
In the following we discuss about the possible experimental observation of the PSF phase in the presence of an external confining potential. Before going to the inhomogeneous case, we would like to mention that the results discussed above for the model given in Eq.1 can be achieved by starting from the conventional form of the three-body interaction and including a four-body interaction which has been observed in the experiment SWill . It can be easily shown that in the limit and at , the system is equivalent to the one considered in Eq. 1. Hence, by suitably engineering the two-, three- and four-body interaction, i.e. by making and one can achieve the PSF phase which is discussed above. In a recent proposal it was shown that it is possible to independently control these three interactions in an optical lattice Petrov1 . The choice of multi-body interactions i.e. and which translates the system into the one considered in Eq. 1 is one of many possible combinations shown in Ref. Petrov2 . Therefore, it can be made possible to achieve the PSF phase in the optical lattice experiment with the tunable multi-body interactions.
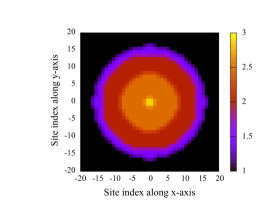
Now we move on to the inhomogeneous case in the presence of external confining potential. As the PSF phase is very narrow compared to the MI lobes, one can consider a suitable trapping potential to see the PSF region. In our calculation we consider and take a cut through the phase diagram corresponding to . Keeping the trap center just inside the MI(3) phase by fixing we obtain the density profile as shown in Fig.6. A clear wedding cake structure depicting the MI plateaus and the intermediate PSF phase is obtained which we map and show here in two dimension for clarity. The black region is the MI(1) phase and the central bright square is the MI(3) phase. The region in between these two MI phases is the PSF phase. This PSF phase can possibly be detected by using the parity measurement discussed above using the single site imaging spectroscopy Bakr ; Endres .
In summary, we re-investigate a Bose-Hubbard model in the presence of repulsive two-body () and attractive three-body () interaction where the three-body interaction is finite when the on-site particle number is three. By analyzing the one- and two-dimensional systems using the DMRG and CMFT approach respectively, we obtain the complete phase diagram and show that there exists a PSF phase in between the MI(1) and MI(3) lobes for . This result is in contrast to the previous study where a direct first order phase transition from MI(1) to MI(3) has been reported in a two dimensional system using the single site mean-field theory and the QMC methods Sansone . By analyzing the finite size scaling of important physical quantities, we show that the PSF-ASF transition in the case is of Ising universality class, whereas the MI(1)-PSF and PSF-MI(3) transitions are continuous. Within the CMFT approach we could not convincingly predict the ASF-PSF phase transitions. Although there exists a tricritical point along the MI(1)-ASF and ASF-MI(3) boundaries in the phase diagram , there are no such points in the case. We also discuss a scenario to achieve the model considered here by starting from the conventional forms of the multi-body interactions which is more suitable for ultracold atoms in optical lattice set up. In the end we discuss about the experimental realization of the PSF phase.
Acknowledgment:- We would like to acknowledge Luis Santos for stimulating discussions. The computational simulations were carried out using the Param-Ishan HPC facility at Indian Institute of Technology - Guwahati, India and the Leibniz University of Hannover, Germany, computing facility. M.S. would like to acknowledge DST-SERB, India for the financial support through Project No.PDF/2016/000569. S.G. acknowledges support from the German Research Foundation DFG (project no. SA 1031/10-1). T.M. acknowledges all the support from the start-up grant received from Indian Institute of Technology - Guwahati, India.
References
- (1) M. Greiner, O. Mandel, T. Esslinger, T. W. Hänsch, and I. Bloch, Nature (London) 415, 39 (2002).
- (2) D. Jaksch, C. Bruder, J. I. Cirac, C. W. Gardiner, and P. Zoller, Phys. Rev. Lett. 81 3108 (1998).
- (3) S. Will, T. Best, U. Schneider, L. Hackermüller, Dirk-Sören Lühmann, and I. Bloch, Nature (London) 465, 197 (2010).
- (4) F. Dalfovo, S. Giorgini, L. P. Pitaevski, and S. Stringari, Rev. Mod. Phys. 71, 463 (1999).
- (5) A. J. Daley, J. M. Taylor, S. Diehl, M. Baranov, and P. Zoller, Phys. Rev. Lett. 102, 040402 (2009).
- (6) D. S. Petrov, Phys. Rev. Lett. 112, 103201 (2014).
- (7) D. S. Petrov, Phys. Rev. A 90, 021601 (2014).
- (8) A. J. Daley and J. Simon, Phys. Rev. A 89, 053619 (2014).
- (9) L. Bonnes and S. Wessel, Phys. Rev. Lett. 106, 185302 (2011).
- (10) M. Singh, A. Dhar, T. Mishra, R. V. Pai, and B. P. Das, Phys. Rev. A 85, 051604(R) (2012).
- (11) B.-lun Chen, X.-bin Huang, S.-peng Kou, and Y. Zhang, Phys. Rev. A 78, 043603 (2008).
- (12) T. Sowiński, Phys. Rev. A 85, 065601 (2012).
- (13) A. Safavi-Naini, J. von Stecher, B. Capogrosso-Sansone, and Seth T. Rittenhouse, Phys. Rev. Lett. 109, 135302 (2012).
- (14) S. R. White, Phys. Rev. Lett. 69 , 2863 (1992).
- (15) T. Mishra, S. Greschner and L. Santos, Phys. Rev. A 91, 043614 (2015).
- (16) W. S. Bakr, J. I. Gillen, Amy Peng, Simon Fölling1, and M. Greiner, Nature 462, 74 (2009).
- (17) J. F. Sherson, C. Weitenberg, M .Endres, M. Cheneau, I. Bloch and S. Kuhr, Nature 467, 68 (2010).
- (18) S.-J. Gu, Int. J. Mod. Phys. B 24, 4371 (2010).
- (19) T. McIntosh, P. Pisarski, R. J. Gooding, and E. Zaremba, Phys. Rev. A 86, 013623 (2012).
- (20) D. Huerga, J. Dukelsky, and G. E. Scuseria, Phys. Rev. Lett. 111, 045701 (2013).
- (21) D. Yamamoto, A. Masaki, and I. Danshita, Phys. Rev. B 86, 054516 (2012).
- (22) S. R. Hassan and L. de’ Medici, Phys. Rev. B 81, 035106 (2010).
- (23) Dirk-Sören Lühmann, Phys. Rev. A 87, 043619 (2013).
- (24) M. Singh, T. Mishra, Ramesh V. Pai, and B. P. Das, Phys. Rev. A 90, 013625 (2014).
- (25) K. Sheshadri, H. R. Krishnamurthy, R. Pandit, and T. V. Ramakrishnan, Europhys. Lett. 22, 257 (1993).
- (26) D. van Oosten, P. van der Straten, and H. T. C. Stoof, Phys. Rev. A 63, 053601 (2001).