Stabilizing isolated attosecond pulse formation by dispersion tuning
Abstract
The carrier envelope phase (CEP) jitter of isolated attosecond pulses (IAPs) is theoretically and experimentally investigated based on the assumption that a significant contribution originates from the measurable CEP jitter of the driving laser. By solving the time-dependent Schrödinger equation, it is demonstrated that the attosecond CEP jitter of IAPs is minimized when the driving pulse is near its Fourier limit but with slightly negative chirp. Although, at present the utilization of the CEP of IAPs has limited applications, understanding and characterization of the CEP jitter of IAPs is the first step towards exact control of the electric field of extreme ultraviolet (XUV) pulses.
I Introduction
Stabilization of the carrier-envelope phase (CEP) of femtosecond laser pulses has revolutionized the field of strong-field physics enabling the electronic response of matter to be controlled and measured within one optical cycle Krausz2014 . In the past 20 years considerable effort has been carried out to actively stabilize the CEP of mode-locked oscillators Udem2002 or passively for optical parametric amplifiers Baltuska2002 . Subsequent chirped-pulse amplification (CPA) of these femtosecond pulses, at a lower repetition rate, requires a separate slow-loop feedback to stabilize the CEP. The remaining CEP jitter of these amplified pulses is dominated by the CPA process through thermal, beam-pointing and mechanical fluctuations Kakehata2002 and can be measured using various techniques Wittmann2009 ; PAULUS2 . An important application of these CEP stabilized femtosecond pulses is the generation of isolated attosecond pulses (IAPs) using high-harmonic generation (HHG) Krausz2009 ; Sansone2011 . However, the question arises to which extent the CEP jitter of the driving pulse affects the CEP jitter of the corresponding HHG-based IAP which may present an operational limit to the shortest attosecond pulses demonstrated so far Li2017 ; Zhao2012 ; Gaumnitz2017 .
In a typical attosecond setup using amplitude gating for HHG Frank2012 , the adjustment of the optical phase and the CEP of the driving laser pulses is usually done by a pair of wedges. Controlling the dispersion by these wedges generates near Fourier-transform-limited driving pulses. Provided the wedges are thin, small changes of the dispersion are treated as CEP control while neglecting the higher order dispersion terms, resulting in a change of the CEP over a range of a few rad.
In this work, we investigate this widely used concept with a complete treatment of the dispersion introduced by the wedges even for small changes in the absolute dispersion. The dependence of the HHG spectrum on the amount of dispersion given by the wedge position, centered around the Fourier-limited pulse, is called a ”CEP-scan”. In the past, changes in the CEP have been used to identify the half-cycle cutoff (HCO) positions which are extremely sensitive to the CEP and can additionally be used to measure the CEP extremely accurately Haworth2006 . The characteristic features of HCOs have been further investigated using quantum mechanical calculations by solving the ab initio time-dependent Schrödinger eqation (TDSE) in the single-active electron (SAE) approximation Henkel2013 .
Furthermore, theoretical studies are carried out to obtain the dependence of the CEP stability of IAPs on the measured CEP jitter of the driving laser pulses. We demonstrate that the CEP-scan technique can be used not only to identify wedge positions for maximum IAP bandwidth corresponding to near Fourier-limited driving laser pulses, but also and more importantly, for minimum CEP jitter of the IAPs. With respect to current developments towards the single-cycle limit of driving laser pulses Goulielmakis2008a ; Wirth2011b ; Mucke2015a ; Manzoni2015 , we believe that adequate control of the attosecond pulse is required and we demonstrate a first approach to stabilize the attosecond pulse formation by dispersion engineering for exremely short driving laser pulses.
II CEP-scan
We use a CEP-stabilized sub-6 fs few-cycle Ti:Sa-laser system to generate isolated attosecond pulses by amplitude gating and spectral filtering of the HHG cut-off region Gaumnitz2015a . The CEP defines the form and the length of the continuum region at the cut-off Constant1999 . Experimentally, the CEP is controlled by a pair of wedges introducing either a positive or negative chirp to a Fourier-limited pulse by material dispersion. The CEP stabilization and control are realised with a f-to-0f interferometer in the oscillator and a f-to-2f interferometer in the amplifier averaging over 30 shots. For this laser system, the CEP jitter was measured to be mrad. A neon-gas filled hollow-core fiber spectrally broadens the pulses and a set of chirped mirrors compresses the octave spanning spectrum to Fourier-transform-limited pulses of 5.9 fs. For HHG, the beam is focused into a neon filled target with a propagation length of mm. HHG spectra were recorded over many CEP periods as shown in Fig. 1c), with a slit grating spectrometer to identify the highest cut-off energy in the HHG spectrum.
II.1 CEP-Scan: Simulations
Classical and quantum mechanical simulations including the full dispersion of the wedges (CEP-scans) were performed and compared with the experimental results. First, the HHG process is modeled classically using the intensity model (see Gaumnitz2015a ), where the linear polarized laser electric field is expressed as:
| (1) |
where is the time-dependent field envelope and is the carrier frequency. The CEP of the driving laser is described by . For few-cycle pulses, the electric field extrema vary significantly in amplitude for adjacent half-cycles, leading to different cut-off energies in the HHG process. Interference of the half-cycle trajectories leads to a modulation of the spectrum. A continuum is generated, where no interference occurs. The classical cut-off depends linearly on the ionization potential of the medium () and the instantaneous intensity (): , so Corkum1993 . Therefore, the following simple relation for the energy range of the continuum is given as
| (2) |
where and are the values of the intensity maxima of the two neighboring half-cycles contributing to the highest energy part of the HHG process. The CEP dependency leads to values between zero for sine-like pulses and a maximum for cosine-like pulses. Second, the classical HCO model is a similar approach, but expands to all local field extrema Haworth2006 . With this model, the impact of the individual half cycles of a few-cycle pulse leads to localized features in the harmonic spectrum connected to the individual half-cycles of the driving pulse.
Third, for the quantum mechanical simulations, the electron dynamics leading to HHG is described by using the time-dependent Schrödinger equation (TDSE). TDSE calculations in single-active electron (SAE) approximation with intensity averaging were carried out, revealing a strong impact of the spectral phase on the HHG cut-off behavior Henkel2013 . A deviation from the spectral phase of a Fourier-transform-limited pulse leads to a reduced cut-off energy and shorter continuum.
For the simulations, the spectral and temporal shape of the initial pulse for rad is taken from the experiment measured with a SEA-F-SPIDER Kosik2005 and is Fourier transformed into the frequency domain together with the dispersion introduced by the wedges. In the following we distinguish between a pure CEP shift denoted as and a CEP shift introduced by dispersion (CEP-scan) denoted as . Thus, the electric field is multiplied with an additional phase term according to including the higher order dispersion. Spectrum and phase are then transformed back to the time domain. The resulting pulse shape used for further calculations is given by:
| (3) |
The fused-silica index of refraction is taken from Kitamura et al. Kitamura2007 . According to these values a change of the propagation distance in glass of m results in a change of by rad at a carrier wavelength of nm.
We performed the TDSE simulations in the single-active electron approximation in a two-dimensional (2D) model for the neon atom. Absorbing boundary conditions similar to Henkel2011 were employed to avoid unphysical reflections or transmissions at the grid borders. Further details for the TDSE simulation are discussed in Henkel2013 .
II.2 CEP-scan: Comparison of experiment and simulation results
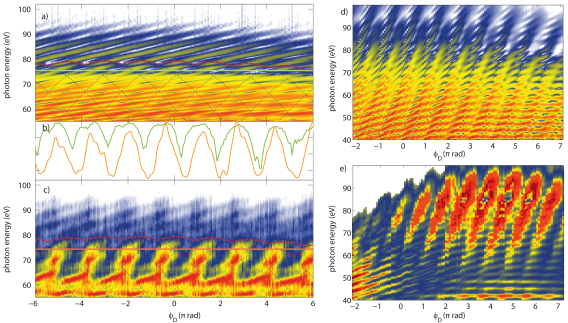
The comparison between two experimental CEP-scans and TDSE simulations is shown in Fig. 1. In Fig. 1c), a CEP-scan from the laser described in section II is given with a pulse duration of 5.9 fs pulse and an IR intensity of W/cm2 in neon. The spectral region below 75 eV is assigned to the HHG-plateau region. The region above 65 eV is strongly modulated when is varied. The less intense part above 75 eV is assigned to be the cut-off region, which is used in experiments to generate the IAP. The cut-off is reproduced with the intensity model indicated by the red dashed line. Fig. 1a) presents the corresponding results from the TDSE calculations using the parameters from the experiment. Experiment and simulations reveal spectrally shifting HHG lines above the classical cut-off, which cannot be attributed to a propagation effect as the TDSE calculations do not include such effects. Line-outs at 79 eV (green and orange solid lines in Fig. 1a) and c)) compare the simulation to experiment. Without dispersion, the periodicity is expected to be rad. However, in a CEP-scan the dispersion is varied and therefore the resulting electric field is not strictly periodic.
Good agreement with our theory is also obtained for a CEP-scan taken from Frank et al. Frank2012 . In Fig. 1 d) and e), the simulated spectra and the energy filtered experimental spectra for a CEP scan are shown, respectively. Note, that the simulations consider a 4 fs pulse with Gaussian temporal and spectral shape at an intensity of W/cm2. In the energy range from 40 to 60 eV of both the experimental and the simulated spectra clear diagonal () and horizontal () structures are visible, which can be used to determine rad in the experiment. With these two comparisons to experimental data, we rely on the simulations to extract an absolute rad value for calibration.
III Stabilizing the IAP generation
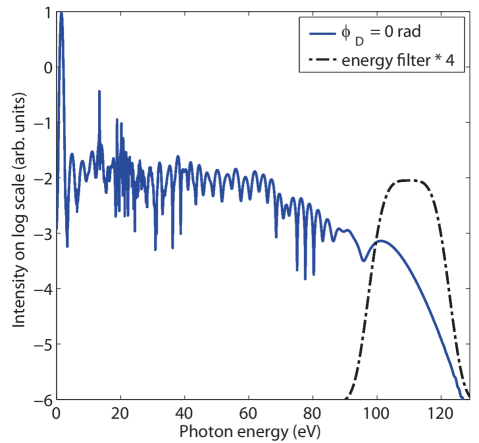
In order to demonstrate optimal IAP generation, further calculations are conducted with ideal pulses with a Fourier-limited duration of 3.8 fs and intensity of W/cm2. As an example, a single HHG spectrum for such a Fourier-limited driving pulse at is shown in Fig. 2. The black dash-dotted line indicates the spectral filter that is applied to generate IAPs. The corresponding temporal shape is given in Fig. 3a) for the complete CEP-scan, depicting the attosecond bursts.
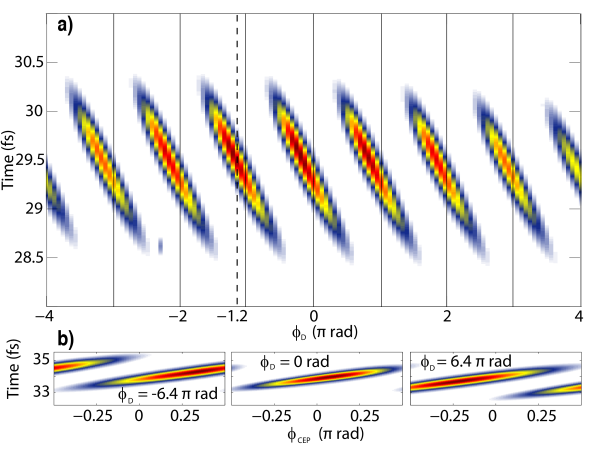
We investigate the influence of the CEP jitter on the HHG process by TDSE calculations for 3 positions in the CEP-scan at rad (negative chirp), rad, and rad (positive chirp) and varying in the range mrad to mimic the jitter of the laser system without dispersion (see Fig. 3b)). Note, we assume no further dispersive effects included in . For the negatively and the positively chirped pulses, CEP jitter can lead to the formation of two attosecond pulses with a probability of %. Only in the Fourier limited case (, see Fig. 3b) (center)) the additional jitter of the CEP allows for a single IAP almost over the full range of .
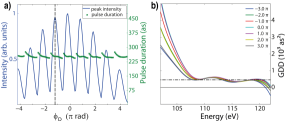
To determine the optimal IAP, we need to consider the CEP-scan phase with the largest IAP peak intensity. The peak intensity is shown in Fig. 4 a) by the blue line, while the green crosses indicate the pulse durations for the different values of . The rising edges in the intensity graph lead to longer IAP durations compared to the duration at maximum intensities. The shortest pulse durations can be achieved at the falling edge of the intensity slopes, but with the drawback of smaller IAP peak intensity. In the regions close to the intensity maxima, the pulse durations stay constant.
Next, we consider the spectral phase (GDD) of the IAPs at distinct positions of from rad to rad shown in Fig. 4b). Here, only slight differences in phase (GDD) are observed around the central photon energy of the attosecond pulse between 110 eV and 115 eV. At lower and higher photon energies the differences are more clearly visible. These differences lead to different temporal pulse shapes, and therefore, slightly different IAP pulse durations.
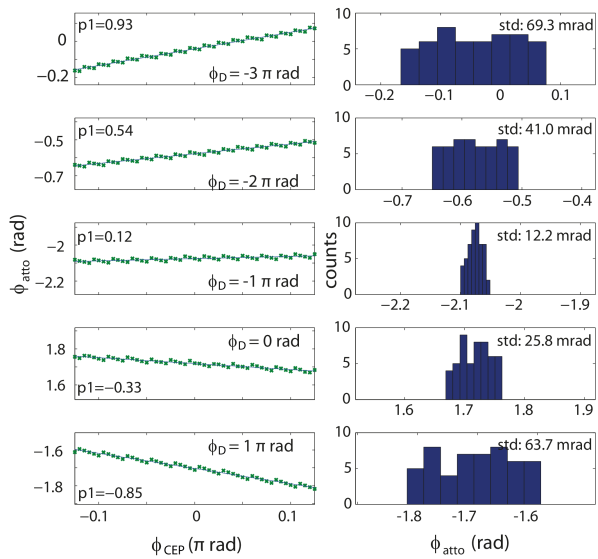
The influence of the CEP-jitter of the driving laser on the CEP of the IAP () is depicted in Fig. 5. Five positions from a CEP-scan of the driving laser at rad to rad are considered. For each , the dependence of on driving laser CEP without dispersion is calculated (Fig. 5 (left panel)). In each case, the dependency is found to be approximately linear over the considered range; the slopes of the linear dependency are provided in Fig. 5 (left panel). For the strongest up- and down-chirp, the slopes are steeper than the slope at rad. Corresponding histograms are generated (Fig. 5 (right panel)) for the CEP jitter of the IAP (), assuming a CEP-jitter of the driving laser from to 100 mrads. Clearly in this case, the choice for maximum IAP intensity at just below 0 (see Fig. 4 a)) does not achieve the minimum possible CEP jitter of the IAP at rad (see dashed line in Fig. 3 a) and 4 a)). Thus, the CEP jitter of the IAP, , is smallest for slightly negative chirped pulses.
IV Discussion
We demonstrate the possibility to optimize the driving laser’s spectral phase to generate ideally stable attosecond pulses using TDSE simulations including dispersion-free jitter . We found CEP-scan regimes of the driving laser pulse, where an additional jitter may result in the generation of two attosecond pulses of low intensity. Generally, by changing in a CEP-scan, a value for a theoretical minimum of the CEP jitter of the attosecond pulses can be identified. This minimum does not necessarily coincide with the most intense attosecond pulse and therefore a compromise between ideal CEP stability and intensity must be made. This value is accessible in the experiment by choosing the corresponding dispersion controlled by the pair of wedges. According to our simulations, a slight negative chirp of -1.2 rad yields optimal IAP formation and stability.
References
- (1) F. Krausz and M. I. Stockman, “Attosecond metrology: from electron capture to future signal processing,” Nature Photonics 8, 205–213 (2014).
- (2) T. Udem, R. Holzwarth, and T. W. Hänsch, “Optical frequency metrology,” Nature 416, 233–237 (2002).
- (3) A. Baltuška, T. Fuji, and T. Kobayashi, “Controlling the Carrier-Envelope Phase of Ultrashort Light Pulses with Optical Parametric Amplifiers,” Physical Review Letters 88, 133901 (2002).
- (4) M. Kakehata, Y. Kobayashi, H. Takada, and K. Torizuka, “Single-shot measurement of a carrier-envelope phase by use of a time-dependent polarization pulse,” Optics Letters 27, 1247–1249 (2002).
- (5) T. Wittmann, B. Horvath, W. Helml, M. G. Schätzel, X. Gu, A. L. Cavalieri, G. G. Paulus, and R. Kienberger, “Single-shot carrier–envelope phase measurement of few-cycle laser pulses,” Nature Physics 5, 357–362 (2009).
- (6) G. Paulus, “A meter of the ”absolute” phase of few-cycle laser pulses,” Laser Physics 15, 843–854 (2005).
- (7) F. Krausz and M. Ivanov, “Attosecond physics,” Reviews of Modern Physics 81, 163–234 (2009).
- (8) G. Sansone, L. Poletto, and M. Nisoli, “High-energy attosecond light sources,” Nature Photonics 5, 655–663 (2011).
- (9) J. Li, X. Ren, Y. Yin, K. Zhao, A. Chew, Y. Cheng, E. Cunningham, Y. Wang, S. Hu, Y. Wu, M. Chini, and Z. Chang, “53-attosecond X-ray pulses reach the carbon K-edge,” Nature Communications 8, 186 (2017).
- (10) K. Zhao, Q. Zhang, M. Chini, Y. Wu, X. Wang, and Z. Chang, “Tailoring a 67 attosecond pulse through advantageous phase-mismatch,” Optics Letters 37, 3891 (2012).
- (11) T. Gaumnitz, A. Jain, Y. Pertot, M. Huppert, I. Jordan, F. Ardana-Lamas, and H. J. Wörner, “Streaking of 43-attosecond soft-x-ray pulses generated by a passively cep-stable mid-infrared driver,” Opt. Express 25, 27506–27518 (2017).
- (12) F. Frank, C. Arrell, T. Witting, W. A. Okell, J. McKenna, J. S. Robinson, C. A. Haworth, D. Austin, H. Teng, I. A. Walmsley, J. P. Marangos, and J. W. G. Tisch, “Invited Review Article: Technology for Attosecond Science,” Review of Scientific Instruments 83, 071101 (2012).
- (13) C. A. Haworth, L. E. Chipperfield, J. S. Robinson, P. L. Knight, J. P. Marangos, and J. W. G. Tisch, “Half-cycle cutoffs in harmonic spectra and robust carrier-envelope phase retrieval,” Nature Physics 3, 52–57 (2007).
- (14) J. Henkel, T. Witting, D. Fabris, M. Lein, P. L. Knight, J. W. G. Tisch, and J. P. Marangos, “Prediction of attosecond light pulses in the VUV range in a high-order-harmonic-generation regime,” Physical Review A 87, 043818 (2013).
- (15) E. Goulielmakis, M. Schultze, M. Hofstetter, V. S. Yakovlev, J. Gagnon, M. Uiberacker, A. L. Aquila, E. M. Gullikson, D. T. Attwood, R. Kienberger, F. Krausz, and U. Kleineberg, “Single-cycle nonlinear optics,” Science 320, 1614–1617 (2008).
- (16) A. Wirth, M. T. Hassan, I. Grguras, J. Gagnon, A. Moulet, T. T. Luu, S. Pabst, R. Santra, Z. A. Alahmed, A. M. Azzeer, V. S. Yakovlev, V. Pervak, F. Krausz, and E. Goulielmakis, “Synthesized Light Transients,” Science 334, 195–200 (2011).
- (17) O. D. Mücke, S. Fang, G. Cirmi, G. M. Rossi, S. H. Chia, H. Ye, Y. Yang, R. Mainz, C. Manzoni, P. Farinello, G. Cerullo, and F. X. Kärtner, “Toward Waveform Nonlinear Optics Using Multimillijoule Sub-Cycle Waveform Synthesizers,” IEEE Journal on Selected Topics in Quantum Electronics 21, 1–12 (2015).
- (18) C. Manzoni, O. D. Mücke, G. Cirmi, S. Fang, J. Moses, S. W. Huang, K. H. Hong, G. Cerullo, and F. X. Kärtner, “Coherent pulse synthesis: Towards sub-cycle optical waveforms,” Laser and Photonics Reviews 9, 129–171 (2015).
- (19) T. Gaumnitz, “Development, set-up, and characterization of an apparatus for attosecond electron spectroscopy,” Phd thesis, University of Hamburg (2015).
- (20) E. Constant, D. Garzella, P. Breger, E. Mével, C. Dorrer, C. Le Blanc, F. Salin, and P. Agostini, “Optimizing High Harmonic Generation in Absorbing Gases: Model and Experiment,” Physical Review Letters 82, 1668–1671 (1999).
- (21) P. Corkum, “Plasma perspective on strong field multiphoton ionization,” Physical Review Letters 71, 1994–1997 (1993).
- (22) E. M. Kosik, L. Corner, A. S. Wyatt, E. Cormier, I. A. Walmsley, and L. F. Dimauro, “Complete characterization of attosecond pulses,” Journal of Modern Optics 52, 361–378 (2005).
- (23) R. Kitamura, L. Pilon, and M. Jonasz, “Optical constants of silica glass from extreme ultraviolet to far infrared at near room temperature.” Applied optics 46, 8118–8133 (2007).
- (24) J. Henkel, M. Lein, and V. Engel, “Interference in above-threshold-ionization electron distributions from molecules,” Physical Review A - Atomic, Molecular, and Optical Physics 83, 2–5 (2011).
Acknowledgements
We thank J. W. G. Tisch for discussions and support for the HCO calculations as well as the kind permission to reproduce Fig. 22 from Frank2012 for our analysis.
We are grateful for financial support of the Landesexzellenzcluster ”Frontiers in Quantum Photon Science”. T.G. and J.H.1 acknowledge funding from the Joachim Herz foundation. J.H.1 acknowledges support from the IMPRS UFAST. J.H.2 acknowledges funding from the EU Marie Curie Initial Training Network FASTQUAST. We acknowledge financial support from the Deutsche Forschungsgemeinschaft.
Additional information
We declare that we have no significant competing financial, professional or personal interests that might have influenced the performance or presentation of the work described in this manuscript.