CP3-17-45
Single top-quark production at the Tevatron and the LHC
Abstract
This paper provides a review of the experimental studies of processes with a single top quark at the Tevatron proton-antiproton collider and the LHC proton-proton collider. Single top-quark production in the -channel process has been measured at both colliders. The -channel process has been observed at the Tevatron, and its rate has been also measured at the center-of-mass energy of 8 TeV at the LHC in spite of the comparatively harsher background contamination. LHC data also brought the observation of the associated production of a single top quark with a boson as well as with a boson. The Cabibbo-Kobayashi-Maskawa matrix element is extracted from the single-top-quark production cross sections, and -channel events are used to measure several properties of the top quark and set constraints on models of physics beyond the Standard Model. Rare final states with a single top quark are searched for, as enhancements in their production rates, if observed, would be clear signs of new physics.
I Introduction
The top quark is the heaviest elementary particle in the Standard Model (SM), having a mass of more than 170 GeV Patrignani et al. (2016). According to the description of the origin of fermion masses provided by the SM (also valid in many of its extensions) Weinberg (1967), we can relate the top-quark mass to the strength of the interaction between top-quark and Higgs-boson fields (a so called “Yukawa coupling”, here indicated as ), obtaining a value of order unity. After the discovery of the Higgs boson ATLAS Collaboration (2012c); CMS Collaboration (2012b) this has been confirmed by direct studies of its couplings ATLAS and CMS Collaborations (2016). The top quark therefore plays an outsized role in electroweak symmetry breaking due to its large mass, which also makes it a sensitive probe to physics beyond the SM (BSM).
The relationship between the mass and the decay width of an elementary fermion allows to determine for the top quark a lifetime of order s, a couple of orders of magnitude shorter than the timescale of the so called hadronization process, that “dresses” colored quarks into color-neutral hadrons. That a decay mediated by a weak interaction may be faster than a process mediated by the strong interaction is at first sight surprising; intuitively, this is due to the fact that the top-quark mass is larger than the sum of the and masses, therefore there is no barrier to overcome and we have a two-body decay with a real boson, instead of the usual three-body decay mediated by a virtual boson. The top quark is the only quark to decay before it can hadronize Bigi et al. (1986), providing the unique opportunity to study a “naked” quark.
At hadron colliders, the predominant production process is top-quark pair production (), mediated by the strong force. In contrast, this article is devoted to various mechanisms that produce single top quarks or antiquarks, mediated in the SM by electroweak interactions and possibly receiving contributions from BSM physics. While the pair-production process was discovered more than twenty years ago Abe et al. (1995); Abachi et al. (1995) and entered the domain of precision physics many years ago, single top-quark production has been observed less than a decade ago at the Tevatron Abazov et al. (2009); Aaltonen et al. (2009a). In comparison to production, the single top-quark signal is small and difficult to separate from the backgrounds (including itself), hence the measurement precision for its cross sections and other properties has generally been relatively modest until recently. Nevertheless, despite being mediated by the weak interaction, single top-quark production has a production cross-section that is within an order of magnitude of production. This is due to the more copious bottom quark and gluon content of the proton at the smaller energy required to produce a single top quark ( GeV) compared to two of them ( GeV), as pointed out by Willenbrock and Dicus (1986) for the first time.
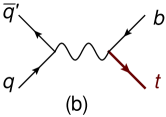
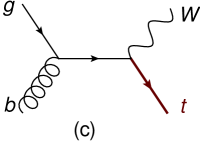
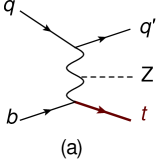
In the SM, single top-quark production is a charged-current electroweak process that involves the vertex in the production of the top quark and in its decay, with only negligible contributions from and couplings, and even smaller contributions from Flavor-Changing Neutral Currents (FCNC). Precise measurements of single top-quark cross sections are motivated by their sensitivity to new physics that modifies either the production or the decay vertex or both Aguilar-Saavedra (2009a). The single top-quark production cross section under the SM assumptions is proportional to the square of the Cabibbo-Kobayashi-Maskawa (CKM) Cabibbo (1963); Kobayashi and Maskawa (1973) matrix element Alwall et al. (2007); Lacker et al. (2012). The three most abundant and most studied single top-quark processes are illustrated at Born level in Fig. 1. Their production cross sections differ between the Tevatron proton-antiproton collider and the LHC proton-proton collider. The -channel process proceeds through the exchange of a boson between a light-quark line and a heavy-quark line and has the largest production cross section at both colliders. The -channel process is the production and decay of a heavy off-shell boson. Since it starts from a quark-antiquark initial state, this process has a comparatively large cross section in collisions (roughly half that of the -channel, at the Tevatron) and a comparatively small cross section in collisions at the LHC. The -associated production, or , has a top quark and a boson in the final state. Its initial state consists of a gluon and a quark, and its production cross section at the Tevatron center-of-mass (CM) energy is so small that this was never observed at that collider, while at LHC energies it is the second-largest production mechanism.

Being produced by parity-violating electroweak processes, the top quarks in single top-quark production are always polarized. The degree of polarization is close to 100% in - and -channel production Mahlon and Parke (2000); Jezabek and Kuhn (1994), in striking difference to production, where the SM expects them to be completely unpolarized. Both the timescales for production () and decay (, where is about 2 GeV) of the top quark are smaller than the hadronization time scale (, where GeV) which, in turn, is an order of magnitude smaller than the spin decorrelation time (). Thus the top-quark polarization is transferred to its decay products and can be accessed through their angular distributionss, as described in Section IV.4.
Different BSM scenarios predict different effects in the different production channels Tait and Yuan (2000), and this motivates the study of all of them, in conjunction with properties, to exploit their complementarity. Some of these new-physics effects in -channel and production might be mimicked by inaccuracies in the gluon or -quark parton distribution functions (PDF) at large 111The symbol is used to indicate the quantity “Bjorken ”, i.e. the fraction of the incoming proton’s total momentum involved in the parton-level scattering. and it is therefore necessary to rule out this possibility by additional dedicated inputs. Precise measurements of the cross sections of the three main production modes may have a deep impact on PDF constraints, with the three channels being complementary to each other and also to production. For example, the -channel and cross sections are sensitive to the -quark PDF and anti-correlated with the cross section, while the -channel (essentially a Drell-Yan process, hence correlated with the cross section) is insensitive to the -quark PDF and can therefore act as a control process Guffanti and Rojo (2010). Moreover, the integrated or differential charge asymmetry in -channel production provides a powerful input to constrain PDFs, similar to the case of -boson production, in a region of very relevant for several searches. Examples of new physics that might influence -channel production include a vector-like fourth generation quark with chromo-magnetic couplings Nutter et al. (2012), a color triplet Drueke et al. (2015), and FCNC interactions of the top quark with the gluon and the charm quark Aguilar-Saavedra (2009a). The -channel mode is also sensitive to new resonances decaying to a top quark Drueke et al. (2015), while the mode is sensitive to vector-like quarks Aguilar-Saavedra (2009b) and resonances decaying to a top quark and a boson Nutter et al. (2012).
Experimentally, the study of top quarks proceeds by the reconstruction of its decay products. Almost all top quarks decay into a boson and a quark Abazov et al. (2011a); Aaltonen et al. (2013, 2014a); CMS Collaboration (2014a). The former promptly decays either into a charged lepton and a neutrino, or into a light quark-antiquark pair. The presence of an isolated electron or muon, in particular, is used as a selection requirement in almost all single top-quark production studies, as those two particles are particularly easy to identify with large efficiency and low background contamination even in the busy particle environment created by hadron-hadron collisions. The neutrino is undetectable because of its negligible cross section of interaction with the detector material. But the large momentum that it carries, being boosted by the decay of the massive boson, which is in turn boosted by the decay of the even more massive top quark, is conspicuous by its absence: the large momentum imbalance of the system formed by all visible particles can be used to reconstruct the neutrino momentum. At hadron colliders, this quantity is meaningful only in the plane transverse to the beam directions (the fraction of proton or antiproton momentum carried by the interacting quarks or gluons is only known on a statistical basis via their PDF), and therefore it is customary to define a missing transverse momentum or missing transverse energy (). The jets from -quark hadronization can be separated on a statistical basis from those originating from lighter quarks (i.e., those jets can be “-tagged”). The heavier a quark is, the more asymmetric is the sharing of energy among the hadronization products Bjorken (1978); in particular, a -flavored hadron carries about 70% of the original momentum of the corresponding quark Heister et al. (2001); Abdallah et al. (2011); Abbiendi et al. (2003); Abe et al. (2002). The long lifetime of this -flavored hadron ( s) corresponds to a flight distance of the order of millimeters, which can be measured in the detectors. Charged leptons, and -tagged jets are among the tell-tale signs of the presence of top quarks in a collision event; to further identify the production mechanism, the presence or absence of accompanying objects is crucially exploited, as we will show in the following sections. The single top-quark signal is further separated from the backgrounds through the use of multi-variate analysis (MVA) algorithms that combine kinematic properties of the reconstructed objects into a powerful discriminant.
Ten years ago, Gerber et al. (2007) extrapolated the Tevatron single top-quark studies to LHC conditions; it was already clear, at the time of that report, that the large increase in cross section would make precision measurements possible. We recommend Boos and Dudko (2012) as reading material for the relevant theoretical issues, while Husemann (2017) and Cristinziani and Mulders (2017) provide recent overviews of the full LHC top-quark physics program. Giammanco (2016) wrote a previous experimental review of single top-quark studies, limited to the LHC experiments and written before the first measurements at 13 TeV were available.
The theoretical cross section for single top-quark production in the -channel has been computed at next-to-leading order (NLO) in quantum chromo-dynamics (QCD) Harris et al. (2002); Campbell et al. (2004); Schwienhorst et al. (2011); Cao et al. (2005a); Cao and Yuan (2005), including next-to-next-to-leading log (NNLL) corrections Kidonakis (2011) and at next-to-next-to-leading order (NNLO) Brucherseifer et al. (2014); Berger et al. (2016). The cross section for the -channel process has been computed at NLO Harris et al. (2002); Campbell et al. (2004); Cao et al. (2005b); Heim et al. (2010), and including NNLL corrections Kidonakis (2010a). The cross section for the process has been computed at NLO Campbell et al. (2004), and including NNLL corrections Kidonakis (2010b). For each process, both total and differential cross sections are available.
This review is organized as follows: The Tevatron and LHC colliders and experiments are described in Section II, the cross section measurements are summarized and compared in Section III, the extraction of parameters from the cross-section measurements and searches for new physics are described in Section IV. We conclude in Section V, providing some thoughts on the future of this research direction.
II Hadron colliders and experiments
Only two particle colliders have had sufficient CM energy and integrated enough luminosity to produce top quarks — the Tevatron proton-antiproton collider at Fermilab Wilson (1977); Holmes (1998); Lebedev and Shiltsev (2014) and the LHC proton-proton collider at CERN Evans and Bryant (2008). The different initial states lead to different production processes: At the Tevatron, hard-scale processes (including all top-quark production mechanisms or processes involving the exchange of massive mediators) are dominated by quark-antiquark initial states, while at the LHC they are dominated by initial states with one or two gluons. In addition, the LHC has accumulated large amounts of proton-proton () collision data at three different CM energies, 7 TeV, 8 TeV, and 13 TeV, while the Tevatron accumulated a large amount of proton-antiproton data at 1.96 TeV. The Tevatron initially collected data at 1.8 TeV, with sufficient statistics to discover the top quark in pair production Abe et al. (1995); Abachi et al. (1995), but insufficient to measure single top-quark production Acosta et al. (2002); Abbott et al. (2000).
The algorithms for the identification and reconstruction of the so-called analysis objects (e.g., electrons, muons, hadronic jets) are similar though not identical at the different experiments, reflecting their complementary strengths. The focus in single top-quark selections is on identifying isolated high- electrons or muons together with large and one or more jets, at least one of which is required to be -tagged to identify the quark from the top-quark decay. The Tevatron experiments, CDF and D0, use two different jet reconstruction algorithms with different cone sizes. The LHC experiments ATLAS and CMS use the same anti- algorithm Salam and Soyez (2007), though during Run 1 different radius parameters were used. The thresholds for leptons and jets at the Tevatron are typically lower (15 GeV to 20 GeV) than at the LHC (20 GeV to 30 GeV), giving higher acceptances for single top-quark events, compensated partially by the harder spectrum caused by the larger CM energies at the LHC. All -tagging algorithms in these four experiments exploit information related to the lifetime of the -flavored hadrons, in many cases combined with complementary information such as the mass and track multiplicity of the secondary vertices (when present) and/or by the observation of charged leptons inside the jet. The -tagging efficiencies, for similar light-quark rejection factors, are smaller at the Tevatron (50% to 65%) Acosta et al. (2005b); Abazov et al. (2014) compared to the LHC (65% to 85%) ATLAS Collaboration (2016c); CMS Collaboration (2013b).
II.1 Tevatron
The Tevatron was a proton-antiproton collider with two interaction regions that were surrounded by two multi-purpose experiments, CDF and D0, to record the collisions. Run 1 at the Tevatron lasted from 1992 to 1996 and delivered 0.12 fb-1 of data at a CM energy of 1.8 TeV. That was sufficient to produce top-quark pairs via the strong interaction, leading to the top-quark discovery Abe et al. (1995); Abachi et al. (1995). Run 2 at the Tevatron lasted from 2002 to 2011, delivering 10 fb-1 of data at a CM energy of 1.96 TeV and kicking off the single top-quark program.
II.1.1 CDF
The CDF (Collider Detector at Fermilab) experiment Acosta et al. (2005a) in Run 2 at the Tevatron consisted of a magnetic spectrometer surrounded by calorimeters and muon detectors. The charged-particle tracking system was contained in a 1.4 T solenoid. CDF had a precision tracking system, with silicon microstrip detectors providing charged-particle tracking close to the beam pipe. It was surrounded by an open-cell drift chamber which covered a radial distance out to 137 cm and provided up to 96 measurements of the track position. The fiducial region of the silicon detector extended in pseudorapidity up to , while the drift chamber provided full radial coverage up to . Segmented electromagnetic and hadronic (iron-scintillator) sampling calorimeters surrounded the tracking system and measured the energy of interacting particles, covering the range . The momentum of muons was measured by drift chambers and scintillation counters out to . The CDF trigger system selected events in a three-level architecture. The first (hardware-based) level accepted events at a rate of up to 30 kHz, while the second (firmware and software-based) level reduced the rate to less than 750 Hz, and the third (software-based) level reduced that rate to up to 200 Hz.
In the offline analyses of CDF data, jets were identified using a fixed-cone algorithm with a cone radius of 0.4. Heavy-flavor jets were -tagged based on secondary vertex reconstruction. Electrons were reconstructed as charged particles in the tracking system that leave the majority of their energy in the electromagnetic section of the calorimeter. Muons were identified as charged particles in the tracker that leave hits in the muon chambers located outside the calorimeter. The was measured from the imbalance of energy observed in the calorimeter, projected in the transverse plane of the detector, with corrections to take into account the calibration of the energy that could be attributed to analysis objects such as jets, electrons or muons. CDF collected an integrated luminosity of 9.5 in Run 2.
II.1.2 D0
The D0 detector Abazov et al. (2006) in Run 2 at the Tevatron had a central tracking system consisting of a silicon microstrip tracker and a central fiber tracker, both located within a 2 T superconducting solenoidal magnet. The central tracking system was designed to optimize tracking and vertexing at detector pseudorapidities of . A liquid-argon sampling calorimeter had a central section covering and two endcap calorimeters that extended coverage to . An outer muon system, with pseudorapidity coverage of , consisted of a layer of tracking detectors and scintillation trigger counters in a magnetic field of 1.8 T provided by iron toroids. Events were selected by a three-level trigger system, with the first two (hardware-based and hardware/software-based) levels accepting an event rate of about 1 kHz, which was reduced to less than 100 Hz with the software-based third level.
In the offline analyses, jets were identified as energy clusters in the electromagnetic and hadronic parts of the calorimeter, reconstructed using an iterative mid-point cone algorithm with radius Blazey et al. (2000). Heavy-flavor jets were -tagged based on a multivariate analysis (MVA) algorithm that combines the information from the impact parameters of tracks and from variables that characterize the properties of secondary vertices within jets. Electrons were identified as energy clusters in the calorimeter with a radius of 0.2, matched to a track. Muons were identified as segments in the muon system that are matched to tracks reconstructed in the central tracking system. The was measured with the calorimeter and corrected for the presence of reconstructed objects. D0 collected an integrated luminosity of 9.7 in Run 2.
II.2 LHC
The Large Hadron Collider (LHC) operates since 2009 as a proton-proton, proton-lead and lead-lead collider 222A short “pilot run” in October 2017 also provided few hours of xenon-xenon collisions., at CM energies ranging from 900 GeV to 13 TeV. Collisions happen at four beam-crossing points, and data are recorded by seven experiments: the multi-purpose experiments ATLAS ATLAS Collaboration (2008) and CMS CMS Collaboration (2008), the -physics experiment LHCb LHCb Collaboration (2008), the heavy-ion experiment ALICE ALICE Collaboration (2008), the forward-physics experiments TOTEM (at the CMS collision point) Berardi et al. (2004a, b) and LHCf (at the ATLAS collision point) Adriani et al. (2006), and the MoEDAL experiment (at the LHCb collision point) optimized for the search of magnetic monopoles and other highly-ionizing hypothetical particles Pinfold et al. (2009). The following run periods are of relevance for the studies reported in this review: 7 TeV runs in 2010 and 2011, with about 5 of good data collected by each of the multi-purpose experiments; 8 TeV run in 2012, where about 20 of data were collected per experiment; and 13 TeV runs since 2015, with around 40 per experiment collected by the end of 2016. The LHC and the experiments continue to operate well at the time of writing, with much larger datasets expected to be collected. Only the experiments that contribute to single top-quark studies (ATLAS, CMS, and LHCb) are described in this section.
II.2.1 ATLAS
The ATLAS (A Toroidal LHC ApparatuS) experiment ATLAS Collaboration (2008) is a multi-purpose particle detector with a forward-backward symmetric cylindrical geometry. ATLAS comprises an inner detector (ID) surrounded by a thin superconducting solenoid providing a 2 T axial magnetic field, a calorimeter system and a muon spectrometer in a toroidal magnetic field. The ID tracking system covers the pseudorapidity range and consists of silicon pixel, silicon microstrip, and transition radiation tracking detectors. Lead/liquid-argon sampling EM and forward calorimeters and steel/scintillator-tile central hadronic calorimeters provide energy measurements with pseudorapidity coverage of . The muon spectrometer surrounds the calorimeters and consists of large air-core toroid superconducting magnets with trigger and tracking chambers out to . Events are selected in Run 1 in a three-level trigger system with the first (hardware-based) level accepting an event rate of less than 75 kHz and Level 2 and the event filter (both software-based) reducing the accepted rate to about 400 Hz. In Run 2, there are two trigger levels, accepting event rates of 100 kHz and 1 kHz, respectively.
Jets are reconstructed using the anti- jet clustering algorithm Salam and Soyez (2007) with a radius parameter of . Heavy-flavor jets are -tagged based on a combination of multivariate algorithms which take advantage of the long lifetime of -flavored hadrons and the topological properties of secondary and tertiary decay vertices reconstructed within the jet. Electrons are reconstructed from energy clusters in the calorimeter which are matched to inner detector tracks. Electrons are identified in the pseudorapidity region , excluding the transition region between barrel and endcap calorimeters of . Muons are reconstructed by combining matching tracks reconstructed in both the inner detector and the muon spectrometer up to . An upgrade of the silicon pixel detector, with the addition of a fourth layer of pixel sensors closer to the beam pipe, was performed between Run 1 and Run 2, enhancing the ATLAS performances in tracking and vertexing and consequently improving -tagging performances.
During the runs at 7 TeV, in 2010 and 2011, ATLAS accumulated respectively 35 and about 5 of data usable for physics analysis. In 2012, about 20 were accumulated at 8 TeV, while about 3 and 33 were collected at 13 TeV in 2015 and 2016, respectively.
II.2.2 CMS
The CMS (Compact Muon Solenoid) experiment is, similarly to ATLAS, a multi-purpose detector with cylindrical forward-backward symmetry. It features a superconducting solenoid of 6 m internal diameter, providing a magnetic field of 3.8 T. Within the solenoid volume are a silicon pixel and strip tracker, a lead tungstate crystal electromagnetic calorimeter (ECAL), and a brass and scintillator hadron calorimeter (HCAL), each composed of a barrel and two endcap sections. Forward calorimeters extend the pseudorapidity coverage provided by the barrel and endcap detectors. Muons are measured in gas-ionization detectors embedded in the steel flux-return yoke outside the solenoid. A more detailed description of the CMS detector can be found in CMS Collaboration (2008). Events of interest are selected using a two-tiered trigger system CMS Collaboration (2017h). The first level (L1), composed of custom hardware processors, uses information from the calorimeters and muon detectors to select events at a rate of around 100 kHz. The second level, known as the high-level trigger (HLT), consists of a farm of processors running a version of the full event reconstruction software optimized for fast processing, and reduces the event rate to less than 1 kHz before data storage.
All single top-quark analyses published by the CMS collaboration have profited from the performances of the so called particle-flow (PF) algorithm CMS Collaboration (2017e). The PF algorithm (also called global event reconstruction) reconstructs and identifies each individual particle with an optimized combination of information from the various elements of the CMS detector. The energy of photons is directly obtained from the ECAL measurement. The energy of electrons is determined from a combination of the electron momentum at the primary interaction vertex as determined by the tracker, the energy of the corresponding ECAL cluster, and the energy sum of all bremsstrahlung photons spatially compatible with originating from the electron track. The energy of muons is obtained from the curvature of the corresponding track. The energy of charged hadrons is determined from a combination of their momentum measured in the tracker and the matching ECAL and HCAL energy deposits, corrected for zero-suppression effects and for the response function of the calorimeters to hadronic showers. Finally, the energy of neutral hadrons is obtained from the corresponding corrected ECAL and HCAL energy. Jets and are reconstructed using as input the list of particles provided by the PF algorithm. Jets are reconstructed with the the anti- jet clustering algorithm with a radius parameter of in Run 1 and in Run 2. Heavy-flavor jets are -tagged based on a combination of multivariate algorithms which take advantage of the long lifetime of -hadrons and the topological properties of secondary and tertiary decay vertices reconstructed within the jet.
During the runs at 7 TeV, in 2010 and 2011, CMS accumulated respectively 36 and 5 of certified data, defined as the data collected when all sub-detectors and the magnet are fully operational. In 2012, 20 were accumulated at 8 TeV, while 2.3 and 36 of certified data were recorded at 13 TeV in 2015 and 2016, respectively.
II.2.3 LHCb
The LHCb detector LHCb Collaboration (2008) is a single-arm forward spectrometer with pseudo-rapidity acceptance of , designed for the study of particles containing or quarks. A warm dipole magnet provides an integrated field of 4 Tm and surrounds the tracking systems, which include a vertex locator and silicon microstrip tracker. Additional tracking stations are located outside the magnet, made of silicon microstrips and Ring Imaging Cherenkov counters. The calorimeter has a preshower, electromagnetic, and hadronic part. Five muon stations based on multi-wire proportional chambers, one in front of and the rest behind the calorimeters, record the trajectory of muons. Events are recorded by a two-level triggering: a hardware-based Level 0 which accepts events at a rate of about 1 MHz and a software-based HLT that reduces the rate to about 2 kHz. Events passing the muon trigger have been used for top-quark analysis (Section III.2.3.)
As the LHCb detector is not hermetic, a complete reconstruction of top-quark decay products is unfeasible as , the usual proxy for the sum of transverse neutrino momenta, is not usable, and the visible decay products of the top quark are unlikely to be all directed to the same hemisphere in events. For this reason, top-quark measurements can only be performed in a fiducial region that includes contributions to the and final states from single and pair production modes LHCb Collaboration (2015, 2017). LHCb recorded 1.1 at 7 TeV, 2.1 at 8 TeV and about 2 at 13 TeV in 2015 and 2016.
III Cross section measurements
The cross sections of four single top-quark production mechanisms have been measured at the hadron colliders. The cross section of -channel production, Fig. 1(a), is largest at both the Tevatron and LHC colliders, about of the top-quark pair production cross section. The production of -channel single top quarks, Fig. 1(b), is initiated at Born level by annihilation and the cross section is therefore larger in than in collisions (at the same CM energy), about half that of -channel production at the Tevatron. The cross section of production, Fig. 1(c), while being experimentally inaccessible at the Tevatron, is the second largest one at the LHC due to the higher CM energy and larger gluon PDF. The much rarer process has been observed only recently thanks to the large statistics accumulated by the LHC in Run 2.
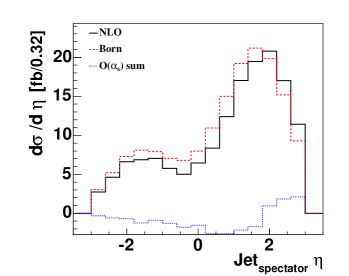
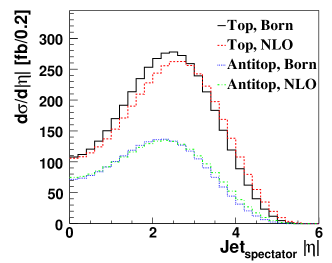
Figure 2 compares the pseudorapidity distributions of the light quark in the dominant -channel production at Born level (LO) and NLO between the Tevatron and the LHC Cao et al. (2005a); Schwienhorst et al. (2011). At the Tevatron, the distribution is asymmetric due to the proton-antiproton initial state. The light quark that recoils against the top quark (antiquark), often called “spectator” quark, goes preferentially along the direction of the incoming proton (antiproton). At the LHC, the pseudorapidity distribution is symmetric, thus only is shown. For the same reason, the cross sections for the production of top quarks and antiquarks are different. The light quark distribution peaks more forward at the LHC than at the Tevatron due to the larger CM energy, and more forward for top quarks than top antiquarks because the incoming light quark is a valence quark for top-quark production.
The single top-quark analyses in the -channel and -channel at the Tevatron and the LHC select events in the lepton plus jets (jets) final state 333Here and anywhere in this article, symbol is used to refer to a charged lepton (electron or muon), and indicate momentum components along the and axis chosen as orthogonal directions to the beam axis, and (transverse momentum)., which requires a high- lepton and at least one -tagged jet. The exception is one CDF analysis, which selects events with large and -tagged jets. The measurements select events in the dilepton final state. The searches for production exploit the trilepton final state, where the price paid in terms of leptonic branching fractions of the boson and of the top quark gets compensated in terms of purity.
In this article we follow the usual convention in the High-Energy Physics community 444The authors are aware of the shortcomings of this convention, especially in cases where the signal expectation is precisely determined in the SM; see discussion in Dorigo (2015). of indicating with the words “evidence” and “observation” a significance of the signal with respect to the background-only hypothesis that surpasses three and five standard deviations, respectively.
III.1 Tevatron
At the Tevatron, the -channel process has the largest predicted production cross section of pb Kidonakis (2011) and is easiest to separate from the backgrounds due to the unique signature of a forward light-quark jet, see Figs. 1(a) and 2. The -channel process has a smaller predicted production cross section of pb Kidonakis (2010a). Both theory predictions have been computed at NLO, including NNLL corrections, and for a top-quark mass of 172.5 GeV. The cross section is pb Kidonakis (2017b), too small to disentangle from other processes with similar final states, and it is therefore neglected in all Tevatron analyses. Due to the challenge of separating the signal from the background and the two signals from each other, the Tevatron experiments report both combined -channel measurements, where the ratio between the two processes is assumed to take the SM value, and individual measurements for -channel and -channel. The SM ratio assumption is suitable for the early measurements that aim to establish the existence of this signal and provide the first extraction. It does limit the sensitivity to new physics 555This approach is only rigorous as a test for models that coherently modify the cross section of both channels, such as an anomalous coupling., for which a two-dimensional cross-section fit is more appropriate as presented in Section III.1.3.
III.1.1 Observation of single top-quark production
The amount of data collected in Run 1 at the Tevatron at a CM energy of 1.8 TeV was not sufficient to accumulate a measurable sample of single top-quark events and only upper limits on the production cross section were set Acosta et al. (2002); Abbott et al. (2000); Abazov et al. (2001). In Run 2, Tevatron delivered collisions at a CM energy of 1.96 TeV. Tighter constraints were set Abazov et al. (2005), then evidence for single top-quark production was reported by D0 in 2006 Abazov et al. (2007a, 2008) and by CDF in 2008 Aaltonen et al. (2008a). The production of single top-quark events was first observed in 2009 by CDF Aaltonen et al. (2009a, 2010) and D0 Abazov et al. (2009). The two measurements were also combined CDF and D0 Collaborations, Tevatron Electroweak Working Group (2009).
Two approaches are critical in the Tevatron single top-quark discovery. First, no attempt is made to separate the -channel and -channel production modes, though the analyses are mostly sensitive to -channel production due to its larger expected cross section and distinct kinematic properties, in particular the forward light-quark jet, the pseudorapidity of which is shown in Fig. 2. The number of expected signal events with two jets and one -tag in 3.2/2.3 fb-1 for CDF/D0 was 85/77 for the -channel and 62/45 for the -channel.
Second, the Tevatron single top-quark searches and measurements rely on MVA techniques to separate the small signal from the large backgrounds with large systematic uncertainties. And not just MVAs, but the discovery sensitivity is only reached when multiple MVAs are combined in another MVA. Figure 3 shows the discriminant distributions in the two CDF analyses that enter the observation: The super discriminant, from a combination of multiple +jets analyses, and the MVA discriminant from the +jets (MJ) analysis which vetoes isolated leptons Aaltonen et al. (2010). The super discriminant only has a single bin with more than 5 signal events expected, and the MJ discriminant also has very few signal events in the signal-enriched region. Figure 4 shows the combination discriminant for the D0 analysis. Even in the signal-enriched region close to an MVA output of 1, there are only about 8 expected signal events for an expected background of about 10 events. The combined cross section for -channel and -channel production is obtained in a Bayesian likelihood analysis, assuming the SM ratio of the two processes. The same approach is also used to combine the two measurements, and the combined -channel plus -channel () cross section is pb CDF and D0 Collaborations, Tevatron Electroweak Working Group (2009).

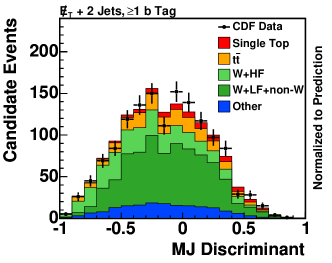
CDF required a data sample about 50% larger than D0 to observe single top-quark production due to a downward fluctuation in the data, as can be seen in Fig. 3(left), while D0 had an upward fluctuation in data in the signal region, see Fig. 4. An additional reason was the limited accuracy of single top-quark theory modeling. Only leading order (LO) generators existed at the time, while the production cross section receives contributions from both the process shown in Fig. 5(a) and the process shown in Fig. 5(b). The process corresponds to the 5-flavor-number scheme (5FNS) where the parton distribution functions include quarks. The process is a part of the real corrections in QCD to the process in this scheme. However, this diagram actually contributes a large fraction of the selected single top-quark events Cao et al. (2005a). Alternatively, when generating events in the 4-flavor-number scheme (4FNS) where the parton distribution functions do not include quarks, the process in Fig. 5 is the LO process Frederix et al. (2012). Consequently, LO generators need to employ a matching scheme that includes both diagrams. D0 employs the SingleTop generator Boos et al. (2006), based on CompHEP Boos et al. (2004), which matches the kinematics of the scattered quark to NLO prediction. This approach gives reasonable agreement with NLO distribution Binoth et al. (2010); Campbell et al. (2009). This is not the case for the CDF signal model, which was tuned by comparing the LO parton-level distribution to NLO Aaltonen et al. (2010). For the analysis with the full Tevatron Run 2 dataset, the CDF signal model was updated to NLO using POWHEG generator Alioli et al. (2009); Re (2011).


III.1.2 Tevatron legacy measurements and s-channel observation
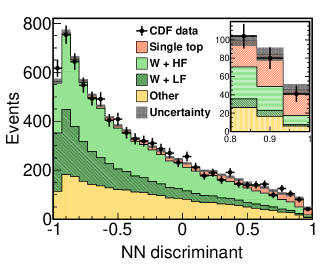
The CDF and D0 analyses with the full Tevatron dataset of about 10 utilize the same analysis techniques as the observation analyses described above. CDF combines two measurements, one in the +jets channel, and one in the MJ channel. The first measurement selects events with a lepton (electron or muon), jets and large in 7.5 of data Aaltonen et al. (2014b). The data events are separated into four categories by jet multiplicity (2-jet and 3-jet) and -tag multiplicity (1-tag and 2-tag). The single top-quark signal is separated from the backgrounds using a Neural Network (NN) discriminant, trained separately in each analysis region, using only -channel events as the signal in the training for 2-jet, 2-tag events, and only -channel events as the signal in the training for all other events. This dedicated training enhances the separate sensitivity to -channel and -channel. In addition, simulated samples with variations related to the main systematic uncertainties (jet energy scale, factorization and renormalization scales) are included in the training in order to reduce the sensitivity to these sources of uncertainty. The NN discriminant for 1-tag events is shown in Fig. 6.
The second measurement selects events containing large , -tagged jets, but no identified leptons Aaltonen et al. (2016) in 9.5 of data. Events are separated into six regions by jet multiplicity (2 or 3) and -tag categories (exactly one tight, one tight and one loose, and two tight tags). In total, 22,700 events are selected in data, of which 530 are expected to be from single top-quark production. This amount of signal is similar to the +jets analysis, but the background here is much larger. The signal is separated from the large background from QCD multijet events with a NN. The -channel (-channel) signal is isolated from the background in 1 -tag (2 -tag) events with a separate NN. The resulting NN output for events with two -tagged jets is shown in Fig. 6. The +jets analysis has less sensitivity than the +jets one, but still contributes in the combination and enhances the single-top sensitivity.
The +jets and MJ discriminants are combined in a likelihood fit that includes all bins of the MVA distributions in all channels of both measurements, with a coherent treatment of the systematic uncertainties and their correlations Aaltonen et al. (2016). The resulting two-dimensional posterior probability density as a function of the -channel and -channel cross sections for CDF is shown in Fig. 7(left).

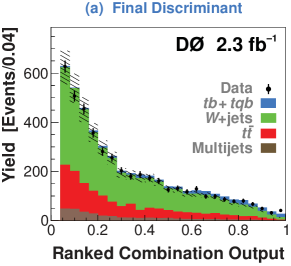
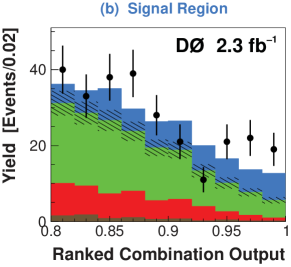
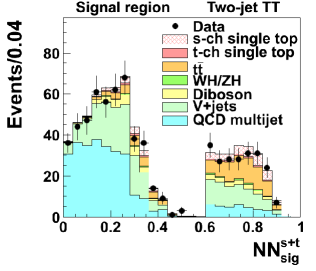
D0 measures the combined single top-quark cross section using a combination of several MVA techniques Abazov et al. (2013) using 9.7 of data, selecting events in the +jets channel. Each event is required to have an electron or a muon with GeV and two or three jets, at least one of which is required to be -tagged. The leading jet is required to have GeV, while all other jets have GeV. The missing transverse momentum is required to be GeV for 2-jet events and GeV for 3-jet events. Events where a hadronic jet is misidentified as a lepton are rejected through additional event topology requirements. In total, 12,000 data events are selected, of which 630 are expected to be from single top-quark production. The -channel and -channel signals are separated from the large background with three MVA discriminants: a Bayesian NN (BNN), a boosted decision tree (BDT), and a matrix element (ME) discriminant. The inputs to the BNN and the BDT are kinematic properties of individual analysis objects and whole-event features, and include the output of the -tag algorithm. In the ME method, also known as dynamic likelihood method Kondo (1988, 1991), a discriminant is built using probabilities calculated from the squared matrix element for each signal and background process hypothesis based on the corresponding leading-order Feynman diagrams, and thus in principle uses all the kinematic information available for the event. The three individual discriminants are then combined in another BNN to form the final discriminant. The methods are optimized separately for -channel (where -channel is included as part of the background) and -channel (where -channel is included as part of the background) in each of four regions (2 or 3 jets, 1 or 2 -tags). The signal region for the two discriminants is shown in Fig. 8. The cross section is measured in a Bayesian likelihood analysis Bertram et al. (2000). The resulting two-dimensional posterior as a function of -channel and -channel single top-quark production cross sections for D0 is shown in Fig. 7(right).
III.1.3 Tevatron combination
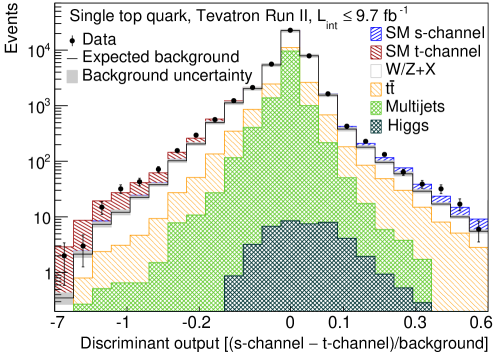
The results from the two experiments are combined starting from the - and -channel discriminants in the two CDF Aaltonen et al. (2014b, 2016). and one D0 Abazov et al. (2013) analyses listed above. The various channels of the different analyses are combined by taking the product of their likelihoods and simultaneously varying the correlated uncertainties and by comparing data to the predictions for each contributing signal and background process. The combined Tevatron cross sections are measured using a Bayesian statistical analysis Bertram et al. (2000). No assumption is made about the ratio of the -channel and -channel cross sections (unlike for the single top-quark discovery). The several hundred bins of the individual discriminants are sorted by their -channel and -channel signal/background ratios as and rebinned. This discriminant is shown in Fig. 9. The -channel signal appears on the left, at large negative values. The -channel signal appears on the right, at large positive values. The signal+background distribution shows good agreement with the data over the full discriminant range. The largest background in both the -channel and -channel signal regions is from -boson production in association with jets (+jets), with smaller contributions from production and other backgrounds.
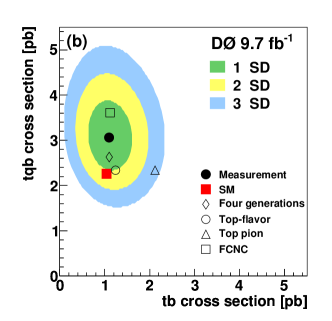
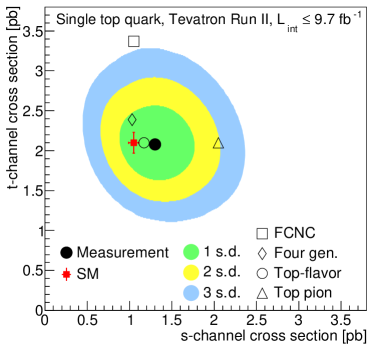
The two-dimensional Bayesian posterior density as a function of the -channel and -channel cross sections is shown in Fig. 10(left). The measurement agrees with the SM prediction and is also compared to several new physics models for illustration. FCNC couplings of the top quark to the gluon Tait and Yuan (2000); Abazov et al. (2007b) increase the -channel cross section. A possible fourth generation Alwall et al. (2007) results in an increased top-quark coupling to first- and second-generation quarks and thus reduces the -channel cross section while increasing the -channel cross section. A top-flavor model He et al. (2000); Tait and Yuan (2000) with an additional boson coupling to the top quark increases the -channel cross section and has no impact on -channel production. A charged “top pion” 666The term “top pion” refers to hypothetical composite bosons formed by top and bottom quarks and antiquarks, predicted in models with additional strong interactions that only act on third-generation quarks, generally known as “top-color” models Hill (1991, 1995). These models seek to explain the largeness of the top-quark mass by a top-quark condensation that plays the role of the Higgs field, in analogy with the phenomenon of superconductivity. Top pions play for such a theory the same role that the SM pions, formed by up and down quarks and antiquarks, play in QCD. results in a -channel resonance decaying to a top quark and a bottom quark Tait and Yuan (2000).
III.1.4 -channel
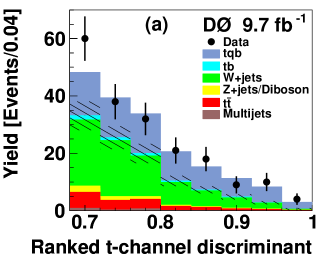
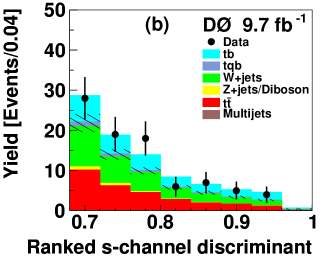
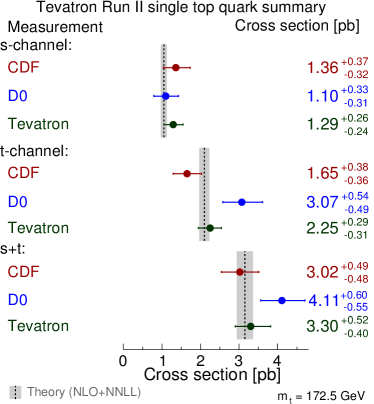
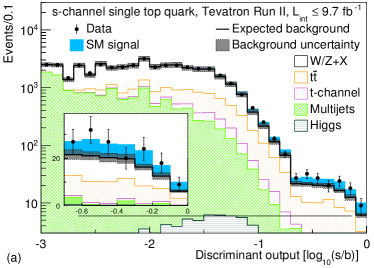
The existence of -channel production has been established few years ago by the combination of Tevatron measurements Aaltonen et al. (2014c) and it is one of the few “Tevatron legacies” that have not been surpassed in precision by the LHC experiments. The input measurements and procedure are the same as described in Section III.1.3, but here, the likelihood fit is one-dimensional for the -channel signal, including -channel single top-quark production in the background. The combined discriminant, rebinned to bring out the s-channel signal, is shown in Fig. 11(left). The dominant background in the signal region is from +jets production and top-quark pair production. The -channel contribution in the -channel signal region is negligible.
The cross section is measured to be pb, consistent with the SM expectation. The significance of the excess of the data over the background expectation is 6.3 standard deviations. A summary of the Tevatron -channel measurements is shown in Fig. 11(right).

III.2 LHC
Single top-quark production at the LHC is dominated by the -channel, even more than at the Tevatron. The production cross section for the -channel, shown in Table 1, is sufficiently large to produce millions of single top quarks, enough to measure the cross section inclusively and differentially and to measure top-quark properties precisely (see Section IV). The cross section for the production of a top quark in association with a boson, shown in Table 3, is second-largest, and is sufficiently high to observe this process at the LHC. The -channel cross section, shown in Table 4, is small due to its quark-antiquark initial state and so far only evidence for this process has been reported.
III.2.1 -channel
The ATLAS and CMS experiments have recorded proton-proton data at various CM energies. The -channel production mode (Fig. 1(a)) has the largest cross section, and is the only single top-quark process whose cross section has been measured at four CM energies so far. Effort has also gone into providing precise theoretical predictions for this mode. The -channel cross sections have been calculated at next-to-next-to-leading order (NNLO) in QCD Brucherseifer et al. (2014); Berger et al. (2017, 2016) and at NLO with NNLL resummation Kidonakis (2011). Automatic calculations as a function of various parameters can be performed with the HATHOR v2.1 program at NLO Aliev et al. (2011); Kant et al. (2015), based on MCFM Campbell et al. (2004). The dependence of the theory predictions on the flavor-number scheme in the predictions has also been studied by comparing the full NLO calculations in the 4FNS (Fig. 5(a)) with that in the 5FNS (Fig. 5(b)) Frederix et al. (2012). The different predictions are compared in Table 1. The NLO+NNLL predictions are slightly larger than the NLO ones, while the NNLO calculations predict a smaller cross section. The cross sections have also been computed differentially Berger et al. (2017); Kidonakis (2016); Schwienhorst et al. (2011).
| -channel | 7 TeV | 8 TeV | 13 TeV |
|---|---|---|---|
| cross section in pb | |||
| NNLO | |||
| - | |||
| - | |||
| - | |||
| NLO+NNLL | |||
| NLO | |||
At the LHC, the inclusive -channel cross sections have been measured at 7 TeV ATLAS Collaboration (2014a); CMS Collaboration (2011); CMS Collaboration (2012a), 8 TeV ATLAS Collaboration (2017b); CMS Collaboration (2014b) and 13 TeV ATLAS Collaboration (2017c); CMS Collaboration (2017a) by ATLAS and CMS. All these analyses enhance the -channel signal by selecting events with one isolated electron or muon, significant and/or large invariant mass () of the lepton plus system 777Defined as ., and two or three jets. Exactly one of the jets is required to pass a tight threshold on the -tagging discriminant and is interpreted as coming from the decay of the top quark, while the other (failing the same threshold) as originating from the spectator quark that recoils again the top quark. Main backgrounds to this final state are and +jets. Orthogonal control regions with different multiplicities of jets and/or -tagged jets are used to measure these backgrounds in situ, to validate the Monte Carlo models used for their predictions, or to constrain the main experimental uncertainties (e.g., -tag modeling). QCD multi-jet events constitute a small but non-negligible background. Given the uncertainties in its modeling, it is necessary to predict the size and properties of this process by data. A reliable model of this background is usually extracted from events that fail the isolation requirement or other elements of the charged-lepton selection, while fulfilling all other selection criteria.
The extraction of the signal cross section is performed by both collaborations by profile-likelihood fits Verkerke and Kirkby (2003); Cranmer et al. (2012); Cowan et al. (2011). The fit variable is a multivariate discriminant in the case of ATLAS ATLAS Collaboration (2014a, 2017b, 2017c) and of some of the CMS analyses CMS Collaboration (2011); CMS Collaboration (2012a, 2017a). ATLAS also measured the cross section at 7 TeV in a simple cut-based approach ATLAS Collaboration (2012b). CMS also demonstrated the feasibility of entirely relying on a simple kinematic observable, , defined as the pseudorapidity of the jet failing -tag requirement CMS Collaboration (2012a, 2014b).
Table 2 compares the acceptances and event yields of the LHC -channel analyses to the Tevatron -channel analyses. The kinematic thresholds on leptons, jets and are higher at the LHC than at the Tevatron, resulting in an acceptance that is about a factor two lower. However, since the cross section is so much larger, the number of signal events and the signal/background ratio are larger.
| Experiment | signal | number of | s/b (%) |
| acceptance (%) | -channel events | ||
| 1.96 TeV Tevatron | |||
| CDF +jets | 2.2 | 550 | 6.4 |
| CDF +jets | 1.7 | 530 | 2.3 |
| D0 +jets | 2.0 | 630 | 5.3 |
| 7 TeV LHC | |||
| ATLAS -channel, 4.6 | 1.0 | 5,700 | 10 |
| CMS -channel, 1.2(), 1.6() | 0.8(), 0.6() | 950 | 31 |
| 8 TeV LHC | |||
| ATLAS -channel, 20.3 | 1.0 | 17,700 | 18 |
| CMS -channel, 19.7 | 0.6 | 10,400 | 21 |
| 13 TeV LHC | |||
| ATLAS -channel, 3.2 | 1.0 | 6,900 | 11 |
| CMS -channel, 2.2 | 0.5 | 2,400 | 11 |
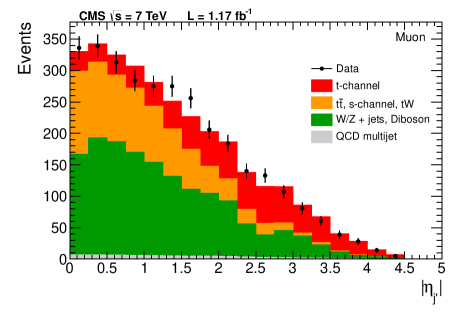
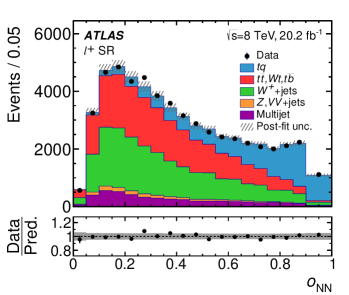
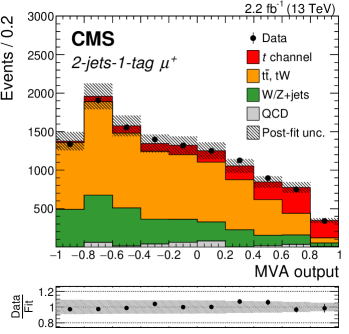
Systematic uncertainties are dominant over the statistical uncertainties in these -channel measurements, with the exception of the earliest measurement at 7 TeV using the data collected in 2010 CMS Collaboration (2011). The important detector-related uncertainties are from -tagging and jet energy scale (JES). The theory modeling uncertainties contribute about half of the total systematic uncertainties. These are related to the renormalization and factorization scales in the simulated signal sample, the PDFs, the amount of initial-state and final-state radiation (ISR/FSR), the modeling of the parton shower and the NLO subtraction (treatment of phase-space that is populated by both the NLO corrections in the matrix element and the parton shower). Theory modeling uncertainties are included for both the -channel signal and the background from production. The scale and ISR/FSR uncertainties are evaluated by both ATLAS and CMS by varying the relevant parameters in the simulation. The NLO subtraction is evaluated by comparing the POWHEG method to the aMC@NLO method Frixione et al. (2007); Alwall et al. (2014); Frederix et al. (2012). For the CMS 8 TeV analysis, this also includes a comparison of events generated in the 4FNS and the 5FNS. The uncertainty due to the description of parton showers is evaluated by comparing Pythia to Herwig, for ATLAS in the entire analysis chain, for CMS only in the JES. The PDF uncertainty is evaluated with the PDF4LHC prescription Botje et al. (2011). The background-related uncertainties are dominated by the -modeling and normalization and also have contributions from +jets and fake-lepton background modeling. Figure 12 shows the light-quark jet pseudo-rapidity distribution for muon events in the CMS 7 TeV analysis and the NN discriminant for positively charged leptons in the ATLAS 8 TeV analysis. Already with a limited-size sample at 7 TeV, the -channel signal is clearly visible, and at 8 TeV, even bins of the final discriminant where the background is reduced to negligible levels still retain thousands of signal events. Figure 13 (left) shows the CMS NN distribution in the 13 TeV -channel analysis. Even with the small data sample analyzed so far in Run 2, the -channel signal can be easily extracted. These figures show clearly that in comparison to 7 and 8 TeV, the background is now larger than the +jets background, as expected due to the larger increase in the cross section.
The cross section is evaluated in a likelihood fit, and some of the uncertainties are constrained by data in the fit, i.e., these nuisance parameters are profiled. For the ATLAS analyses, only the uncertainties on the normalization of the and +jets backgrounds (and for the 7 TeV analysis also the -tag scale factor) are profiled, while the other uncertainties are evaluated through pseudo-experiments. The CMS 7 TeV analysis uses a Bayesian approach to measure the cross section Jaynes (2003) and marginalizes the systematic uncertainties, except for the theory modeling uncertainties, which are evaluated in pseudo-experiments.
The cross sections measured by ATLAS and CMS at 7 TeV are pb and pb, respectively. ATLAS also measures the cross section for top-quark production separately from that for top antiquark production, pb and pb, respectively. The CMS measurement is a combination of the electron and muon channels, both of which have a tight event selection that leads to a high s/b ratio, see Table 2, resulting in a slightly smaller total uncertainty for CMS than for ATLAS. The cross sections measured by ATLAS and CMS are consistent with each other and with the theory predictions.
At 8 TeV, the inclusive -channel cross section measured by ATLAS is pb. The cross section has also been measured separately for top quarks and top antiquarks, pb for top-quark production and pb for top antiquark production. At 8 TeV, the inclusive -channel cross section measured by CMS is pb, with pb for top quarks and pb for top antiquarks. The cross sections measured by ATLAS and CMS are again consistent with each other and with the theory predictions, both inclusively and for top quarks and antiquarks separately. The systematic uncertainties are dominant, and the precision of the measurements is comparable.
At 13 TeV, the inclusive cross sections measured by ATLAS and CMS are pb and pb, respectively. The largest systematic uncertainty for ATLAS is the parton shower uncertainty (13%, when the total uncertainty is 17%), evaluated by comparing the parton shower models of Pythia and Herwig, both applied to events simulated at matrix-element level with POWHEG. ATLAS and CMS also evaluated the cross sections for top quark and antiquark production separately, pb and pb, respectively, for ATLAS, and pb and pb, respectively, for CMS. The measured cross sections are consistent with each other and with the theory predictions.
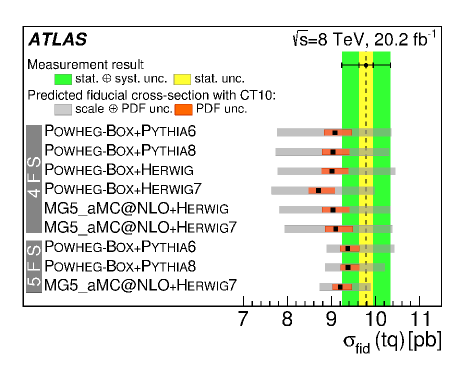
A fiducial -channel cross section has been measured by the ATLAS collaboration using the 8 TeV data set ATLAS Collaboration (2017b). The benefit of measuring a production cross section within a fiducial volume is that uncertainties related to event generation can be reduced, as a smaller extrapolation is needed between the reconstruction level and the particle level (unobservable regions of the phase become numerically irrelevant). Differences between generators, hadronization models or PDFs can be separated into components visible in the measured phase space (similar between particle level and reconstruction level) and in the non-visible phase space (where there would be larger differences between particle level and reconstruction level). The fiducial phase space for this analysis is defined close to that of the reconstructed and selected events. The particle-level objects are constructed from stable particles in the final state, with a very similar definition to the reconstructed objects, in order to minimize the sensitivity of the fiducial cross section to the signal modeling. The fiducial measurement is then extrapolated to the full phase space using different Monte Carlo generators, obtaining the spread of results shown in Fig. 13(right).
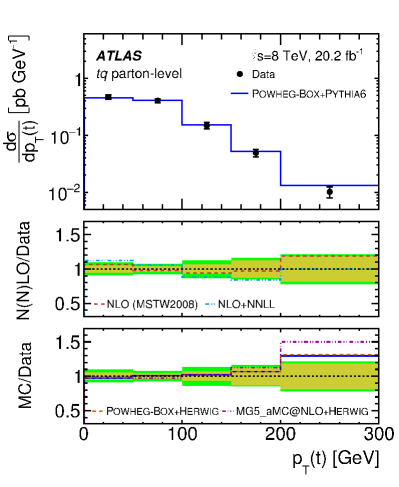
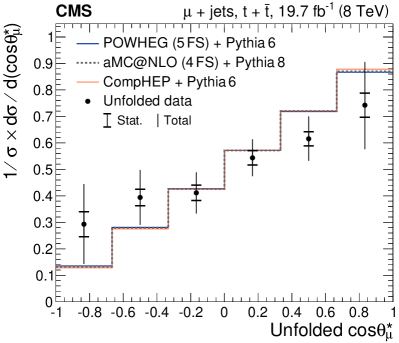
Differential cross sections of -channel production as a function of top-quark and pseudorapidity have been measured by ATLAS at 7 and 8 TeV ATLAS Collaboration (2014a, 2017b) at particle and parton level, showing a good agreement with the predictions of various MC generators. Figure 14(left) shows the transverse momentum distribution of the top quark (not the antiquark) at parton level. The CMS collaboration reported a relative differential cross-section measurement as a function of at 8 TeV CMS Collaboration (2016c), where is defined at parton level as the angle in the top-quark rest frame between the momentum of the charged lepton from top-quark decay and a polarization axis approximated by the direction of the light quark recoiling against the top quark. This differential measurement, shown in Fig. 14(right), is an intermediate step in the extraction of top-quark polarization, see Sec. IV.4, and proves that the observed distribution is linear, as expected in V–A production mechanisms such as the electro-weak force in the SM. The ATLAS collaboration reported a differential measurement in two bins at the parton level in this variable as well as in two additional variables that characterize the angular correlations in top-quark events ATLAS Collaboration (2017e).
III.2.2 -associated ()
The process, Fig. 1(c), has the second-largest cross section. The theoretical prediction for production has been calculated at NLO with NNLL corrections Kidonakis (2010b) and at NLO Aliev et al. (2011); Kant et al. (2015); Campbell et al. (2004). This process is of particular interest because it overlaps experimentally and interferes by quantum principles with top-quark pair production. The process is well-defined only at Born level. When higher-order QCD diagrams are taken into account, such as the production of with an associated -quark as shown in Fig. 15, quantum interference induces a mixing with as exemplified in Fig. 15(b). Some proposals have been made to define the two processes in an unambiguous way Belyaev and Boos (2001); Campbell and Tramontano (2005); Frixione et al. (2008). The NLO event generators MC@NLO Frixione and Webber (2002) and POWHEG Frixione et al. (2007) allow to choose between the so called “Diagram Removal” (DR) and “Diagram Subtraction” (DS) approaches Frixione et al. (2008); White et al. (2009); Re (2011). The DR approach removes all diagrams where the associated boson and the associated -quark that are shown in Fig. 15(b) form an on-shell top quark. The DS approach makes use of a subtraction term designed to locally cancel the contributions. While the latter approach is designed to be gauge-invariant, the former breaks gauge invariance explicitly, but this is demonstrated to have little practical effect in most of the phase space. This difference has a larger impact in extreme regions of phase space, such as those sampled by supersymmetry searches (see, for example, ATLAS Collaboration (2014c); CMS Collaboration (2016e)). The ATLAS and CMS cross-section measurements are tailored for the Born-level description of this process and thus not very sensitive to the difference between the DR and DS approaches, nevertheless a systematic uncertainty is assigned to account for the difference.


The cross section has been calculated at NLO+NNLL (also called approximate N3LO) Kidonakis (2017b) and at NLO with HATHOR Aliev et al. (2011); Kant et al. (2015), based on MCFM Campbell and Tramontano (2005). The NLO+NNLL calculation is based on a NLO calculation Zhu (2002) that removes the interference terms at the cross-section level. The MCFM calculation introduces a cut-off on the transverse momentum of the -quark from gluon splitting, and the cross section is somewhat sensitive to this threshold. Table 3 compares the two predictions to each other. The NLO+NNLL prediction is quite a bit higher than the NLO calculation due to the -quark cut-off in the latter.
| 7 TeV | 8 TeV | 13 TeV | |
|---|---|---|---|
| cross section in pb | |||
| NLO+NNLL | |||
| NLO |
The first evidence of production has been reported by the ATLAS and CMS collaborations using 7 TeV data ATLAS Collaboration (2012a); CMS Collaboration (2013a). The conventional threshold has been crossed with 8 TeV data CMS Collaboration (2014c); ATLAS Collaboration (2016b). More recently, the ATLAS collaboration measured the inclusive cross section at 13 TeV using 3 of data collected in 2015 ATLAS Collaboration (2018b), and CMS reported a precision measurement of the cross section at the same CM energy with 36 of 2016 data Sirunyan et al. (2018). The cross section measurements at all three CM energies are in agreement with the SM calculation at NLO in QCD with NNLL corrections Kidonakis (2014) shown in Table 3.
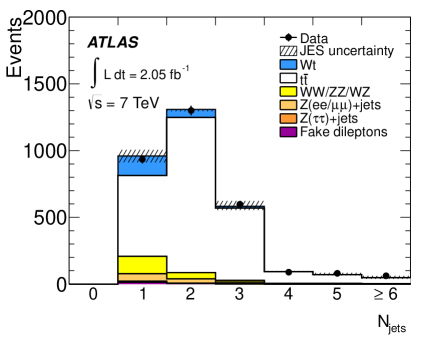
All these analyses are performed in the dilepton final state, exploiting the presence of two real bosons (the associated one, and the one from top-quark decay), by selecting events with two charged leptons (electrons or muons). The distribution of the number of reconstructed jets in the ATLAS 7 TeV analysis, shown in Fig. 16, shows that even in the signal region with one jet, the signal is overwhelmed by a larger background from production where one of the two -quark jets is not reconstructed. Measurements of this process in the jets final state, i.e., with one boson decaying leptonically and one hadronically, suffer from the combinatorial problem of quark-parton association and from the difficulty of discriminating the signal from the overwhelming background CMS Collaboration (2007); Giorgi (2016). A measurement in the jets channel, however, would have the added value that the top quark/antiquark ratio would become accessible 888A top-quark-mass constraint allows to assign the charged lepton to either the top quark or the associated boson. Therefore, the charge of this lepton would provide discrimination between and production. This is much more difficult, and so far unfeasible, in the dilepton final state, because of the presence of two neutrinos and an insufficient number of mass constraints to determine all the degrees of freedom. and could be used as a handle to constrain , as an initial-state -quark parton makes this ratio deviate from unity Alvarez et al. (2018).
The distributions of multivariate discriminants are used in a likelihood fit to extract the signal cross section. The fit utilizes multiple regions: Not only 1-jet, 1 -tag events that have the largest fraction of signal, see Fig. 16(left), but also 2-jet events with 1 or 2 -tags, which are used to constrain the dominant background from production and the large systematic uncertainties. In particular the modeling uncertainties would otherwise swamp the precision of the signal measurement. The BDT distribution for the CMS 8 TeV analysis is shown in Fig. 16(right). The signal appears at high discriminant values, with a s/b ratio approaching 1/1.

The largest systematic uncertainties in the measurements arise from the modeling of as mentioned above and the modeling of the signal. Detector-modeling uncertainties from -tag modeling, JES, and modeling are also important. The systematic uncertainties affect not only the signal and background acceptance and the shape of the MVA distributions, but also result in migration between the different analysis regions. The sensitivity to this migration provides constraints on uncertainties in the likelihood fit. This also has the consequence that the precision with which the signal can be measured is determined in part by the assumptions about correlations of modeling uncertainties between and , i.e., how much a strong constraint on also applies to . This includes the parton shower and ISR/FSR and other generator modeling uncertainties. The DR/DS uncertainty is not constrained in the fit but is also not a large uncertainty contribution. Figure 17(left) shows the impact of the systematic uncertainties on the ATLAS 8 TeV measurement and how much each uncertainty is constrained in the fit. The detector-related uncertainties that have the largest impact are only moderately constrained and are shifted somewhat away from their nominal (0) value. The largest constraint is on the NLO matching method, which is obtained by comparing and samples generated with POWHEG Frixione et al. (2007) with those generated with MC@NLO Frixione and Webber (2002), both interfaced to Herwig. This uncertainty, as well as that from ISR/FSR , is pulled to a central value below zero and constrained because it shifts events between different jet multiplicities. Care needs to be taken when interpreting this pull. It implies that neither MC@NLO nor POWHEG is able to model the kinematic properties of the event selection. While MC@NLO is more disfavored in the fit, both need improving. The modeling can be improved with the help of fiducial measurements at particle-level, see Section III.2.3.

At 7 TeV, ATLAS measures a cross section of pb, while CMS measures pb. At 8 TeV, ATLAS measures a cross section of pb, while CMS measures pb. At 13 TeV, ATLAS measures a cross section of pb, while CMS measures pb. The cross sections measured by ATLAS and CMS are consistent with each other, and are quite close to each other at 7 and 8 TeV. At 13 TeV, the cross section measured by CMS is based on a dataset about ten times larger than the ATLAS one and about one standard deviation below the measurement by ATLAS (hence the smaller CMS uncertainty). All measurements are consistent with the theoretical predictions.
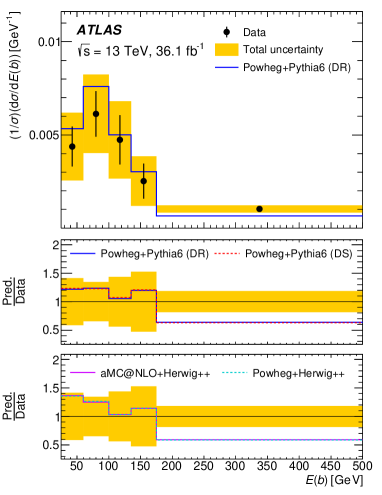
Differential measurements of the cross section have also been reported as a function of the energy and invariant mass of different combinations of final-state objects by ATLAS at 13 TeV ATLAS Collaboration (2018a). The kinematic distributions are unfolded to the particle level (defined by the presence of one lepton and one -quark jet) and are compared to different MC simulations. This first differential measurement shows some conflict with the different MC generators, which all have about the same level of agreement with the data, as can be seen in the distribution of the energy of the quark from the top-quark decay in Fig. 17(right).
III.2.3 plus in fiducial regions
To reduce the dependence on the theory assumptions, the ATLAS collaboration reports a cross section in a fiducial detector acceptance defined by the presence of two charged leptons and exactly one jet at particle level ATLAS Collaboration (2016b). This signal definition encompasses not only production but also production where one of the final-state quarks is outside of the acceptance. The result is shown in Fig. 18 and is found to be in agreement with the predictions from two different NLO matrix-element generators (POWHEG and MC@NLO) matched to two different parton-shower generators (Pythia 6 Sjöstrand et al. (2006) and Herwig 6 Corcella et al. (2001)), the DR and DS approaches, and a variety of PDF sets. In this comparison, where the relative normalization of and is important, the measurement has the best compatibility with the simulation when is normalized to the NLO+NNLL calculation and is normalized to the NNLO+NNLL calculation. In particular the normalization plays an important role. While no conclusion about individual generators can be drawn given the size of the uncertainties, it is clear that in the fiducial measurement, POWHEG predicts a lower cross section than MC@NLO, when both are interfaced to Herwig.

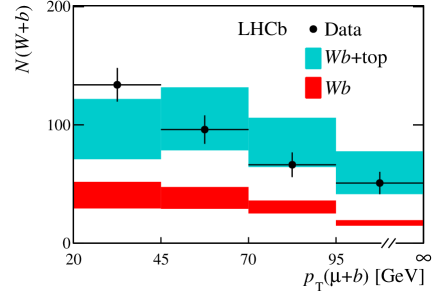
Although top-quark physics was not among the design goals of the LHCb experiment, it has been remarked that, by accessing a kinematical region beyond the reach of ATLAS and CMS, studies of top-quark production with the LHCb data may have a strong impact on constraining parton distribution functions (PDF) Gauld (2014), or indirectly probe anomalous top-quark couplings in single and pair production in a complementary way with respect to multi-purpose experiments, in particular in BSM scenarios where top-quark production proceeds via -channel exchange of a new low-mass particle Kagan et al. (2011). Using samples of 1.0 and 2.0 fb-1 collected at CM energies of 7 and 8 TeV in 2011 and 2012 respectively, the LHCb Collaboration (2015) achieved the first observation of top-quark production in the forward region defined by its acceptance to muons () and to jets (), see Fig. 19. Inclusive top-quark production cross sections were measured in a fiducial particle-level region that includes contributions mainly from and also from and presented together with differential yields and charge asymmetries. Results are in agreement with SM predictions at NLO accuracy.
III.2.4 -channel
The -channel process, Fig. 1(b), poses particular challenges at the LHC because of the very small cross section in comparison with backgrounds with very similar final state, a situation comparatively worse than at Tevatron. The theoretical prediction for -channel production has been calculated at NLO with NNLL corrections Kidonakis (2010a) and at NLO Aliev et al. (2011); Kant et al. (2015); Campbell et al. (2004); Heim et al. (2010). Table 4 compares the two predictions to each other. The cross section rises by only a factor 2 from 8 to 13 TeV, making this process even harder to observe in Run 2 than in Run 1 at the LHC.
| -channel | 7 TeV | 8 TeV | 13 TeV |
|---|---|---|---|
| cross section in pb | |||
| NLO+NNLL | |||
| NLO | |||
The ATLAS and CMS -channel analyses select events with one isolated electron or muon, significant and/or large , and two jets, both b-tagged. Main backgrounds are , +jets, QCD multi-jet production, and the other single top-quark processes. Several orthogonal control regions with different multiplicities of jets and/or -tagged jets are used to measure these backgrounds in situ or to validate the Monte Carlo models used for their predictions, or to constrain the main experimental systematics (e.g., -tagging efficiency).
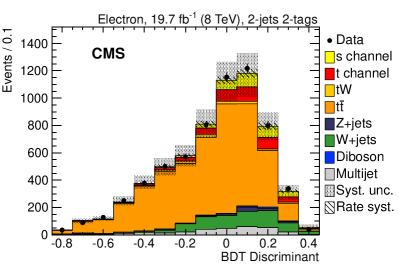
With the 7 TeV dataset, ATLAS and CMS were not able to observe the -channel process and only set upper limits on its production cross section ATLAS Collaborations (2011); CMS Collaboration (2016f). With the 8 TeV dataset, ATLAS first published a search ATLAS Collaboration (2015c), and then improved the sensitivity of the analysis to report evidence for -channel single top-quark production ATLAS Collaboration (2016a). The latter analysis employs a matrix element (ME) method (see Section III.1.2) to optimize the sensitivity to the -channel signal. Here, the likelihood for each event to originate from the signal or one of the backgrounds is computed based on the four-vectors of the particles in the corresponding LO Feynman diagrams. Un-observed four-vector components and detector resolution effects are integrated over, resulting in large computing-time requirements. The final ME discriminant for the ATLAS -channel analysis is shown in Fig. 20(left). The background is subtracted from the data in this figure, making the otherwise small signal visible. CMS measured the cross section simultaneously at 7 and 8 TeV CMS Collaboration (2016f), taking advantage of the correlations between the different CM energies to constrain backgrounds and systematic uncertainties. The signal is separated from the large backgrounds using a BDT discriminant, which is shown in Fig. 20(right), with the small -channel signal visible on the right-hand side of the distribution.

The -channel analyses are limited by large backgrounds in the signal region, in particular from as Fig. 20 shows. The bins with the largest signal fraction correspond to unusual phase-space regions for the largest backgrounds, thus very large amounts of simulated events are necessary for the analysis. The MC statistics uncertainty is the largest of all systematic uncertainties. For both the ATLAS and CMS analyses, large detector-related uncertainties arise from JES and b-tag modeling, and the theory modeling uncertainties are dominated by -channel and modeling uncertainties.
At 7 TeV, the limit set by ATLAS on the -channel cross section is 26.5 pb (20.5 pb expected). The limit set by CMS is 31.4 pb (20.2 pb expected). At 8 TeV, ATLAS reported evidence with an observed (expected) significance of 3.2 (3.9) standard deviations. The measured cross section is pb. The CMS limit at 8 TeV is 28.8 pb (15.6 pb expected). The combined CMS 7+8 TeV analysis, which assumes the SM ratio between the cross sections at the two CM energies, has an observed (expected) significance of 2.5 (1.1) standard deviations. The measured cross section value for CMS at 8 TeV is pb. The limits and measurements are all consistent with each other and with the theory predictions. The two analyses have similar selections and amounts of signal and background, but the Matrix-element based discriminant in use by ATLAS is able to better separate the single top-quark signal from the large backgrounds. The -channel measurements will improve with the large Run 2 dataset and better understanding of the theory modeling for and -channel single top-quark production.
III.2.5 -associated ()
The cross section for single top-quark production at the LHC is sufficiently large, in particular in the -channel mode, that it is possible to observe the coupling to additional particles in single top-quark events. Figure 21 shows an example of this where single top quarks in the -channel mode are produced in association with a boson. This process probes both the coupling and the top- coupling. The production cross section for this process has been calculated at NLO Campbell et al. (2013). At 8 TeV, the cross section is fb, while at 13 TeV it is fb.

The signature of production is that of -channel single top-quark production, plus a boson. Thus, the description of the process, background estimates, kinematic properties described in Section III.2.1 all apply here, except that a boson is added to each. The experimental signature consists of a leptonically decaying top-quark, with a central high- quark, and a forward light quark, plus a leptonically decaying boson. The main backgrounds are +jets (instead of +jets), +jets with a jet mis-identified as an isolated lepton (instead of multi-jets with a mis-identified lepton), and (instead of ). The requirement of the presence of the boson reduces the event rates for all of these processes by three orders of magnitude compared to Section III.2.1. In addition, the requirement of a leptonically decaying boson reduces the rate by about another order of magnitude. Selecting events in a narrow region around the boson mass peak is important to effectively reject non- backgrounds, and this is not viable for hadronically decaying bosons, for which there is an overwhelmingly large QCD background. Final states with hadronically decaying top quarks and leptonically decaying bosons is similarly challenging, analogous to -channel production, where hadronic top quark decays are also overwhelmed by a large QCD background.
Using the full data set at 8 TeV, the CMS collaboration presented a search for the production mechanism CMS Collaboration (2017g), exploiting the very clean signature of three charged leptons (electrons or muons), two of them consistent with originating from the decay of a boson, accompanied by a quark, a forward jet, and significant . About 16 signal events are expected with basic selection requirements, compared to the 17,700 events selected in the 8 TeV -channel analysis (see Table 2). The signal is separated from the background using a BDT discriminant, and the cross section is measured in a fit to the BDT output and to the transverse mass in a control region to control the systematic uncertainties and backgrounds. The observed significance is 2.4 standard deviations (1.8 standard deviations expected), and the measured cross section is fb. The 95% CL limit on the signal is 21 fb, consistent with the theory expectation.
ATLAS reported evidence for production with 13 TeV data ATLAS Collaboration (2017d), also relying on the three-lepton final state. Exactly two jets are required, one -tagged jet and one light-quark jet. This selects 143 events in data with 35 signal events expected from a LO simulation in the 4FNS rescaled to NLO. A neural network is utilized to separate the signal from the background, and the signal is extracted from a profile likelihood fit to the NN discriminant in the signal region. The post-fit NN distribution is shown in Fig. 22. The observed (expected) significance is 4.2 (5.4) standard deviations. The measured cross section is fb.
CMS also reported evidence for production with 13 TeV data CMS Collaboration (2018). Three-lepton events are selected separately for each lepton combination, and two or three jets are required, with 1--jet events defining the signal region and 2--jet and 0--jet events defining two control regions that are also included in the final likelihood fit to constrain uncertainties. The signal region has 343 data events, 25 of which are expected to come from the signal according to a NLO simulation of the signal in the 5FNS. The discriminant used in each of the three regions is shown in Fig. 23. The observed (expected) significance is 3.7 (3.1) standard deviations. The measured cross section, including only leptonic boson decays, is fb. This corresponds to an inclusive cross section of fb. The ATLAS and CMS measurements are consistent with each other within about one standard deviation. ATLAS observes a small deficit compared to the theory prediction, while CMS observes an excess. The expected signal event yield in the highest bin of the MVA distribution is comparable for the two experiments, while the background is larger for CMS, in part due to the better -tag performance in the ATLAS analysis thanks to their upgrade of the pixel detector at the beginning of Run 2, see Section II.2.1 (the corresponding upgrade was made by CMS at the beginning of 2017).
The approaches followed by the two experiments differ under a few aspects, each exemplifying a particular issue in single top analyses in general. The most important differences are the inclusion of three signal regions in the CMS analysis compared to just one for ATLAS, the treatment of the non-prompt lepton (NPL) background, and the signal simulation.
-
•
The background in the highest signal bins is larger for CMS than for ATLAS, thus CMS benefits from profiling background normalizations and systematic uncertainties that affect the background estimate, which would have less of an impact on the ATLAS analysis.
-
•
It can be seen, by comparing the ATLAS (Fig. 22) and CMS signal regions (Fig. 23, left), that the NPL background is larger in the high-discriminant region for CMS than for ATLAS. This corresponds to dilepton and +jets events where an additional jet is mis-identified as an isolated lepton. The ATLAS approach is to estimate separately the (real top quark, misidentified boson) and +jets (misidentified top quark, real boson) backgrounds, both from simulation samples normalized to and checked in control regions in data. Both samples are included in the MVA training. CMS groups these sources together and focuses instead on the origin of the NPL separately for each lepton flavor. This results in a smaller NPL uncertainty, but the background is larger in the high-discriminant region.
-
•
The signal simulations of the two experiments also differ, affecting the MVA training. Although both normalize the event yields to NLO predictions, the simulation samples generated by ATLAS are at LO in the 4FNS, while those simulated by CMS are at NLO in the 5FNS. Generating events at LO avoids negative event weights and the associated MC statistics issues, making it easier to obtain optimal MVA training. Generating events at NLO gives improved modeling of the kinematic properties of the signal and smaller signal-modeling uncertainties. However, a large fraction of simulated events in the signal region that have negative weights results in a non-optimal MVA.
-
•
A significant fraction of events have three jets in the final state, the two from the Feynman diagram shown in Fig. 21, plus the forward jet shown in Fig. 5(b) or a gluon. This migration to 3-jet events is more pronounced at NLO in the 5FNS. This motivates the inclusion of 3-jet events in the CMS analysis, which recovers signal events, but also adds more background, similar to 3-jet events in the -channel analysis.
It should be stressed that the modeling differences affect the expectations, and indirectly the selection strategy, but do not bias the cross-section measurement itself.
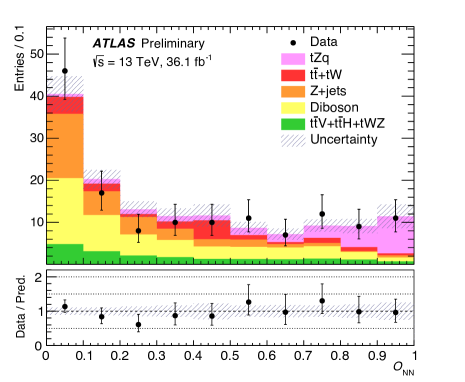

III.3 Summary of the inclusive cross-section measurements
Figure 24 summarizes all of the experimental measurements of the inclusive cross sections for single top-quark production at the Tevatron and at the LHC. The measurements are compared to the NLO+NNLL predictions for -channel, and -channel, and to a NLO calculation with MC@NLO for , using the NNPDF3.0 PDF set Ball et al. (2015).
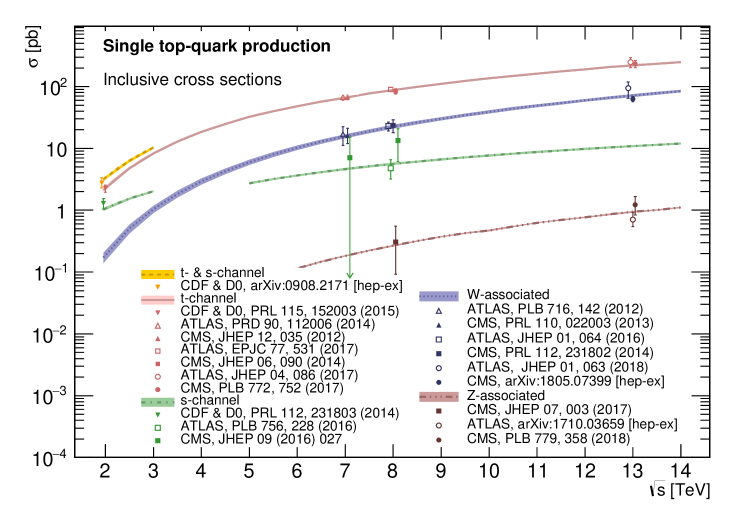
Figure 25 visualizes the most precise single top-quark cross section measurements at 8 TeV at the LHC for the three dominant channels, displayed versus each other. For each channel only one result from either ATLAS or CMS is shown, thus the correlations between individual measurements can be assumed to be small. The measurements are compared to examples of new physics models that lead to deviations in one or more of the cross sections. If the CKM matrix is not unitary, then deviations from 1 are possible for , and in turn, large non-zero values are possible for and Alwall et al. (2007). Here, we calculate the corrections to the single top-quark cross sections for a value of , keeping and thus setting . Thus, the impact of this model on the top-quark decay is not detectable given the uncertainty of the branching ratio of (see Section IV.1), and only the production cross sections for -channel and are increased. As another example, a vector-like fourth-generation quark with a mass of 0.8 TeV and chromo-magnetic couplings Nutter et al. (2012) modifies the production cross section but only has a negligible impact on -channel and -channel production. A color triplet with a mass of 1 TeV decays to and thus enhances the -channel cross section but has no effect on -channel or . And finally, a small FCNC interaction corresponding to a branching ratio of for Aguilar-Saavedra (2009a) increases the -channel cross section but has no impact on or -channel. It should be noted that for all of these examples, a proper evaluation of the sensitivity includes not just the modification of the cross section but also of the experimental acceptance. In particular, since the experimental analyses use MVA techniques, the sensitivity is mainly to SM-like production mechanisms. Dedicated searches, such as those presented in the next sections, are generally more sensitive for each possible BSM scenario.
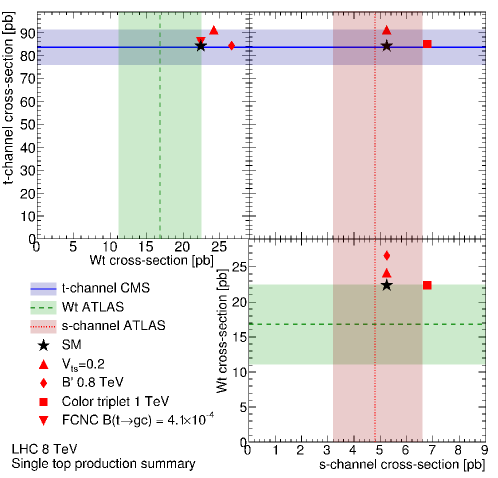
IV SM parameter extraction and searches for new physics leading to anomalous couplings
Since the mass of the top quark is of the order of the electroweak symmetry-breaking scale (, where is the top-quark Yukawa coupling), several new-physics models assign a special role to the top quark, with the consequence of typically predicting larger anomalies in the top-quark sector than for other quarks. Examples include top-flavor models with a seesaw mechanism He et al. (2000), top-color seesaw models Dobrescu and Hill (1998), models with vector-like quarks Okada and Panizzi (2013), and others.
The large data sets accumulated so far allow the use of single top-quark events as tools to constrain the parameters of the SM and to search for evidences of new physics, directly and indirectly. Beyond measuring the cross section, which provides access to the CKM matrix element , single top-quark events are now also used to measure asymmetries and angular correlations with increasing complexity. The -channel production mode has the largest production cross section and the smallest background and is thus the only channel where these measurements have been made so far. These measurements provide indirect limits on effective field theory couplings of the top quark to the boson and other bosons Barducci et al. (2018).
IV.1 Constraints on and other CKM matrix elements
The moduli of the elements of the CKM matrix that connect the top quark with the down-type quarks, , , and , are precisely determined from measurements of -meson oscillations and loop-mediated rare and decays Charles et al. (2005). From these data, and with some model assumptions such as the existence of only three generations of quarks and the absence of non-SM particles in the loops Alwall et al. (2007), the value of is derived with a precision of order : Patrignani et al. (2016). The strong reliance of this derivation on the aforementioned assumptions motivates alternative inferences based on different sets of hypotheses. There is interest, for example, in exploring the possibility that a hypothetical heavier quark-like particle, such as a fourth-generation up-type quark or a heavy vector-like quark Aguilar-Saavedra et al. (2013) (both named in the following) mixes with the top quark, yielding a lower value of than expected from unitarity. Mixing may happen not only with sequential replicas of the known quarks, easily accommodated in the SM framework but severely constrained by the Higgs cross section measurements Lenz (2013)), but in general with any hypothetical quark-like particle with the appropriate quantum numbers. Differently from the new-generations case, the effective mixing matrix may be rectangular, as in the case of vector-like quarks Okada and Panizzi (2013); Aguilar-Saavedra et al. (2013). While the sum and, a fortiori, the sum is bound to be also in the extended matrix, the constraints on and derived from precision physics Patrignani et al. (2016) do not hold when their underlying assumptions (e.g., no non-SM particles in the loops) are relaxed Alwall et al. (2007).
Swain and Taylor (1998) made a first attempt to extract without relying on unitarity, using electroweak loop corrections, in particular from the branching ratio, and combining several electroweak data from LEP, SLC, the Tevatron, and neutrino experiments, to obtain . Alwall et al. (2007) applied the same principle to derive a lower limit on the mixing angle between the top quark and a from the branching fraction of the boson into quarks measured at LEP and SLD.
Another complementary approach links with measurements of the ratio in events Abazov et al. (2011a); Aaltonen et al. (2013, 2014a); CMS Collaboration (2014a), where . The SM with three fermion families imposes the unitarity condition , implying that this quantity can be written as and can thus be used to infer directly. The most precise measurement of this ratio, CMS Collaboration (2014a), yields a precision on if no unitarity assumption is made (), and a lower limit at 95% confidence level is obtained with the Feldman-Cousins frequentist approach Feldman and Cousins (1998) if unitarity is imposed to the CKM matrix.
The ratio can be combined with the -channel cross-section measurement in order to extract an indirect measurement of the top-quark width, which is directly proportional to the -channel cross section as long as . Using this approach, the width measured by D0 is GeV Abazov et al. (2012a), which is significantly improved upon in the measurement by CMS of GeV CMS Collaboration (2014a). These measurements assume that the initial-state boson is on-shell in the -channel exchange, which of course is not generally valid. The width of the top quark will be measurable directly, in a theoretically well defined approach, by exploiting a selection targeting -channel single top quarks, and distinguishing between resonant and non-resonant production ( and , versus and production) Giardino and Zhang (2017).
The single top-quark production cross sections in - and -channel and -associated mode can be written, in the SM, as the sum of three contributions:
| (1) |
where , , and represent the cross sections expected for the sub-processes where, respectively, a down, strange, and bottom quark are connected to a top quark, see Fig. 1. Therefore, these production modes are potentially sensitive to all three elements of the third row of the CKM matrix. The single top-quark cross sections in -channel and production modes in particular have an enhanced sensitivity to and due to the large parton densities of and quarks in the proton Tait and Yuan (2000); Alwall et al. (2007); Lacker et al. (2012), differently from the -channel mode.
Single top-quark cross section measurements can be used to derive without the need to rely on the unitarity condition, under the simplifying assumption that, whatever the values, the relationships and hold true, which makes the cross section of the processes in Fig. 1 directly proportional to . Under these conditions, the product is extracted by dividing the measured cross section for each channel by the corresponding theory prediction and then taking the square root. The factor is the form factor for the purely left-handed vector coupling, see Eq. 2. It is unity in the SM but could be larger than unity if anomalous couplings due to new physics are present. It is customary to also quote the 95% confidence level interval obtained by setting , i.e. with the additional unitarity constraint . The procedure outlined so far ignores the possibility that the coupling may receive contributions from right-handed or non-vectorial operators that are instead usually considered in studies such as those reported in Section IV.4. Figure 26 shows the values times extracted by the LHC experiments from single top-quark cross section measurements under these assumptions The LHC Top Working Group (2017). At the Tevatron, the CKM matrix element is extracted from the cross section measurement, obtaining , corresponding to a lower limit at the 95% confidence level of CDF and D0 Collaborations, Tevatron Electroweak Working Group (2009).
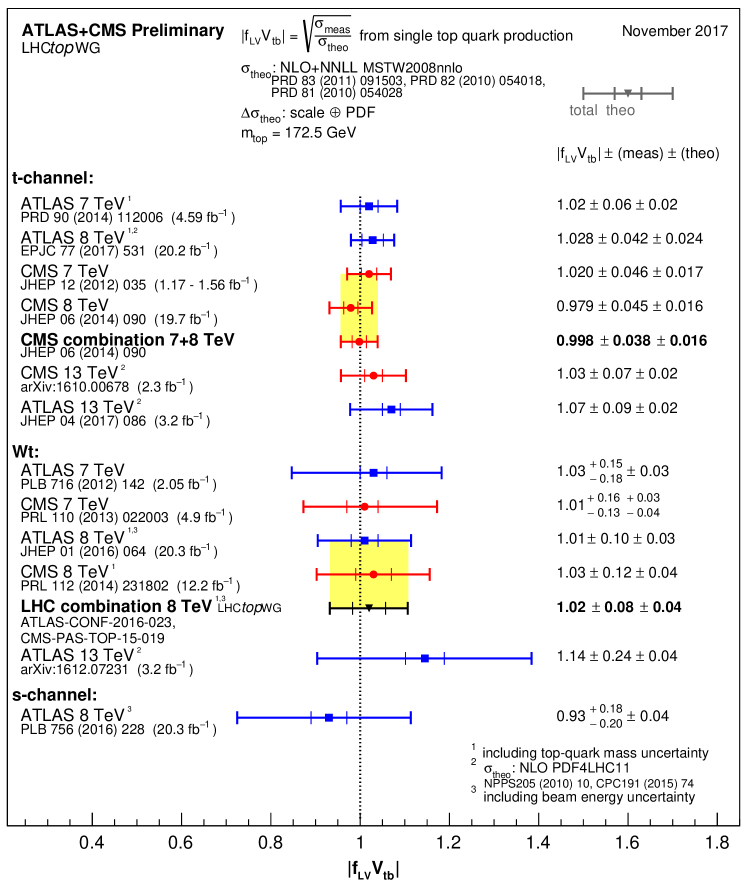
Alwall et al. (2007); Aguilar-Saavedra and Onofre (2011); Lacker et al. (2012) illustrated how to derive less model-dependent limits on all three matrix elements by re-examining the measurements of single top-quark cross sections and published at the time. Not having direct access to the data requires several approximations in the analysis. A particularly tricky case for the reinterpretation is that single top-quark analyses are based on multivariate techniques. The MVA input variables are related to the kinematic properties of the reconstructed top quark and the event, which would be modified in production through or , thus modifying the acceptance. Moreover, the jet coming from the top-quark decay is assumed to be a -jet, thus is assumed.
Aguilar-Saavedra and Onofre (2011) propose to use the rapidity of the single top quark and antiquark in -channel and production modes to set direct limits on . Similarly, in Alvarez et al. (2018), it is proposed to use the integrated charge asymmetry in to extract . Both methods rely on the consideration that -quark-initiated production, Fig. 1, has exactly the same kinematic properties and rate whether the initiator quark is a or , while -quark-initiated processes feature different rate, spectra and angular distributions, depending on the initiator being a or , due to the different spectrum of quark and antiquark.
IV.2 Cross section ratios as inputs for PDF extraction
A feature of SM single top-quark production at the LHC, absent in collisions and therefore unmeasurable in Tevatron data, is the difference in production rate (integrated charge asymmetry, ) between top quark and antiquark production in the - and -channel modes. The magnitude of these ratios is primarily driven by the relative importance of the up- and down-quark densities and is therefore potentially helpful to constrain those densities, making single top-quark production a useful input to global PDF fits. This sub-section focuses on the integrated charge asymmetry in -channel production, as no measurement of this quantity has been performed yet for the other single top-quark production modes. The interest of charge asymmetry in is discussed in Section IV.1.
The expectations depend on the CM energy: predictions at 13 TeV are, in general, significantly smaller than those at 8 TeV, which are in turn smaller than at 7 TeV, as intuitively understandable from the consideration that “sea” quarks contribute more than “valence” quarks at large . The measurements are complementary to -boson cross-section ratios (that are similarly sensitive to up- and down-quark densities) by probing larger values. The ABMP16 PDF set Alekhin et al. (2017) already includes this information in the fit, and the relative importance of in PDF extractions is expected to grow with more integrated luminosity available to the LHC experiments in Run 2.
The values of measured by the ATLAS collaboration at 7, 8 and 13 TeV ATLAS Collaboration (2014a, 2017b, 2017c) and the CMS collaboration at 8 and 13 TeV CMS Collaboration (2014b, 2017a) have been compared to the predictions for a variety of PDF sets. Figure 27 compares the measurements at 8 and 13 TeV between the two experiments and with predictions for several PDF sets: HERAPDF 2.0 NLO H1 and ZEUS Collaborations (2010), ABM11 NLO Alekhin et al. (2012), ABM12 NNLO Alekhin et al. (2014), MMHT14 NLO Harland-Lang et al. (2015), CT14 NLO Dulat et al. (2016), NNPDF 3.0 NLO Ball et al. (2015). The perturbative part of these calculations is performed at NLO with the HATHOR program Aliev et al. (2011); Kant et al. (2015) and has been cross-checked with the POWHEG generator Alioli et al. (2009); Re (2011). The scale and top-quark mass uncertainty components on the predictions are numerically small in comparison with the PDF and number of iterations components. HATHOR and POWHEG are found to yield compatible predictions within the statistical uncertainty. The ratio computed from the NNLO predictions shown in Table 1 are 1.82 at 8 TeV and 1.69 at 13 TeV, computed with MSTW2008, though no PDF uncertainty is available. This NNLO ratio is slightly higher than the MMHT-based calculation at 8 TeV and consistent with it at 13 TeV.
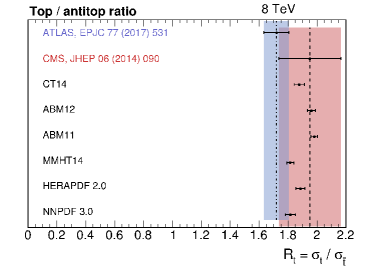

Alekhin et al. (2016) (Fig. 13 of that paper) showed that the ATLAS measurement of at 7 TeV and the one by CMS at 8 TeV give consistent pictures, with the CT10 Lai et al. (2010), CT14, MMHT14, NNPDF 3.0 sets slightly disfavored, while ABM12 and ABM15 Alekhin et al. (2016) are favored. The latter includes -boson charge ratios in the fit, while the single top-quark charge ratio in the -channel is used as a “standard candle” to validate the predictions of their PDF set 999The individual cross section measurements of single top quark and antiquark production at the LHC, not yet including the 8 TeV ATLAS measurement, have been used to extract the ABMP16 set Alekhin et al. (2017).. However, this picture became inconsistent with the later publication of the most precise result in the literature, which is the ATLAS measurement at 8 TeV: this yields smaller values than most PDF sets, and is in tension with most of the PDF set predictions for this observable, as shown in Fig. 27, while the aforementioned ATLAS and CMS measurements at 7 and 8 TeV both yield larger values than most PDF sets. The small uncertainty of the ATLAS measurement highlights the value of time in hadron collider analyses. The ATLAS analysis was published almost three years after the CMS analysis, and that time was used to improve the detector understanding and theory modeling, and to devise an optimal analysis strategy. Rather than obtaining from the ratio of measured cross sections, ATLAS extracts in one simultaneous fit to the top quark and antiquark cross sections. This directly accounts for all correlations, including those between the two analysis regions and those between different systematic uncertainties that are induced in the fit.
The currently available measurements at 13 TeV, based on the data collected in 2015, are limited by their statistical uncertainty and do not shed light on this inconsistency yet. However, future measurements of based on the full Run 2 data set may be expected to surpass the best Run 1 measurements in precision, and, in conjunction with them, may provide strong constraints on future global PDF fits. Moreover, with more data, differential distributions of as a function of the rapidity and transverse momentum of the top quark will provide significant additional discriminating power Berger et al. (2016).
Another useful input for constraining PDFs is the measurement of the ratios of single top-quark cross sections between different CM energies, as done by the CMS collaboration in the -channel case. The ratio of the cross sections of the -based analysis at 7 and 8 TeV CMS Collaboration (2014b) is (. Measurements of the ratios profit from cancellations of several important systematic uncertainties and are sensitive to the evolution of the partonic distributions in the proton. Given the larger jump in energy, it will be instructive to see the results of the same exercise using the 13 TeV results, as well as the double-ratio obtained by taking the ratio of between different CM energies. Unfortunately, these measurements have not been reported by the LHC experiments yet.
IV.3 Top-quark mass
Similarly to , single top-quark events can be exploited for the measurement of the top-quark mass, , either directly by kinematic reconstruction of a top-quark candidate, or indirectly through the dependence of the cross section on the mass.
The CMS Collaboration (2017c) has performed a direct measurement of the top-quark mass with -channel single top-quark events using the 8 TeV dataset. Top-quark candidates are reconstructed in the -channel topology from their decay to a boson and a quark, with the boson decaying leptonically to a muon and a neutrino. At variance with respect to events, there is typically only one central jet in the -channel single top-quark process. Top-quark pair events constitute a relatively large fraction of the events even in a single top-quark optimized signal region, but in the context of this measurement they are treated as a component of the signal, as they carry information on the parameter of interest. However, care is taken in making the selection orthogonal to the -based measurements of the same quantity in the single- and di-lepton final states, in order to facilitate future combinations CMS Collaboration (2016a). The interest of performing this measurement in a single top-quark topology lies in the complementarity with , with which the systematic uncertainties are partially uncorrelated as the color flow is very different (there is no color flux between the two quark lines in -channel production), and the statistical uncertainty is uncorrelated.
The event selection and the procedure to reconstruct the top-quark candidates follow closely the -channel cross section measurement in the same dataset CMS Collaboration (2014b), with two additional conditions imposed in order to enhance the purity of the sample: the absolute value of , defined as in Section III.2.1, is required to be larger than 2.5; and in order to exploit the large charge asymmetry of the -channel production mode, the main result is restricted to events with positive muons, hence with top quarks, while those with negative muons (top antiquarks) are only used to cross-check the result on an independent dataset. A fit to the invariant mass distribution of reconstructed top-quark candidates‘101010The fit assumes, of course, the same top-quark mass in single top-quark and events; therefore, the latter are effectively treated as a component of the signal. yields a value of the top-quark mass of GeV, in agreement with the results from CDF and D0 Collaborations (2016); ATLAS Collaboration (2015a); CMS Collaboration (2016a). Several systematic uncertainties are larger than in the standard analyses in the +jets topology, where the invariant mass of the jets failing -tagging is expected to peak at the mass of the boson, allowing to calibrate the jet energy scale in situ and also reducing several modeling uncertainties related to soft QCD effects. Moreover, in comparison with -optimized selections, the -channel signal region is more contaminated by +jets backgrounds, whose modeling parameters are relatively poorly constrained, due to its lower multiplicity of jets and jets.
Similarly to the case ATLAS Collaboration (2014b); CMS Collaboration (2016b); Abazov et al. (2016), the inclusive single top-quark cross sections can be used to extract the top-quark pole mass thanks to the strong dependence of the theoretical predictions on this parameter Kant et al. (2015). The strongest dependence is found for -channel production ( at TeV), followed by ( at TeV), while the -channel shows a weaker dependence ( at TeV). However, for a practical use of this method, particular care should be taken to minimize the dependence of the experimental measurement of the cross section on Schuh (2016). The 8 and 13 TeV ATLAS -channel analyses ATLAS Collaboration (2017b, c) measure a cross section that decreases with the assumed top-quark mass. This is the same behavior as in the theoretical prediction, and this imposes an additional limitation on the precision of the extraction of the top-quark mass.
IV.4 vertex structure
All single top-quark production processes are sensitive to anomalous couplings in the vertex and provide sensitivity beyond because the vertex appears both in the production of the top quark and in its decay. In particular, since the top-quark lifetime is shorter than the timescale of spin decoherence induced by QCD, its decay products retain memory of its polarization imprinted by the production mechanism. This provides additional powerful tools in the search for BSM physics in single top-quark studies: in single top-quark production via the -channel, the SM predicts that top quarks are produced almost fully polarized through the V–A coupling along the direction of the momentum of the quark that recoils against the top quark Mahlon and Parke (2000); Jezabek and Kuhn (1994), while new physics models may lead to a depolarization in production or decay by altering the coupling structure Aguilar-Saavedra and Bernabeu (2010); Aguilar-Saavedra (2008, 2009a); Bach and Ohl (2012).
The most general Lagrangian term that one can write for the coupling up to dimension-six gauge invariant operators Aguilar-Saavedra (2009a), under the approximation , is:
| (2) |
where the form factors and denote the strength of the left- and right-handed vector-like couplings, and and denote the left- and right-handed tensor-like couplings. Slightly different notations are used in the figures in this review, . Similarly, . The SM predicts , at tree level. In single top-quark production, the production and the decay of the top quark are both sensitive to anomalous couplings. When considering one form factor at a time, the cross section is proportional to the form factor squared. When considering two or more simultaneously, interference effects may also come into play. For consistency, the Tevatron limits are given in terms of absolute value of couplings squared.
At the Tevatron, anomalous coupling searches have focused on the magnitude of the four form factors. D0 optimized the single top-quark anomalous couplings search in the two-dimensional plane of one anomalous coupling and the SM-like left-handed vector coupling Abazov et al. (2012c). The D0 single top-quark anomalous couplings search uses an MVA, which is trained on samples with either purely left-handed or purely right-handed vector couplings, in both production and decay. The single top-quark search was also combined with a -boson helicity measurement in to set stringent limits on pairs of form factors Abazov et al. (2012b). Figure 28 shows the two-dimensional Bayesian posterior density for one such pair of anomalous couplings. Note that the limit is set as a function of the coupling squared since the cross section is proportional to that. For comparison with the LHC experiments below, one should take the square root.

At the LHC, the approach followed by ATLAS and CMS has been to consider the relationship between top-quark production and decay. At 8 TeV, ATLAS relied on the definition of eight polarization variables, together with the magnitude of the polarization. The angular distributions of the decay products of the top quark are given by
where is the angle between the direction of flight of the decay product and a properly chosen spin quantization axis, is the top-quark degree of polarization along this quantization axis, and is the spin analyzing power for this decay product, which takes a value of at NLO for charged leptons in the SM Jezabek and Kuhn (1994); Brandenburg et al. (2002); ATLAS Collaboration (2017e). The relevant angles are illustrated in Fig. 29. The axis is given by the direction of the boson in the top-quark rest frame, the -axis is given by the top-quark spin component that is orthogonal to , and the axis is orthogonal to these two, defining a right-handed coordinate system. With these definitions, three angles are defined: is the angle between the axis and the lepton momentum in the top-quark rest frame, the is the angle between the projection of the lepton momentum in the top-quark rest frame onto the plane and the axis and is the angle between the lepton momentum in the top-quark rest frame and the axis. Quantifying the degree of polarization along the direction of the spectator quark gives 0.91 for top quarks and -0.86 for top antiquarks Schwienhorst et al. (2011).
The ATLAS and CMS experiments select single top-quark events in the -channel final state consisting of a charged lepton from the decay of the boson from the top-quark decay, large , and two jets, one of which is -tagged and the other one is in the forward detector region. In the ATLAS analysis ATLAS Collaboration (2017e), using 8 TeV data, the signal region contains about 9000 events, half of which are expected to come from -channel production. The angular observables are unfolded to the parton level in two bins, one for positive cosine of the relevant angle (i.e., forward-going direction of the decay product with respect to the corresponding spin quantization axis) and one for negative cosine (backward-going with respect to the same axis). Based on these angular observables as well as for the variable, forward-backward asymmetries are defined. The measured asymmetries and the corresponding theory predictions are shown in Fig. 29(right). From the asymmetries, a limit on the imaginary part of is also derived. The limit interval at the 95% confidence level is .


CMS measured the single top-quark polarization with 8 TeV data CMS Collaboration (2016c). A model-independent selection targets -channel production, then the observed distribution (Fig. 14) is used to infer the differential cross section as a function of the parton-level (see Section III.2.1). This is found to be compatible with the linear expectation of Eq. (IV.4), and a linear fit yields , compatible with the SM expectation within two standard deviations.
With the same data set, CMS also used a different selection, targeting -channel events but tolerating a larger contamination from with respect to typical analyses in the same final state, to extract the -boson helicity amplitudes with 8 TeV data CMS Collaboration (2015). The sensitivity to those parameters comes mostly from the decay vertex of the top quark rather than from the production vertex, exploiting the helicity angle defined as the angle between the -boson momentum in the top-quark rest frame and the momentum of the down-type fermion from the -boson decay, in the rest frame of the mother particle. A fit to the distribution of discriminates the components of the signal originating from the right-handed (), left-handed () and longitudinal () helicity fractions of the W boson. Similarly to the top-quark mass case described in Section IV.3, the interest of an analysis in this final state lies in the complementarity with the measurements traditionally performed with selections targeting production. In this measurement, events, that constitute the majority of the population in the signal region, are treated as a component of the signal as they carry information on the parameters of interest. The measured helicity fractions are , , and . These results are used to set limits on the real part of the tWb anomalous couplings, and , assuming no CP violation (hence no imaginary components for those couplings).
ATLAS also measured double-differential angular correlations in 7 TeV data ATLAS Collaboration (2016d) and triple-differential angular correlations in 8 TeV data ATLAS Collaboration (2017a). The angular observables are expressed in terms of spherical harmonics in the 7 TeV analysis and in terms of orthonormal functions that are the products of spherical harmonics Boudreau et al. (2013, 2016). Figure 30 summarizes the results at both CM energies, shown as a function of the ratio of the anomalous coupling over the SM-like left-handed vector coupling, including both the real and imaginary parts for the right-handed tensor coupling (). The measurements are consistent with the SM prediction, and the 8 TeV measurement is a significant improvement over the 7 TeV one.


The CMS analysis that combines 7 and 8 TeV data CMS Collaboration (2017f) is based on the anomalous couplings model in Boos et al. (2016). The search is for combinations of anomalous couplings similar to the D0 analysis, except that here the limit is set simultaneously on three anomalous couplings: the right-handed vector coupling and the two tensor couplings. A BNN is trained to separate the anomalous signal from the different backgrounds and the SM prediction. The resulting contours projected onto two dimensions are shown in Fig. 31. The contours are significantly tighter than the two-dimensional limit contours from D0 shown in Fig. 28, even though there is is an additional degree of freedom here. Comparing the limits from ATLAS (Fig. 30) and CMS (Fig. 31), the graph shows clearly that for the left-handed tensor coupling, the CMS analysis is more sensitive, while for the right-handed tensor coupling, the ATLAS analysis is more sensitive.


IV.5 Searches for Flavor Changing Neutral Currents
Models that try to solve the so called “flavor problem” Georgi (1986) usually predict a large coupling of new particles to the top quark, and therefore sizable FCNC effects in the top-quark sector, despite the tight constraints in the - and -meson sectors. These are very interesting to look for in single top-quark production, where the effect of a small coupling would be enhanced by the large -quark density Tait and Yuan (2000). The same effect would come from a coupling, although with a less spectacular enhancement from the PDF. Formulations exist where BSM effects in quantum loops are absorbed by effective or couplings, where can be a gluon, a photon, a or boson (read, for example, Aguilar-Saavedra (2009a); Zhang and Willenbrock (2011)). Based on the consideration that higher-order effects mix the effects of different couplings, inducing ambiguities in the interpretation of single signatures, a global approach is advocated in Durieux et al. (2015); Barducci et al. (2018). However, the results reviewed in this paper make use of leading-order FCNC models.
CDF searched for single top quarks produced by top-gluon FCNC in +1 jet events Aaltonen et al. (2009b). The ATLAS collaboration searched for the same exotic signature of a single top quark produced in isolation (i.e., a partonic reaction producing a top quark) with the 7 and 8 TeV data sets ATLAS Collaboration (2012d, 2016e), to constrain the top-gluon FCNC couplings and . The analysis selects events with a single charged lepton, significant and a single jet, passing b-tagging identification. A BNN is applied on the selected events, trained to separate FCNC signals from SM events.
D0 searched for a single top quark produced together with a light quark, i.e., a -channel signature, created by a top-gluon FCNC Abazov et al. (2007b). This is also the basis for the CMS top-gluon FCNC search that combines 7 and 8 TeV data CMS Collaboration (2017f). Just like for the anomalous couplings search described in the same paper (see Section IV.4), here also a MVA is trained to maximize sensitivity to the and interactions.
The CMS collaboration searched for events containing a top quark and a large- photon with the 8 TeV data set CMS Collaboration (2016d). The semileptonic decay of the top quark is used, and a MVA is performed to discriminate the FCNC signal from the SM backgrounds. The dominant +jets and jets backgrounds are estimated from data. This statistically-limited analysis makes use of the event counts to set limits on the effective couplings of the and types. For the purpose of easy comparison with measurements in production, the result is also interpreted in terms of an equivalent branching ratio of top-quark decay into a photon and a quark. CMS also searched for events containing a single top quark and a boson decaying to two leptons CMS Collaboration (2017g) using the 8 TeV dataset. This analysis not only sets limits on SM production (see Section III.2.5), but also searches for FCNC production of . The resulting limit on the coupling is competitive with the sensitivity from top-quark decay searches.
Figure 32 summarizes the limits on FCNC interactions from ATLAS and CMS from both top-quark decay searches and single top-quark production searches, expressed in terms of equivalent branching ratios of top-quark decay. Figure 33 shows a summary that also includes the limits from HERA Aaron et al. (2009); Abramowicz et al. (2012) and LEP Achard et al. (2002); Abdallah et al. (2004); Abbiendi et al. (2001); Barate et al. (2000), where the CM energy or the integrated luminosity is not sufficient to produce a measurable number of top-quark events in the SM. At HERA, the FCNC exchange of a photon or boson between the electron and the proton leads to a single top quark in the final state. At LEP, the exchange of a photon or boson leads to a or final state. Thus, single top-quark final states are responsible for all HERA and LEP limits in Fig. 33, as well as all limits on and .
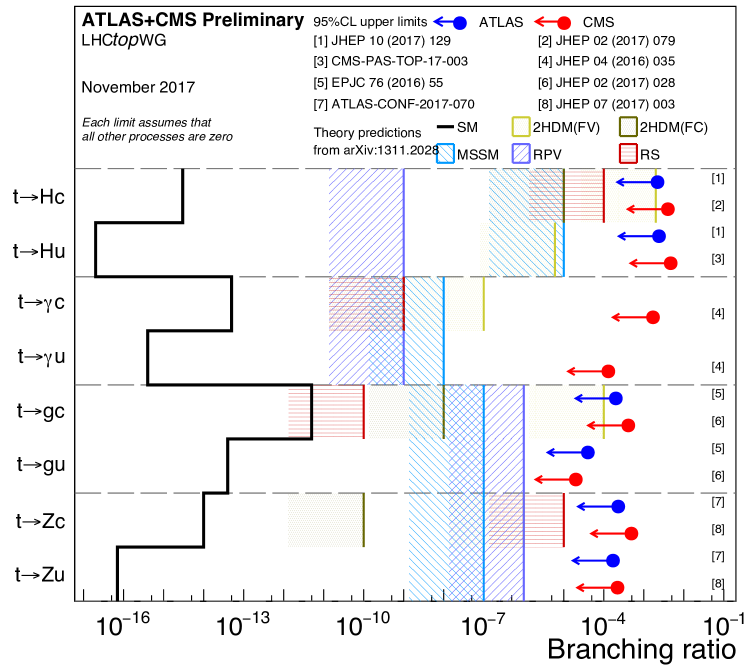
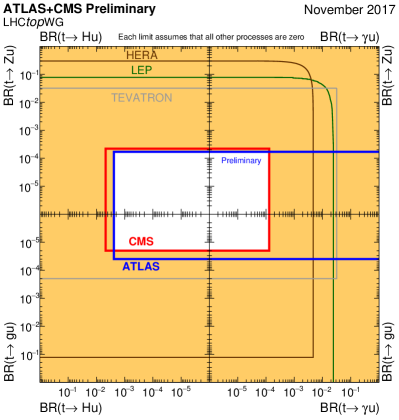
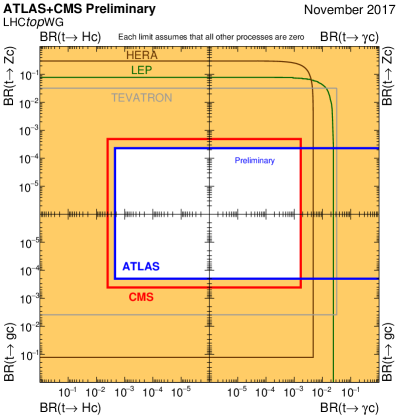
IV.6 -associated single top-quark production ()
The associated production of a single top quark and a Higgs boson () provides a complementary experimental view on the interaction of the Higgs boson with the top quark, with respect to the measurement of production in association with a Higgs boson (). In particular, while the process is sensitive to the modulus of , production is characterized by a tree-level sensitivity to the relative phase between and the coupling of the Higgs to the gauge bosons Bordes and van Eijk (1993), thanks to an accidental numerical similarity of the amplitudes of the diagrams where the Higgs boson is radiated by the boson and by the top quark (see Fig. 34). In the SM the couplings of the Higgs boson to the boson and the top quark have opposite sign, leading to destructive interference and very small cross sections, while a significant enhancement is expected if some kind of BSM physics induces a relative phase between these two couplings (more than one order of magnitude in the so called “inverted top-quark coupling scenario”, or ITC, where ). In the case of other processes used to set constraints on the phase, like and Hespel et al. (2015), sensitivity to this phase comes through loop corrections, making their interpretation intrinsically more model-dependent as the particles running in the loop have to be specified. Any analysis of the Higgs-boson couplings that aims at being agnostic about new physics in these loops is unable to use these processes to lift the degeneracy on the sign of Ellis and You (2012, 2013).
Single top-quark plus Higgs-boson production proceeds mainly through -channel diagrams (), as in Fig. 34, and therefore the current searches are optimized for this final state, although the interest of the signature is similar and it has also been explored in the theoretical literature Farina et al. (2013); Demartin et al. (2017). The and processes feature the same kind of mixing discussed in Section III.2.2 in the case of and .
While the SM rate is arguably too low to be observed with available and future LHC data, the large enhancement in the ITC scenario will allow to either observe or exclude this case with the LHC Run 2 data, as has been suggested in a number of phenomenological papers Biswas et al. (2013b); Farina et al. (2013); Biswas et al. (2013a); Chang et al. (2014).


Using the full 8 TeV data set, the CMS Collaboration (2016g) performed dedicated searches for in a variety of signatures: , , same-sign leptons, three leptons, and electron or muon plus hadronically-decaying . In all Higgs decay channels, the top quark is assumed to decay semileptonically. The data generally agree with the SM expectations, and limits are set in the individual channels and combined with and without the assumption that the value of affects and coherently. When this assumption is made, as shown in Fig. 35 (left), the channel is the most sensitive as expected from the theory literature Biswas et al. (2013b). The combined limit is also provided with treated as a free parameter, thus facilitating possible reinterpretations in different theoretical frameworks, see Fig. 35 (right). The ATLAS Collaboration (2015b), also using the 8 TeV data set, followed a different approach. Instead of a direct search for this process, single top-quark plus Higgs-boson production is included in the signal model in a -optimised search in the decay channel, which allows to set limits on negative values of .
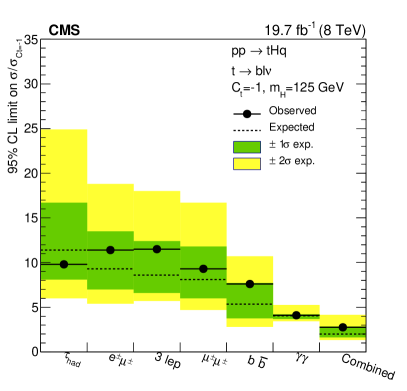

V Conclusions and Outlook
In the decade that has passed since first experimental evidence for electroweak production of a single top quark was reported, the study of single top-quark production has become a very fertile and mature research direction. Production rates of processes with a single top quark have been measured in four production modes, at four distinct center-of-mass energies, using five detectors at two accelerators with two different beam particle configurations. Precision measurements of top-quark properties and searches for new couplings of the top quark utilize single top-quark processes as a powerful probe for new-physics effects.
The groundwork for today’s single top-quark studies was laid at the Tevatron, where measurements, searches and analysis techniques that are in use at the LHC today were first established. The single top-quark discovery relied on multivariate approaches, and the first single top-quark samples were used to search for anomalous couplings and new physics.
Thanks to the excellent performance of the LHC during the ongoing Run 2, an integrated luminosity of is expected to be collected at 13 TeV by the end of 2018. This large amount of data will have a big impact on several of the analyses described here: measurements that so far have been statistics-limited, such as the cross section and top quark/antiquark cross-section ratios; differential measurements, whose power to constrain new physics, SM parameters and MC generator settings will benefit from more bins and more population in the tails of some crucial distributions; and searches for new physics, especially those in clean final states involving neutral bosons. The interference between and will be a point of study in the coming years, both on the theoretical and the experimental side. This effort, and precision measurements in general, rely on improvements in the theoretical modeling of single top-quark processes, not only including off-shell processes but also bringing the theoretical cross-section calculations to NNLO accuracy for single top-quark production channels beyond the -channel.
At the time of writing, we are still waiting for the first measurement of -channel single top-quark production at 13 TeV. The larger amount of available data, by itself, does not make the study of this process easier than it was at 7 and 8 TeV: the signal cross section at 13 TeV is only about twice that at 8 TeV Kant et al. (2015), while the dominant background, , is three times larger Czakon and Mitov (2014). As the Run 1 analyses were already limited by systematic uncertainties, measuring -channel single top at 13 TeV with a useful precision will require significant progress on the theory side, such as to reduce the signal and background modeling uncertainties, and new ideas for an experimental break-through. More data can help, for example through a more extended exploitation of auxiliary control regions, to better constrain the modeling of the backgrounds in situ.
Single top-quark analyses at Tevatron were among the pioneers for the introduction or broader acceptance of several multivariate analysis techniques in collider physics Bhat (2011). In spite of a conventional wisdom that, at the time, favored simple cut-and-count methods in the searches for new processes in hadron-hadron collisions, the challenges posed by the search for single top-quark production at Tevatron created a strong incentive for practicing machine-learning methods such as Neural Networks and Boosted Decision Trees, that at the time of writing count among the most popular tools for LHC analysis, and the ME method that had been developed for top-quark physicsKondo (1988, 1991), although applied until then for different use cases such as top-quark mass measurements. We are currently witnessing a burst of interest in borrowing even more advanced machine-learning techniques from the larger world outside of High Energy Physics Cowan et al. (2015), and it is likely that single top-quark analyses, again, will be among the early adopters. With regard to the ME method, a recent methodological break-through has been the inclusion of NLO Feynman diagrams in the computation of the dynamical likelihoods Martini and Uwer (2015, 2017a, 2017b), overcoming the computational challenge by an efficient method to calculate NLO QCD weights for events with jets. This development is expected to reduce the biases in analyses that aim at extracting model parameters, and to improve the sensitivity of the searches for new processes. Martini and Uwer (2017b) specifically address the interest of this development in the context of single top-quark studies.
Apart from pushing the energy and luminosity frontier in its regular proton-proton runs, the LHC continues to advance knowledge by an intense programme of collisions involving heavy ions, complemented by “reference runs” of proton-proton collisions at lower energy. The cross section has already been measured by the CMS collaboration at a CM energy of 5.02 TeV CMS Collaboration (2017b) using a data set of 26 collected in 2015. With an order-of-magnitude larger data set collected in 2017, the multi-purpose ATLAS and CMS experiments may have the potential to study also single top-quark production at that energy, providing further input to PDF fits. Recently, top-quark pair production has been observed in proton-lead collisions at TeV CMS Collaboration (2017d), and it is expected that single top-quark measurements will also join the physics program with future heavy-ion runs at the LHC d’Enterria et al. (2015); Baskakov et al. (2015). The single top-quark production cross section increases by a factor 30 to 40 for heavy ion runs at a possible future circular collider d’Enterria (2017), which turns single top-quark events into precise probes. These and events will serve as a probe for parton density functions in nuclei at small and large momentum transfer Dainese et al. (2017).
At future hadron colliders like the HL-LHC, top-quark measurements will reach high precision Agashe et al. (2013), including single top-quark measurements Schoenrock et al. (2013). At a possible future 100 TeV hadron collider, single top-quark triggers might be possible, which would allow for unbiased studies of everything produced on the opposite side, including objects at high transverse momenta Arkani-Hamed et al. (2016).
Top-quark production occurs dominantly through single top-quark events at the future electron-hadron collider Abelleira Fernandez et al. (2012), where top-quark pair production (via a neutral current) is suppressed by an order of magnitude. Searches for FCNC interactions are also promising Liu et al. (2015), equivalent to those for and Abramowicz et al. (2012); Aaron et al. (2009).
At future lepton colliders, top quarks are produced in pairs through electro-weak interactions. The focus will be on high-precision measurements of the top-quark mass and of the top-quark couplings to the boson and the photon Agashe et al. (2013); Baer et al. (2013); Bicer et al. (2014). Single top-quark production proceeds in an electron-photon collision, with one incoming lepton radiating off a photon and the other incoming lepton radiating off a boson, resulting dominantly in a final state of a top quark plus a quark plus a forward lepton Boos and Dudko (2012); Penunuri et al. (2011). The cross section for this process is about an order of magnitude smaller than that for production. Similar to hadron colliders, single top-quark production at lepton colliders is directly proportional to and the precision is limited by the theoretical and experimental understanding of the production process.
Acknowledgements.
The authors acknowledge Nikolaos Kidonakis for his kindness in providing the theory curves for -channel, -channel, and -associated production and Jérémy Andrea for calculating the theory curve for the -associated process in Figure 24. We acknowledge the CMS Collaboration for an earlier version of that figure. Jérémy Andrea, together with Mara Senghi Soares, also helped to clarify the differences between the ATLAS and CMS modeling choices for the signal. Figure 27 was produced starting from a macro from the CMS Collaboration and the theory predictions for that figure have been calculated by Wajid Ali Khan and Dominic Hirschbühl. We also thank the latter, as well as Alberto Orso Maria Iorio, for clarifying the methodology followed in ATLAS and CMS, respectively, to compute the impact of PDF uncertainties on their measurements. Some paragraphs in Sections I, III.2.1, IV.1, IV.5, and IV.6 are adapted from Giammanco (2016). The authors wish to thank C.-P. Yuan, Muhammad Alhroob, Regina Moles Valls, Rebeca Gonzalez Suarez, Thorsten Chwalek and Tom Junk for their comments on a preliminary draft of this paper. The Feynman diagrams in this paper have been created with JaxoDraw Binosi and Theussl (2004). All the other original figures have been created with ROOT Brun and Rademakers (1997). The work of Schwienhorst was supported in part by NSF grants PHY-1410972 and PHY-1707812.References
- Aaltonen et al. (2008a) Aaltonen, T. A., et al. (CDF Collaboration) (2008a), Phys. Rev. Lett. 101, 252001, arXiv:0809.2581 [hep-ex] .
- Aaltonen et al. (2008b) Aaltonen, T. A., et al. (CDF Collaboration) (2008b), Phys. Rev. Lett. 101, 192002, arXiv:0805.2109 [hep-ex] .
- Aaltonen et al. (2009a) Aaltonen, T. A., et al. (CDF Collaboration) (2009a), Phys. Rev. Lett. 103, 092002, arXiv:0903.0885 [hep-ex] .
- Aaltonen et al. (2009b) Aaltonen, T. A., et al. (CDF Collaboration) (2009b), Phys. Rev. Lett. 102, 151801, arXiv:0812.3400 [hep-ex] .
- Aaltonen et al. (2010) Aaltonen, T. A., et al. (CDF Collaboration) (2010), Phys. Rev. D 82, 112005, arXiv:1004.1181 [hep-ex] .
- Aaltonen et al. (2013) Aaltonen, T. A., et al. (CDF Collaboration) (2013), Phys. Rev. D 87 (11), 111101, arXiv:1303.6142 [hep-ex] .
- Aaltonen et al. (2014a) Aaltonen, T. A., et al. (CDF Collaboration) (2014a), Phys. Rev. Lett. 112 (22), 221801, arXiv:1404.3392 [hep-ex] .
- Aaltonen et al. (2014b) Aaltonen, T. A., et al. (CDF Collaboration) (2014b), Phys. Rev. Lett. 113 (26), 261804, arXiv:1407.4031 [hep-ex] .
- Aaltonen et al. (2014c) Aaltonen, T. A., et al. (CDF and D0 Collaborations) (2014c), Phys. Rev. Lett. 112, 231803, arXiv:1402.5126 [hep-ex] .
- Aaltonen et al. (2015) Aaltonen, T. A., et al. (CDF and D0 Collaborations) (2015), Phys. Rev. Lett. 115 (15), 152003, arXiv:1503.05027 [hep-ex] .
- Aaltonen et al. (2016) Aaltonen, T. A., et al. (CDF Collaboration) (2016), Phys. Rev. D 93 (3), 032011, arXiv:1410.4909 [hep-ex] .
- Aaron et al. (2009) Aaron, F. D., et al. (H1 Collaboration) (2009), Phys. Lett. B 678, 450, arXiv:0904.3876 [hep-ex] .
- Abachi et al. (1995) Abachi, S., et al. (D0 Collaboration) (1995), Phys. Rev. Lett. 74, 2632, arXiv:hep-ex/9503003 [hep-ex] .
- Abazov et al. (2001) Abazov, V. M., et al. (D0 Collaboration) (2001), Phys. Lett. B 517, 282, arXiv:hep-ex/0106059 [hep-ex] .
- Abazov et al. (2005) Abazov, V. M., et al. (D0 Collaboration) (2005), Phys. Lett. B 622, 265, arXiv:hep-ex/0505063 [hep-ex] .
- Abazov et al. (2006) Abazov, V. M., et al. (D0 Collaboration) (2006), Nucl. Instrum. Meth. A 565, 463, arXiv:physics/0507191 [physics.ins-det] .
- Abazov et al. (2007a) Abazov, V. M., et al. (D0 Collaboration) (2007a), Phys. Rev. Lett. 98, 181802, arXiv:hep-ex/0612052 [hep-ex] .
- Abazov et al. (2007b) Abazov, V. M., et al. (D0 Collaboration) (2007b), Phys. Rev. Lett. 99, 191802, arXiv:hep-ex/0702005 [hep-ex] .
- Abazov et al. (2008) Abazov, V. M., et al. (D0 Collaboration) (2008), Phys. Rev. D 78, 012005, arXiv:0803.0739 [hep-ex] .
- Abazov et al. (2009) Abazov, V. M., et al. (D0 Collaboration) (2009), Phys. Rev. Lett. 103, 092001, arXiv:0903.0850 [hep-ex] .
- Abazov et al. (2011a) Abazov, V. M., et al. (D0 Collaboration) (2011a), Phys. Rev. Lett. 107, 121802, arXiv:1106.5436 [hep-ex] .
- Abazov et al. (2011b) Abazov, V. M., et al. (D0 Collaboration) (2011b), Phys. Lett. B 701, 313, arXiv:1103.4574 [hep-ex] .
- Abazov et al. (2012a) Abazov, V. M., et al. (D0 Collaboration) (2012a), Phys. Rev. D 85, 091104, arXiv:1201.4156 [hep-ex] .
- Abazov et al. (2012b) Abazov, V. M., et al. (D0 Collaboration) (2012b), Phys. Lett. B 713, 165, arXiv:1204.2332 [hep-ex] .
- Abazov et al. (2012c) Abazov, V. M., et al. (D0 Collaboration) (2012c), Phys. Lett. B 708, 21, arXiv:1110.4592 [hep-ex] .
- Abazov et al. (2013) Abazov, V. M., et al. (D0 Collaboration) (2013), Phys. Lett. B 726, 656, arXiv:1307.0731 [hep-ex] .
- Abazov et al. (2014) Abazov, V. M., et al. (D0 Collaboration) (2014), Nucl. Instrum. Meth. A 763, 290, arXiv:1312.7623 [hep-ex] .
- Abazov et al. (2016) Abazov, V. M., et al. (D0 Collaboration) (2016), Phys. Rev. D 94, 092004, arXiv:1605.06168 [hep-ex] .
- Abbiendi et al. (2001) Abbiendi, G., et al. (OPAL Collaboration) (2001), Phys. Lett. B 521, 181, arXiv:hep-ex/0110009 [hep-ex] .
- Abbiendi et al. (2003) Abbiendi, G., et al. (OPAL Collaboration) (2003), Eur. Phys. J. C 29, 463, arXiv:hep-ex/0210031 [hep-ex] .
- Abbott et al. (2000) Abbott, B., et al. (D0 Collaboration) (2000), Phys. Rev. D 63, 031101, arXiv:hep-ex/0008024 [hep-ex] .
- Abdallah et al. (2004) Abdallah, J., et al. (DELPHI Collaboration) (2004), Phys. Lett. B 590, 21, arXiv:hep-ex/0404014 [hep-ex] .
- Abdallah et al. (2011) Abdallah, J., et al. (DELPHI Collaboration) (2011), Eur. Phys. J. C 71, 1557, arXiv:1102.4748 [hep-ex] .
- Abe et al. (1995) Abe, F., et al. (CDF Collaboration) (1995), Phys. Rev. Lett. 74, 2626, arXiv:hep-ex/9503002 [hep-ex] .
- Abe et al. (1998) Abe, F., et al. (CDF Collaboration) (1998), Phys. Rev. Lett. 80, 2525.
- Abe et al. (2002) Abe, K., et al. (SLD Collaboration) (2002), Phys. Rev. D 65, 092006, [Erratum: Phys. Rev.D66,079905(2002)], arXiv:hep-ex/0202031 [hep-ex] .
- Abelleira Fernandez et al. (2012) Abelleira Fernandez, J. L., et al. (LHeC Study Group) (2012), J. Phys. G 39, 075001, arXiv:1206.2913 [physics.acc-ph] .
- Abramowicz et al. (2012) Abramowicz, H., et al. (ZEUS Collaboration) (2012), Phys. Lett. B 708, 27, arXiv:1111.3901 [hep-ex] .
- Achard et al. (2002) Achard, P., et al. (L3 Collaboration) (2002), Phys. Lett. B 549, 290, arXiv:hep-ex/0210041 [hep-ex] .
- Acosta et al. (2002) Acosta, D., et al. (CDF Collaboration) (2002), Phys. Rev. D 65, 091102, arXiv:hep-ex/0110067 [hep-ex] .
- Acosta et al. (2005a) Acosta, D., et al. (CDF Collaboration) (2005a), Phys. Rev. D 71, 032001, arXiv:hep-ex/0412071 [hep-ex] .
- Acosta et al. (2005b) Acosta, D., et al. (CDF Collaboration) (2005b), Phys. Rev. D 71, 052003, arXiv:hep-ex/0410041 [hep-ex] .
- Adriani et al. (2006) Adriani, O., et al. (LHCf Collaboration) (2006), Technical design report of the LHCf experiment: Measurement of photons and neutral pions in the very forward region of LHC, Tech. Rep. CERN-LHCC-2006-004.
- Agashe et al. (2013) Agashe, K., et al. (Top Quark Working Group) (2013), in Proceedings, 2013 Community Summer Study on the Future of U.S. Particle Physics: Snowmass on the Mississippi (CSS2013): Minneapolis, MN, USA, July 29-August 6, 2013, arXiv:1311.2028 [hep-ph] .
- Aguilar-Saavedra (2008) Aguilar-Saavedra, J. (2008), Nucl. Phys. B 804, 160, arXiv:0803.3810 [hep-ph] .
- Aguilar-Saavedra (2009a) Aguilar-Saavedra, J. (2009a), Nucl. Phys. B 812, 181, arXiv:0811.3842 [hep-ph] .
- Aguilar-Saavedra et al. (2013) Aguilar-Saavedra, J., R. Benbrik, S. Heinemeyer, and M. Perez-Victoria (2013), Phys. Rev. D 88, 094010, arXiv:1306.0572 [hep-ph] .
- Aguilar-Saavedra and Bernabeu (2010) Aguilar-Saavedra, J., and J. Bernabeu (2010), Nucl. Phys. B 840, 349, arXiv:1005.5382 [hep-ph] .
- Aguilar-Saavedra (2009b) Aguilar-Saavedra, J. A. (2009b), JHEP 11, 030, arXiv:0907.3155 [hep-ph] .
- Aguilar-Saavedra and Onofre (2011) Aguilar-Saavedra, J. A., and A. Onofre (2011), Phys. Rev. D 83, 073003, arXiv:1002.4718 [hep-ph] .
- Alekhin et al. (2012) Alekhin, S., J. Blümlein, and S. Moch (2012), Phys. Rev. D 86, 0054009, arXiv:1202.2281 [hep-ph] .
- Alekhin et al. (2014) Alekhin, S., J. Blümlein, and S. Moch (2014), Phys. Rev. D 89, 054028, arXiv:1310.3059 [hep-ph] .
- Alekhin et al. (2016) Alekhin, S., J. Blümlein, S. Moch, and R. Plačakytė (2016), Phys. Rev. D 94 (11), 114038, arXiv:1508.07923 [hep-ph] .
- Alekhin et al. (2017) Alekhin, S., J. Blümlein, S. Moch, and R. Plačakytė (2017), Phys. Rev. D 96 (1), 014011, arXiv:1701.05838 [hep-ph] .
- ALICE Collaboration (2008) ALICE Collaboration, (2008), JINST 3, S08002.
- Aliev et al. (2011) Aliev, M., H. Lacker, U. Langenfeld, S. Moch, P. Uwer, and M. Wiedermann (2011), Comput. Phys. Commun. 182, 1034, arXiv:1007.1327 [hep-ph] .
- Alioli et al. (2009) Alioli, S., P. Nason, C. Oleari, and E. Re (2009), JHEP 09, 111, [Erratum: JHEP02,011(2010)], arXiv:0907.4076 [hep-ph] .
- Alvarez et al. (2018) Alvarez, E., L. Da Rold, M. Estevez, and J. F. Kamenik (2018), Phys. Rev. D97 (3), 033002, arXiv:1709.07887 [hep-ph] .
- Alwall et al. (2014) Alwall, J., R. Frederix, S. Frixione, V. Hirschi, F. Maltoni, O. Mattelaer, H. S. Shao, T. Stelzer, P. Torrielli, and M. Zaro (2014), JHEP 07, 079, arXiv:1405.0301 [hep-ph] .
- Alwall et al. (2007) Alwall, J., et al. (2007), Eur. Phys. J. C 49, 791, arXiv:hep-ph/0607115 .
- Arkani-Hamed et al. (2016) Arkani-Hamed, N., T. Han, M. Mangano, and L.-T. Wang (2016), Phys. Rept. 652, 1, arXiv:1511.06495 [hep-ph] .
- ATLAS and CMS Collaborations (2016) ATLAS and CMS Collaborations, (2016), JHEP 08, 045, arXiv:1606.02266 [hep-ex] .
- ATLAS Collaboration (2008) ATLAS Collaboration, (2008), JINST 3, S08003.
- ATLAS Collaboration (2012a) ATLAS Collaboration, (2012a), Phys. Lett. B 716, 142, arXiv:1205.5764 [hep-ex] .
- ATLAS Collaboration (2012b) ATLAS Collaboration, (2012b), Physics Letters B 717, 330, arXiv:1205.3130 [hep-ex] .
- ATLAS Collaboration (2012c) ATLAS Collaboration, (2012c), Phys. Lett. B 716, 1, arXiv:1207.7214 [hep-ex] .
- ATLAS Collaboration (2012d) ATLAS Collaboration, (2012d), Phys. Lett. B 712, 351, arXiv:1203.0529 [hep-ex] .
- ATLAS Collaboration (2014a) ATLAS Collaboration, (2014a), Phys. Rev. D 90 (11), 112006, arXiv:1406.7844 [hep-ex] .
- ATLAS Collaboration (2014b) ATLAS Collaboration, (2014b), Eur. Phys. J. C 74 (10), 3109, [Addendum: Eur. Phys. J.C76,no.11,642(2016)], arXiv:1406.5375 [hep-ex] .
- ATLAS Collaboration (2014c) ATLAS Collaboration, (2014c), JHEP 06, 124, arXiv:1403.4853 [hep-ex] .
- ATLAS Collaboration (2015a) ATLAS Collaboration, (2015a), Eur. Phys. J. C 75, 330, arXiv:1503.05427 [hep-ex] .
- ATLAS Collaboration (2015b) ATLAS Collaboration, (2015b), Phys. Lett. B 740, 222, arXiv:1409.3122 [hep-ex] .
- ATLAS Collaboration (2015c) ATLAS Collaboration, (2015c), Phys. Lett. B 740, 118, arXiv:1410.0647 [hep-ex] .
- ATLAS Collaboration (2016a) ATLAS Collaboration, (2016a), Phys. Lett. B 756, 228, arXiv:1511.05980 [hep-ex] .
- ATLAS Collaboration (2016b) ATLAS Collaboration, (2016b), JHEP 01, 064, arXiv:1510.03752 [hep-ex] .
- ATLAS Collaboration (2016c) ATLAS Collaboration, (2016c), JINST 11 (04), P04008, arXiv:1512.01094 [hep-ex] .
- ATLAS Collaboration (2016d) ATLAS Collaboration, (2016d), JHEP 04, 023, arXiv:1510.03764 [hep-ex] .
- ATLAS Collaboration (2016e) ATLAS Collaboration, (2016e), Eur. Phys. J. C 76 (2), 55, arXiv:1509.00294 [hep-ex] .
- ATLAS Collaboration (2017a) ATLAS Collaboration, (2017a), JHEP 12, 017, arXiv:1707.05393 [hep-ex] .
- ATLAS Collaboration (2017b) ATLAS Collaboration, (2017b), Eur. Phys. J. C 77 (8), 531, arXiv:1702.02859 [hep-ex] .
- ATLAS Collaboration (2017c) ATLAS Collaboration, (2017c), JHEP 04, 086, arXiv:1609.03920 [hep-ex] .
- ATLAS Collaboration (2017d) ATLAS Collaboration, (2017d), arXiv:1710.03659 [hep-ex] .
- ATLAS Collaboration (2017e) ATLAS Collaboration, (2017e), JHEP 04, 124, arXiv:1702.08309 [hep-ex] .
- ATLAS Collaboration (2018a) ATLAS Collaboration, (2018a), Eur. Phys. J. C78 (3), 186, arXiv:1712.01602 [hep-ex] .
- ATLAS Collaboration (2018b) ATLAS Collaboration, (2018b), JHEP 01, 63, arXiv:1612.07231 [hep-ex] .
- ATLAS Collaborations (2011) ATLAS Collaborations, (2011), Search for -channel Single Top-Quark Production in Collisions at TeV, Tech. Rep. ATLAS-CONF-2011-118 (CERN, Geneva).
- Bach and Ohl (2012) Bach, F., and T. Ohl (2012), Phys. Rev. D 86, 114026, arXiv:1209.4564 [hep-ph] .
- Baer et al. (2013) Baer, H., T. Barklow, K. Fujii, Y. Gao, A. Hoang, S. Kanemura, J. List, H. E. Logan, A. Nomerotski, M. Perelstein, et al. (2013), (ILC-REPORT-2013-040, ANL-HEP-TR-13-20, BNL-100603-2013-IR, IRFU-13-59, CERN-ATS-2013-037, COCKCROFT-13-10, CLNS-13-2085, DESY-13-062, FERMILAB-TM-2554, IHEP-AC-ILC-2013-001, INFN-13-04-LNF, JAI-2013-001, JINR-E9-2013-35, JLAB-R-2013-01, KEK-REPORT-2013-1, KNU-CHEP-ILC-2013-1, LLNL-TR-635539, SLAC-R-1004, ILC-HIGRADE-REPORT-2013-003), arXiv:1306.6352 [hep-ph] .
- Ball et al. (2013) Ball, R. D., V. Bertone, S. Carrazza, C. S. Deans, L. D. Debbio, S. Forte, A. Guffanti, N. P. Hartland, J. I. Latorre, J. Rojo, and M. Ubiali (2013), Nucl. Phys. B 867, 244, arXiv:1207.1303 .
- Ball et al. (2015) Ball, R. D., V. Bertone, S. Carrazza, C. S. Deans, L. Del Debbio, S. Forte, A. Guffanti, N. P. Hartland, J. I. Latorre, J. Rojo, and M. Ubiali (NNPDF Collaboration) (2015), JHEP 04, 040, arXiv:1410.8849 [hep-ph] .
- Barate et al. (2000) Barate, R., et al. (ALEPH Collaboration) (2000), Phys. Lett. B 494, 33.
- Barducci et al. (2018) Barducci, D., et al. (2018), arXiv:1802.07237 [hep-ph] .
- Baskakov et al. (2015) Baskakov, A. V., E. E. Boos, L. V. Dudko, I. P. Lokhtin, and A. M. Snigirev (2015), Phys. Rev. C 92 (4), 044901, arXiv:1502.04875 [hep-ph] .
- Belyaev and Boos (2001) Belyaev, A., and E. Boos (2001), Phys. Rev. D 63, 034012, arXiv:hep-ph/0003260 [hep-ph] .
- Berardi et al. (2004a) Berardi, V., et al. (TOTEM Collaboration) (2004a), TOTEM: Technical design report - Addendum. Total cross section, elastic scattering and diffraction dissociation at the Large Hadron Collider at CERN, Tech. Rep. CERN-LHCC-2004-020.
- Berardi et al. (2004b) Berardi, V., et al. (TOTEM Collaboration) (2004b), TOTEM: Technical design report. Total cross section, elastic scattering and diffraction dissociation at the Large Hadron Collider at CERN, Tech. Rep. CERN-LHCC-2004-002, TOTEM-TDR-001.
- Berger et al. (2016) Berger, E. L., J. Gao, C. P. Yuan, and H. X. Zhu (2016), Phys. Rev. D 94 (7), 071501, arXiv:1606.08463 [hep-ph] .
- Berger et al. (2017) Berger, E. L., J. Gao, and H. X. Zhu (2017), JHEP 11, 158, arXiv:1708.09405 [hep-ph] .
- Bertram et al. (2000) Bertram, I., G. L. Landsberg, J. Linnemann, R. Partridge, M. Paterno, and H. B. Prosper (D0 Collaboration) (2000), A Recipe for the construction of confidence limits, Tech. Rep. FERMILAB-TM-2104, D0-NOTE-3476, D0-NOTE-2775-A.
- Bhat (2011) Bhat, P. C. (2011), Ann. Rev. Nucl. Part. Sci. 61, 281.
- Bicer et al. (2014) Bicer, M., et al. (TLEP Design Study Working Group) (2014), Proceedings, 2013 Community Summer Study on the Future of U.S. Particle Physics: Snowmass on the Mississippi (CSS2013): Minneapolis, MN, USA, July 29-August 6, 2013, JHEP 01, 164, arXiv:1308.6176 [hep-ex] .
- Bigi et al. (1986) Bigi, I. I. Y., Y. L. Dokshitzer, V. A. Khoze, J. H. Kuhn, and P. M. Zerwas (1986), Phys. Lett. B 181, 157.
- Binosi and Theussl (2004) Binosi, D., and L. Theussl (2004), Comput. Phys. Commun. 161, 76, arXiv:hep-ph/0309015 [hep-ph] .
- Binoth et al. (2010) Binoth, T., et al. (SM and NLO Multileg Working Group) (2010), in Physics at TeV colliders. Proceedings, 6th Workshop, dedicated to Thomas Binoth, Les Houches, France, June 8-26, 2009, pp. 21–189, arXiv:1003.1241 [hep-ph] .
- Biswas et al. (2013a) Biswas, S., E. Gabrielli, F. Margaroli, and B. Mele (2013a), JHEP 07, 073, arXiv:1304.1822 [hep-ph] .
- Biswas et al. (2013b) Biswas, S., E. Gabrielli, and B. Mele (2013b), JHEP 01, 088, arXiv:1211.0499 [hep-ph] .
- Bjorken (1978) Bjorken, J. D. (1978), Phys. Rev. D 17, 171.
- Blazey et al. (2000) Blazey, G. C., et al. (2000), in QCD and weak boson physics in Run II. Proceedings, Batavia, USA, March 4-6, June 3-4, November 4-6, 1999, pp. 47–77, arXiv:hep-ex/0005012 [hep-ex] .
- Boos et al. (2004) Boos, E., V. Bunichev, M. Dubinin, L. Dudko, V. Ilyin, A. Kryukov, V. Edneral, V. Savrin, A. Semenov, and A. Sherstnev (2004), Advanced computing and analysis techniques in physics research. Proceedings, 9th International Workshop, ACAT’03, Tsukuba, Japan, December 1-5, 2003, Nucl. Instrum. Meth. A 534, 250, arXiv:hep-ph/0403113 [hep-ph] .
- Boos et al. (2016) Boos, E., V. Bunichev, L. Dudko, and M. Perfilov (2016), Int. J. Mod. Phys. A 32 (02n03), 1750008, arXiv:1607.00505 [hep-ph] .
- Boos and Dudko (2012) Boos, E., and L. Dudko (2012), Int. J. Mod. Phys. A 27, 1230026, arXiv:1211.7146 [hep-ph] .
- Boos et al. (2006) Boos, E. E., V. E. Bunichev, L. V. Dudko, V. I. Savrin, and A. V. Sherstnev (2006), Phys. Atom. Nucl. 69, 1317, [Yad. Fiz.69,1352(2006)].
- Bordes and van Eijk (1993) Bordes, G., and B. van Eijk (1993), Phys. Lett. B 299, 315.
- Botje et al. (2011) Botje, M., et al. (2011), arXiv:1101.0538 [hep-ph] .
- Boudreau et al. (2013) Boudreau, J., C. Escobar, J. Mueller, K. Sapp, and J. Su (2013), arXiv:1304.5639 [hep-ex] .
- Boudreau et al. (2016) Boudreau, J., C. Escobar, J. Mueller, and J. Su (2016), Proceedings, 17th International Workshop on Advanced Computing and Analysis Techniques in Physics Research (ACAT 2016): Valparaiso, Chile, January 18-22, 2016, J. Phys. Conf. Ser. 762 (1), 012041.
- Brandenburg et al. (2002) Brandenburg, A., Z. G. Si, and P. Uwer (2002), Phys. Lett. B 539, 235, arXiv:hep-ph/0205023 [hep-ph] .
- Brucherseifer et al. (2014) Brucherseifer, M., F. Caola, and K. Melnikov (2014), Phys. Lett. B 736, 58, arXiv:1404.7116 [hep-ph] .
- Brun and Rademakers (1997) Brun, R., and F. Rademakers (1997), New computing techniques in physics research V. Proceedings, 5th International Workshop, AIHENP ’96, Lausanne, Switzerland, September 2-6, 1996, Nucl. Instrum. Meth. A 389, 81.
- Cabibbo (1963) Cabibbo, N. (1963), Phys. Rev. Lett. 10, 531.
- Campbell et al. (2013) Campbell, J., R. K. Ellis, and R. Rontsch (2013), Phys.Rev. D 87, 114006, arXiv:1302.3856 [hep-ph] .
- Campbell et al. (2004) Campbell, J. M., R. K. Ellis, and F. Tramontano (2004), Phys. Rev. D 70, 094012, arXiv:hep-ph/0408158 [hep-ph] .
- Campbell et al. (2009) Campbell, J. M., R. Frederix, F. Maltoni, and F. Tramontano (2009), Phys. Rev. Lett. 102, 182003, arXiv:0903.0005 [hep-ph] .
- Campbell and Tramontano (2005) Campbell, J. M., and F. Tramontano (2005), Nucl. Phys. B 726, 109, arXiv:hep-ph/0506289 [hep-ph] .
- Cao et al. (2005a) Cao, Q.-H., R. Schwienhorst, J. A. Benitez, R. Brock, and C. P. Yuan (2005a), Phys. Rev. D 72, 094027, arXiv:hep-ph/0504230 [hep-ph] .
- Cao et al. (2005b) Cao, Q.-H., R. Schwienhorst, and C. P. Yuan (2005b), Phys. Rev. D 71, 054023, arXiv:hep-ph/0409040 [hep-ph] .
- Cao and Yuan (2005) Cao, Q.-H., and C. P. Yuan (2005), Phys. Rev. D 71, 054022, arXiv:hep-ph/0408180 [hep-ph] .
- CDF and D0 Collaborations (2016) CDF and D0 Collaborations, (2016), “Combination of CDF and D0 results on the mass of the top quark using up at the Tevatron,” arXiv:1608.01881 [hep-ex] .
- CDF and D0 Collaborations, Tevatron Electroweak Working Group (2009) CDF and D0 Collaborations, Tevatron Electroweak Working Group, (2009), arXiv:0908.2171 [hep-ex] .
- Chang et al. (2014) Chang, J., K. Cheung, J. S. Lee, and C.-T. Lu (2014), JHEP 05, 062, arXiv:1403.2053 [hep-ph] .
- Charles et al. (2005) Charles, J., A. Höcker, H. Lacker, S. Laplace, F. R. Le Diberder, J. Malcles, J. Ocariz, M. Pivk, and L. Roos (CKMfitter Group) (2005), Eur. Phys. J. C 41 (1), 1, arXiv:hep-ph/0406184 [hep-ph] .
- CMS Collaboration (2007) CMS Collaboration, (2007), J. Phys. G 34 (6), 995.
- CMS Collaboration (2008) CMS Collaboration, (2008), JINST 3, S08004.
- CMS Collaboration (2011) CMS Collaboration, (2011), Phys. Rev. Lett. 107, 091802, arXiv:1106.3052 [hep-ex] .
- CMS Collaboration (2012a) CMS Collaboration, (2012a), JHEP 1212, 035, arXiv:1209.4533 [hep-ex] .
- CMS Collaboration (2012b) CMS Collaboration, (2012b), Phys. Lett. B 716, 30, arXiv:1207.7235 [hep-ex] .
- CMS Collaboration (2013a) CMS Collaboration, (2013a), Phys. Rev. Lett. 110, 022003, arXiv:1209.3489 [hep-ex] .
- CMS Collaboration (2013b) CMS Collaboration, (2013b), JINST 8, P04013, arXiv:1211.4462 [hep-ex] .
- CMS Collaboration (2014a) CMS Collaboration, (2014a), Phys. Lett. B 736, 33, arXiv:1404.2292 [hep-ex] .
- CMS Collaboration (2014b) CMS Collaboration, (2014b), JHEP 06, 090, arXiv:1403.7366 [hep-ex] .
- CMS Collaboration (2014c) CMS Collaboration, (2014c), Phys. Rev. Lett. 112, 231802, arXiv:1401.2942 [hep-ex] .
- CMS Collaboration (2015) CMS Collaboration, (2015), JHEP 01, 053, arXiv:1410.1154 [hep-ex] .
- CMS Collaboration (2016a) CMS Collaboration, (2016a), Phys. Rev. D 93, 072004, arXiv:1509.04044 [hep-ex] .
- CMS Collaboration (2016b) CMS Collaboration, (2016b), JHEP 08, 029, arXiv:1603.02303 [hep-ex] .
- CMS Collaboration (2016c) CMS Collaboration, (2016c), JHEP 04, 073, arXiv:1511.02138 [hep-ex] .
- CMS Collaboration (2016d) CMS Collaboration, (2016d), JHEP 04, 035, arXiv:1511.03951 [hep-ex] .
- CMS Collaboration (2016e) CMS Collaboration, (2016e), JHEP 07, 027, [Erratum: JHEP09,056(2016)], arXiv:1602.03169 [hep-ex] .
- CMS Collaboration (2016f) CMS Collaboration, (2016f), JHEP 09, 027, arXiv:1603.02555 [hep-ex] .
- CMS Collaboration (2016g) CMS Collaboration, (2016g), JHEP 06, 177, arXiv:1509.08159 [hep-ex] .
- CMS Collaboration (2017a) CMS Collaboration, (2017a), Phys. Lett. B 772, 752, arXiv:1610.00678 [hep-ex] .
- CMS Collaboration (2017b) CMS Collaboration, (2017b), arXiv:1711.03143 [hep-ex] .
- CMS Collaboration (2017c) CMS Collaboration, (2017c), Eur. Phys. J. C 77 (5), 354, arXiv:1703.02530 [hep-ex] .
- CMS Collaboration (2017d) CMS Collaboration, (2017d), Phys. Rev. Lett. 119 (24), 242001, arXiv:1709.07411 [nucl-ex] .
- CMS Collaboration (2017e) CMS Collaboration, (2017e), JINST 12, P10003, arXiv:1706.04965 [physics.ins-det] .
- CMS Collaboration (2017f) CMS Collaboration, (2017f), JHEP 02, 028, arXiv:1610.03545 [hep-ex] .
- CMS Collaboration (2017g) CMS Collaboration, (2017g), JHEP 07, 003, arXiv:1702.01404 [hep-ex] .
- CMS Collaboration (2017h) CMS Collaboration, (2017h), JINST 12, P01020, arXiv:1609.02366 [physics.ins-det] .
- CMS Collaboration (2018) CMS Collaboration, (2018), Phys. Lett. B 779, 358, arXiv:1712.02825 [hep-ex] .
- Corcella et al. (2001) Corcella, G., I. G. Knowles, G. Marchesini, S. Moretti, K. Odagiri, P. Richardson, M. H. Seymour, and B. R. Webber (2001), JHEP 01, 010, arXiv:hep-ph/0011363 [hep-ph] .
- Cowan et al. (2011) Cowan, G., K. Cranmer, E. Gross, and O. Vitells (2011), Eur. Phys. J. C71, 1554, [Erratum: Eur. Phys. J.C73,2501(2013)], arXiv:1007.1727 [physics.data-an] .
- Cowan et al. (2015) Cowan, G., C. Germain, I. Guyon, B. Kégl, and D. Rousseau, Eds. (2015), Proceedings of the NIPS 2014 Workshop on High-energy Physics and Machine Learning, Proceedings of Machine Learning Research, Vol. 42 (PMLR, Montreal, Canada).
- Cranmer et al. (2012) Cranmer, K., G. Lewis, L. Moneta, A. Shibata, and W. Verkerke (ROOT Collaboration) (2012), HistFactory: A tool for creating statistical models for use with RooFit and RooStats, Tech. Rep. CERN-OPEN-2012-016.
- Cristinziani and Mulders (2017) Cristinziani, M., and M. Mulders (2017), J. Phys. G 44 (6), 063001, arXiv:1606.00327 [hep-ex] .
- Czakon and Mitov (2014) Czakon, M., and A. Mitov (2014), Comput. Phys. Commun. 185, 2930, arXiv:1112.5675 [hep-ph] .
- Dainese et al. (2017) Dainese, A., et al. (2017), CERN Yellow Report (3), 635, arXiv:1605.01389 [hep-ph] .
- Demartin et al. (2017) Demartin, F., B. Maier, F. Maltoni, K. Mawatari, and M. Zaro (2017), Eur. Phys. J. C 77 (1), 34, arXiv:1607.05862 [hep-ph] .
- d’Enterria (2017) d’Enterria, D. (2017), in 8th International Conference on Hard and Electromagnetic Probes of High-energy Nuclear Collisions: Hard Probes 2016 (HP2016) Wuhan, Hubei, China, September 23-27, 2016, arXiv:1701.08047 [hep-ex] .
- d’Enterria et al. (2015) d’Enterria, D., K. Krajczár, and H. Paukkunen (2015), Phys. Lett. B 746, 64, arXiv:1501.05879 [hep-ph] .
- Dobrescu and Hill (1998) Dobrescu, B. A., and C. T. Hill (1998), Phys. Rev. Lett. 81, 2634, arXiv:hep-ph/9712319 [hep-ph] .
- Dorigo (2015) Dorigo, T. (2015), in Proceedings, 3rd International Conference on New Frontiers in Physics (ICNFP 2014): Kolymbari, Crete, Greece, July 28-August 6, 2014, Vol. 95, p. 02003.
- Drueke et al. (2015) Drueke, E., J. Nutter, R. Schwienhorst, N. Vignaroli, D. G. E. Walker, and J.-H. Yu (2015), Phys. Rev. D 91 (5), 054020, arXiv:1409.7607 [hep-ph] .
- Dulat et al. (2016) Dulat, S., T.-J. Hou, J. Gao, M. Guzzi, J. Huston, P. Nadolsky, J. Pumplin, C. Schmidt, D. Stump, and C. P. Yuan (2016), Phys. Rev. D 93 (3), 033006, arXiv:1506.07443 [hep-ph] .
- Durieux et al. (2015) Durieux, G., F. Maltoni, and C. Zhang (2015), Phys. Rev. D 91 (7), 074017, arXiv:1412.7166 [hep-ph] .
- Ellis and You (2012) Ellis, J., and T. You (2012), JHEP 06, 140, arXiv:1204.0464 [hep-ph] .
- Ellis and You (2013) Ellis, J., and T. You (2013), JHEP 06, 103, arXiv:1303.3879 [hep-ph] .
- Evans and Bryant (2008) Evans, L., and P. Bryant (2008), JINST 3, S08001.
- Farina et al. (2013) Farina, M., C. Grojean, F. Maltoni, E. Salvioni, and A. Thamm (2013), JHEP 05, 022, arXiv:1211.3736 [hep-ph] .
- Feldman and Cousins (1998) Feldman, G. J., and R. D. Cousins (1998), Phys. Rev. D 57, 3873, arXiv:physics/9711021 [physics.data-an] .
- Frederix et al. (2012) Frederix, R., E. Re, and P. Torrielli (2012), JHEP 09, 130, arXiv:1207.5391 [hep-ph] .
- Frixione et al. (2008) Frixione, S., E. Laenen, P. Motylinski, B. R. Webber, and C. D. White (2008), JHEP 07, 029, arXiv:0805.3067 [hep-ph] .
- Frixione et al. (2007) Frixione, S., P. Nason, and C. Oleari (2007), JHEP 11, 070, arXiv:0709.2092 [hep-ph] .
- Frixione and Webber (2002) Frixione, S., and B. R. Webber (2002), JHEP 06, 029, arXiv:hep-ph/0204244 [hep-ph] .
- Gauld (2014) Gauld, R. (2014), JHEP 02, 126, arXiv:1311.1810 [hep-ph] .
- Georgi (1986) Georgi, H. (1986), Phys. Lett. B 169, 231.
- Gerber et al. (2007) Gerber, C. E., et al. (Electroweak Working Group, TeV4LHC-Top) (2007), arXiv:0705.3251 [hep-ph] .
- Giammanco (2016) Giammanco, A. (2016), Rev. Phys. 1, 1, arXiv:1511.06748 [hep-ex] .
- Giardino and Zhang (2017) Giardino, P. P., and C. Zhang (2017), Phys. Rev. D 96 (1), 011901, arXiv:1702.06996 [hep-ph] .
- Giorgi (2016) Giorgi, F. M. (2016), Measurement of the Production Cross-Section of Single Top Quarks in Association with Bosons at ATLAS, Ph.D. thesis (Humboldt-Universität zu Berlin), http://edoc.hu-berlin.de/dissertationen/giorgi-francesco-michelangelo-2016-11-22/PDF/giorgi.pdf.
- Guffanti and Rojo (2010) Guffanti, A., and J. Rojo (2010), Proceedings, 3rd International Workshop on Top Quark Physics (TOP2010), Nuovo Cim. C033 (4), 65, arXiv:1008.4671 [hep-ph] .
- H1 and ZEUS Collaborations (2010) H1 and ZEUS Collaborations, (2010), JHEP 01, 109, arXiv:0911.0884 [hep-ph] .
- Harland-Lang et al. (2015) Harland-Lang, L. A., A. D. Martin, P. Motylinski, and R. S. Thorne (2015), Eur. Phys. J. C 75, 204, arXiv:1412.3989 [hep-ph] .
- Harris et al. (2002) Harris, B. W., E. Laenen, L. Phaf, Z. Sullivan, and S. Weinzierl (2002), Phys. Rev. D 66, 054024, arXiv:hep-ph/0207055 [hep-ph] .
- He et al. (2000) He, H.-J., T. M. P. Tait, and C. P. Yuan (2000), Phys. Rev. D 62, 011702, arXiv:hep-ph/9911266 [hep-ph] .
- Heim et al. (2010) Heim, S., Q.-H. Cao, R. Schwienhorst, and C. P. Yuan (2010), Phys. Rev. D 81, 034005, arXiv:0911.0620 [hep-ph] .
- Heister et al. (2001) Heister, A., et al. (ALEPH Collaboration) (2001), Phys. Lett. B 512, 30, arXiv:hep-ex/0106051 [hep-ex] .
- Hespel et al. (2015) Hespel, B., F. Maltoni, and E. Vryonidou (2015), JHEP 06, 065, arXiv:1503.01656 [hep-ph] .
- Hill (1991) Hill, C. T. (1991), Phys. Lett. B 266, 419.
- Hill (1995) Hill, C. T. (1995), Phys. Lett. B 345, 483, arXiv:hep-ph/9411426 [hep-ph] .
- Holmes (1998) Holmes, S. D. (1998), Tevatron Run II Handbook, Tech. Rep. FERMILAB-TM-2484-1998.
- Husemann (2017) Husemann, U. (2017), Prog. Part. Nucl. Phys. 95, 48, arXiv:1704.01356 [hep-ex] .
- Jaynes (2003) Jaynes, E. T. (2003), Probability theory: The logic of science (Cambridge University Press, Cambridge).
- Jezabek and Kuhn (1994) Jezabek, M., and J. H. Kuhn (1994), Phys. Lett. B 329, 317, arXiv:hep-ph/9403366 [hep-ph] .
- Kagan et al. (2011) Kagan, A. L., J. F. Kamenik, G. Perez, and S. Stone (2011), Phys. Rev. Lett. 107, 082003, arXiv:1103.3747 [hep-ph] .
- Kant et al. (2015) Kant, P., O. M. Kind, T. Kintscher, T. Lohse, T. Martini, S. Moelbitz, P. Rieck, and P. Uwer (2015), Comput. Phys. Commun. 191, 74, arXiv:1406.4403 [hep-ph] .
- Kidonakis (2010a) Kidonakis, N. (2010a), Phys. Rev. D 81, 054028, arXiv:1001.5034 [hep-ph] .
- Kidonakis (2010b) Kidonakis, N. (2010b), Phys. Rev. D 82, 054018, arXiv:1005.4451 [hep-ph] .
- Kidonakis (2011) Kidonakis, N. (2011), Phys. Rev. D 83, 091503, arXiv:1103.2792 [hep-ph] .
- Kidonakis (2014) Kidonakis, N. (2014), in Proceedings, Helmholtz International Summer School on Physics of Heavy Quarks and Hadrons (HQ 2013), pp. 139–168, arXiv:1311.0283 [hep-ph] .
- Kidonakis (2016) Kidonakis, N. (2016), Phys. Rev. D 93 (5), 054022, arXiv:1510.06361 [hep-ph] .
- Kidonakis (2017a) Kidonakis, N. (2017a), Proceedings, 13th International Conference on Heavy Quarks and Leptons (HQL 2016): Blacksburg, Virginia, USA, May 22-27, 2016, PoS HQL2016, 041, arXiv:1607.08892 [hep-ph] .
- Kidonakis (2017b) Kidonakis, N. (2017b), Phys. Rev. D 96 (3), 034014, arXiv:1612.06426 [hep-ph] .
- Kobayashi and Maskawa (1973) Kobayashi, M., and T. Maskawa (1973), Prog. Theor. Phys. 49, 652.
- Kondo (1988) Kondo, K. (1988), J. Phys. Soc. Jap. 57, 4126.
- Kondo (1991) Kondo, K. (1991), J. Phys. Soc. Jap. 60, 836.
- Lacker et al. (2012) Lacker, H., A. Menzel, F. Spettel, D. Hirschbuhl, J. Luck, et al. (2012), Eur. Phys. J. C 72, 2048, arXiv:1202.4694 [hep-ph] .
- Lai et al. (2010) Lai, H.-L., M. Guzzi, J. Huston, Z. Li, P. M. Nadolsky, J. Pumplin, , and C.-P. Yuan (2010), Phys. Rev. D 82, 074024, arXiv:1007.2241 [hep-ph] .
- Lebedev and Shiltsev (2014) Lebedev, V., and V. Shiltsev, Eds. (2014), Accelerator physics at the Tevatron Collider, Particle Acceleration and Detection (Springer).
- Lenz (2013) Lenz, A. (2013), Adv. High Energy Phys. 2013, 910275.
- LHCb Collaboration (2008) LHCb Collaboration, (2008), JINST 3, S08005.
- LHCb Collaboration (2015) LHCb Collaboration, (2015), Phys. Rev. Lett. 115 (11), 112001, arXiv:1506.00903 [hep-ex] .
- LHCb Collaboration (2017) LHCb Collaboration, (2017), Phys. Lett. B 767, 110, arXiv:1610.08142 [hep-ex] .
- Liu et al. (2015) Liu, W., H. Sun, X. Wang, and X. Luo (2015), Phys. Rev. D 92 (7), 074015, arXiv:1507.03264 [hep-ph] .
- Mahlon and Parke (2000) Mahlon, G., and S. J. Parke (2000), Phys. Lett. B 476, 323, arXiv:hep-ph/9912458 [hep-ph] .
- Martin et al. (2009) Martin, A. D., W. J. Stirling, R. S. Thorne, and G. Watt (2009), Eur. Phys. J. C 64, 653, arXiv:0905.3531 [hep-ph] .
- Martin and Watt (2009) Martin, W. J., A. D Stirling, and G. Watt (2009), Eur. Phys. J. C 63, 189, arXiv:0901.0002 [hep-ph] .
- Martini and Uwer (2015) Martini, T., and P. Uwer (2015), JHEP 09, 083, arXiv:1506.08798 [hep-ph] .
- Martini and Uwer (2017a) Martini, T., and P. Uwer (2017a), in 25th International Workshop on Deep Inelastic Scattering and Related Topics (DIS 2017) Birmingham, UK, April 3-7, 2017, arXiv:1709.04656 [hep-ph] .
- Martini and Uwer (2017b) Martini, T., and P. Uwer (2017b), arXiv:1712.04527 [hep-ph] .
- Nutter et al. (2012) Nutter, J., R. Schwienhorst, D. G. E. Walker, and J.-H. Yu (2012), Phys. Rev. D 86, 094006, arXiv:1207.5179 [hep-ph] .
- Okada and Panizzi (2013) Okada, Y., and L. Panizzi (2013), Adv. High Energy Phys. 2013, 364936, arXiv:1207.5607 [hep-ph] .
- Patrignani et al. (2016) Patrignani, C., et al. (Particle Data Group) (2016), Chin. Phys. C 40, 100001.
- Penunuri et al. (2011) Penunuri, F., F. Larios, and A. O. Bouzas (2011), Phys. Rev. D 83, 077501, arXiv:1102.1417 [hep-ph] .
- Pinfold et al. (2009) Pinfold, J., et al. (MoEDAL Collaboration) (2009), Technical Design Report of the MoEDAL Experiment, Tech. Rep. CERN-LHCC-2009-006, MoEDAL-TDR-001.
- Re (2011) Re, E. (2011), Eur. Phys. J. C 71, 1547, arXiv:1009.2450 [hep-ph] .
- Salam and Soyez (2007) Salam, G. P., and G. Soyez (2007), JHEP 0705, 086, arXiv:0704.0292 [hep-ph] .
- Schoenrock et al. (2013) Schoenrock, B., E. Drueke, B. Alvarez Gonzalez, and R. Schwienhorst (2013), in Proceedings, 2013 Community Summer Study on the Future of U.S. Particle Physics: Snowmass on the Mississippi (CSS2013): Minneapolis, MN, USA, July 29-August 6, 2013, arXiv:1308.6307 [hep-ex] .
- Schuh (2016) Schuh, M. (2016), Determination of the top-quark pole mass using single top-quark production cross-sections, Master’s thesis (Wuppertal U.).
- Schwienhorst et al. (2011) Schwienhorst, R., C. P. Yuan, C. Mueller, and Q.-H. Cao (2011), Phys. Rev. D 83, 034019, arXiv:1012.5132 [hep-ph] .
- Sirunyan et al. (2018) Sirunyan, A. M., et al. (CMS) (2018), arXiv:1805.07399 [hep-ex] .
- Sjöstrand et al. (2006) Sjöstrand, T., S. Mrenna, and P. Z. Skands (2006), JHEP 05, 026, arXiv:hep-ph/0603175 [hep-ph] .
- Swain and Taylor (1998) Swain, J., and L. Taylor (1998), Phys. Rev. D 58, 093006, arXiv:hep-ph/9712420 [hep-ph] .
- Tait and Yuan (2000) Tait, T. M. P., and C. P. Yuan (2000), Phys. Rev. D 63, 014018, arXiv:hep-ph/0007298 .
- The LHC Top Working Group (2017) The LHC Top Working Group, (2017), “https://twiki.cern.ch/twiki/bin/view/LHCPhysics/LHCTopWG,” .
- Verkerke and Kirkby (2003) Verkerke, W., and D. P. Kirkby (2003), Statistical Problems in Particle Physics, Astrophysics and Cosmology (PHYSTAT 05): Proceedings, Oxford, UK, September 12-15, 2005, eConf C0303241, MOLT007, [,186(2003)], arXiv:physics/0306116 [physics] .
- Weinberg (1967) Weinberg, S. (1967), Phys. Rev. Lett. 19, 1264.
- White et al. (2009) White, C. D., S. Frixione, E. Laenen, and F. Maltoni (2009), JHEP 11, 074, arXiv:0908.0631 [hep-ph] .
- Willenbrock and Dicus (1986) Willenbrock, S., and D. A. Dicus (1986), Phys. Rev. D 34, 155.
- Wilson (1977) Wilson, R. R. (1977), Phys. Today 30N10, 23.
- Zhang and Willenbrock (2011) Zhang, C., and S. Willenbrock (2011), Phys. Rev. D 83, 034006, arXiv:1008.3869 [hep-ph] .
- Zhu (2002) Zhu, S. (2002), Phys. Lett. B 524, 283, [Erratum: Phys. Lett.B537,351(2002)], arXiv:hep-ph/0109269 [hep-ph] .