Parallaxes of Cool Objects with WISE: Filling in for Gaia
Abstract
This paper uses the multi-epoch astrometry from the Wide-field Infrared Survey Explorer (WISE) to demonstrate a method to measure proper motions and trigonometric parallaxes with precisions of 4 mas yr-1 and 7 mas, respectively, for low-mass stars and brown dwarfs. This method relies on WISE single exposures (Level 1b frames) and a Markov Chain Monte Carlo method. The limitations of Gaia in observing very low-mass stars and brown dwarfs are discussed, and it is shown that WISE will be able to measure astrometry past the 95% completeness limit and magnitude limit of Gaia (L, T, and Y dwarfs fainter than and , respectively). This method is applied to WISE data of 20 nearby ( pc) dwarfs with spectral types between M6–Y2 and previously measured trigonometric parallaxes. Also provided are WISE astrometric measurements for 23 additional low-mass dwarfs with spectral types between M6–T7 and estimated photometric distances pc. Only nine of these objects contain parallaxes within Gaia Data Release 2.
1 Introduction
With the recent release of proper motions and trigonometric parallax measurements for over a billion sources from the Gaia satellite (Arenou et al., 2018; Gaia Collaboration et al., 2018; Lindegren et al., 2018; Luri et al., 2018), it is important to understand what objects are not included in the recent catalog, and what objects will be missing from the final catalog. Theissen et al. (2017) investigated the Gaia shortfall and found that Gaia will be limited in its ability to observe ultracool dwarfs (spectral-types later than mid-L) at distances pc due to its relatively blue bandpass.
A number of projects are aimed at measuring trigonometric parallaxes of these ultracool dwarfs (e.g., Dupuy & Liu, 2012; Beichman et al., 2013; Faherty et al., 2012; Kirkpatrick et al., 2014; Dupuy et al., 2016; Skinner et al., 2016; Smart et al., 2017b; Weinberger et al., 2016). These projects typically rely on either: 1) numerous epochs of ground-based and space-based observations, using facilities such as the Spitzer Space Telescope (Werner et al., 2004); or 2) survey data spanning multiple epochs, such as the Digitized Sky Survey (DSS), the Wide-field Infrared Survey Explorer (WISE; Wright et al., 2010), or the Two Micron All-Sky Survey (2MASS; Skrutskie et al., 2006). In this paper, I present a method to measure proper motions and trigonometric parallaxes of nearby (17 pc), ultracool objects using publicly available WISE data.
In Section 3, the properties and limitations of Gaia and WISE are discussed. The method for measuring proper motions and parallaxes is described in Section 4. Comparisons between this method and previous literature measurements for 20 nearby, low-mass dwarfs are provided in Section 5. In Section 6, I also provide new measurements for 23 nearby, low-mass dwarfs, nine of which are contained within Gaia Data Release 2. Lastly, I discuss the utility of this method for the immediate future in Section 7.
2 \textWISE Multi-epoch Data
The all-sky observations made by WISE are ideal for astrometric studies because they span multiple epochs, most separated by 6 months, with the survey strategy of observing fields close to 90∘ Solar elongation; this places observed objects close to their maximum parallax factors (Kirkpatrick et al., 2014). The original WISE mission surveyed the entire sky in four bands: 3.4, 4.6, 12, and 22 m (hereafter , , , and ). The original mission lasted from December 2009 to August 2010, after which the cryogen was depleted, and WISE observed in , , and until September (3-band survey; 30% of the sky111http://wise2.ipac.caltech.edu/docs/release/3band/).
WISE continued to observe in and as part of the Near-Earth Object Wide-field Infrared Survey Explorer (NEOWISE; Mainzer et al., 2011) mission until February 2011, when it was put into hibernation upon completion of its mission. In December 2013, WISE was reactivated to “continue rapidly surveying and obtaining measurements of minor planet physical properties” (Mainzer et al., 2014). This mission, dubbed the NEOWISE-Reactivation (NEOWISE-R; Mainzer et al., 2014) mission, continued surveying the entire sky in and . The NEOWISE-R mission is currently ongoing. The combined WISE dataset contains epochs for every source, with a cadence of 6 months and a time baseline of 7 years, with approximately 2.5 years of deactivation in-between. Each single epoch has 12–13 7.7 second exposures in both and 222http://wise2.ipac.caltech.edu/docs/release/allsky/, and possibly additional exposures dependent on depth-of-coverage for a given line-of-sight.
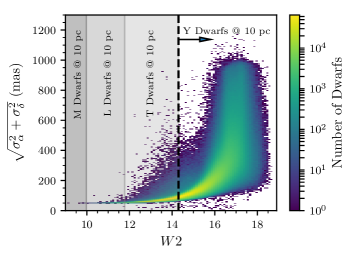
Figure 1 shows the total WISE positional uncertainty for a single frame (i.e., ) as a function of magnitude using the Motion Verified Red Stars catalog catalog (MoVeRS; Theissen et al., 2016). The -absolute magnitude ranges (gray shaded regions) for M, L, T, and Y dwarfs at a distance of 10 pc are shown using the spectral-type–absolute magnitude relationships from Filippazzo et al. (2015) and Tinney et al. (2014). The positional uncertainty can be reduced within the relative WISE frame-of-reference by , where is the number of frames an object was observed in. For the typical value of , this can reduce positional uncertainties to mas for M, L, and early T dwarfs. Fainter sources such as late T dwarfs will have relative positional uncertainties of mas, and extremely faint Y dwarfs with single-band detections will typically have relative uncertainties of mas.
Many studies have computed parallaxes using WISE data—combined with either higher-positional precision observations (e.g., Spitzer, Keck), and/or data providing a longer time baseline (e.g., DSS, 2MASS)—for nearby objects (e.g., Beichman et al., 2013; Luhman, 2013; Kirkpatrick et al., 2014; Scholz, 2014). However, the numerous epochs of current WISE data now allow relatively precise ( mas) parallax measurements to be made without the need for further data.
3 Gaia Limitations for Observing Ultracool Dwarfs
Gaia is currently conducting the largest astrometric mission to date, with an expected yield of over 1.3 billion sources with measured proper motions and precise trigonometric parallaxes (0.1 mas for sources with and 0.7 mas for sources with ; Luri et al., 2018). Theissen et al. (2017) quantified the shortfall of ultracool objects within Gaia Data Release 1 (DR1; Gaia Collaboration et al., 2016a, b), using matches between the Late-Type Extension to the Motion Verified Red Stars catalog (LaTE-MoVeRS) and the full Gaia DR1 (catalog of positions and magnitudes, but not necessarily parallaxes). They found that Gaia is limited in its ability to observe spectral types later than L5 farther than 10 pc.
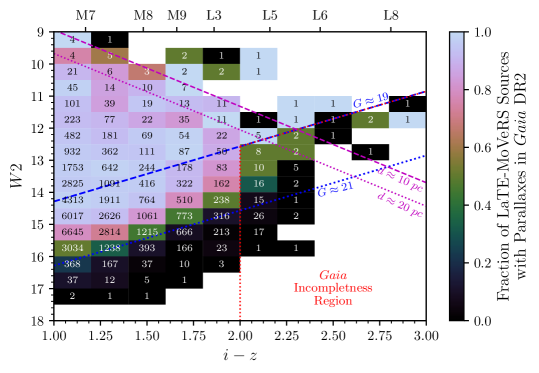
The Gaia shortfall was reevaluated here using the LaTE-MoVeRS sample, by comparing the fraction of LaTE-MoVeRS sources with a counterpart found within 6″ in Gaia Data Release 2 (DR2; Gaia Collaboration et al., 2018; Luri et al., 2018). Figure 2 shows the fraction of matched sources with significant parallaxes () as a function of magnitude and Sloan Digital Sky Survey (SDSS; York et al., 2000) color. To put this in a Gaia context, the matched sample between Gaia DR2 and LaTE-MoVeRS was used to compute first order linear transformations between and magnitudes as a function of color, shown in Figure 2 (blue lines), and given by the equation,
| (1) |
The fraction of matched sources between LaTE-MoVeRS and Gaia DR2 typically drops below 50% for objects with and (–12.5), which corresponds to the Gaia DR2 95% completeness limit for sources with 5-parameter astrometric solutions (see Arenou et al. 2018 Figure A.1). The Gaia limiting magnitude for sources with computed 5-parameter astrometric solutions () is also shown in Figure 2. The linear fit to is a good approximation for the observed dropout of fainter sources without Gaia parallaxes. Approximate distances for late-type dwarfs as a function of and are also shown in Figure 2 (magenta lines) using the photometric distance relationships from Schmidt et al. (2018, in preparation). Future Gaia data releases may have measurements for ultracool dwarfs within 10 pc and with , but much of the Gaia incompleteness region will be lacking sources due to the Gaia 95% completeness limit and magnitude limit.
4 Parallaxes using \textWISE Multi-epoch Data
4.1 Single Epoch Position Measurements
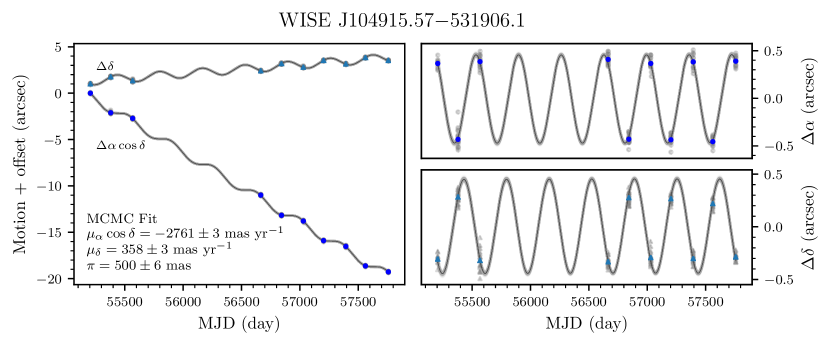
An illustration of the parallax method described here is shown in Figure 3 for 2MASS J025503574700509, a nearby (5 pc) L8 dwarf (Martín et al., 1999; Patten et al., 2006; Kirkpatrick et al., 2008; Faherty et al., 2012). First, all Level 1b (L1b) source catalogs (i.e., All-Sky, 3-band, NEOWISE Post-Cryo, and NEOWISE-R) are queried for objects within 30″ of the expected position of 2MASS J025503574700509. The L1b source catalogs contain sources extracted from each single exposure333http://wise2.ipac.caltech.edu/docs/release/allsky/expsup/sec4_1.html. Sources were grouped by epoch, demarcated by 6 month periods starting 91 days after the mean modified Julian date (MJD) of the first epoch (shown as dotted lines in the top and middle panels of Figure 3). The WISE pipeline already accounts for registering dithers by obtaining a global astrometric solution to each frame using 2MASS positions444http://wise2.ipac.caltech.edu/docs/release/prelim/expsup/sec4_3d.html.
A registration method similar to Dupuy & Liu (2012) was investigated for residual frame-to-frame offsets that were not removed during the dither registration method already implemented within the WISE pipeline. First, a list of potential reference objects was created from the AllWISE catalog (Cutri & et al., 2013), selecting all sources within a 10′ radius of the target object (WISE field-of-view ; Wright et al., 2010). Reference objects were then selected by requiring the following:
-
1.
Each object has no saturated pixels in and (w1sat & w2sat );
-
2.
Each object is free from contamination and confusion flags (cc_flag );
-
3.
Each object does not have an extended object flag (ext_flag ); and
-
4.
Each object is within the magnitude limit .
These criteria ensured unsaturated sources with pristine astrometry within WISE. A minimum of 40 reference sources within each frame was required, and the search radius was incrementally increased by 1′ until enough reference sources were detected.
Using the final list of reference objects, sources were then extracted from each L1b frame, and positional offsets ( and ) were computed for each object between the first frame and each subsequent frame within the given epoch. The residual and between the first frame and each subsequent frame ( and ) were then binned in a 2-dimensional histogram, starting with an arbitrarily large bin size and iteratively decreasing the bin size until of the sources were contained within a single bin (typical bin size mas 100 mas). The median and offsets were then taken from the peak bin, which should contain the actual offsets between two frames. These shifts were typically very small ( mas), and did not have a significant effect on the final computed position and uncertainty. Therefore, this correction was not applied for the remainder of this study.
To obtain the true relative position within the WISE frame of reference, the uncertainty weighted average position for each epoch was computed using the WISE reported position values (, , , and ), using a 3 clip to remove outliers. This method gives a statistical measure of the true position within the relative WISE frame of reference, and is based on the fact that each frame is independently calibrated using the exact same method (i.e., the WISE processing pipeline). Each epoch typically spans a period of 1–10 days. The true observational epoch time is selected to be the average MJD for each epoch.
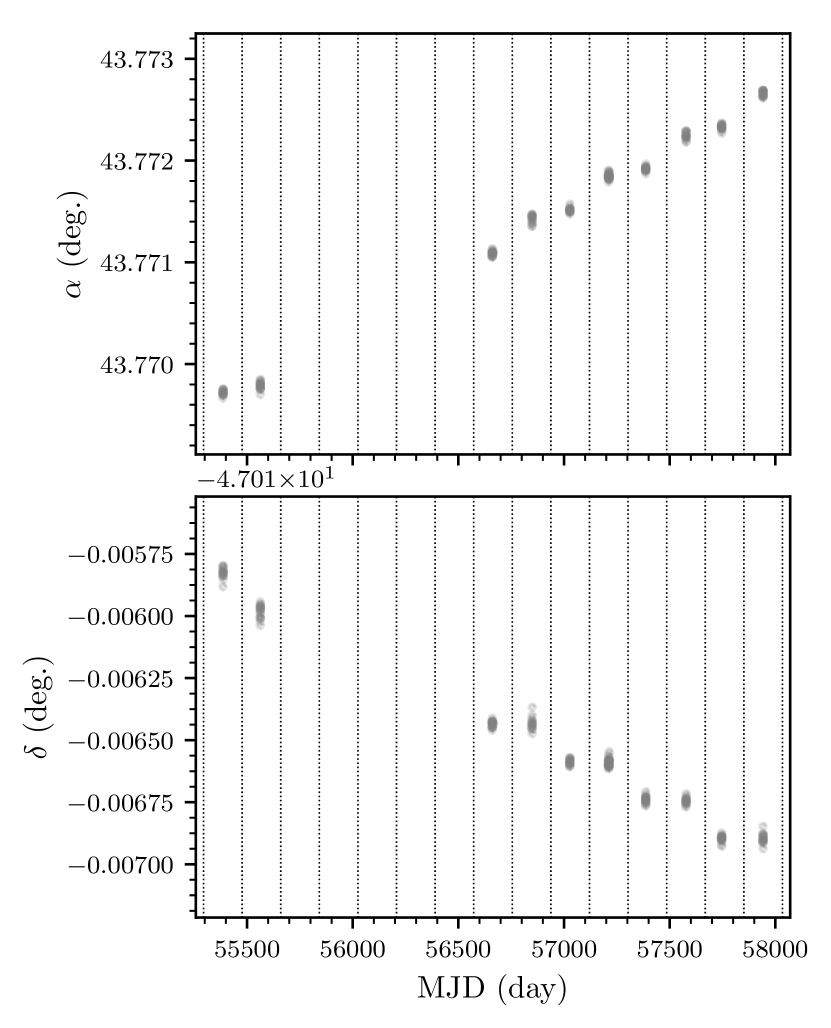
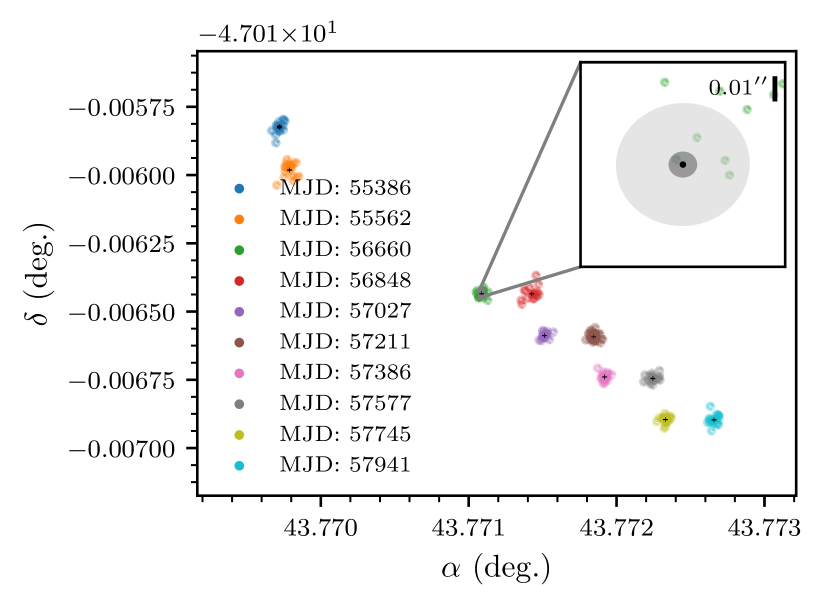
Uncertainties ( and ) were computed using the weighted positional uncertainty per epoch, as illustrated in the inset figure of the bottom panel of Figure 3 and given by,
| (2) |
where is the number of frames within the given epoch. This method reduces the relative astrometric uncertainty by a factor of where is the number of frames a source was observed in during a given epoch.
4.2 Registering Astrometry between Epochs
To obtain a relative astrometric solution, each epoch must be registered using sources common to all epochs that exhibit little to no proper motion. In principle, this step is already done through the WISE processing pipeline, similar to registration within a given epoch (i.e., dither registration). However, there is an observed dipole residual in the astrometry between forward and backward pointing frames taken with WISE (Meisner et al., 2017a). This astrometric shift between 6 month periods can be as large as 600 mas along a given line-of-sight, inducing a potential parallax signature in objects with no measurable parallax (Meisner et al., 2017a). Meisner et al. (2017a) posit this astrometric shift is due to an asymmetry in the WISE point-spread function (PSF) models with respect to scan direction. This astrometric shift can be accounted for by registering epochs using a common set of reference objects across all epochs for a given line-of-sight.
To correct for this systematic effect, again, a procedure similar to the one outlined in Dupuy & Liu (2012) was used. This method follows the same procedure discussed in Section 4.1. First, a list of potential reference objects was created from the AllWISE catalog using the same selection criteria as Section 4.1. Using the final list of reference objects, sources were then extracted from each L1b frame, similar to the target object, and uncertainty weighted positions were computed for each object within each epoch. Only sources found within 50% of the epochs were kept. Then, the positional shifts between the first epoch and each subsequent epoch were computed. Sources with large proper motions ( mas yr-1) were masked where proper motion information was available or where a proper motion was measured.
The residual and between two epochs ( and ) were then binned in a 2-dimensional histogram, starting with an arbitrarily large bin size and iteratively decreasing the bin size until of the sources were contained within a single bin (typical bin size mas 100 mas). The median and offsets were then taken from the peak bin, which should contain the true offsets between epochs. Offsets from the first epoch were then applied to each subsequent epoch of the target object’s uncertainty weighted position.
4.2.1 Testing the Efficacy of the Epoch Registration
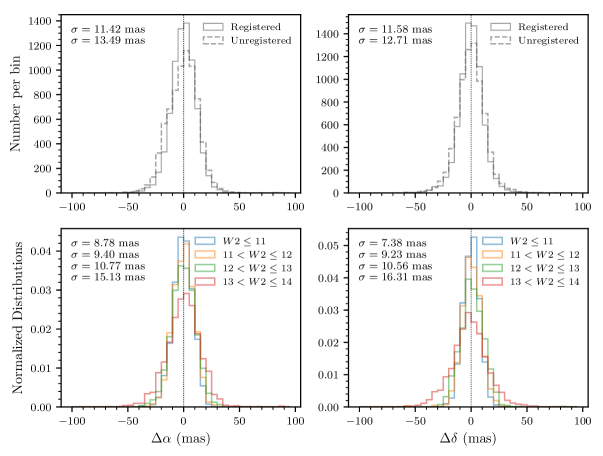
To test the efficacy of the above registration procedure in reducing positional scatter, the above registration procedure was applied to the SDSS Data Release 14 Spectroscopic Quasar Catalog555http://www.sdss.org/dr14/data_access/value-added-catalogs/?vac_id=the-sloan-digital-sky-survey-quasar-catalog-fourteenth-data-release. This catalog contains 526,356 quasars confirmed based on their optical spectroscopy. These sources should exhibit no proper motion, and offer an unbiased sample—distributed approximately uniformly across one-third of the sky—on which to test the registration procedure from Section 4.2.
Only QSOs with (50,834 QSOs; 36 with ) were selected to coincide with the magnitude range of objects in this study. One thousand QSOs were randomly sampled within the aforementioned magnitude range, with QSOs selected in roughly equal numbers between the limits of , , , and . The uncertainty weighted position for each epoch was computed, epochs were then registered, and then shifts between the first epoch and each subsequent epoch were computed. Figure 4 (top) shows the distribution of shifts for both registered and unregistered epochs in both and , weighted by the number of epochs available. The scatter relative to the position of the first epoch is reduced using the registration method from Section 4.2. Figure 4 (bottom) shows registered sources separated into magnitude bins, showing increasing positional uncertainty with decreasing source brightness. A similar trend was not observed with or position, suggesting astrometric precision is primarily a function of source magnitude rather than on-sky position. Typical precision using this registration method is 12 mas, or 1/200 of a WISE L1b pixel. These values will be revisited in terms of positional precision in Section 5.
4.3 Astrometric Solutions
Using the registered positions and uncertainties, the astrometric solution was computed using the following equations,
| (3) |
| (4) |
where the subscript 0 denotes the first epoch, and the subscript denotes each subsequent epoch. and represent the mean positions in and , respectively. represents the parallax factors (van Dekamp, 1967) given by (Green, 1985),
| (5) |
| (6) |
where , and are the components of the barycentric position vector of the Earth obtained from the JPL DE430 solar system ephemeris. These equations were solved using a Markov Chain Monte Carlo (MCMC) routine built on the emcee code (Foreman-Mackey et al., 2013), assuming normally distributed parameters and uniform priors. The parameter space was sampled using 200 walkers, with each walker taking 200 steps. Convergence typically occurred after 50–75 steps, and the first 50% of chains were discarded as burn in. The posterior distributions were observed to be normally distributed, and reported values throughout this study represent the median values of the posterior distributions and the largest deviation between the median values and the 16th and 84th percentile values (corresponding to the 68%—or 1—values).
The above steps provide astrometric solutions relative to the WISE reference frame. To convert parallax values from relative to absolute, the finite motions of the calibration sources must be known to shift to an absolute reference frame. The absolute astrometric shifts of the calibration sources were estimated using the Besançon model (Robin et al., 2003; Czekaj et al., 2014), using the Spitzer Infrared Array Camera (IRAC; Fazio et al., 2004) 3.4 m band as a proxy for . Applying the magnitude cuts and search radii from Section 4.2 to select calibration stars, the average parallax of the calibration sources was found to be 1 mas, with 90% of calibration sources having parallaxes 1 mas. These shifts are typically much smaller than the average parallax error, and are therefore negligible.
5 Comparison to Literature Astrometric Measurements
The MCMC routine described in the previous section was applied to 20 known, nearby, low-mass objects with generally well-determined parallaxes (15% uncertainty). Sources were chosen to cover a range of spectral types, distances, and magnitudes. Table 1 reports the values from the MCMC posterior distributions. The computed positional uncertainty listed in Table 1 is typically larger than the relative positional scatter of QSOs with similar magnitudes (see Figure 4). Adding the positional QSO scatter (from Figure 4) in quadrature with the computed positional uncertainties does not change results significantly, indicating that further corrections or larger positional uncertainties are not warranted.
| Parallax | Baseline | ||||||
|---|---|---|---|---|---|---|---|
| Source | (deg) | (deg) | (mas) | (mas yr-1) | (mas yr-1) | (mas) | (yr) |
| WISE J104915.57531906.1 (Luhman 16AB); L7.5+T0.5 (Burgasser et al., 2013); | |||||||
| WISE | 8 | 7 | |||||
| Luhman (2013) | … | … | 60–400 | 33 | |||
| Bedin et al. (2017) | … | … | 0.3 | 3 | |||
| 2MASS J104814633956062 (DENIS J104803956); M9 (Faherty et al., 2009); | |||||||
| WISE | 8 | 7 | |||||
| Lurie et al. (2014) | … | … | 2.1–3.5 | 12 | |||
| Weinberger et al. (2016) | … | … | 0.43 | 7.9 | |||
| Gaia DR2 | … | … | 0.01 | 1.75 | |||
| 2MASS J001131825908400; M6.5 (Lépine et al., 2009); | |||||||
| WISE | 8 | 7 | |||||
| Lépine et al. (2009) | … | … | 6 | aaNo uncertainties reported. | aaNo uncertainties reported. | 3 | |
| Dittmann et al. (2014) | … | … | 5 | aaNo uncertainties reported. | aaNo uncertainties reported. | 4 | |
| Gaia DR2 | … | … | 0.01 | 1.75 | |||
| 2MASS J024614770459182 (LHS 0017); M6 (Reid et al., 1995); | |||||||
| WISE | 10 | 7 | |||||
| Weinberger et al. (2016) | … | … | 0.43 | 6.2 | |||
| Gaia DR2 | … | … | 0.01 | 1.75 | |||
| 2MASS J230629280502285 (TRAPPIST-1); M8 (Cruz et al., 2003); | |||||||
| WISE | 10 | 7 | |||||
| Costa et al. (2006) | … | … | 3–5 | 3.3 | |||
| Gaia DR2 | … | … | 0.01 | 1.75 | |||
| 2MASS J025503574700509; L8 (Kirkpatrick et al., 2008); | |||||||
| WISE | 9 | 7 | |||||
| Costa et al. (2006) | … | … | 13 | 2–4 | |||
| Weinberger et al. (2016) | … | … | 0.43 | 5.1 | |||
| Gaia DR2 | … | … | 0.01 | 1.75 | |||
| 2MASS J083541930819227; L5 (Faherty et al., 2009); | |||||||
| WISE | 10 | 7 | |||||
| Andrei et al. (2011) | … | … | 6 | 1.96 | |||
| Weinberger et al. (2016) | … | … | 0.43 | 6.2 | |||
| Gaia DR2 | … | … | 0.01 | 1.75 | |||
| 2MASS J081730016155158; T6 (Artigau et al., 2010); | |||||||
| WISE | 11 | 7 | |||||
| Artigau et al. (2010) | … | … | 20–300 | 14 | |||
| Gaia DR2 | … | … | 0.01 | 1.75 | |||
| WISEP J150649.97702736.0; T6 (Mace et al., 2013); ) | |||||||
| WISE | 12 | 7 | |||||
| Marsh et al. (2013) | … | … | 60–300 | bbKirkpatrick et al. (2012) quote a value of mas and cite the measurement to a pre-published version of Marsh et al. (2013). | 2.5 | ||
| Gaia DR2 | … | … | 0.01 | 1.75 | |||
| 2MASS J044553873048204; L2 (Cruz et al., 2003); | |||||||
| WISE | 12 | 7 | |||||
| Faherty et al. (2012) | … | … | 3 | 3 | |||
| Gaia DR2 | … | … | 0.01 | 1.75 | |||
| 2MASS J093935482448279; T8 (Burgasser et al., 2006); | |||||||
| WISE | 29 | 7 | |||||
| Faherty et al. (2012) | … | … | 3 | 2.5 | |||
| 2MASS J043901012353083; L6.5 (Cruz et al., 2003); | |||||||
| WISE | 14 | 7 | |||||
| Faherty et al. (2012) | … | … | 3 | 3 | |||
| Gaia DR2 | … | … | 0.01 | 1.75 | |||
| 2MASS J232246843133231; L0 (Reid et al., 2008; Faherty et al., 2012); | |||||||
| WISE | 15 | 7 | |||||
| Faherty et al. (2012) | … | … | 3 | 1.5 | |||
| Gaia DR2 | … | … | 0.01 | 1.75 | |||
| UGPS J072227.51054031.2; T9 (Cushing et al., 2011); | |||||||
| WISE | 40 | 7 | |||||
| Leggett et al. (2012) | … | … | 6.2 | 5 | |||
| WISEA J025409.55022358.5; T8 (Kirkpatrick et al., 2011); | |||||||
| WISE | 66 | 7 | |||||
| Dupuy & Kraus (2013) | … | … | 30 | 2 | |||
| 2MASS J072900023954043; T8 (Looper et al., 2007); | |||||||
| WISE | 48 | 7 | |||||
| Faherty et al. (2012) | … | … | 3 | 3.7 | |||
| 2MASS J222828894310262; T6 (Burgasser et al., 2006); | |||||||
| WISE | 73 | 7 | |||||
| Faherty et al. (2012) | … | … | 3 | 1.5 | |||
| WISE J085510.83071442.5; Y2 (Tinney et al., 2014); (Wright et al., 2014) | |||||||
| WISEccMeasurements made using only NEOWISE(-R) data. | 140 | 3.5 | |||||
| Wright et al. (2014) | … | … | 40–500 | 4 | |||
| WISEP J041022.71150248.5; Y0 (Mace et al., 2013); | |||||||
| WISE | 196 | 7 | |||||
| Marsh et al. (2013) | … | … | 50–200 | ddKirkpatrick et al. (2012) quote a value of mas and cite the measurement to a pre-published version of Marsh et al. (2013). | 2.5 | ||
| WISEPA J182831.08265037.8; Y2 (Kirkpatrick et al., 2012); | |||||||
| WISE | 159 | 7 | |||||
| Beichman et al. (2013) | … | … | 50 | 2.5 | |||
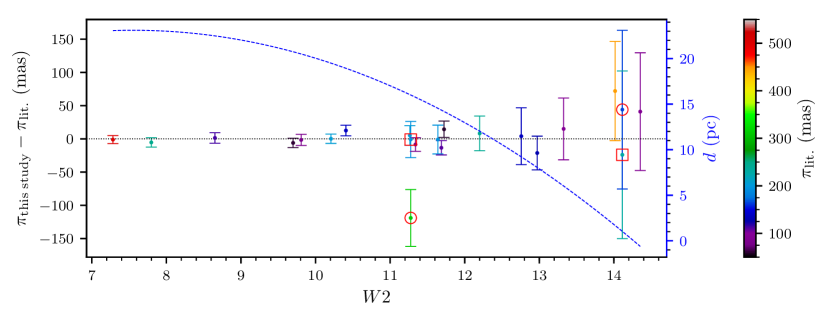
For all of the comparisons in Table 1, the computed WISE parallax values from this study are within the 2 combined uncertainty of the highest precision literature value (18 of 20 within 1), excluding the Gaia DR2666Gaia DR2 was released while this manuscript was under review measurements. The full astrometric solutions are shown in Figure Set 5. Figure 6 shows the residuals between the parallax value derived using WISE and the highest precision literature parallax, as a function of magnitude. The astrometric precision severely deteriorates for sources fainter than , setting the approximate limit for where this method is valid.
Fig. Set5. WISE Astrometric Solutions for Literature Sources
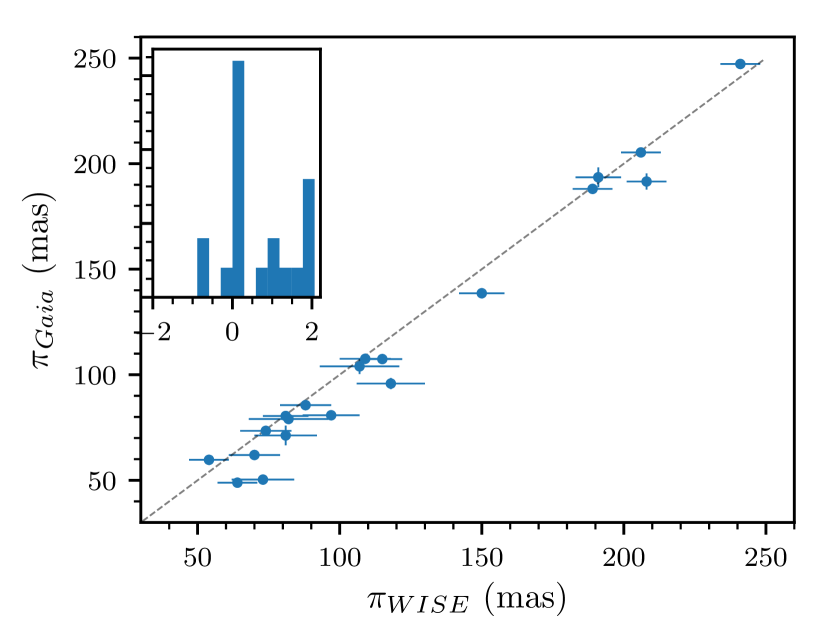
With the recent release of Gaia DR2, it is essential to compare results obtained here with results from DR2. Of the 20 objects in Table 1, 11 have cross-matches within Gaia DR2, and measurements are listed in Table 1. Many of these sources have poor Gaia goodness-of-fit statistics, and large excess astrometric noise parameters (Lindegren et al., 2012, 2018). To account for possibly underestimated uncertainties on the measured parallax values, the Gaia uncertainties reported in this study are the quadrature sum of the quoted DR2 parallax uncertainty and the excess astrometric noise parameter. Figure 7 shows the comparison between values in this study and Gaia DR2. All computed values are within the 3 combined uncertainty (85% within 2).
To evaluate the uncertainties of the measurements in this study to those from Gaia DR2, the quantity was computed. If the uncertainties are not over/underestimated, and the measurements are unbiased, this quantity should follow a normal distribution with and . The inset plot of Figure 7 shows the distribution of the above quantity, which has mas and mas. Further comparisons are needed as the sample size in Figure 7 is small, and statistical comparison using tests such as the Anderson-Darling test (Anderson & Darling, 1952) provide limited information. It appears that WISE parallax measurements are slightly overestimated as compared to Gaia DR2, however, this is not the case for comparison to other literature values. Further investigation is warranted using a larger comparison sample and future Gaia data releases that may account for possible systematics not yet discovered in the data.
In principle, this method can be applied to any source bright enough to be extracted within a single WISE L1b frame. Saturated photometry may cause an issue with centroiding. Crowded fields also pose a challenge due to multiple nearby objects causing source confusion and poor centroiding. It is unlikely that robust parallaxes ( uncertainty) can be measured farther than 20 pc using WISE data alone, assuming an average parallax precision of 8 mas. However, this distance limit is highly dependent on magnitude. The first 11 objects listed in Table 1 (excluding the binary Luhman 16AB and T8 dwarf 2MASS J093935482448279) are contained within Gaia DR2, which is roughly consistent with the () limit discussed in Section 3.
6 New and Improved Astrometric Measurements
There are many known low-mass objects estimated to be within 20 pc based on spectro-photometric parallax relationships, that have either no trigonometric parallax measurement, or measurements with large uncertainties (20%). Here, 23 such cases are investigated, sourced from the literature to cover a range of spectral types, distances, and magnitudes, nine of which have parallax measurements within Gaia DR2 (Table 2). The newly computed astrometric solutions are shown in Figure Set 8.
Fig. Set8. Updated WISE Astrometric Solutions
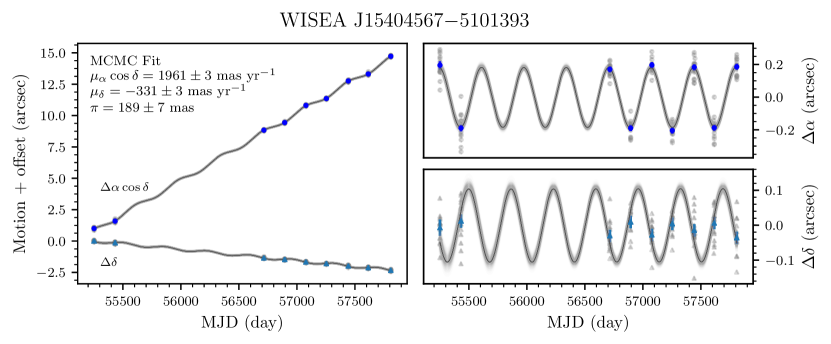
Source SpT SpT aaValues in parentheses indicate spectrophotometric distance estimates. Gaia Ref. (mas yr-1) (mas yr-1) (mas) (mas) Ref. DR2 WISEA J154045.67510139.3 M6 9 9 SDSS J122150.17463244.4 M6bbSpectral type estimated from photometric colors. … () 19 YccNo parallax measurement included in Gaia DR2, however, source has . Typically high astrometric_sigma5d_max parameters and/or high goodness-of-fit statistics (100). 2MASS J123517261318054 M6 14 () 19 YccNo parallax measurement included in Gaia DR2, however, source has . Typically high astrometric_sigma5d_max parameters and/or high goodness-of-fit statistics (100). 2MASS J031403441603056 L0 15 () 15 2MASS J150654411321060 L3 8 () 8 SDSS J141624.08134826.7 L6 17 18 2MASS J151500834847416 L6 16 () 17 YccNo parallax measurement included in Gaia DR2, however, source has . Typically high astrometric_sigma5d_max parameters and/or high goodness-of-fit statistics (100). 2MASS J014435360716142 L5 11 () 5 2MASS J085758495708514 L8ddPotential low-gravity object discussed in Gagné et al. 2015. 7 eeThis parallax measurement was published while this manuscript was under review. 21 SDSS J090837.91503207.5 L8 17 () 17 WISE J003110.04574936.3 L9 1 () 20 N WISE J203042.79074934.7 T1.5 13 () 1 SDSS J075840.33324723.4 T2 10 () 6 YffIncluded in Gaia DR2, but no 5-parameter astrometric solution due to . WISE J185101.83593508.6 L7T2 20 () 20 2MASS J132435536358281 L8T3.5 (T2) 4 (12) () 6 N 2MASS J110611972754225 T0T4.5 4 () 6 YffIncluded in Gaia DR2, but no 5-parameter astrometric solution due to . PSO J140.230845.6487 L9 13 () 2 YffIncluded in Gaia DR2, but no 5-parameter astrometric solution due to . WISE J223617.59510551.9 T5.5 13 () 1 YffIncluded in Gaia DR2, but no 5-parameter astrometric solution due to . 2MASS J034807726022270 T7 3 () 6 N WISE J180952.53044812.5 T1 2 () 2 YffIncluded in Gaia DR2, but no 5-parameter astrometric solution due to . 2MASS J123147530847331 T5.5 3 () 6 N 2MASSI J2254188312349 T4 3 () 6 YffIncluded in Gaia DR2, but no 5-parameter astrometric solution due to . 2MASS J215433185942187 T6 12 () 6 N
Note. — (1) Best et al. 2013; (2) Best et al. 2015; (3) Burgasser et al. 2006; (4) Burgasser et al. 2010; (5) Cruz et al. 2003; (6) Faherty et al. 2009; (7) Geballe et al. 2002; (8) Gizis et al. 2000; (9) Kirkpatrick et al. 2014; (10) Knapp et al. 2004; (11) Liebert et al. 2003; (12) Looper et al. 2007; (13) Mace et al. 2013; (14) Reid et al. 2007; (15) Reid et al. 2008; (16) Schmidt et al. 2007; (17) Schmidt et al. 2010; (18) Scholz 2010; (19) Theissen et al. 2017; (20) Thompson et al. 2013; (21) Wang et al. 2018.
Using the sources from Tables 1 and 2, a 2nd order polynomial fit to the parallax uncertainties divided by 0.15 was computed, representing the approximate parallax limit where uncertainties can be achieved, as a function of magnitude. The polynomial is shown in Figure 6, converted from parallax to distance (blue dashed line corresponding to the blue y-axis on the right side of Figure 6). Bright sources () can potentially have their parallaxes measured out to distances of 23 pc, with sources at the Gaia 95% completeness limit (; ) requiring distances within 17 pc. These limits will be validated in the future with a larger control sample and future Gaia data releases.
7 Discussion
The technique presented here has the potential to find new, nearby, ultracool objects, and measure relatively accurate parallaxes without the need for follow-up observations. This is particularly important as Spitzer is expected to be retired in 2018. Its replacement, the James Webb Space Telescope (JWST; Gardner et al., 2006), while sensitive to these faint dwarfs, is an unlikely facility for a dedicated parallax program.
There are approximately 300 objects with spectral types between L0 and T8 that currently have published parallaxes777The majority can be found within the Database of Ultracool Parallaxes maintained by Trent Dupuy: http://www.as.utexas.edu/~tdupuy/plx/Database_of_Ultracool_Parallaxes.html (Dupuy & Liu, 2012; Dupuy & Kraus, 2013; Liu et al., 2016) . As discussed here and in previous studies (Theissen et al., 2017; Smart et al., 2017a), Gaia will not provide parallaxes for many of the nearby, lowest-mass, ultracool objects leaving only ground-based programs. The method described here is a useful alternative for the nearest ( pc) ultracool objects.
Figure 9 shows the absolute magnitude as a function of spectral type for ultracool dwarfs. The vast majority of sources measured in this study follow the expected empirical relationships from Kirkpatrick et al. (red dashed line; 2014) and Faherty et al. (solid black line with gray uncertainty region; 2016), with a few known exceptions (e.g., the overluminous Luhman 16AB). Additionally, the spectral binary candidate 2MASS J132435536358281 (L8T3.5; Burgasser et al., 2010, hereafter 2MASS J13246358) appears underluminous for the spectral type of the primary component. Recent results suggest that 2MASS J13246358 is a single T2 dwarf and member of the young (150 Myr) AB Doradus moving group (Gagné et al., 2018), consistent with the parallax measurement in this study.
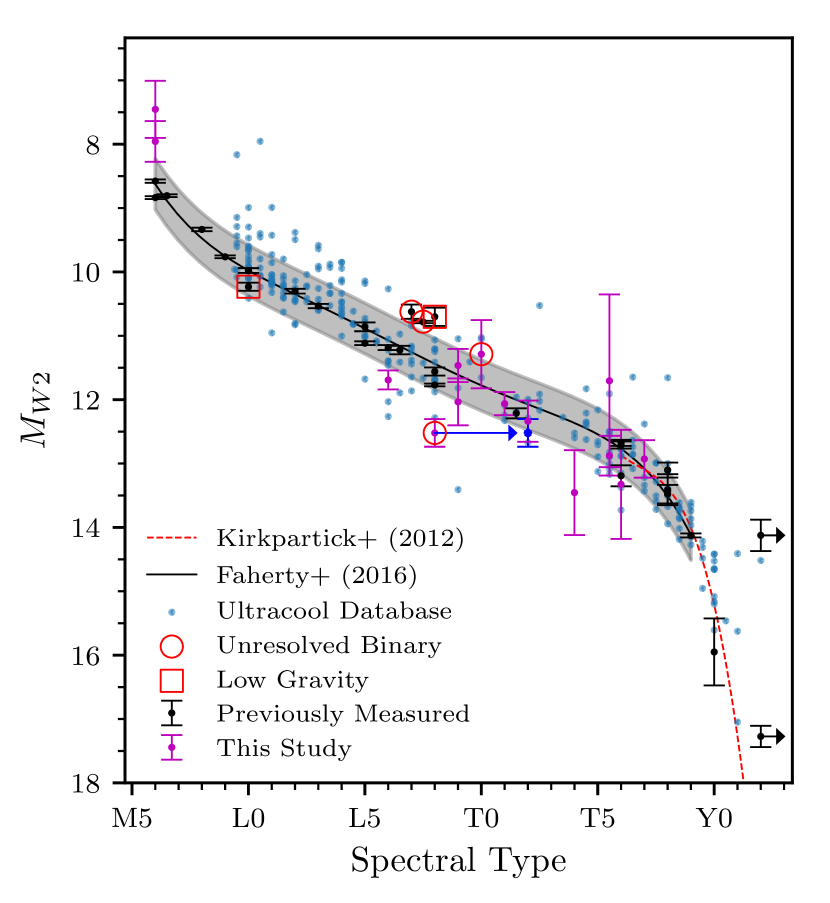
Figure 9 demonstrates the utility of trigonometric parallaxes for identifying overluminous, unresolved binaries—similar to Luhman 16AB—and low surface gravity brown dwarfs, the latter of which are also useful for determining youth and a helpful diagnostic for membership in nearby young moving groups. Future work will focus on measuring parallaxes for all ultracool dwarfs within 17 pc without published trigonometric parallax measurements, and is applicable to any future discoveries of ultracool dwarfs.
Additionally, it may be possible to use unWISE (Lang, 2014; Meisner et al., 2017b, c) single-epoch coadds (Meisner et al., 2017a) for higher precision astrometric measurements of the faintest sources (e.g., Y dwarfs). Currently, not all epochs of NEOWISE-R data have been processed through unWISE, and future work will wait until all epochs become available.
References
- Anderson & Darling (1952) Anderson, T. W., & Darling, D. A. 1952, The annals of mathematical statistics, 193
- Andrei et al. (2011) Andrei, A. H., Smart, R. L., Penna, J. L., et al. 2011, AJ, 141, 54, doi: 10.1088/0004-6256/141/2/54
- Arenou et al. (2018) Arenou, F., Luri, X., Babusiaux, C., et al. 2018, ArXiv e-prints. https://arxiv.org/abs/1804.09375
- Artigau et al. (2010) Artigau, É., Radigan, J., Folkes, S., et al. 2010, ApJ, 718, L38, doi: 10.1088/2041-8205/718/1/L38
- Astropy Collaboration et al. (2013) Astropy Collaboration, Robitaille, T. P., Tollerud, E. J., et al. 2013, A&A, 558, A33, doi: 10.1051/0004-6361/201322068
- Bedin et al. (2017) Bedin, L. R., Pourbaix, D., Apai, D., et al. 2017, MNRAS, 470, 1140, doi: 10.1093/mnras/stx1177
- Beichman et al. (2013) Beichman, C., Gelino, C. R., Kirkpatrick, J. D., et al. 2013, ApJ, 764, 101, doi: 10.1088/0004-637X/764/1/101
- Best et al. (2013) Best, W. M. J., Liu, M. C., Magnier, E. A., et al. 2013, ApJ, 777, 84, doi: 10.1088/0004-637X/777/2/84
- Best et al. (2015) —. 2015, ApJ, 814, 118, doi: 10.1088/0004-637X/814/2/118
- Burgasser et al. (2010) Burgasser, A. J., Cruz, K. L., Cushing, M., et al. 2010, ApJ, 710, 1142, doi: 10.1088/0004-637X/710/2/1142
- Burgasser et al. (2006) Burgasser, A. J., Geballe, T. R., Leggett, S. K., Kirkpatrick, J. D., & Golimowski, D. A. 2006, ApJ, 637, 1067, doi: 10.1086/498563
- Burgasser et al. (2013) Burgasser, A. J., Sheppard, S. S., & Luhman, K. L. 2013, ApJ, 772, 129, doi: 10.1088/0004-637X/772/2/129
- Costa et al. (2006) Costa, E., Méndez, R. A., Jao, W.-C., et al. 2006, AJ, 132, 1234, doi: 10.1086/505706
- Cruz et al. (2003) Cruz, K. L., Reid, I. N., Liebert, J., Kirkpatrick, J. D., & Lowrance, P. J. 2003, AJ, 126, 2421, doi: 10.1086/378607
- Cushing et al. (2011) Cushing, M. C., Kirkpatrick, J. D., Gelino, C. R., et al. 2011, ApJ, 743, 50, doi: 10.1088/0004-637X/743/1/50
- Cutri & et al. (2013) Cutri, R. M., & et al. 2013, VizieR Online Data Catalog, 2328
- Czekaj et al. (2014) Czekaj, M. A., Robin, A. C., Figueras, F., Luri, X., & Haywood, M. 2014, A&A, 564, A102, doi: 10.1051/0004-6361/201322139
- Dittmann et al. (2014) Dittmann, J. A., Irwin, J. M., Charbonneau, D., & Berta-Thompson, Z. K. 2014, ApJ, 784, 156, doi: 10.1088/0004-637X/784/2/156
- Dupuy et al. (2016) Dupuy, T. J., Forbrich, J., Rizzuto, A., et al. 2016, ApJ, 827, 23, doi: 10.3847/0004-637X/827/1/23
- Dupuy & Kraus (2013) Dupuy, T. J., & Kraus, A. L. 2013, Science, 341, 1492, doi: 10.1126/science.1241917
- Dupuy & Liu (2012) Dupuy, T. J., & Liu, M. C. 2012, ApJS, 201, 19, doi: 10.1088/0067-0049/201/2/19
- Faherty et al. (2009) Faherty, J. K., Burgasser, A. J., Cruz, K. L., et al. 2009, AJ, 137, 1, doi: 10.1088/0004-6256/137/1/1
- Faherty et al. (2012) Faherty, J. K., Burgasser, A. J., Walter, F. M., et al. 2012, ApJ, 752, 56, doi: 10.1088/0004-637X/752/1/56
- Faherty et al. (2016) Faherty, J. K., Riedel, A. R., Cruz, K. L., et al. 2016, ApJS, 225, 10, doi: 10.3847/0067-0049/225/1/10
- Fazio et al. (2004) Fazio, G. G., Hora, J. L., Allen, L. E., et al. 2004, ApJS, 154, 10, doi: 10.1086/422843
- Filippazzo et al. (2015) Filippazzo, J. C., Rice, E. L., Faherty, J., et al. 2015, ApJ, 810, 158, doi: 10.1088/0004-637X/810/2/158
- Foreman-Mackey et al. (2013) Foreman-Mackey, D., Hogg, D. W., Lang, D., & Goodman, J. 2013, PASP, 125, 306, doi: 10.1086/670067
- Gagné et al. (2018) Gagné, J., Allers, K. N., Theissen, C. A., et al. 2018, ApJ, 854, L27, doi: 10.3847/2041-8213/aaacfd
- Gagné et al. (2015) Gagné, J., Faherty, J. K., Cruz, K. L., et al. 2015, ApJS, 219, 33, doi: 10.1088/0067-0049/219/2/33
- Gaia Collaboration et al. (2018) Gaia Collaboration, Brown, A. G. A., Vallenari, A., et al. 2018, ArXiv e-prints. https://arxiv.org/abs/1804.09365
- Gaia Collaboration et al. (2016a) Gaia Collaboration, Prusti, T., de Bruijne, J. H. J., et al. 2016a, A&A, 595, A1, doi: 10.1051/0004-6361/201629272
- Gaia Collaboration et al. (2016b) Gaia Collaboration, Brown, A. G. A., Vallenari, A., et al. 2016b, A&A, 595, A2, doi: 10.1051/0004-6361/201629512
- Gardner et al. (2006) Gardner, J. P., Mather, J. C., Clampin, M., et al. 2006, Space Sci. Rev., 123, 485, doi: 10.1007/s11214-006-8315-7
- Geballe et al. (2002) Geballe, T. R., Knapp, G. R., Leggett, S. K., et al. 2002, ApJ, 564, 466, doi: 10.1086/324078
- Gizis et al. (2000) Gizis, J. E., Monet, D. G., Reid, I. N., et al. 2000, AJ, 120, 1085, doi: 10.1086/301456
- Green (1985) Green, R. M. 1985, Spherical astronomy
- Hunter (2007) Hunter, J. D. 2007, Computing in Science and Engineering, 9, 90, doi: 10.1109/MCSE.2007.55
- Kirkpatrick et al. (2008) Kirkpatrick, J. D., Cruz, K. L., Barman, T. S., et al. 2008, ApJ, 689, 1295, doi: 10.1086/592768
- Kirkpatrick et al. (2011) Kirkpatrick, J. D., Cushing, M. C., Gelino, C. R., et al. 2011, ApJS, 197, 19, doi: 10.1088/0067-0049/197/2/19
- Kirkpatrick et al. (2012) Kirkpatrick, J. D., Gelino, C. R., Cushing, M. C., et al. 2012, ApJ, 753, 156, doi: 10.1088/0004-637X/753/2/156
- Kirkpatrick et al. (2014) Kirkpatrick, J. D., Schneider, A., Fajardo-Acosta, S., et al. 2014, ApJ, 783, 122, doi: 10.1088/0004-637X/783/2/122
- Knapp et al. (2004) Knapp, G. R., Leggett, S. K., Fan, X., et al. 2004, AJ, 127, 3553, doi: 10.1086/420707
- Lang (2014) Lang, D. 2014, AJ, 147, 108, doi: 10.1088/0004-6256/147/5/108
- Leggett et al. (2012) Leggett, S. K., Saumon, D., Marley, M. S., et al. 2012, ApJ, 748, 74, doi: 10.1088/0004-637X/748/2/74
- Lépine et al. (2009) Lépine, S., Thorstensen, J. R., Shara, M. M., & Rich, R. M. 2009, AJ, 137, 4109, doi: 10.1088/0004-6256/137/5/4109
- Liebert et al. (2003) Liebert, J., Kirkpatrick, J. D., Cruz, K. L., et al. 2003, AJ, 125, 343, doi: 10.1086/345514
- Lindegren et al. (2012) Lindegren, L., Lammers, U., Hobbs, D., et al. 2012, A&A, 538, A78, doi: 10.1051/0004-6361/201117905
- Lindegren et al. (2018) Lindegren, L., Hernandez, J., Bombrun, A., et al. 2018, ArXiv e-prints. https://arxiv.org/abs/1804.09366
- Liu et al. (2016) Liu, M. C., Dupuy, T. J., & Allers, K. N. 2016, ApJ, 833, 96, doi: 10.3847/1538-4357/833/1/96
- Looper et al. (2007) Looper, D. L., Kirkpatrick, J. D., & Burgasser, A. J. 2007, AJ, 134, 1162, doi: 10.1086/520645
- Luhman (2013) Luhman, K. L. 2013, ApJ, 767, L1, doi: 10.1088/2041-8205/767/1/L1
- Luri et al. (2018) Luri, X., Brown, A. G. A., Sarro, L. M., et al. 2018, ArXiv e-prints. https://arxiv.org/abs/1804.09376
- Lurie et al. (2014) Lurie, J. C., Henry, T. J., Jao, W.-C., et al. 2014, AJ, 148, 91, doi: 10.1088/0004-6256/148/5/91
- Mace et al. (2013) Mace, G. N., Kirkpatrick, J. D., Cushing, M. C., et al. 2013, ApJS, 205, 6, doi: 10.1088/0067-0049/205/1/6
- Mainzer et al. (2011) Mainzer, A., Bauer, J., Grav, T., et al. 2011, ApJ, 731, 53, doi: 10.1088/0004-637X/731/1/53
- Mainzer et al. (2014) Mainzer, A., Bauer, J., Cutri, R. M., et al. 2014, ApJ, 792, 30, doi: 10.1088/0004-637X/792/1/30
- Marsh et al. (2013) Marsh, K. A., Wright, E. L., Kirkpatrick, J. D., et al. 2013, ApJ, 762, 119, doi: 10.1088/0004-637X/762/2/119
- Martín et al. (1999) Martín, E. L., Delfosse, X., Basri, G., et al. 1999, AJ, 118, 2466, doi: 10.1086/301107
- Meisner et al. (2017a) Meisner, A. M., Lang, D., & Schlegel, D. J. 2017a, ArXiv e-prints. https://arxiv.org/abs/1710.02526
- Meisner et al. (2017b) —. 2017b, AJ, 153, 38, doi: 10.3847/1538-3881/153/1/38
- Meisner et al. (2017c) —. 2017c, AJ, 154, 161, doi: 10.3847/1538-3881/aa894e
- Patten et al. (2006) Patten, B. M., Stauffer, J. R., Burrows, A., et al. 2006, ApJ, 651, 502, doi: 10.1086/507264
- Reid et al. (2007) Reid, I. N., Cruz, K. L., & Allen, P. R. 2007, AJ, 133, 2825, doi: 10.1086/517914
- Reid et al. (2008) Reid, I. N., Cruz, K. L., Kirkpatrick, J. D., et al. 2008, AJ, 136, 1290, doi: 10.1088/0004-6256/136/3/1290
- Reid et al. (1995) Reid, I. N., Hawley, S. L., & Gizis, J. E. 1995, AJ, 110, 1838, doi: 10.1086/117655
- Robin et al. (2003) Robin, A. C., Reylé, C., Derrière, S., & Picaud, S. 2003, A&A, 409, 523, doi: 10.1051/0004-6361:20031117
- Schmidt et al. (2007) Schmidt, S. J., Cruz, K. L., Bongiorno, B. J., Liebert, J., & Reid, I. N. 2007, AJ, 133, 2258, doi: 10.1086/512158
- Schmidt et al. (2015) Schmidt, S. J., Hawley, S. L., West, A. A., et al. 2015, AJ, 149, 158, doi: 10.1088/0004-6256/149/5/158
- Schmidt et al. (2010) Schmidt, S. J., West, A. A., Hawley, S. L., & Pineda, J. S. 2010, AJ, 139, 1808, doi: 10.1088/0004-6256/139/5/1808
- Scholz (2010) Scholz, R.-D. 2010, A&A, 510, L8, doi: 10.1051/0004-6361/201014078
- Scholz (2014) —. 2014, A&A, 561, A113, doi: 10.1051/0004-6361/201323015
- Skinner et al. (2016) Skinner, J. N., West, A. A., Faherty, J. K., & Muirhead, P. S. 2016, in 19th Cambridge Workshop on Cool Stars, Stellar Systems, and the Sun (CS19), 36
- Skrutskie et al. (2006) Skrutskie, M. F., Cutri, R. M., Stiening, R., et al. 2006, AJ, 131, 1163, doi: 10.1086/498708
- Smart et al. (2017a) Smart, R. L., Marocco, F., Caballero, J. A., et al. 2017a, MNRAS, 469, 401, doi: 10.1093/mnras/stx800
- Smart et al. (2017b) Smart, R. L., Apai, D., Kirkpatrick, J. D., et al. 2017b, MNRAS, 468, 3764, doi: 10.1093/mnras/stx723
- Theissen et al. (2016) Theissen, C. A., West, A. A., & Dhital, S. 2016, AJ, 151, 41, doi: 10.3847/0004-6256/151/2/41
- Theissen et al. (2017) Theissen, C. A., West, A. A., Shippee, G., Burgasser, A. J., & Schmidt, S. J. 2017, AJ, 153, 92, doi: 10.3847/1538-3881/153/3/92
- Thompson et al. (2013) Thompson, M. A., Kirkpatrick, J. D., Mace, G. N., et al. 2013, PASP, 125, 809, doi: 10.1086/671426
- Tinney et al. (2014) Tinney, C. G., Faherty, J. K., Kirkpatrick, J. D., et al. 2014, ApJ, 796, 39, doi: 10.1088/0004-637X/796/1/39
- van Dekamp (1967) van Dekamp, P. 1967, Principles of astrometry
- Wang et al. (2018) Wang, Y., Smart, R. L., Shao, Z., et al. 2018, PASP, 130, 064402, doi: 10.1088/1538-3873/aaacc5
- Weinberger et al. (2016) Weinberger, A. J., Boss, A. P., Keiser, S. A., et al. 2016, AJ, 152, 24, doi: 10.3847/0004-6256/152/1/24
- Wenger et al. (2000) Wenger, M., Ochsenbein, F., Egret, D., et al. 2000, A&AS, 143, 9, doi: 10.1051/aas:2000332
- Werner et al. (2004) Werner, M. W., Roellig, T. L., Low, F. J., et al. 2004, ApJS, 154, 1, doi: 10.1086/422992
- Wright et al. (2010) Wright, E. L., Eisenhardt, P. R. M., Mainzer, A. K., et al. 2010, AJ, 140, 1868, doi: 10.1088/0004-6256/140/6/1868
- Wright et al. (2014) Wright, E. L., Mainzer, A., Kirkpatrick, J. D., et al. 2014, AJ, 148, 82, doi: 10.1088/0004-6256/148/5/82
- York et al. (2000) York, D. G., Adelman, J., Anderson, Jr., J. E., et al. 2000, AJ, 120, 1579, doi: 10.1086/301513
![[Uncaptioned image]](/html/1710.11127/assets/x11.png)
![[Uncaptioned image]](/html/1710.11127/assets/x12.png)
![[Uncaptioned image]](/html/1710.11127/assets/x13.png)
![[Uncaptioned image]](/html/1710.11127/assets/x14.png)
![[Uncaptioned image]](/html/1710.11127/assets/x15.png)
![[Uncaptioned image]](/html/1710.11127/assets/x16.png)
![[Uncaptioned image]](/html/1710.11127/assets/x17.png)
![[Uncaptioned image]](/html/1710.11127/assets/x18.png)
![[Uncaptioned image]](/html/1710.11127/assets/x19.png)
![[Uncaptioned image]](/html/1710.11127/assets/x20.png)
![[Uncaptioned image]](/html/1710.11127/assets/x21.png)
![[Uncaptioned image]](/html/1710.11127/assets/x22.png)
![[Uncaptioned image]](/html/1710.11127/assets/x23.png)
![[Uncaptioned image]](/html/1710.11127/assets/x24.png)
![[Uncaptioned image]](/html/1710.11127/assets/x25.png)
![[Uncaptioned image]](/html/1710.11127/assets/x26.png)
![[Uncaptioned image]](/html/1710.11127/assets/x27.png)
![[Uncaptioned image]](/html/1710.11127/assets/x28.png)
![[Uncaptioned image]](/html/1710.11127/assets/x29.png)
![[Uncaptioned image]](/html/1710.11127/assets/x30.png)
![[Uncaptioned image]](/html/1710.11127/assets/x31.png)
![[Uncaptioned image]](/html/1710.11127/assets/x32.png)
![[Uncaptioned image]](/html/1710.11127/assets/x33.png)
![[Uncaptioned image]](/html/1710.11127/assets/x34.png)
![[Uncaptioned image]](/html/1710.11127/assets/x35.png)
![[Uncaptioned image]](/html/1710.11127/assets/x36.png)
![[Uncaptioned image]](/html/1710.11127/assets/x37.png)
![[Uncaptioned image]](/html/1710.11127/assets/x38.png)
![[Uncaptioned image]](/html/1710.11127/assets/x39.png)
![[Uncaptioned image]](/html/1710.11127/assets/x40.png)
![[Uncaptioned image]](/html/1710.11127/assets/x41.png)
![[Uncaptioned image]](/html/1710.11127/assets/x42.png)
![[Uncaptioned image]](/html/1710.11127/assets/x43.png)
![[Uncaptioned image]](/html/1710.11127/assets/x44.png)
![[Uncaptioned image]](/html/1710.11127/assets/x45.png)
![[Uncaptioned image]](/html/1710.11127/assets/x46.png)
![[Uncaptioned image]](/html/1710.11127/assets/x47.png)
![[Uncaptioned image]](/html/1710.11127/assets/x48.png)
![[Uncaptioned image]](/html/1710.11127/assets/x49.png)
![[Uncaptioned image]](/html/1710.11127/assets/x50.png)
![[Uncaptioned image]](/html/1710.11127/assets/x51.png)
![[Uncaptioned image]](/html/1710.11127/assets/x52.png)
![[Uncaptioned image]](/html/1710.11127/assets/x53.png)