Numerical Simulations of Gaseous Disks Generated from Collisional Cascades at the Roche Limits of White Dwarf Stars
Abstract
We consider the long-term evolution of gaseous disks fed by the vaporization of small particles produced in a collisional cascade inside the Roche limit of a 0.6 white dwarf. Adding solids with radius at a constant rate into a narrow annulus leads to two distinct types of evolution. When , the cascade generates a fairly steady accretion disk where the mass transfer rate of gas onto the white dwarf is roughly and the mass in gas is g, where is the temperature of the gas near the Roche limit and is the dimensionless viscosity parameter. If , the system alternates between high states with large mass transfer rates and low states with negligible accretion. Although either mode of evolution adds significant amounts of metals to the white dwarf photosphere, none of our calculations yield a vertically thin ensemble of solids inside the Roche limit. X-ray observations can place limits on the mass transfer rate and test this model for metallic line white dwarfs.
1 INTRODUCTION
Over the past four decades, observations have shown that many white dwarfs have metallic absorption lines from O, Mg, Al, Si, Ca, Fe, and a variety of other elements with atomic number 6 (e.g., Shipman et al., 1977; Cottrell & Greenstein, 1980; Shipman & Greenstein, 1983; Lacombe et al., 1983; Liebert et al., 1987; Kenyon et al., 1988; Sion et al., 1990; Zuckerman & Reid, 1998; Jura & Young, 2014; Koester et al., 2014; Kepler et al., 2016; Xu et al., 2017, and references therein). Some of these stars have near-IR excess emission from warm dust orbiting near the Roche limit (e.g., Kilic et al., 2005; Reach et al., 2005; Hansen et al., 2006; Tremblay & Bergeron, 2007; von Hippel et al., 2007; Farihi et al., 2009; Girven et al., 2011; Debes et al., 2011; Chu et al., 2011; Barber et al., 2012; Hoard et al., 2013; Barber et al., 2014; Bergfors et al., 2014; Rocchetto et al., 2015; Farihi, 2016; Bonsor et al., 2017). A few have metallic emission features from ionized or neutral gas, also orbiting within the Roche limit (e.g., Gänsicke et al., 2006, 2007, 2008; Melis et al., 2010; Farihi et al., 2012; Melis et al., 2012; Debes et al., 2012a; Wilson et al., 2014).
Currently popular models for these white dwarfs propose that the photospheric absorption lines result from accretion of solid material originally orbiting at large distances from the host star (e.g., Alcock & Illarionov, 1980; Lacombe et al., 1983; Alcock et al., 1986; Jura, 2003; Koester & Wilken, 2006; Jura et al., 2007a, b; Wyatt et al., 2014; Veras, 2016). Perturbations of the orbits lead to a succession of solids that fall within the Roche limit of the white dwarf and eventually form an optically thick, vertically thin disk surrounding the white dwarf. Vaporization of disk particles produces a gaseous disk, which moderates direct accretion of material onto the white dwarf photosphere (e.g., Debes & Sigurdsson, 2002; Jura, 2003, 2008; Rafikov, 2011a; Debes et al., 2012b; Metzger et al., 2012; Veras et al., 2013; Brown et al., 2017).
In Kenyon & Bromley (2017, hereafter KB2017), we considered the long-term evolution of solid material placed on mildly eccentric ( = 0.01) orbits within a narrow annulus near the Roche limit of a 0.6 white dwarf. Destructive collisions generate a collisional cascade which converts 1–100 km asteroids into dust grains with radii 1 . When solids are replenished at a rate , the system often finds an equilibrium which depends on and the radius of the largest solid added to the annulus. Equilibria with constant mass require 10–30 km and . Otherwise, the solid mass in the annulus oscillates between high states with large collision rates and low states with negligible collision rates.
Throughout all of our simulations, the vertical scale height of the solids remains large, , where is the distance of the annulus from the central star. In principle, collisional damping is sufficient to reduce significantly on 5–10 collision times. In practice, however, the collisional cascade processes solids on shorter time scales and prevents damping. Thus, collisional processes are incapable of assembling a thin disk of solids inside the Roche limit of a white dwarf.
Although simple order-of-magnitude estimates suggest that interactions between the solids and the gas are also incapable of reducing (KB2017), it is necessary to consider whether a more detailed treatment of the gas can produce conditions more amenable to the formation of a thin disk of solids. Here, we expand on KB2017 and derive the time evolution of a gaseous disk formed by the vaporization of small solids produced in the collisional cascade. Once we infer the radial distribution of the gas surface density (), we use an adopted temperature distribution to calculate the impact of the gas on solid particles.
In addition to placing better constraints on the ability of solids to collapse into a thin disk, we derive the time evolution of the accretion rate of gas onto the central white dwarf. These results allow us to begin to compare theoretical estimates of accretion rates with observations.
After briefly summarizing the algorithms used in our simulations (§2), we describe results for a suite of calculations with different and (§3). We then compare our results with previous investigations, discuss the likely impact of the gas on solid particles, and make some initial comparisons with observations (§4). We conclude with a brief summary (§5).
2 THEORETICAL BACKGROUND
To follow the evolution of a gaseous disk generated from vaporized solids,
we rely on Orchestra, a parallel C++/MPI hybrid coagulation +
-body code that tracks the accretion, fragmentation, and orbital evolution
of solid particles ranging in size from a few microns to thousands of km
(Kenyon & Bromley, 2001, 2004, 2008; Bromley & Kenyon, 2011a, b; Kenyon & Bromley, 2016).
The ensemble of codes within Orchestra includes a multi-annulus coagulation
code for small particles, an -body code for large particles, and
separate radial diffusion codes for solids and gas. Several algorithms
link the codes together, enabling each component to react to the evolution
of other components.
As in KB2017, we assume solid particles lie within a single annulus of width at a distance from a central star with mass = 0.6 and radius = 0.013 ( = 1.16 ; ). Particles on circular orbits have velocities 300 . Within the annulus, there are mass batches with characteristic mass and logarithmic spacing ; adopting = 1.4 provides a reasonably accurate solution for the cascade (e.g, Kenyon & Bromley, 2015a, b, 2016, and references therein). Batches contain particles with total mass , average mass , horizontal velocity ( = ), and vertical velocity (sin = ). The number of particles, total mass, and orbital velocity of each batch evolve through physical collisions and gravitational interactions with all other mass batches in the ring.
At the start of each calculation, the single annulus is empty of solids. During a time step of length , we add a mass in solids, . Every solid particle added to the annulus has radius , mass , eccentricity , and inclination . The solids have a mass density = 3 . Along with the input rate , the initial properties of the solids are held fixed in each calculation. The number of particles added to the grid is . Our algorithm uses a random number generator to round up or down to the nearest integer. For systems with large , this procedure introduces some shot noise into the input rate.
When the solid mass reaches a critical level, the particles begin to collide. As summarized in KB2017, the coagulation code within Orchestra derives the rates and outcomes of physical collisions and the velocity evolution from gravitational interactions among all particles in the grid. By setting = 0.01 and , we ensure that all collisions are destructive, with approximate collision velocities 3 . The complete ensemble of destructive collisions generates a collisional cascade, where solids with initial radii of 1–100 km are gradually ground into 1 dust grains.
In KB2017, we assumed that particles with radii 1 were vaporized and ‘lost’ to the system. Here, we consider how this material evolves when it feeds a gaseous reservoir. Vaporized solids are placed into the reservoir at a rate , which is derived from the coagulation code every time step. This material is spread evenly over the width of the annulus, which extends from an inner radius = to an outer radius = . Between and , the reservoir grows in surface density at a rate .
As the gaseous reservoir grows, we numerically solve the radial diffusion equation (Lynden-Bell & Pringle, 1974; Pringle, 1981)
| (1) |
for the evolution of the surface density (see also Bromley & Kenyon, 2011a). Here, is the radial distance from the central star, is the viscosity, and is the time. The first term is the change in from viscous evolution; the second term is the change in from vaporization of small solid particles.
To set the viscosity in each annulus, we adopt a standard prescription
| (2) |
where is the dimensionless viscosity parameter, is the sound speed, and is the vertical scale height of the gas. Following Metzger et al. (2012), we set . For disk material with angular velocity , . The sound speed is
| (3) |
where is the ratio of specific heats, is the Boltzmann constant, is the gas temperature, = 28 is the mean molecular weight, and is the mass of a hydrogen atom.
In this application, the energy generated from viscous mass transport is negligible. To avoid solving for the physical conditions in the gas (e.g., Melis et al., 2010), we adopt a simple expression for the gas temperature
| (4) |
with 1500 K and = 1/2. This expression is similar to the more detailed results of Melis et al. (2010), where 1500–3000 K and = 0.25–0.75 for white dwarfs with effective temperatures = 5000-15000 K. To quantify the impact of the adopted , we also consider evolution of the gas for = 3000 K.
To solve eq. 1 with input and , we specify an inner radius = 1.5 and an outer radius = 1 AU. The large outer radius allows vaporized solids to expand well past the Roche limit. Setting , we divide the disk into 1001 annuli equally spaced in (see also Bath & Pringle, 1981, 1982). As a standard boundary condition, = 0. Within every coagulation time step, our explicit algorithm for the radial surface density executes a set of internal time steps to satisfy the Courant condition and to enable mass conservation to machine accuracy. As a check, we also derive an implicit solution for (Press et al., 1992). Over the full range in , the two solutions yield the same to better than 0.1% over 1–10 Myr of evolution.
At the start of each calculation, the vertical scale height of solids is much larger than the vertical scale height of the gas. For the solids, 7500 km at 1.15 . The gas has a vertical scale height 1500 km. One of our goals is to learn whether collisional processes lead to situations with .
3 RESULTS
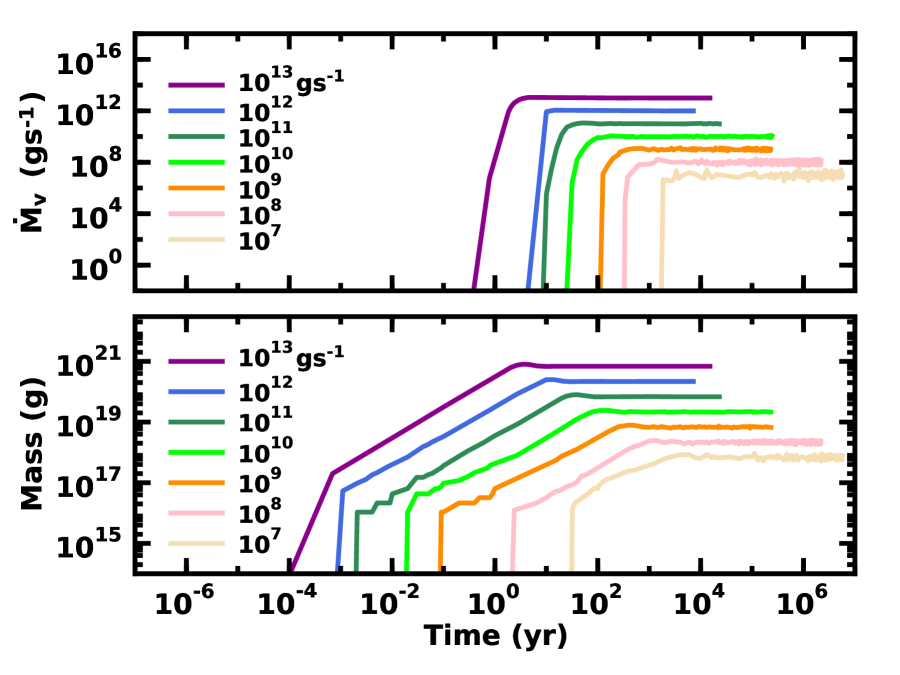
To explore the evolution of a gaseous disk generated by the vaporization of small solids, we first consider collisional cascade simulations with = 1 km and = . The range for includes accretion rates inferred for metallic line white dwarfs (Wyatt et al., 2014; Farihi, 2016). Calculations with = 1 km minimize shot noise, which grows with increasing (KB2017).
Fig. 1 (lower panel) illustrates the evolution of the total mass in solids, , for various listed in the caption. At the start of each calculation, the annulus contains no mass. As mass is added, the collision rate is negligible. Thus, increases linearly with time. Once the mass reaches a critical limit, destructive collisions among the solids begin to produce smaller objects. In turn, collisions between the larger and smaller objects generate even more debris. This process fuels a collisional cascade which grinds large objects into small dust grains. After many collision times, the rate the cascade processes mass equals the input rate . The mass in solids then achieves a roughly stable value which is maintained for the rest of the calculation. In systems with large (small) , this mass varies slightly (noticeably) with time.
Fig. 1 (upper panel) follows the evolution of the vaporization rate . At the start of the calculation, collisions among large objects are rare; is close to zero. Once the collisional cascade begins, rises abruptly and then finds a plateau level where = . For systems with smaller , there are modest variations in about the input rate .
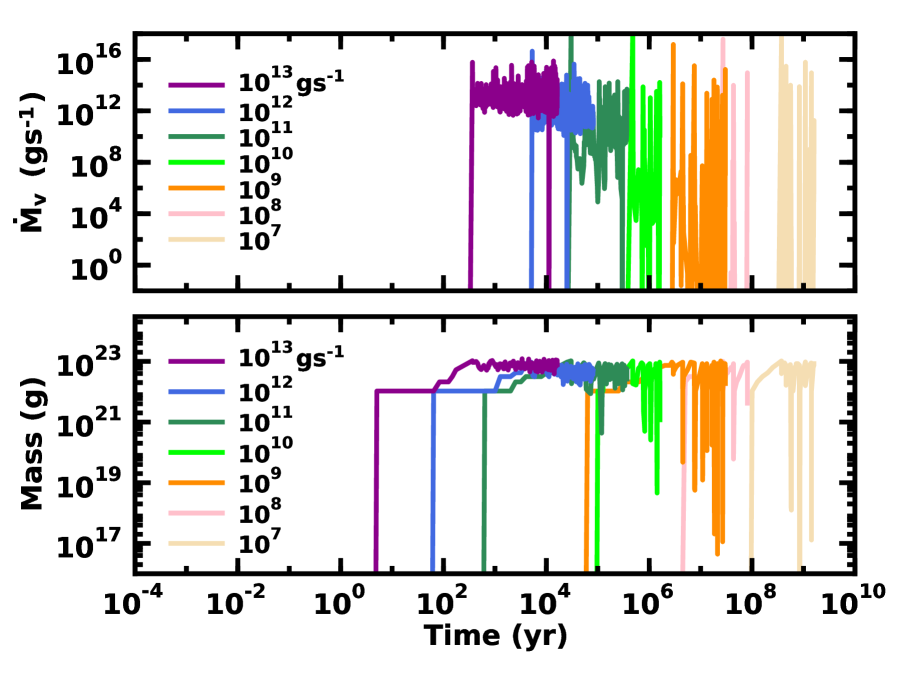
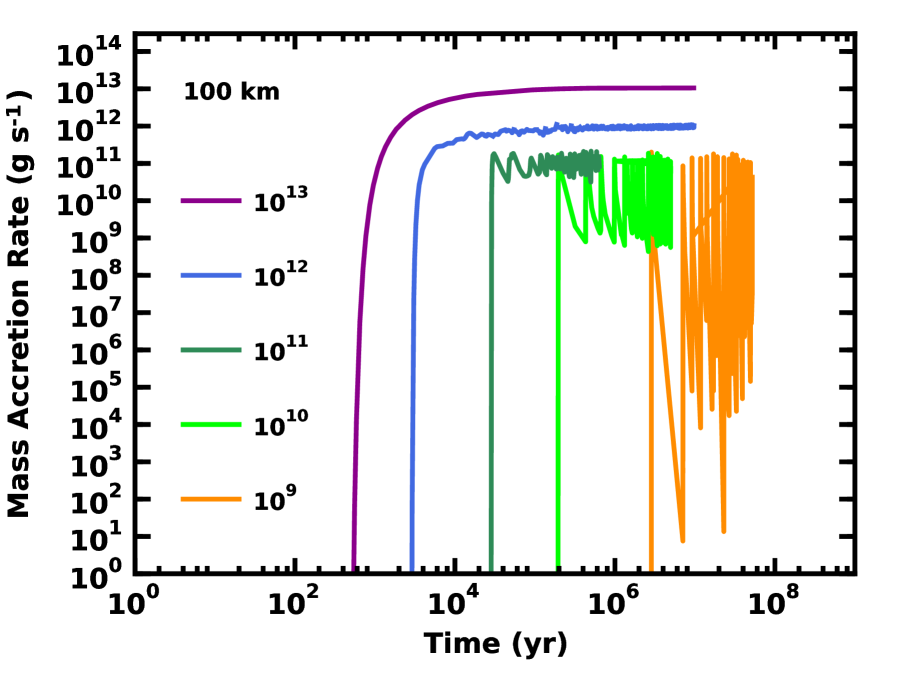
Fig. 2 plots results for calculations with = 100 km. When is large, the shot noise in the input rate is also large. The mass of solids in the annulus then grows episodically with time (Fig. 2, lower panel). Once the annulus contains several large objects, the collisional cascade begins. When is large, the cascade processes mass at roughly the same rate as the input rate . The mass in the annulus then exhibits small oscillations about an equilibrium mass which is somewhat larger than the equilibrium mass for smaller (KB2017).
For any , the number of large objects required to initiate the cascade is 2. Systems with smaller then take longer to start a cascade. Once the cascade begins, collisions convert large objects into small objects at a rate that depends only on the mass in the annulus. This rate is independent of . For systems with smaller , collisions process mass at rates much larger than the input rate. The system then oscillates between high states where the collisional cascade processes mass rapidly and low states where the system slowly gains enough mass to begin a new cascade.
The oscillations in produce similar variations in (Fig. 2). Throughout the evolution, is dominated by shot noise from occasional collisions among the largest objects. When is large, there are always enough large objects to produce a continuous cascade; then varies slowly about an equilibrium rate comparable with . When is small, the cascade is intermittent. During the high state, achieves the equilibrium level of systems with large . As the system falls into the low state, drops to zero.
Systems with different starting values for and behave similarly (KB2017). When is small and is large, the evolution of the system is very smooth. The cascade then always adjusts to balance the collision rate with ; = . When is large and is small, the evolution is oscillatory. In these systems, the cascade cannot find an equilibrium where the rate mass flows down the mass distribution (from large objects to small objects) and the vaporization rate equal the mass input rate . Instead, the annulus gradually collects solid material over long time scales when the collisional cascade is dormant and is negligible. Once there is enough material to collide, episodic cascades generate a large which is much larger than .
From a large suite of calculations with = 0.1–10 km, = , and = 0.5–3 (KB2017), the solid mass in the equilibrium state is
Aside from the numerical coefficient, the dependence of the equilibrium mass in solids on the seven physical variables in eq. 5 is a consequence of simple collision theory (KB2017). When a system has episodic cascades, the maximum mass is close to the equilibrium mass for large (KB2017).
The expression for in eq. 3 helps us establish approximate conditions for episodic collisional cascades. In any swarm of solids, the minimum mass in solids required for a cascade is with 2. When , the system cannot find an equilibrium and oscillates between the high and low states. Fixing all variables except , , and in eq. 3 at their nominal values, setting = 2 leads to a simple estimate for the maximum in the episodic regime:
| (6) |
Systems with () always (never) achieve a steady-state with the equilibrium mass in eq. 3. For our annulus with = 1.16 , the maximum required for the episodic regime ranges from for = 1 km to for = 10 km to for = 100 km. The full suite of simulations confirms this general result.
The two types of collisional cascades generate different evolutionary sequences for gaseous disks orbiting the central white dwarf. To illustrate this behavior, we again begin with a discussion of simulations with = 1 km and various . In these calculations, the smooth time evolution of leads to a fairly calm gaseous disk with a constant accretion rate onto the white dwarf.
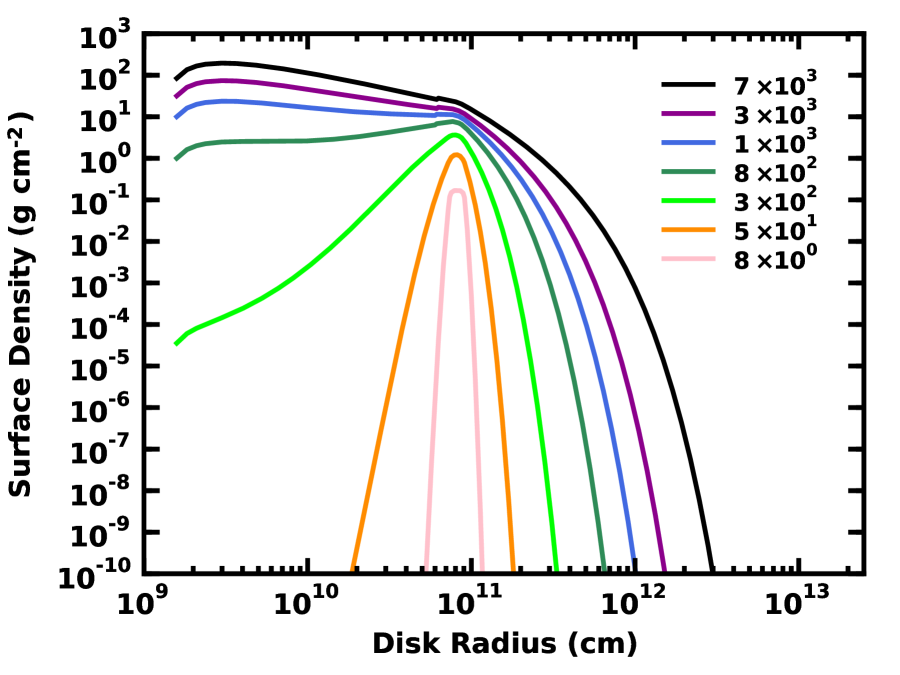
Fig. 3 illustrates several snapshots of the gas surface density for a system with = 1 km and = . Initially, the disk contains no gas; = 0 for all . When the cascade begins at = 8 yr (pink curve), vaporized solids generate a narrow torus of gas at 1.15 . As vaporization continues to place gas in this annulus, viscosity spreads the gas to smaller and to larger radii (see also Lynden-Bell & Pringle, 1974). After a few hundred years (lime curve), the gas begins to accrete onto the central star. Over the next few hundred years, the surface density of gas near the white dwarf photosphere grows to rival the surface density of gas at the Roche limit (dark green and blue curves). By = 3000–7000 yr, the gaseous disk has evolved into a structure where the surface density falls monotonically from 2–3 stellar radii to 10–30 times the Roche limit. As the evolution continues, the inner disk maintains a roughly static structure. Beyond the Roche limit, however, the outer disk radius continues to expand.
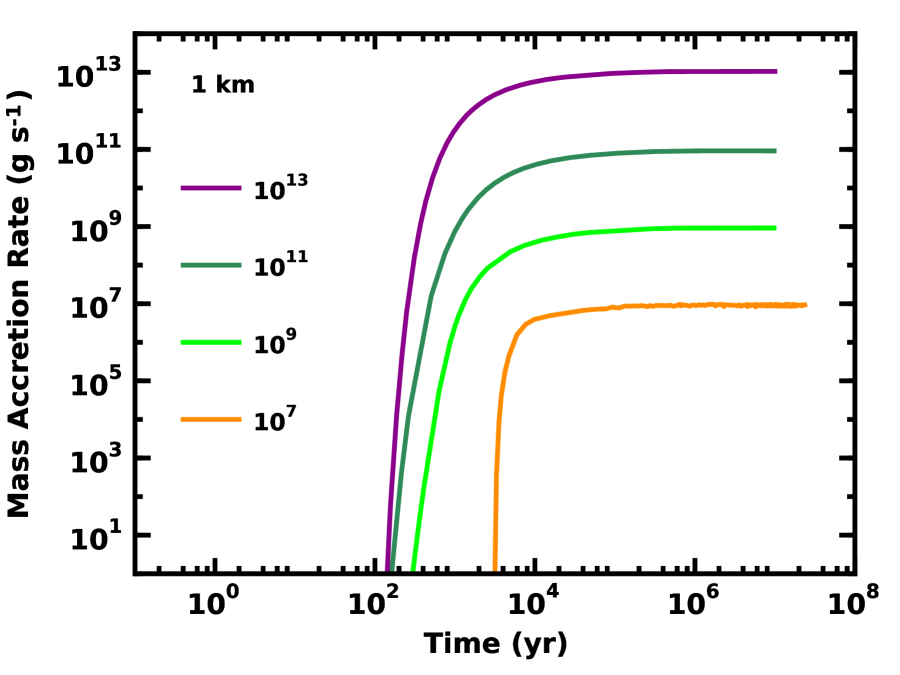
Fig. 4 plots the evolution of , the mass accretion rate of gas from the disk onto the white dwarf for this model (dark magenta curve) and other models with = 1 km and smaller (as listed in the legend). At early times, the collisional cascade is dormant. Once the cascade begins, vaporized solids generate a thin annulus of gas. Eventually, viscous evolution transports the gas from the Roche limit onto the white dwarf. The derived then grows dramatically, rising from 1–10 to a rate approaching in a few thousand years. After yr, reaches a plateau. In systems with large ( ), 0.9. When is smaller ( ), oscillates about this equilibrium rate.
For any , the time scale to reach the plateau phase depends on the viscosity. In our calculations, the viscosity is sensitive to and to the gas temperature (eq. 2). Systems with factor of ten smaller (larger) reach the plateau phase ten times more slowly (rapidly). Similarly, raising (lowering) by a factor of two decreases (increases) the viscous time by a factor of two.
Although the time scale to reach the plateau phase depends on and , the plateau is insensitive to either variable. In all of our calculations with = 1 km, the plateau rate is always roughly 90% of the input .
Based on a broad suite of simulations with = 0.1–10 km and a variety of , the mass in the disk is independent of , , and other properties of the solids. In addition to , the mass in gas depends on and :
| (7) |
Comparing this numerical result with eq. 3, the equilibrium mass in the gaseous disk is roughly three orders of magnitude larger than the equilibrium mass in solids.
In calculations with larger , the structure of the disk and the rate of mass accretion onto the white dwarf oscillate between low and high states. Fig. 5 shows the evolution for five simulations with = 100 km and = . When is large, the evolution is smooth. The mass accretion rate onto the white dwarf gradually increases to the plateau value in yr. As the input drops, high states becomes more and more episodic. On time scales of 0.1–1 Myr, the variations in grow from 5% at = to 50% at = to 2 orders of magnitude at = to 6–8 orders of magnitude at = .
Although the time scale for changes in depends on and , the overall fluctuations are sensitive only to and . When is large and is small, varies by many orders of magnitude over 0.1–1 Myr time scales. Smaller and larger smooth out the variations in .
For calculations with = 30–100 km and , the typical mass in the disk is close to the equilibrium mass in eq. 7. Due to stochastic variations in , the mass varies by 10%–20% about the equilibrium mass. Smaller leads to large oscillations in and similarly large variations in . When the collisional cascade generates large , the maximum disk mass is roughly g for = 1500 K and = . This maximum mass scales with and as in eq. 7. During low states, g. Throughout a single oscillation, the total variation in is more than fifteen orders of magnitude.
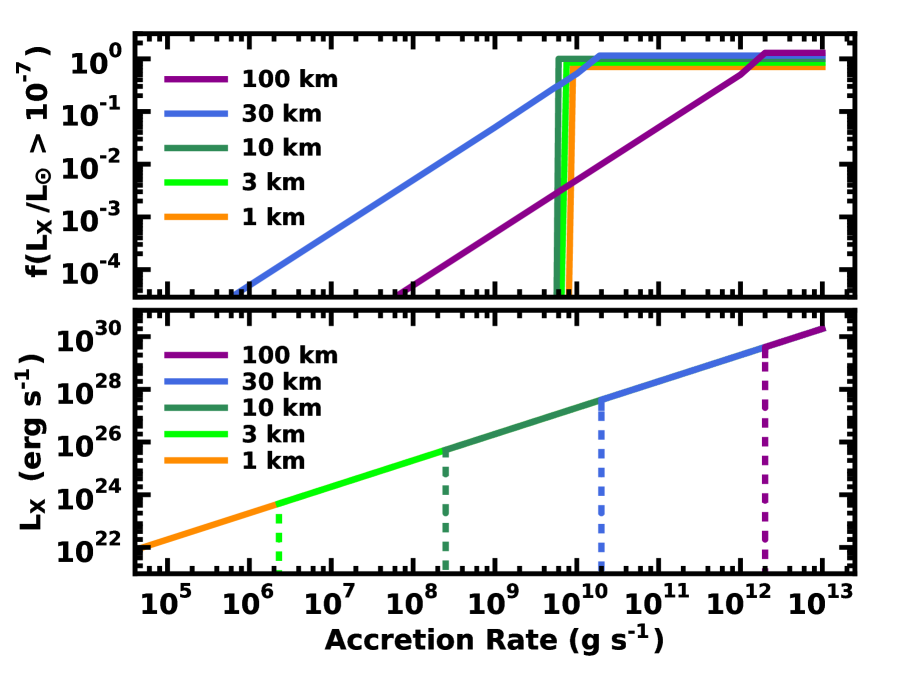
For all systems, the fraction of time in the high state is a strong function of and (KB2017). In principle, the variation of the mass in gas provides a reasonable proxy for the time spent in high and low states. However, detecting the gas depends on the thermodynamic state of the disk and the ability of spectrographs to distinguish absorption or emission lines produced in the disk from those generated in the white dwarf photosphere. The X-ray luminosity probably enables a clearer picture. Despite uncertainties in the likely X-ray temperature, the X-ray luminosity provides an instantaneous measure of the accretion rate from the disk onto the white dwarf (e.g., Kuulkers et al., 2006; Pretorius & Knigge, 2012; Reis et al., 2013, and references therein).
To predict the X-ray luminosity, we assume that half of the accretion energy is radiated in a boundary layer between the disk and the white dwarf (e.g., Lynden-Bell & Pringle, 1974) or at the base of a magnetic accretion column (e.g., Ghosh & Lamb, 1979). Ignoring factors of order unity, . The fraction of time with with integer follows directly from our calculations.
Fig. 6 plots our results. In the lower panel, the solid curve indicates the X-ray luminosity as a function of the accretion rate onto the white dwarf, erg s-1. When the mass input rate for solids is large, , the collisional cascade steadily feeds the gaseous disk. Accretion onto the white dwarf is also steady. When falls below , the X-ray luminosity varies between low states with 0 and erg s-1. The vertical dashed lines in the lower panel indicate the critical for values of listed in the legend.
The upper panel in Fig. 6 shows predictions for the fraction of time a system spends with . For systems with 10 km, and the X-ray luminosity are nearly constant in time. The white dwarf is above the reference luminosity all of the time or none of the time. When is larger, episodic evolution of leads to a broad range of X-ray luminosities for any combination of and . In our calculations, swarms with = 30 km are detectable X-ray sources at least some of the time. The windows for detecting swarms with 100 km are much smaller.
As an illustration of the utility of Fig. 6, we consider two examples. For a system with = 10 km, the critical accretion rate and X-ray luminosity are and erg s-1. When , we expect an accretion luminosity along the diagonal solid curve in the lower panel. For smaller accretion rates, the system has between zero and . This critical is smaller than . Thus, the fraction of time with is zero.
For a second example, suppose a metallic line white dwarf has . The implied accretion rate is . In the lower panel, this rate is larger than (smaller than) critical rates for = 1–20 km (25–100 km). Thus, this system could have a steady-state collisional cascade with 10 km or an intermittent cascade with 25 km. Moving to the upper panel, the fraction of time systems with = 1–10 km spend in this high state is either unity (if ) or zero (if ). Systems with = 30 km (100 km) spend all of their time at or above this when ( ). Otherwise, the fraction of time spent at this is roughly .
In these examples, a single observation places few constraints on the model. Surveys with at least 10–20 detections or upper limits begin to carve out allowed sections of (, ) space. Combined with estimates of accretion rates derived from photospheric abundance measurements, these data begin to test the model.
4 DISCUSSION
4.1 Simple Physical Model for Metallic Line White Dwarfs
In KB2017 and this paper, we have described a simple physical model for the delivery of metals to a white dwarf photosphere. In this model, at least one mechanism places large asteroids with radius and mildly eccentric orbits into a ring near the Roche limit of a white dwarf at a constant rate . Interactions among the solids generate a collisional cascade, which produces swarms of 1 dust grains. Vaporization of the grains feeds a ring of gas. Viscous processes spread the ring into a disk; material from the disk accretes onto the central white dwarf.
The main parameters in this picture are and . When , the solids find an equilibrium state where (i) , the vaporization rate of the grains, roughly equals and (ii) the mass of the gaseous disk and the X-ray luminosity are roughly constant in time. Small solids with 1 km find equilibrium with relatively small . Larger solids with = 10 km (100 km) require input rates ( ). Once the system achieves equilibrium, metals accrete onto the white dwarf at a rate 0.9 . Although most of the vaporized metals accrete onto the white dwarf, viscosity spreads some of the mass to large distances from the central star.
When , the time for the ring to accumulate enough solids for a collisional cascade is longer than the time scale for the cascade to deplete the ring of solids. In these circumstances, the system oscillates between low states (where the mass in solids slowly grows with time, , and the X-ray luminosity is negligible) and high states (where the mass rapidly declines with time, , and the X-ray luminosity is substantial). As long as the viscous time scale is shorter than the cycle time between high and low states, the mass accretion rate onto the white dwarf varies by orders of magnitude on time scales of thousands to millions of years.
In a more realistic system where and vary on short time scales, the behavior of the solids and the gaseous disk depends on the variability time scale. When the cascade is active, the collision time for the largest objects ranges from the orbital period (for large ) to a few months (for small ). On this time scale, the cascade adjusts the vaporization rate and the production rate of small particles to match the time-variable and . In this way, changes in and can generate substantial variations in the IR excess from 1 particles and the amount of gas near the Roche limit on week or longer time scales.
When , the viscous time is roughly orbital periods, 10 yr. In an active cascade , variations in and for the solids produce similar scale fluctuations in . Although variability in correlates with changes to the IR excess and the amount of gas near the Roche limit, there is a 10 yr or longer delay between rises/drops in and the IR excess. This delay is roughly proportional to . When the cascade is not active, and are close to zero. Substantial variations in and are invisible.
In any of the examples we studied, the vertical scale height of the solids remains large. If solids have = 0.01 and inclination , the cascade removes solids faster than collisional damping can reduce the vertical scale height (KB2017). Thus, the solids do not evolve into the optically thick, vertically thin structure originally suggested by Jura (2003).
4.2 Comparisons with Previous Results
Although our approach is the first to combine collisional evolution of solids with viscous diffusion of gas, other investigators have treated aspects of these phenomena in the context of metallic line white dwarfs. In this sub-section, we compare the methodologies and results of these studies with our own.
Brown et al. (2017) consider the tidal destruction, sublimation, and ultimate fate of rocky and icy asteroids with periastron distances . In this situation, large solids tidally fragment; small solids are tidally stable but sublimate. Delivery of material onto the white dwarf then depends on the initial radius, composition, and for each asteroid. In a manner similar to meteors encountering the Earth, larger fragments ablate in the white dwarf atmosphere; icy fragments ablate more rapidly than rocky ones. Smaller fragments often sublimate before reaching the atmosphere; the resulting gas then rains down onto the white dwarf. With no calculation for the long-term evolution of gas, estimates for rely on the rate of direct collisions of asteroid with the white dwarf or assumptions on the subsequent evolution of gas orbiting the white dwarf.
Our somewhat different analysis of tidal forces (KB2017) indicates that solids with 100 km and = 3 are stable at distances , where is the distance of the Roche limit from the center of the white dwarf (see also Veras et al., 2017). Our calculations do not address the fate of solids at smaller . Although our conclusions on the sublimation of large particles are similar to Brown et al. (2017), the sublimation time for particles with radii 1 is longer than the collision time throughout the collisional cascade. Thus, it is reasonable for us to neglect sublimation for large particles and focus on the sublimation of the smallest particles that feed the gaseous disk. Compared to Brown et al. (2017), our estimates for rely on viscous diffusion through a gaseous disk instead of direct collision with the white dwarf.
In their investigation of the evolution of disks containing cm-sized solids interacting with a viscous, gaseous disk, Metzger et al. (2012) solve a radial diffusion equation similar to our eq. 1 (see also Rafikov, 2011a, b; Bochkarev & Rafikov, 2011; Rafikov & Garmilla, 2012). Adopting a very small vertical scale height for the solids, they treat the back-reaction of the solids on the gas; in our treatment, the much larger vertical scale height of the solids implies a negligible back-reaction which is safely ignored. While we adopt a constant and allow the disk temperature to vary with distance from the central star, Metzger et al. (2012) adopt a constant disk temperature and let vary with radius. For a similar , the magnitude and variation of – which controls the evolution of the surface density of the gas – is similar in the two approaches. The time scale for a ring of gas to accrete onto the star from some distance is also similar.
Adopting a fixed initial mass for the solids, , Metzger et al. (2012) derive as a function of and other properties of the solids and the gas. When the solids are optically thin (thick), is roughly 100 times smaller (larger) than the rate generated by PR drag, . Interactions between opaque disks of solids and gas can also generate large time-variations in . In contrast, the derived in our calculation depends on an adopted input rate and typical radius for solids near the Roche limit; oscillations in occur when is small and is large.
Bear & Soker (2013) combine an analysis of tidal disruption (similar to Brown et al., 2017) with a simple treatment for viscous disk evolution (compared to Metzger et al., 2012) to propose that infalling asteroids drive transient accretion events similar to those associated with supermassive black holes at the centers of galaxies (e.g., Rees, 1988; Cannizzo et al., 1990; Gezari et al., 2009; Lodato & Rossi, 2011; Bromley et al., 2012; Kochanek, 2016, and references therein). Assuming that (i) a massive ( g) asteroid is completely converted into gas by collisions and sublimation, (ii) the gas has a high temperature derived from the kinetic energy of infall, and (iii) the gas lies in a vertically thin, optically thick disk, they infer a peak accretion rate exceeding and X-ray luminosity exceeding over a typical lifetime of a few days to a few weeks.
In our approach, the collision velocities of asteroid fragments on 1 orbits are set by the velocity dispersion of the fragments, not their orbital velocity. Numerical simulations suggest tidal disruption of asteroids generates a long string of fragments along an orbit with similar and as the original asteroid (e.g., Debes et al., 2012b). Unless other processes change and , we expect low velocity collisions among the fragments to produce a cascade similar to those calculated here. With most interactions near periastron of a large orbit, modest vaporization results in gas ejected from the orbit. Subsequent evolution of the gas depends on the collision frequency, the vaporization of small particles, and the temperature and viscosity of the gas. Detailed numerical simulations are necessary to learn the fate of this material; we speculate that the white dwarf accretes gas with a typical temperature of K at some modest background rate set by continuous vaporization of small particles, with occasional flares from the production of debris from collisions of larger fragments.
To constrain the frequency and sizes of accreted asteroids among metallic line white dwarfs, Wyatt et al. (2014) explore analytical estimates and Monte Carlo calculations which consider how derived accretion rates depend on the gravitational settling time in the white dwarf atmosphere, the distributions of accretion rates and masses for accreted asteroids, and the typical time scale for vaporized solids to accrete onto the white dwarf. Their results suggest that white dwarfs accrete solids ranging in size from 1–10 km to 100–1000 km at rates ranging from to with a median of . Smaller solids are much more common than larger solids. In DA white dwarfs with short settling times, accretion of 1–30 km objects is nearly continuous. Asteroids with radii of 30–100 km dominate the pollution of non-DA white dwarfs with much longer settling times. The time scale for a gaseous disk to deposit metals onto the white dwarf photosphere is 20–1000 yr.
Our calculations are consistent with these results. Disk time scales of 20–1000 yr imply = 0.05–, close to the range deduced in the accreting white dwarfs of cataclysmic variables (e.g., Smak, 1999; King et al., 2007; Kotko & Lasota, 2012). For the range of accretion rates derived in Wyatt et al. (2014), our analysis suggests continuous accretion for = 1–10 km and episodic accretion for 30 km. The division between episodic and continuous accretion agrees rather well with the expectations for DA and non-DA white dwarfs from Wyatt et al. (2014).
Overall, these and other analyses paint a fairly coherent picture for the transport of metals from a region near the Roche limit onto the surface of a white dwarf. In some fashion, dynamical processes regularly transport material from large to the Roche limit of the white dwarf (Wyatt et al., 2014). Well inside the Roche limit, tidal forces disrupt the solids into fragments (e.g., Holsapple & Michel, 2006, 2008; Debes et al., 2012b; Bear & Soker, 2013; Veras et al., 2014a, 2017; Brown et al., 2017). If large solids or disrupted fragments begin to collide, they are rapidly ground into small dust grains (KB2017, this paper). UV radiation from the white dwarf rapidly sublimates small solids and slowly evaporates larger objects (this paper; see also Veras et al., 2015a; Brown et al., 2017). Viscous processes transport vaporized solids to the central star (this paper; see also Metzger et al., 2012; Bear & Soker, 2013).
Despite the attractiveness of this picture, there are many uncertainties. Plausible mechanisms for delivering solids to the Roche limit have few observational constraints (e.g., Debes et al., 2012b; Frewen & Hansen, 2014; Veras et al., 2015b; Payne et al., 2016; Hamers & Portegies Zwart, 2016; Antoniadou & Veras, 2016; Brown et al., 2017). Models for disk evolution are rather simple, with limited treatment of interactions between the solids and the gas. Aside from explaining the transport of solids to the white dwarf, it is not yet clear whether the model can account for other aspects of observations. In the next few sub-sections, we comment on these issues in more detail.
4.3 Delivery of Solids to the Roche Limit
Various groups have considered the delivery of solid objects to a volume within the Roche limit of a white dwarf (e.g., Debes & Sigurdsson, 2002; Veras et al., 2014b; Veras & Gänsicke, 2015; Bonsor & Veras, 2015; Antoniadou & Veras, 2016; Veras, 2016; Payne et al., 2017; Brown et al., 2017; Petrovich & Muñoz, 2017; Stephan et al., 2017; Caiazzo & Heyl, 2017). All models begin with a main sequence star and a surrounding planetary system. While on the main sequence, the nearly constant luminosity of the central star establishes the ‘snow line’, which marks the boundary between an inner ‘terrestrial’ region with little volatile material and an outer ‘icy’ region where volatiles can condense from the gas phase onto solids (e.g., Kennedy & Kenyon, 2008). As the central star evolves into a red giant and then an asymptotic branch giant, the increasing luminosity of the central star moves the snow line outward and bakes solids between the ‘original’ and ‘new’ snow lines (Stern et al., 1990; Parriott & Alcock, 1998; Villaver & Livio, 2007; Dong et al., 2010; Bonsor et al., 2011; Veras et al., 2013; Mustill et al., 2014; Malamud & Perets, 2016, 2017a, 2017b). The slowly decreasing mass of the central star also results in an expansion and possible destabilization of orbiting solids. If destabilization is sufficiently traumatic, solids can attain extremely eccentric orbits with periastra inside the Roche limit of the white dwarf central star. After some number of passes close to the white dwarf, tidal forces disrupt the solids into much smaller objects.
In addition to a lack of agreement on the mechanism(s) that place(s) solids on very eccentric orbits, it is unclear how the orbits of small solids objects evolve from = 0.99 to 0.1. Although we do not address this issue directly, our calculations provide some constraints on likely outcomes of plausible paths from high to small orbits. In mechanisms where long-term dynamical processes such as PR drag gradually circularize the orbits (e.g., Veras et al., 2014a), the long-term outcome is probably similar to that outlined here (see also KB2017): once the orbits of the solids cross, a collisional cascade generates small objects which vaporize and feed a gaseous disk. Although the geometry and observable properties of the cascading solids and the disk depend on the mass and orbital properties of the incoming solids, outcomes are probably similar to those outlined here.
If long-term dynamical solutions are unreliable, our results indicate that collisions are insufficient to reduce and dramatically on their own. Some other mechanism is required. If two asteroids with large collide inside the Roche limit, they probably vaporize. The gas released from this collision might be sufficient to reduce for other asteroids following similar paths around the white dwarf. Interactions between incoming asteroids with the magnetic field of the white dwarf may generate sufficient electromagnetic induction and Ohmic dissipation to reduce on time scales ranging from a few Myr to several Gyr (Bromley & Kenyon, in preparation; see also Li et al., 1998).
Incorporating any mechanism for the delivery of solids to the Roche limit into our calculations requires more comprehensive theoretical predictions of outcomes for the evolution of gas and solids as the central star begins to evolve into a white dwarf. For example, detailed predictions for the distributions of , , , and for swarms of solids outside the Roche limit would allow us to learn how outcomes for the delivery of solids to the white dwarf depend on the delivery mechanism.
4.4 Improved Models for Evolution of the Gas
In this first exploration of the evolution of a gaseous disk fed by a collisional cascade, we assume the gas is axisymmetric and adopt a simple prescription for the disk temperature (see also Jura, 2008; Melis et al., 2010). Although our approach is reasonable, we outline several possible improvements for future studies.
By analogy with the circumstellar disks in cataclysmic variables (Meyer & Meyer-Hofmeister, 1982; Mineshige & Osaki, 1983; Cannizzo & Wheeler, 1984) and pre-main sequence stars (D’Alessio et al., 1998; Najita et al., 2011, 2013), we expect a complex temperature structure for gas fed by a collisional cascade. For optically thin disks where the solids have negligible vertical scale height (), Melis et al. (2010) derived the radial temperature structure outside 25 for an ionized gas with Mg, Si, Ca, and Fe. However, our disks have ; an improved calculation should include interactions between the gas and dust. As one example, combining the formalism of Najita et al. (2013) with our derived radial surface density distribution should enable calculations of the radial and vertical temperature structure from the inner edge of the disk out past the Roche limit. Since the evolution of depends on , a better prescription for would yield a better connection between the input (, ) and the output and .
Our solution of the radial diffusion equation assumes the white dwarf has a negligible magnetic field. When the field has a modest strength, it can truncate the disk and channel gas directly onto the white dwarf photosphere (e.g., Ghosh & Lamb, 1979; Metzger et al., 2012; Mukai, 2017, and references therein). In some configurations, the field might be able to trap dust and gas in the magnetosphere (e.g., Farihi et al., 2017a). If most metallic line white dwarfs have modest to large magnetic fields, it will be necessary to address whether the field has any impact on small particles in the collisional cascade.
Eventually, it should be possible to relax the assumption of an axisymmetric disk. Our calculations assume that vaporization places material uniformly within an annulus. In a real system, vapor generated from collisions of 1 km and larger solids is clumpy. Naively, we expect more clumpiness from collisions of larger objects. The azimuthal structure of the disk then depends on the viscous time scale relative to the time scale for collisions of the largest objects. When the viscous time scale is shorter than the collision time, viscosity rapidly spreads out blobs of gas; the disk is more axisymmetric. When the collision time is shorter than the viscous time, small particles are vaporized faster than viscous shear can spread the gas. The disk is then more asymmetric.
4.5 Gas Drag
Although we have not included interactions between the solids and gas in our simulations, it is straightforward to show that the gas has little impact on collisional cascades with = 0.01. In protoplanetary and circumplanetary disks, massive solid objects modify the density structure of the gas (e.g., Ward, 1997; Tanaka et al., 2002; Masset & Papaloizou, 2003; Nelson & Papaloizou, 2004; Ida & Lin, 2008; Lyra et al., 2010; Bromley & Kenyon, 2011b, 2013, and references therein); gravitational torques generated by these structures induce radial migration of the solids. For gaseous disks inside the Roche limit, the time scale for migration is rarely shorter than the viscous time but is much shorter than the cooling time for the white dwarf. Thus, stable solids could migrate on interesting time scales. However, these time scales are much longer than the collision time. In the context of our calculations, migration is safely ignored.
In any disk with finite pressure, the gas orbits the central star somewhat more slowly than solids following Keplerian orbits (e.g., Adachi et al., 1976; Weidenschilling, 1977; Youdin & Chiang, 2004; Youdin, 2010; Youdin & Kenyon, 2013, and references therein). The solids then feel a headwind, , where is the orbital velocity of the gas. The response to the headwind depends on the ‘stopping time’ required for an orbiting particle to encounter its mass in gas. When the stopping time is much longer than the orbital period, , solids do not respond to the gas. Solids with are entrained in the gas and drift inward or outward on the local viscous time. In between these two limits, solids drift radially inward with a maximum drift velocity (Adachi et al., 1976; Weidenschilling, 1977).
To derive the radial drift speed as a function of particle radius, we follow the formalism of Weidenschilling (1977) and consider drift in axisymmetric disks with a radial surface density generated by our solution to the diffusion equation, eq. 1. Given a derived and an adopted , , and , we infer the gas density and pressure required to establish radial drift rates. Defining = as the central gravity and as the residual gravity, the headwind is (Weidenschilling, 1977)
| (8) |
As a measure of the drift speed relative to the local orbital velocity, it is useful to define
| (9) |
Weidenschilling (1977) decomposed the motion into a radial drift and a transverse drift , which depend on and particle size. Takeuchi & Artymowicz (2001) later generalized the Weidenschilling (1977) approach to disks where Poynting-Robertson (PR) drag and radiation pressure are relevant. As in Kenyon et al. (2016), we derive and as a function of particle size for a system with radiation pressure but no PR drag. As discussed in KB2017, the time scale for PR drag is much longer than the collision time. Our goal is to learn whether gas drag or radiation pressure can produce radial drift of small particles on time scales shorter than the collision time. Thus, PR drag is safely ignored.
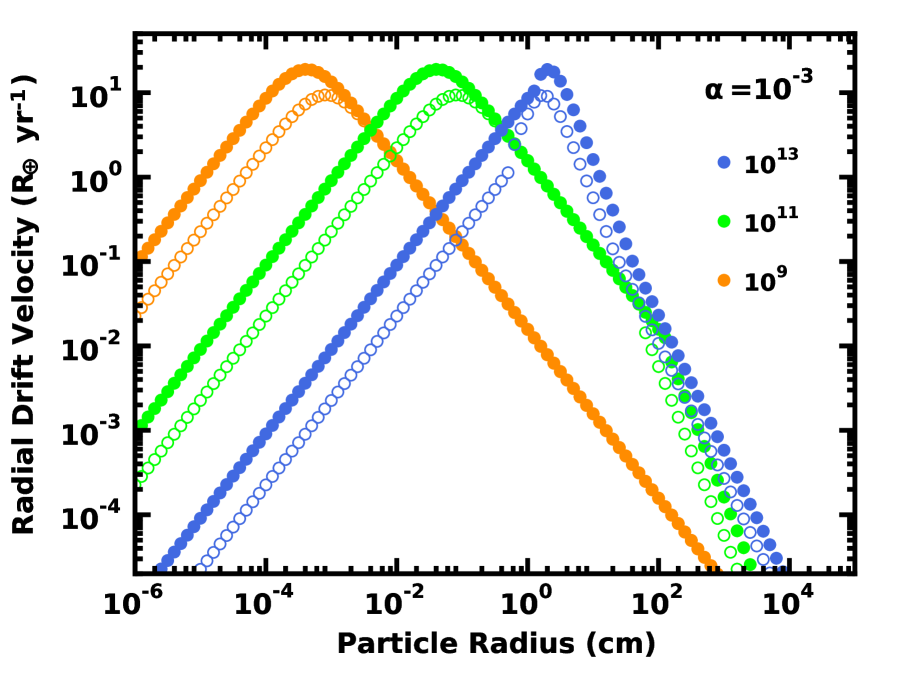
Fig. 7 illustrates results for particle drift at = 1.15 (within the ring of solids) in a gaseous disk with the equilibrium mass, , no radiation pressure, and = 1500 K (open circles) or = 3000 K (open circles). The legend indicates the input . For all systems, the maximum drift rate relative to the gas is 10–20 yr-1. With (Weidenschilling, 1977), particles in cooler disks drift more slowly. Moving away from each maximum in the Figure, smaller particles have successively lower drift rates until they orbit with the gas. Larger particles drift more slowly because they have too much inertia for the gas to move. These particles follow Keplerian orbits.
Overall, it is clear from Fig. 7 that the radius of particles with the maximum drift velocity becomes smaller with smaller input . Lower input rates generate disks with lower surface density and mass density . During one orbit of the central star, particles see less mass in disks with smaller than in disks with larger . Particles in less massive disks have larger stopping times and are therefore less entrained in the gas. Thus, the maximum drift velocity moves to smaller particle size with decreasing .
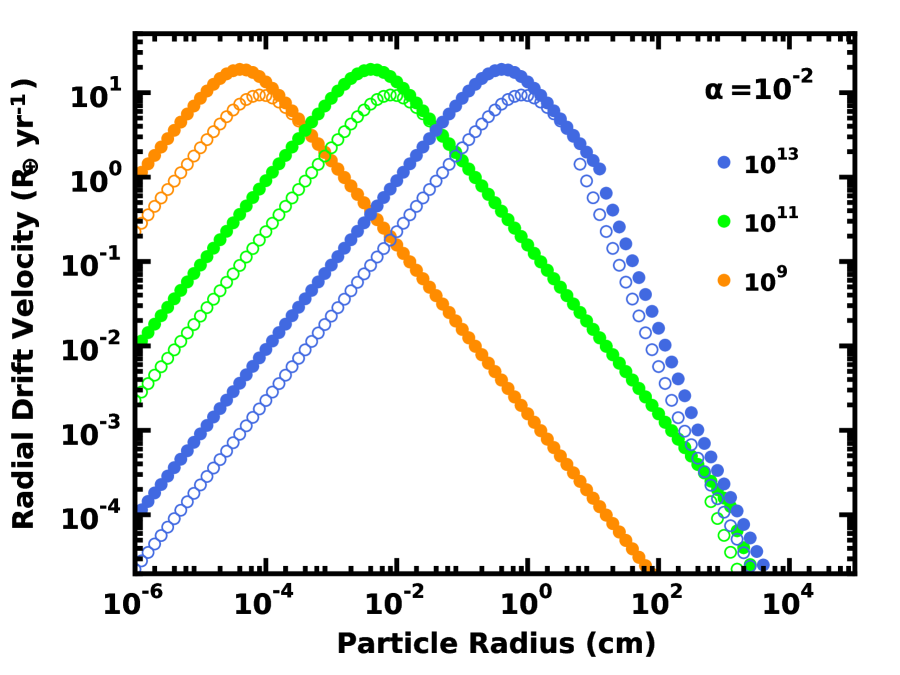
Increasing the disk viscosity parameter has the same impact as decreasing (Fig. 8). For disks with the same and , those with larger have larger viscosity, lower masses, smaller , and larger stopping times (e.g., Lynden-Bell & Pringle, 1974; Weidenschilling, 1977). Compared to Fig. 7, the maximum particle velocity in disks with is shifted to smaller particle sizes. Otherwise, the general variation of the drift velocity with particle size is fairly independent of .
To derive these results, we assume that the solids and gas are well-mixed, with . In our simulations, however, . Because the solids travel through the gas only 10% to 20% of each orbit, the actual drift rates are 80% to 90% smaller than suggested by Figs. 7–8. Thus, the typical maximum drag rate is 2–4 yr-1.
Despite these large maximum drift velocities, the drift time is still much longer than the collision time. With a drift velocity of 2–4 yr-1, it takes more than a decade for a particle to cross our adopted ring of solids. For particles with = 0.3–3 cm ( = ), = 0.1–1 mm ( = ), or = 1–10 ( = ), the collision time for a ring with the equilibrium mass in solids is s. Thus, the collisional cascade removes small particles well before gas drag produces a significant radial drift.
In addition to producing a radial drift, the gas damps the orbital and of particles with (Adachi et al., 1976; Weidenschilling, 1977). The damping time scale is comparable to the time scale for radial drift. With the radial drift time much longer than the collision time, the gas cannot reduce the vertical scale height of small solids before the collisional cascade grinds them to dust.
Including radiation pressure has a modest impact on this conclusion. Following Burns et al. (1979), we define the ratio of the radiation pressure to the local gravity:
| (10) |
where is the Mie scattering coefficient and is the speed of light. For a 0.6 white dwarf with , . With no gas in the system, small grains do not respond to radiation pressure before they are vaporized. Once small grains are entrained in the gas, however, radiation becomes more important (Takeuchi & Artymowicz, 2001). With a radial drift velocity of , grains with () drift radially out (in) through the gas (Takeuchi & Artymowicz, 2001; Kenyon et al., 2016).
For the physical conditions adopted in Figs. 7–8, small grains with 1 to 1 mm drift outward at speeds of 1–100 yr-1. Correcting for the small fraction of time grains with large spend interacting with the gas, it takes grains more than a year to move out of our model annulus at 1.15 . Compared to the time scale for the collisional cascade, these drift rates are still negligible.
To identify situations where gas drag is important, we consider the physical conditions in the solids when the time scale for radial drift is comparable to the collision time. For simplicity, we set . From eq. 8 of KB2017, the collision time for a particle with radius in a swarm of solids within our model annulus is
| (11) |
where is the total mass in solids. Setting the collision time to 1 yr yields the mass where the collision time is roughly equal to the drift time, g. Setting this mass equal to the equilibrium mass of solids in eq. 3 allows us to derive the input rate of solids, , which generates a gas+solid configuration where the collision time is comparable to the drift time. This rate is rather large, . At this rate, the particle size with the maximum drift velocity is roughly 1 km. The much smaller accretion rates observed in metallic line white dwarfs precludes this option.
We conclude that gas drag has little impact on the evolution of the collisional cascade. For reasonable , the collision time is always much shorter than the radial drift time. The physical conditions that allow the drift time to be comparable to the collision time are very unlikely.
4.6 Contacts with Observations
In KB2017 and this paper, we have considered collisional cascades as a plausible mechanism to place metals in white dwarf photospheres. However, the lack of robust delivery mechanisms and the simplicity of our initial calculations limit our ability to explain existing observations. As in KB2017, we list several points of contact between current data and theoretical predictions.
-
•
Circumstellar gas has now been observed in a reasonably large sample of metallic line white dwarfs (e.g. Gänsicke et al., 2006, 2007, 2008; Melis et al., 2010; Farihi et al., 2012; Melis et al., 2012; Debes et al., 2012a; Wilson et al., 2014; Manser et al., 2016b; Hartmann et al., 2016; Manser et al., 2016a; Xu et al., 2016; Li et al., 2017; Redfield et al., 2017; Melis & Dufour, 2017). In some cases, the data place limits on the surface density of the gas (Hartmann et al., 2016). Although other models match the observations (e.g., Metzger et al., 2012), cascades with routinely achieve the observed surface densities.
-
•
Among systems with repeat observations, variable emission (absorption) features in the gas are common (rare) (e.g., Wilson et al., 2014; Manser et al., 2016b, a; Redfield et al., 2017; Melis & Dufour, 2017, and references therein). On one occasion, features appear and then slowly fade over time scales of months to years. More often, consistently visible features vary on short time scales. In the cascade picture, occasional large-scale collisions can generate a gaseous disk which fades from view before the next collision replenishes the disk. During the peak of a cascade, short-term variations in result from stochastic variations in the vaporization rate.
-
•
In any cascade model, large and correlate with large and significant IR excesses. Observations appear to support this correlation (e.g., Manser et al., 2016a). More comprehensive cascade calculations should allow more robust predictions for comparisons with existing data.
-
•
Contrary to our assumptions, current observations indicate that gaseous disks are not axisymmetric. Large collision events among the solids are not axisymmetric; proper treatment of the vapor generated in these collisions might produce gaseous structures similar to those observed.
-
•
X-ray observations provide an interesting window into the transport of material from the Roche limit to the white dwarf photosphere. From our calculations, we expect (i) fairly steady X-ray sources when and are nearly constant in time and (ii) dramatically variable X-ray sources when is large and is small (or variable). Unless the incoming gas is channeled by a magnetic field, both sets of objects should display the characteristic ‘flickering’ of accreting systems (e.g., Sokoloski & Kenyon, 2003; Maoz et al., 2015). Although constraints on the X-ray luminosities of metallic line white dwarfs are limited (e.g., Farihi et al., 2017b; Rappaport et al., 2017, and references therein), there are some single white dwarfs with hard X-rays of unknown origin (e.g., Chu et al., 2004; Bilíková et al., 2010). Coupled with good limits on emission from an IR excess and circumstellar gas, broader surveys for X-ray emission among metallic line white dwarfs provide strong tests of theoretical models.
5 SUMMARY
We consider the evolution of a gaseous disk fed by a collisional cascade of solids orbiting within a narrow ring at the Roche limit of a low-mass white dwarf. In our picture, solids with radius , eccentricity , and inclination arrive in the ring at a rate . Once the mass in solids reaches a critical level, destructive collisions fuel a collisional cascade which grinds the solids into 1 particles. Rapid vaporization of these small grains produces a ring of metallic gas coincident with the ring of solids. As the cascade continues, the ring of gas expands into a disk which extends from the surface of the white dwarf out past the Roche limit. The disk transports metals originally in the solids onto the white dwarf photosphere.
The evolution of the gaseous disk depends on the properties of the solids ( and ) and the properties of the gas (, the viscosity parameter, and , the gas temperature). Systems with find a steady equilibrium state where the vaporization rate equals . Once the ring of gas spreads into an extended disk, , the accretion rate from the disk onto the central star, is roughly 90% of . With a nearly constant rate of mass flow through the disk, the surface density at any distance from the central star scales inversely with and .
When is smaller, , it takes a long time for the ring to collect enough solids to begin the collisional cascade. During this low state, the vaporization rate and are much much smaller than . Once the collisional cascade begins, and (somewhat later) grow very rapidly. During the most intense part of the cascade, and become much larger than . The mass in solids then slowly decreases, reducing and . Eventually, the cascade ceases; and drop precipitously. As long as the ring continues to accrete solids at some low rate, the cycle of low and high states repeats.
When a system oscillates between low and high states, and set the time scales (i) for the newly-formed ring of gas to spread into a disk at the start of the cascade, and (ii) for the extended disk of gas to drain onto the central star when the cascade ends. The time scale for a ring of gas near the Roche limit to spread to the stellar photosphere is roughly yr; the draining time is 5–10 times the spreading time.
As in our previous calculations, the vertical scale height of the solids remains large throughout the cascade. A revised analysis demonstrates that gas drag has little impact on the evolution of the solids. Together with results in KB2017, it seems unlikely that some combination of collisional, gas dynamical, or radiative processes can reduce the vertical scale height of the solids, cm, to levels required in the Jura (2003) model, 100–1000 cm.
Aside from ultraviolet, optical, and infrared spectroscopy, X-ray fluxes provide strong constraints on theoretical models for gaseous disks in metallic line white dwarfs. In systems where and vary with time, we expect occasional bright states with and long-lived faint states with much smaller . By analogy with cataclysmic variables, the X-ray temperature during the high state depends on the geometry and optical depth of the accreting material (e.g., Mukai, 2017, and references therein). Deep surveys with existing (e.g Bilíková et al., 2010; Kastner et al., 2012, and references therein) and planned (e.g., Predehl, 2014) X-ray facilities can test these ideas.
We acknowledge generous allotments of computer time on the NASA ‘discover’ cluster. We thank J. Farihi, M. Geller, M. Payne, S. Rappaport, A. Vanderburg, and D. Veras for advice, comments, and encouragement. Comments from an anonymous referee greatly improved our presentation. Portions of this project were supported by the NASA Outer Planets and Emerging Worlds programs through grants NNX11AM37G and NNX17AE24G.
References
- Adachi et al. (1976) Adachi, I., Hayashi, C., & Nakazawa, K. 1976, Progress of Theoretical Physics, 56, 1756
- Alcock et al. (1986) Alcock, C., Fristrom, C. C., & Siegelman, R. 1986, ApJ, 302, 462
- Alcock & Illarionov (1980) Alcock, C., & Illarionov, A. 1980, ApJ, 235, 541
- Antoniadou & Veras (2016) Antoniadou, K. I., & Veras, D. 2016, MNRAS, 463, 4108
- Barber et al. (2014) Barber, S. D., Kilic, M., Brown, W. R., & Gianninas, A. 2014, ApJ, 786, 77
- Barber et al. (2012) Barber, S. D., Patterson, A. J., Kilic, M., et al. 2012, ApJ, 760, 26
- Bath & Pringle (1981) Bath, G. T., & Pringle, J. E. 1981, MNRAS, 194, 967
- Bath & Pringle (1982) —. 1982, MNRAS, 199, 267
- Bear & Soker (2013) Bear, E., & Soker, N. 2013, New A, 19, 56
- Bergfors et al. (2014) Bergfors, C., Farihi, J., Dufour, P., & Rocchetto, M. 2014, MNRAS, 444, 2147
- Bilíková et al. (2010) Bilíková, J., Chu, Y.-H., Gruendl, R. A., & Maddox, L. A. 2010, AJ, 140, 1433
- Bochkarev & Rafikov (2011) Bochkarev, K. V., & Rafikov, R. R. 2011, ApJ, 741, 36
- Bonsor et al. (2017) Bonsor, A., Farihi, J., Wyatt, M. C., & van Lieshout, R. 2017, MNRAS, 468, 154
- Bonsor et al. (2011) Bonsor, A., Mustill, A. J., & Wyatt, M. C. 2011, MNRAS, 414, 930
- Bonsor & Veras (2015) Bonsor, A., & Veras, D. 2015, MNRAS, 454, 53
- Bromley & Kenyon (2011a) Bromley, B. C., & Kenyon, S. J. 2011a, ApJ, 731, 101
- Bromley & Kenyon (2011b) —. 2011b, ApJ, 735, 29
- Bromley & Kenyon (2013) —. 2013, ApJ, 764, 192
- Bromley et al. (2012) Bromley, B. C., Kenyon, S. J., Geller, M. J., & Brown, W. R. 2012, ApJ, 749, L42
- Brown et al. (2017) Brown, J. C., Veras, D., & Gaensicke, B. T. 2017, MNRAS, 468, 1575
- Burns et al. (1979) Burns, J. A., Lamy, P. L., & Soter, S. 1979, Icarus, 40, 1
- Caiazzo & Heyl (2017) Caiazzo, I., & Heyl, J. S. 2017, MNRAS, 469, 2750
- Cannizzo et al. (1990) Cannizzo, J. K., Lee, H. M., & Goodman, J. 1990, ApJ, 351, 38
- Cannizzo & Wheeler (1984) Cannizzo, J. K., & Wheeler, J. C. 1984, ApJS, 55, 367
- Chu et al. (2004) Chu, Y.-H., Guerrero, M. A., Gruendl, R. A., & Webbink, R. F. 2004, AJ, 127, 477
- Chu et al. (2011) Chu, Y.-H., Su, K. Y. L., Bilikova, J., et al. 2011, AJ, 142, 75
- Cottrell & Greenstein (1980) Cottrell, P. L., & Greenstein, J. L. 1980, ApJ, 242, 195
- D’Alessio et al. (1998) D’Alessio, P., Canto, J., Calvet, N., & Lizano, S. 1998, ApJ, 500, 411
- Debes et al. (2011) Debes, J. H., Hoard, D. W., Wachter, S., Leisawitz, D. T., & Cohen, M. 2011, ApJS, 197, 38
- Debes et al. (2012a) Debes, J. H., Kilic, M., Faedi, F., et al. 2012a, ApJ, 754, 59
- Debes & Sigurdsson (2002) Debes, J. H., & Sigurdsson, S. 2002, ApJ, 572, 556
- Debes et al. (2012b) Debes, J. H., Walsh, K. J., & Stark, C. 2012b, ApJ, 747, 148
- Dong et al. (2010) Dong, R., Wang, Y., Lin, D. N. C., & Liu, X.-W. 2010, ApJ, 715, 1036
- Farihi (2016) Farihi, J. 2016, New A Rev., 71, 9
- Farihi et al. (2012) Farihi, J., Gänsicke, B. T., Steele, P. R., et al. 2012, MNRAS, 421, 1635
- Farihi et al. (2009) Farihi, J., Jura, M., & Zuckerman, B. 2009, ApJ, 694, 805
- Farihi et al. (2017a) Farihi, J., von Hippel, T., & Pringle, J. E. 2017a, MNRAS, 471, L145
- Farihi et al. (2017b) Farihi, J., Fossati, L., Wheatley, P. J., et al. 2017b, ArXiv e-prints, arXiv:1709.08206
- Frewen & Hansen (2014) Frewen, S. F. N., & Hansen, B. M. S. 2014, MNRAS, 439, 2442
- Gänsicke et al. (2008) Gänsicke, B. T., Koester, D., Marsh, T. R., Rebassa-Mansergas, A., & Southworth, J. 2008, MNRAS, 391, L103
- Gänsicke et al. (2007) Gänsicke, B. T., Marsh, T. R., & Southworth, J. 2007, MNRAS, 380, L35
- Gänsicke et al. (2006) Gänsicke, B. T., Marsh, T. R., Southworth, J., & Rebassa-Mansergas, A. 2006, Science, 314, 1908
- Gezari et al. (2009) Gezari, S., Heckman, T., Cenko, S. B., et al. 2009, ApJ, 698, 1367
- Ghosh & Lamb (1979) Ghosh, P., & Lamb, F. K. 1979, ApJ, 232, 259
- Girven et al. (2011) Girven, J., Gänsicke, B. T., Steeghs, D., & Koester, D. 2011, MNRAS, 417, 1210
- Hamers & Portegies Zwart (2016) Hamers, A. S., & Portegies Zwart, S. F. 2016, MNRAS, 462, L84
- Hansen et al. (2006) Hansen, B. M. S., Kulkarni, S., & Wiktorowicz, S. 2006, AJ, 131, 1106
- Hartmann et al. (2016) Hartmann, S., Nagel, T., Rauch, T., & Werner, K. 2016, A&A, 593, A67
- Hoard et al. (2013) Hoard, D. W., Debes, J. H., Wachter, S., Leisawitz, D. T., & Cohen, M. 2013, ApJ, 770, 21
- Holsapple & Michel (2006) Holsapple, K. A., & Michel, P. 2006, Icarus, 183, 331
- Holsapple & Michel (2008) —. 2008, Icarus, 193, 283
- Ida & Lin (2008) Ida, S., & Lin, D. N. C. 2008, ApJ, 673, 487
- Jura (2003) Jura, M. 2003, ApJ, 584, L91
- Jura (2008) —. 2008, AJ, 135, 1785
- Jura et al. (2007a) Jura, M., Farihi, J., & Zuckerman, B. 2007a, ApJ, 663, 1285
- Jura et al. (2007b) Jura, M., Farihi, J., Zuckerman, B., & Becklin, E. E. 2007b, AJ, 133, 1927
- Jura & Young (2014) Jura, M., & Young, E. D. 2014, Annual Review of Earth and Planetary Sciences, 42, 45
- Kastner et al. (2012) Kastner, J. H., Montez, Jr., R., Balick, B., et al. 2012, AJ, 144, 58
- Kennedy & Kenyon (2008) Kennedy, G. M., & Kenyon, S. J. 2008, ApJ, 673, 502
- Kenyon & Bromley (2001) Kenyon, S. J., & Bromley, B. C. 2001, AJ, 121, 538
- Kenyon & Bromley (2004) —. 2004, AJ, 127, 513
- Kenyon & Bromley (2008) —. 2008, ApJS, 179, 451
- Kenyon & Bromley (2015a) —. 2015a, ApJ, 806, 42
- Kenyon & Bromley (2015b) —. 2015b, ApJ, 811, 60
- Kenyon & Bromley (2016) —. 2016, ApJ, 817, 51
- Kenyon & Bromley (2017) —. 2017, ApJ, 844, 116
- Kenyon et al. (2016) Kenyon, S. J., Najita, J. R., & Bromley, B. C. 2016, ApJ, 831, 8
- Kenyon et al. (1988) Kenyon, S. J., Shipman, H. L., Sion, E. M., & Aannestad, P. A. 1988, ApJ, 328, L65
- Kepler et al. (2016) Kepler, S. O., Pelisoli, I., Koester, D., et al. 2016, MNRAS, 455, 3413
- Kilic et al. (2005) Kilic, M., von Hippel, T., Leggett, S. K., & Winget, D. E. 2005, ApJ, 632, L115
- King et al. (2007) King, A. R., Pringle, J. E., & Livio, M. 2007, MNRAS, 376, 1740
- Kochanek (2016) Kochanek, C. S. 2016, MNRAS, 461, 371
- Koester et al. (2014) Koester, D., Gänsicke, B. T., & Farihi, J. 2014, A&A, 566, A34
- Koester & Wilken (2006) Koester, D., & Wilken, D. 2006, A&A, 453, 1051
- Kotko & Lasota (2012) Kotko, I., & Lasota, J.-P. 2012, A&A, 545, A115
- Kuulkers et al. (2006) Kuulkers, E., Norton, A., Schwope, A., & Warner, B. 2006, in Compact stellar X-ray sources, ed. W. H. G. Lewin & M. van der Klis (Cambridge University Press, Cambridge, UK), 421–460
- Lacombe et al. (1983) Lacombe, P., Wesemael, F., Fontaine, G., & Liebert, J. 1983, ApJ, 272, 660
- Li et al. (1998) Li, J., Ferrario, L., & Wickramasinghe, D. 1998, ApJ, 503, L151
- Li et al. (2017) Li, L., Zhang, F., Kong, X., Han, Q., & Li, J. 2017, ApJ, 836, 71
- Liebert et al. (1987) Liebert, J., Wehrse, R., & Green, R. F. 1987, A&A, 175, 173
- Lodato & Rossi (2011) Lodato, G., & Rossi, E. M. 2011, MNRAS, 410, 359
- Lynden-Bell & Pringle (1974) Lynden-Bell, D., & Pringle, J. E. 1974, MNRAS, 168, 603
- Lyra et al. (2010) Lyra, W., Paardekooper, S.-J., & Mac Low, M.-M. 2010, ApJ, 715, L68
- Malamud & Perets (2016) Malamud, U., & Perets, H. B. 2016, ApJ, 832, 160
- Malamud & Perets (2017a) —. 2017a, ApJ, 842, 67
- Malamud & Perets (2017b) —. 2017b, ArXiv e-prints, arXiv:1708.07489
- Manser et al. (2016a) Manser, C. J., Gänsicke, B. T., Koester, D., Marsh, T. R., & Southworth, J. 2016a, MNRAS, 462, 1461
- Manser et al. (2016b) Manser, C. J., Gänsicke, B. T., Marsh, T. R., et al. 2016b, MNRAS, 455, 4467
- Maoz et al. (2015) Maoz, D., Mazeh, T., & McQuillan, A. 2015, MNRAS, 447, 1749
- Masset & Papaloizou (2003) Masset, F. S., & Papaloizou, J. C. B. 2003, ApJ, 588, 494
- Melis & Dufour (2017) Melis, C., & Dufour, P. 2017, ApJ, 834, 1
- Melis et al. (2010) Melis, C., Jura, M., Albert, L., Klein, B., & Zuckerman, B. 2010, ApJ, 722, 1078
- Melis et al. (2012) Melis, C., Dufour, P., Farihi, J., et al. 2012, ApJ, 751, L4
- Metzger et al. (2012) Metzger, B. D., Rafikov, R. R., & Bochkarev, K. V. 2012, MNRAS, 423, 505
- Meyer & Meyer-Hofmeister (1982) Meyer, F., & Meyer-Hofmeister, E. 1982, A&A, 106, 34
- Mineshige & Osaki (1983) Mineshige, S., & Osaki, Y. 1983, PASJ, 35, 377
- Mukai (2017) Mukai, K. 2017, PASP, 129, 062001
- Mustill et al. (2014) Mustill, A. J., Veras, D., & Villaver, E. 2014, MNRAS, 437, 1404
- Najita et al. (2011) Najita, J. R., Ádámkovics, M., & Glassgold, A. E. 2011, ApJ, 743, 147
- Najita et al. (2013) Najita, J. R., Carr, J. S., Pontoppidan, K. M., et al. 2013, ApJ, 766, 134
- Nelson & Papaloizou (2004) Nelson, R. P., & Papaloizou, J. C. B. 2004, MNRAS, 350, 849
- Parriott & Alcock (1998) Parriott, J., & Alcock, C. 1998, ApJ, 501, 357
- Payne et al. (2017) Payne, M. J., Veras, D., Gänsicke, B. T., & Holman, M. J. 2017, MNRAS, 464, 2557
- Payne et al. (2016) Payne, M. J., Veras, D., Holman, M. J., & Gänsicke, B. T. 2016, MNRAS, 457, 217
- Petrovich & Muñoz (2017) Petrovich, C., & Muñoz, D. J. 2017, ApJ, 834, 116
- Predehl (2014) Predehl, P. 2014, Astronomische Nachrichten, 335, 517
- Press et al. (1992) Press, W. H., Teukolsky, S. A., Vetterling, W. T., & Flannery, B. P. 1992, Numerical recipes in FORTRAN. The art of scientific computing (Cambridge: Cambridge University Press)
- Pretorius & Knigge (2012) Pretorius, M. L., & Knigge, C. 2012, MNRAS, 419, 1442
- Pringle (1981) Pringle, J. E. 1981, ARA&A, 19, 137
- Rafikov (2011a) Rafikov, R. R. 2011a, ApJ, 732, L3
- Rafikov (2011b) —. 2011b, MNRAS, 416, L55
- Rafikov & Garmilla (2012) Rafikov, R. R., & Garmilla, J. A. 2012, ApJ, 760, 123
- Rappaport et al. (2017) Rappaport, S., Gary, B. L., Vanderburg, A., et al. 2017, ArXiv e-prints, arXiv:1709.08195
- Reach et al. (2005) Reach, W. T., Kuchner, M. J., von Hippel, T., et al. 2005, ApJ, 635, L161
- Redfield et al. (2017) Redfield, S., Farihi, J., Cauley, P. W., et al. 2017, ApJ, 839, 42
- Rees (1988) Rees, M. J. 1988, Nature, 333, 523
- Reis et al. (2013) Reis, R. C., Wheatley, P. J., Gänsicke, B. T., & Osborne, J. P. 2013, MNRAS, 430, 1994
- Rocchetto et al. (2015) Rocchetto, M., Farihi, J., Gänsicke, B. T., & Bergfors, C. 2015, MNRAS, 449, 574
- Shipman & Greenstein (1983) Shipman, H. L., & Greenstein, J. L. 1983, ApJ, 266, 761
- Shipman et al. (1977) Shipman, H. L., Greenstein, J. L., & Boksenberg, A. 1977, AJ, 82, 480
- Sion et al. (1990) Sion, E. M., Kenyon, S. J., & Aannestad, P. A. 1990, ApJS, 72, 707
- Smak (1999) Smak, J. 1999, Acta Astron., 49, 391
- Sokoloski & Kenyon (2003) Sokoloski, J. L., & Kenyon, S. J. 2003, ApJ, 584, 1027
- Stephan et al. (2017) Stephan, A. P., Naoz, S., & Zuckerman, B. 2017, ApJ, 844, L16
- Stern et al. (1990) Stern, S. A., Shull, J. M., & Brandt, J. C. 1990, Nature, 345, 305
- Takeuchi & Artymowicz (2001) Takeuchi, T., & Artymowicz, P. 2001, ApJ, 557, 990
- Tanaka et al. (2002) Tanaka, H., Takeuchi, T., & Ward, W. R. 2002, ApJ, 565, 1257
- Tremblay & Bergeron (2007) Tremblay, P.-E., & Bergeron, P. 2007, ApJ, 657, 1013
- Veras (2016) Veras, D. 2016, Royal Society Open Science, 3, 150571
- Veras et al. (2017) Veras, D., Carter, P. J., Leinhardt, Z. M., & Gänsicke, B. T. 2017, MNRAS, 465, 1008
- Veras et al. (2015a) Veras, D., Eggl, S., & Gänsicke, B. T. 2015a, MNRAS, 452, 1945
- Veras et al. (2015b) —. 2015b, MNRAS, 451, 2814
- Veras & Gänsicke (2015) Veras, D., & Gänsicke, B. T. 2015, MNRAS, 447, 1049
- Veras et al. (2014a) Veras, D., Leinhardt, Z. M., Bonsor, A., & Gänsicke, B. T. 2014a, MNRAS, 445, 2244
- Veras et al. (2013) Veras, D., Mustill, A. J., Bonsor, A., & Wyatt, M. C. 2013, MNRAS, 431, 1686
- Veras et al. (2014b) Veras, D., Shannon, A., & Gänsicke, B. T. 2014b, MNRAS, 445, 4175
- Villaver & Livio (2007) Villaver, E., & Livio, M. 2007, ApJ, 661, 1192
- von Hippel et al. (2007) von Hippel, T., Kuchner, M. J., Kilic, M., Mullally, F., & Reach, W. T. 2007, ApJ, 662, 544
- Ward (1997) Ward, W. R. 1997, Icarus, 126, 261
- Weidenschilling (1977) Weidenschilling, S. J. 1977, MNRAS, 180, 57
- Wilson et al. (2014) Wilson, D. J., Gänsicke, B. T., Koester, D., et al. 2014, MNRAS, 445, 1878
- Wyatt et al. (2014) Wyatt, M. C., Farihi, J., Pringle, J. E., & Bonsor, A. 2014, MNRAS, 439, 3371
- Xu et al. (2016) Xu, S., Jura, M., Dufour, P., & Zuckerman, B. 2016, ApJ, 816, L22
- Xu et al. (2017) Xu, S., Zuckerman, B., Dufour, P., et al. 2017, ApJ, 836, L7
- Youdin (2010) Youdin, A. N. 2010, in EAS Publications Series, Vol. 41, EAS Publications Series, ed. T. Montmerle, D. Ehrenreich, & A.-M. Lagrange, 187–207
- Youdin & Chiang (2004) Youdin, A. N., & Chiang, E. I. 2004, ApJ, 601, 1109
- Youdin & Kenyon (2013) Youdin, A. N., & Kenyon, S. J. 2013, From Disks to Planets, ed. T. D. Oswalt, L. M. French, & P. Kalas (Dordrecht: Springer Science & Business Media), 1
- Zuckerman & Reid (1998) Zuckerman, B., & Reid, I. N. 1998, ApJ, 505, L143