How mutation alters the evolutionary dynamics of cooperation on networks
Abstract
Cooperation is ubiquitous at every level of living organisms. It is known that spatial (network) structure is a viable mechanism for cooperation to evolve. A recently proposed numerical metric, Average Gradient of Selection (AGoS), a useful tool for interpreting and visualizing evolutionary dynamics on networks, allows simulation results to be visualized on a one-dimensional phase space. However, stochastic mutation of strategies was not considered in the analysis of AGoS. Here we extend AGoS so that it can analyze the evolution of cooperation where mutation may alter strategies of individuals on networks. We show that our extended AGoS correctly visualizes the final states of cooperation with mutation in the individual-based simulations. Our analyses revealed that mutation always has a negative effect on the evolution of cooperation regardless of the payoff functions, fraction of cooperators, and network structures. Moreover, we found that scale-free networks are the most vulnerable to mutation and thus the dynamics of cooperation are altered from bistability to coexistence on those networks, undergoing an imperfect pitchfork bifurcation.
Keywords
Evolution of cooperation; Prisoner’s dilemma game; Network structure; Average gradient of selection; Equilibrium point; Bifurcation
1 Introduction
Cooperation is ubiquitous at every level of living organisms and has played an important role in major evolutionary transitions [1, 2, 3]. In principle, cooperators benefit others by incurring some costs to themselves, while defectors do not pay any costs. Therefore, cooperation cannot be an evolutionarily stable strategy for a noniterative game in a well-mixed population [4, 5, 6, 7, 8].
In such a situation, spatial (network) structure is a viable mechanism for cooperation to evolve [9] (Refer to the various models for cooperation on networks in the comprehensive reviews [10, 11, 12]). In particular, cooperation is significantly enhanced on scale-free networks with accumulated payoffs [13]. In this case, cooperative strategies can spread into the whole population because cooperative hubs surrounded by other cooperators obtain much higher payoffs compared to other nodes [13]. Due to the development of evolutionary graph theory [14], mathematical understanding of the evolution of cooperation on networks has been greatly advanced [15, 16, 17, 18, 19, 20, 21, 22]. As a pioneering solid mathematical work, Ohtsuki et al. calculated the fixation probability of cooperators on various networks and revealed that the relationship between the benefit-cost ratio and the average degree simply determines whether cooperation can evolve on those networks [15]. Although mathematical frameworks are a powerful tool to capture the whole structure of evolutionary games, some assumptions such as weak selection [15, 16, 17, 18, 19, 20, 21, 22] and homogeneous graphs (all nodes have the same degree) [16, 17, 18, 19] are often associated with them. To tackle this problem, numerical methods have some advantages because they allow complex situations such as non-weak selection and heterogeneous graphs to be calculated once those parameters are given. Pinheiro et al. [23] proposed a notable numerical metric, called Average Gradient of Selection (AGoS). AGoS can interpret and visualize the dynamics of simulation results in a one-dimensional phase space by utilizing a numerical mean-field method. It can analyze the dynamics of the evolution of cooperation in structured populations (including heterogeneous graphs) even when non-weak selection pressure is introduced [24], when nonlinear imitation probability is used [25], and also when structures and states of networks change over time (adaptive social networks) [26].
In these earlier studies of the AGoS, however, stochastic mutation of strategies was not considered. It is important to incorporate such mutation because they frequently occur in real societies and also because results obtained with stochastic fluctuations of strategies would provide more robust observations and conclusions. Prominent mathematical results of mutation effects on networked cooperation have been found [27, 22, 18, 21, 28]. Especially, Allen et al. [27] and Débarre [28] deeply analyzed the effects of mutation on networked cooperation and found that mutation has a negative effect for cooperation by diluting the clustering of cooperators. In their models, homogeneous graphs and weak selection are assumed. Allen et al. [22] recently obtained elegant mathematical results of this problem under weak selection on any population structure including heterogeneous graphs. Here we analyze the evolution of cooperation using AGoS where mutation may alter strategies of individuals in networks. Compared to these previous AGoS and mathematical results, our contribution of this paper to the literature is to use AGoS for the evolution of cooperation on both homogeneous and heterogeneous graphs with non-weak selection. We also consider the Fermi update rule for the strategy updating, which is usually a different scheme than is used in mathematical studies. On the other hand, statistical physics has also played an important role in the literature of cooperation on networks [12]. If the network reciprocity and some other mechanisms are combined, cooperation is further promoted, which is known as coevolutionary rules [10]. Examples of the coevolutionary rules are found in Refs. [29, 30, 31, 32, 33, 34, 35, 36, 37, 38, 39, 40, 41, 42, 43]. Our model does not fall into the framework of the coevolutionary rules because there is no additional mechanism other than the network reciprocity. However, our model is in line with the statistical physics of cooperation. Based on this framework, this paper shows that scale-free networks are quite vulnerable to mutation at a macroscopic level.
2 Models
We developed an agent-based model for the analysis of AGoS. Individuals are placed on the nodes in a network and they interact only with their neighbors. The networks used in this paper are described in the next subsection. Each individual can take one of two strategies: Cooperation () or Defection ().
Once the composition of individuals in a network is given, we can calculate the probability of increasing or decreasing the number of cooperators by one, called Gradient of Selection (GoS) at time [23]. Simultaneously, we can also update the strategies of individuals based on the framework of evolutionary games at time . Immediately after the strategy updating, mutation (flipping strategy from to or vice versa) occurs with probability . Therefore, in evolutionary simulations, the calculations of GoS and the strategy updating with mutation take place alternately in one time step and these processes are repeated. The calculation of GoS and the strategy updating with mutation are repeated for time steps. Simulations are repeated for times in total.
Network structure
Pinheiro et al. [23] revealed that, by using AGoS, cooperation was sustained at a network level and network structures led to the different evolutionary results of cooperation. Following the existing work [23, 24], we focus on two classes of network structures: homogeneous and heterogeneous. We use homogeneous in the sense that every individual has the same degree. In the case of heterogeneous, individuals can have different degrees.
For homogeneous networks, we use two types: homogeneous random networks (HR) [44] and square lattice (Lattice). HR is created by randomizing links from homogeneous regular ring networks. For heterogeneous networks, we use Barabási-Albert scalfe-free networks (BA) [45]. In BA, a small number of nodes called hubs connect with a substantial number of links while most other nodes connect with a few nodes.
In the initial setting, the number of cooperators in a population, , is given to each simulation. The locations of cooperators and defectors in a network are random.
AGoS calculation
Once each simulation starts, GoS of the given population at time is calculated. If there was no population (network) structure, the dynamics of cooperation could be calculated analytically using the replicator equation [8, 4]. However, in structured populations, the calculation becomes difficult due to the complex topologies of networks although many mathematical results with some assumptions have been obtained [15, 16, 17, 18, 19, 20, 21, 22].
The GoS gives the numerical characterization of the evolution of cooperation even in such a situation. Let be the probability that ’s strategy changes to the other different strategy (from to or from to ) and is a set of ’s neighbors that have the different strategy from ’s. Then, can be the product of two terms: the probability of selecting a neighbor with the different strategy, , and the average probability that imitates the different strategy, , where is the number of ’s neighbors and is the probability that individual imitates ’s strategy at time , which is defined in the next subsection. Thus, can be written as follows:
| (1) |
From the definition, for a given simulation , the probability to increase the number of at (the number of s in the network) is while the probability for the decrease of the number of s is , where is the population size, is a set of defectors (), and is a set of cooperators (). Then, GoS at time in a given simulation is defined as the difference between them, as
| (2) |
Finally, we obtain the Average Gradient of Selection (AGoS) [23], which averages the GoS by the number of time steps and the number of simulations , as
| (3) |
The above derivation is the original AGoS without mutation [23]. Here we need to consider the effect of mutation on cooperation. To incorporate mutation, Eq. (1) needs to be revised so that the changed strategy by selection remains at the same state with probability while the unchanged strategy by selection changes to the opposite strategy with mutation probability . Thus, the probability that ’s strategy changes to the other different strategy is altered to
| (4) |
Strategy updating with mutation
To check the accuracy of the AGoS, we simultaneously conducted individual-based simulations. After the GoS calculation, the strategy updating takes place as follows. In each time step, we randomly choose one individual from the population. The individual plays the Prisoner’s Dilemma (PD) game with its neighbors and obtains payoffs resulting from the games. In each game, both individuals obtain payoff for mutual cooperation or for mutual defection. If one selects cooperation while the other defects, the former obtains the sucker’s payoff while the latter obtains the highest payoff , the temptation to defect. The relationship of the four payoffs is usually in PD games. AGoS is used for the other types of collective games including Stag Hunt [46] and Snowdrift [47] games.
Following the parameter settings used in the model by [23, 24], we used , and , while . All the neighbors of also play the PD game with their neighbors and obtains the payoffs. Let and be the payoffs of individual and (a randomly selected neighbor of ), respectively. Here we consider the two types of payoff functions: accumulated payoff and average payoff, because results may be quite different between those two conditions. In the accumulated payoff, cooperation is greatly promoted due to the hub effect [13]. In the average payoff [48, 49, 50, 51, 52] (or in the case that having links takes some costs [53]), however, cooperation is inhibited because the hub effect is canceled. In the former case, the payoffs obtained from each game are accumulated over all the neighbors. In contrast, in the latter case, the accumulated payoffs for at the end of the games are divided by degree . In either case, the payoff is reset to zero at every time step.
Based on the framework of evolutionary games, higher fitness will be imitated more often. In order to realize this, we use the pairwise comparison rule [54, 55, 56]. As mentioned above, first, a target node (learner) is randomly selected from the population. Then, one neighbor (teacher) of the target node is randomly selected. Finally, individual imitates ’s strategy with the probability
| (5) |
where controls the intensity of selection. Eq. (5) is also used in Eq. (1) for the calculation of AGoS. For , there is no selection pressure, meaning that evolutionary dynamics proceeds by random drift. As becomes larger, the tendency that strategies with higher payoffs will be imitated increases.
In the previous studies [23, 24], the next time step immediately follows after the strategy updating. In contrast, we incorporate mutation in this paper. Specifically, the strategy of individual changes to the different strategy with probability after the strategy updating. We focus on how mutation alters the fitness of cooperation in networks.
3 Results
In each simulation, we calculated the GoS and conducted the strategy updating with mutation every time step, which was iterated time steps. The population was composed of (except for Lattice for which ) individuals and an average degree was . For each network type, we constructed 30 networks. For each network, we selected the number of initial cooperators from to randomly and this was repeated 1000 times. Thus, we ran simulations in total for each network type and each mutation probability. We varied mutation probability as the main experimental parameter. In the AGoS results, we obtained the locations of equilibrium points by numerically finding where the AGoS curve becomes zero. By doing so, the AGoS curves were smoothed using Gaussian kernels to reduce the effects of stochasticity in the results.
Case of accumulated payoffs
We first see the results of accumulated payoffs. Figure 1A shows the AGoS () on HR networks where the mutation probabilities are varied. When , the result perfectly matches the corresponding case of Ref. [23]. It has two stable equilibrium points and two unstable equilibrium points. One of the unstable points, , exists at . One of the stable points, , exists at . The other stable and unstable points exist at and , respectively. As the black arrows suggest, as long as , the population composition converges to the stable point . Thus, unlike the case of well-mixed populations where defectors are dominant, cooperation and defection can co-exist in the network. In other words, from a global, population-level perspective, HR networks can sustain cooperation even though all individuals play PD.
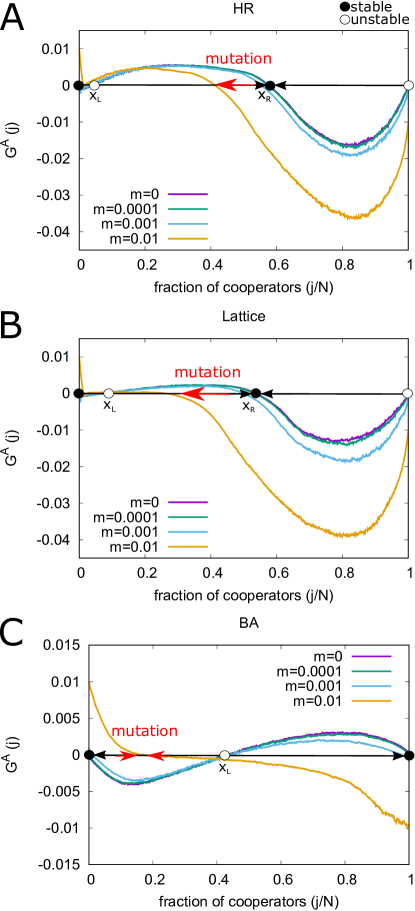
As becomes larger, decreases overall. Thus, the stable coexistence point becomes lower (see the red arrow in Fig. 1A). This means that mutation is harmful for the evolution of cooperation. Mutation itself is neutral because both strategy changes (cooperation to defection and vice versa) take place without any bias. Nevertheless, mutation negatively affects cooperation because it easily destroys the clusters of cooperators that allow cooperation to evolve.
At , naturally increases when mutation is considered. At this point, is the same as , where there are only defectors and therefore any change from defector to cooperator must occur simply by mutation.
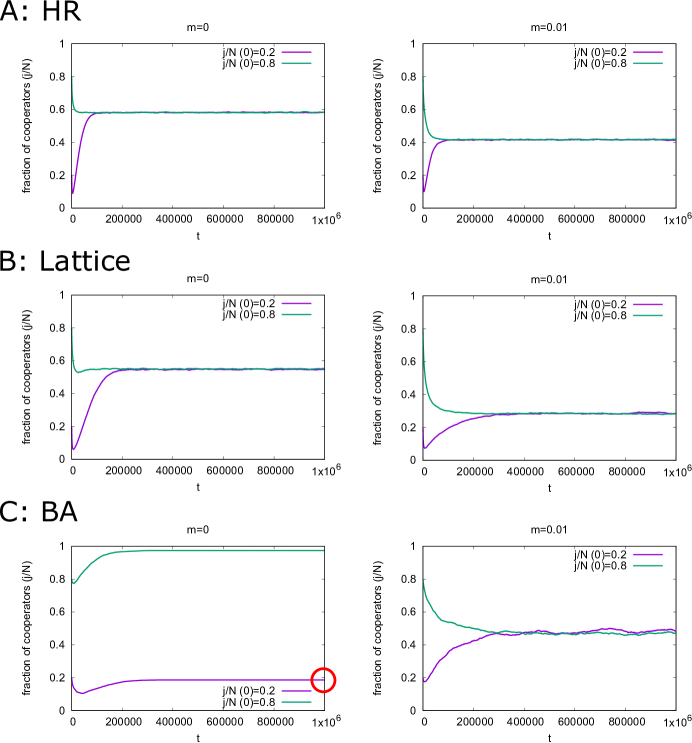
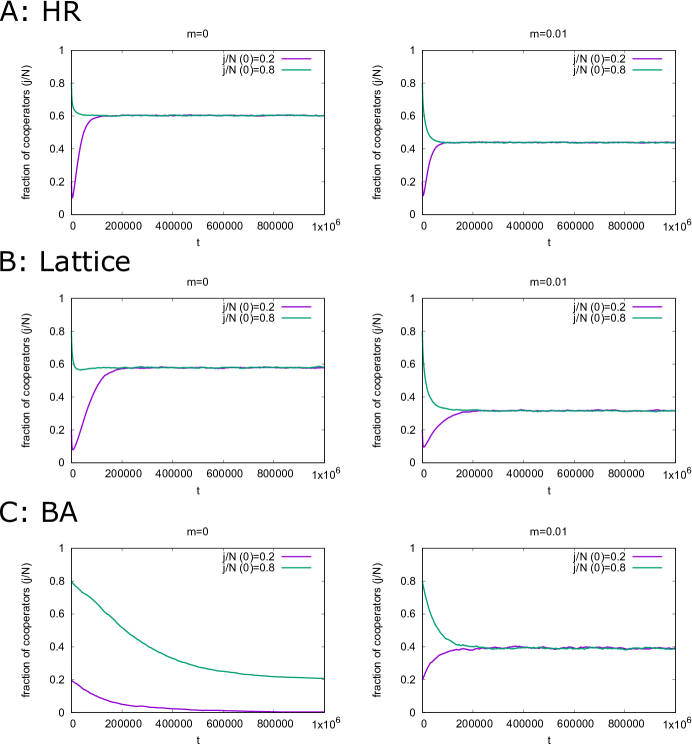
To verify the accuracy of our defined AGoS, we conducted simulations of the strategy evolution (Fig. 2A). The results of five hundred simulations are averaged for each. One million time steps are repeated for each simulation. We used two different initial fractions of cooperators, and , to check those converging points. Without mutation (; left), the fraction of cooperators converges to 0.58 irrespective of the starting points. With mutation (; right), it converges to 0.41 irrespective of the starting points. We find that both converging points are nearly equal to the stable equilibrium points obtained through the analysis of AGoS. Thus, AGoS is appropriate to characterize the fate of cooperation in HR networks.
Next, we discuss the case of lattice networks. Figure 1B shows the AGoS on lattice networks where the mutation probability are varied. The tendency of this result is the same with the HR networks because lattice is classified into homogeneous networks (i.e., each node has the same degree). When , it has two stable equilibrium points and two unstable equilibrium points. One of the unstable points, , exists at . One of the stable points, , exists at . Hence, the density of cooperators in the coexistence situations is lower than HR networks (). The other stable and unstable points exist at and , respectively. If , cooperation and defection can coexist in the network. As becomes larger, decreases overall. Thus, the stable coexistence point becomes lower. Mutation negatively effects the evolution of cooperation in lattice networks, too.
Figure 2B shows the simulations of the strategy evolution. The setting is the same as HR networks. We used two different initial fractions of cooperators, and (these are approximate values because for Lattice), to check those converging points, respectively. Without mutation (; left), the fraction of cooperators converges to 0.55 irrespective of the starting points. With mutation (; right), it converges to 0.28 irrespective of the stating points. We find that both converging points are nearly equal to the stable equilibrium points in the analysis of AGoS. Thus, AGoS is appropriate to characterize the fate of cooperation in lattice networks. Compared to HR networks every stable equilibrium point is lower in lattice networks. In lattice networks, cooperative clusters tend to be localized and separated from each other. It may prevent cooperators from expanding their regions.
We next see the results of BA networks. Figure 1C shows the AGoS on BA networks where the mutation probabilities are varied. When , there is one unstable equilibrium point and two stable equilibrium points, and . This is the same as the one observed in the previous study [23]. This means that cooperation becomes dominant once . BA networks with accumulated payoffs changed the game from defector dominance to a bistable one. As increases, the number of cooperators needed for sustaining the dominance of cooperation becomes larger. Interestingly, we found that, when , the dynamics completely change from bistability to coexistence. There exists only one stable equilibrium point at . In other words, a relatively small population of cooperators will coexist with the majority of defectors in this case.
Figure 2C shows sample simulation results of the strategy evolution. The setting is the same with HR and Lattice networks. Without mutation (; left), the fraction of cooperators converges to 0.186 when while 0.974 when . Thus, there are some deviations from the corresponding analytical values, 0 and 1, which are characterized by AGoS. In particular, the difference between 0.186 (see the red circle in the left panel of Fig. 2C) in the simulation and the value characterized by the AGoS (0). Similarly, with mutation (; right), both lines ( and ) converge to around 0.475 in the simulations but the stable point characterized by AGoS is 0.142. Thus, there is also quite a difference between simulation and AGoS.
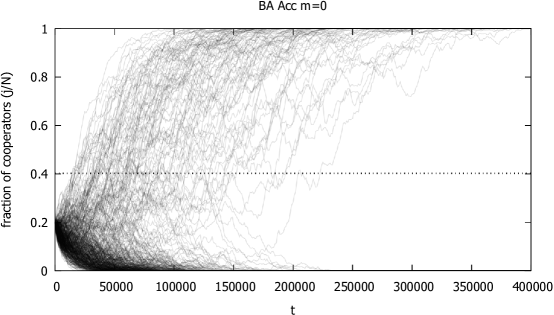
To clarify the reason, we examined individual simulation results. Figure 3 shows all 500 runs without mutation () when . From these results, we found that the fraction of cooperators did not converge to 0.186. Instead, four hundreds and seven simulations converged to 0 while ninety three simulations converged to 1 in 500 total runs. Thus, AGoS correctly characterized the final fate of cooperation with probability 0.814 but failed with probability 0.186. In BA networks, degree-strategy correlations significantly affect the increase and decrease of cooperation. However, the information cannot be captured by AGoS. This is why AGoS sometimes fails to characterize the final fate of cooperation in BA networks.
Case of average payoffs
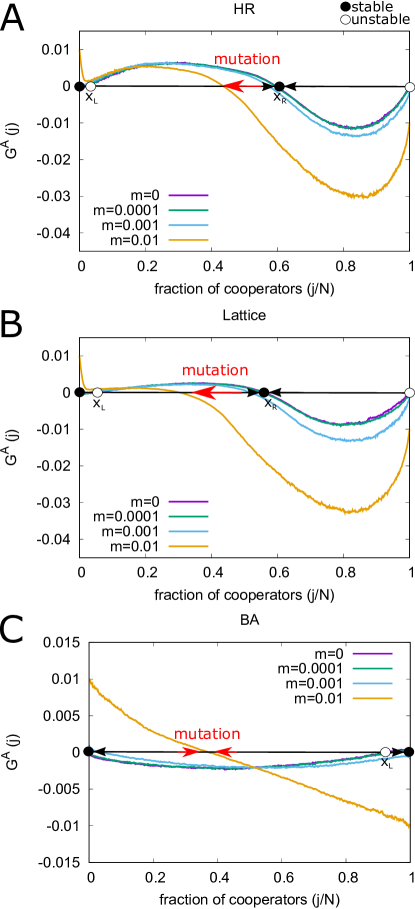
We now focus on how cooperation evolves with the average payoff compared to the accumulated payoff. It is known that, in networked games, cooperation is inhibited in the case of average payoffs because the hub effect is dismissed [48, 49, 50, 51, 52]. Figure 4 shows the case of average payoffs. In HR networks (Fig. 4A), the internal stable equilibrium point is 0.598 without mutation () and is 0.437 with mutation (). The corresponding simulations shown in Fig. 5A are 0.6 without mutation (; left) and are 0.44 (; right), which means that the characterization by AGoS is quite accurate. In Lattice networks (Fig. 4B), the internal stable equilibrium point is 0.560 without mutation () and is 0.303 with mutation (). The corresponding simulations shown in Fig. 5B are 0.55 without mutation (; left) and are 0.28 (; right). The AGoS accurately characterizes the results of simulations in Lattice networks as well as the HR networks.
For those two networks, if we compare the results of AGoS between accumulated (Fig. 1A and B) and average (Fig. 4A and B) payoffs, both equilibrium points in the average payoff are slightly higher than those in the accumulated payoff (see also Fig. 7). There is little difference between the average and accumulated payoffs because each node has the same degree in those networks. However, if the payoffs are averaged, the payoff difference between cooperators and defectors shrinks, hence the chance that cooperators can survive slightly increases in the average payoffs.
We move to the case of BA networks. Figure 4C shows the AGoS on BA networks where the mutation probabilities are varied. When , there is one unstable equilibrium point and two stable equilibrium points, and . This means that cooperation becomes dominant if . Compared to the case of accumulated payoff (Fig. 1C), the critical point greatly moves rightward, which means that the critical fraction of cooperators needed for cooperation to become dominant is quite large. This is because the hub effect is dismissed in the case of average payoffs.
The corresponding simulations (Fig. 5C) show that AGoS characterizes accurately when where the simulations converge to 0 but largely fails when where the the population converges to full cooperation 20% of the time and full defection 80% of the time, resulting in around 0.2. The reason is that degree-strategy correlations are missed in AGoS in BA networks.
When , the dynamics changes from bistability to coexistence in the same way as with the accumulated payoffs. The stable equilibrium point is 0.372 (Fig. 4C) and the fraction of cooperators converges to 0.39 in the corresponding simulations (right in Fig. 5C). We consider the possible reason for the change in these dynamics in the next subsection.
Mutation effect on BA networks
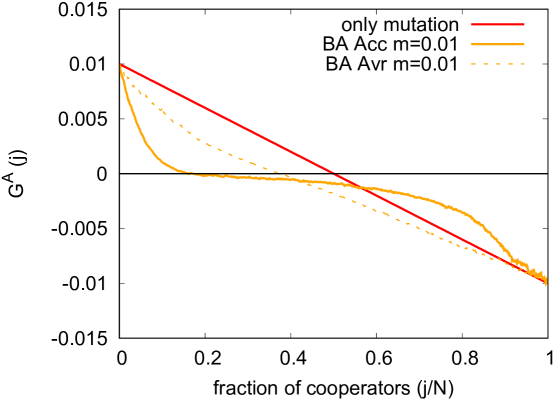
We saw that the dynamics completely changed on BA networks in both accumulated and average payoffs. To consider which factor contributes to the change of dynamics, we show a case in which only mutation occurs with probability 0.01 () without strategy updating (red line in Fig. 6). If there is no cooperator (), the expected probability that cooperator increases by one is 0.01 (). In contrast, if there is no defector (), the probability that cooperator decreases by one is 0.01 (). If cooperators and defectors are fifty-fifty, that probability becomes 0. Note that, in this case, because there is no strategy updating these results always hold irrespective of network structures because the locations of individuals and their payoffs do not matter.
We first see the comparison of the accumulated payoffs with the case of only mutation. In Fig. 6, it seems that the dynamics are heavily influenced by mutation because the solid orange line curves in accordance with the red line. In other words, the dynamics changed from bistability to coexistence due to the effect of mutation. In BA networks, contrary to HR or Lattice networks, once a cooperative hub is destroyed by mutation, there is almost no chance for cooperation to evolve. This is why BA networks are most vulnerable to mutation compared to HR or Lattice networks.
As in the case of accumulated payoffs, the change of dynamics in the average payoffs arises from the effect of mutation. As seen in Fig. 6, the AGoS in the average payoff (dashed line) is closer to the case where only mutation is considered because there is no hub effect in this case. Thus, the dynamics in the average payoffs are highly influenced by mutation compared to the case of the accumulated payoffs.
Comparison of equilibrium points
Finally, we take a close look at the location of stable equilibrium points against mutation probability on the three networks. Here, is varied from 0 to 0.1. Figure 7 shows the results in (A) HR, (B) Lattice, and (C) BA networks. In each network, the solid lines indicate the stable equilibrium points and the dashed lines indicate the unstable equilibrium points. Blue (Red) is the case of the accumulated (average) payoffs.
By comparing (A) with (B), we find that the stable equilibrium points in HR networks are always higher than those in Lattice networks. This is because cooperators are often locally clustered in Lattice networks compared to HR networks as previously described. In those two networks, as becomes larger, the stable equilibrium points decrease unless is too large (e.g. ). The reason is that cooperative clusters are destroyed by mutation. In contrast, if is too large, cooperators are continuously produced by mutation irrespective of the strategy updating. It contributes to the rise of equilibrium points.
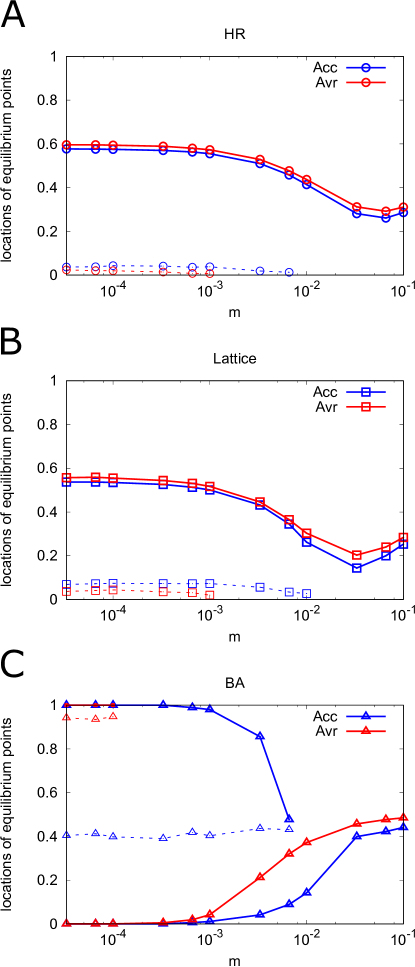
In BA networks, as we previously mentioned, the dynamics change from bistability to coexistence. Moreover, by changing in more detail, we find the imperfect pitchfork bifurcations in the accumulated payoffs (Fig. 7). The main reason of the change to coexistence was that scale-free networks are vulnerable to mutation. Once cooperative hubs (key for cooperation to evolve in scale-free networks) are destroyed by mutation, the dynamics are mostly governed by mutation, which lead to the coexistence. Because there is no hub effect in the average payoffs, the coexistence takes place at smaller values.
4 Discussion and conclusions
In this paper, we analyzed the evolution of cooperation at a population level in the presence of mutation by the AGoS. We used two classes of networks: homogeneous (HR and Lattice) and heterogeneous (BA). We also examined two different payoff mechanisms: accumulated and average payoffs. Our analyses revealed that, as the prominent mathematical studies showed [27, 28], mutation has a negative effect on the evolution of cooperation regardless of the payoff functions, fraction of cooperators, and network structures, because clusters of cooperators can easily be destroyed by mutation. Moreover, we found that scale-free networks are most vulnerable to mutation because a few cooperative hubs are the only key of the success for cooperation, despite the fact that cooperation is greatly enhanced with accumulated payoffs without mutation in those networks. If a few hubs are destroyed by mutation, cooperation easily collapses. This may be relevant to the robustness of scale-free networks. In general, scale-free networks are quite weak when hubs are destroyed by targeted attacks [57]. Moreover, cooperation on scale-free networks easily collapses when hubs are removed [58, 59]. Our paper shows that, even if hubs are not directly removed, scale-free networks are vulnerable to mutation because hubs are easily invaded by defectors through mutation. Therefore, to prevent cooperative societies from collapsing, some mechanisms may need to be developed regarding how hubs are protected from mutation.
Similar to recent mathematical results [27, 22, 18, 21, 28], our results also indicate the importance of considering random noise (mutation), which was largely overlooked in the literature, in studying the evolution of cooperative behavior in social networks. Mutation can be considered genetic change if we assume biological systems. If we assume cultural systems, mutation can be considered a stochastic behavior to explore new behaviors. Although we showed such a random exploration was harmful to maintain cooperative societies, if we consider different forms of exploration, those explorations may work beneficially for societies, such as collaborative problem solving [60]. We would like to consider those cases in the future work.
Finally, we remark on the limitations of this paper. Our extended AGoS considering mutation sometimes fails to characterize the final states of cooperation on BA networks, although it works perfectly for HR and Lattice networks. This was because AGoS aggregate every state and topology of networks into one value. To consider those complicated network interactions, we may need to take into account the influence of nodes separated by the degree. A similar idea is the reproductive value, which is a measure of the expected gene contribution of an individual to the future gene pool [61, 62, 63, 22]. Even if there is no selective difference among all individuals, individuals whose degree is high may be favored by natural selection more often than the others on networks. This is the reproductive value based on degree difference [62]. In this study, we could elaborate our extended AGoS by considering such reproductive values based on degree difference, but it is not our main focus. Rather, we would like to emphasize that the change of dynamics in heterogeneous networks can be clearly shown even by our “rough” AGoS. The elaboration of the AGoS would be an important future direction.
Competing interests
We have no competing interests.
Author’s contributions
GI and HS designed the research. GI and YS developed the model. GI and YS performed the simulation. GI and HS discussed and analyzed the results. GI and HS wrote the main manuscript text. All authors gave final approval for publication.
Acknowledgment
G.I. acknowledges the support by Hayao Nakayama Foundation For Science & Technology & Culture.
References
- [1] West SA, Fisher RM, Gardner A, Kiers ET. Major evolutionary transitions in individuality. Proc Natl Acad Sci USA. 2015;112(33):10112–10119. Available from: http://dx.doi.org/10.1073/pnas.1421402112.
- [2] Michod RE. Evolution of individuality during the transition from unicellular to multicellular life. Proc Natl Acad Sci USA. 2007;104(suppl 1):8613–8618. Available from: http://dx.doi.org/10.1073/pnas.0701489104.
- [3] Michod RE. The group covariance effect and fitness trade-offs during evolutionary transitions in individuality. Proc Natl Acad Sci USA. 2006;103(24):9113–9117. Available from: http://dx.doi.org/10.1073/pnas.0601080103.
- [4] Nowak MA. Evolutionary dynamics: Exploring the equations of life. Harvard University Press; 2006.
- [5] Maynard Smith J, Price GR. The logic of animal conflict. Nature. 1973;246(5427):15–18. Available from: http://dx.doi.org/10.1038/246015a0.
- [6] Taylor PD, Jonker LB. Evolutionarily stable strategies and game dynamics. Mathematical Biosciences. 1978;40:145–156. Available from: http://dx.doi.org/10.1016/0025-5564(78)90077-9.
- [7] Maynard Smith J. Evolution and the theory of games. Cambridge University Press; 1982.
- [8] Hofbauer J, Sigmund K. Evolutionary games and population dynamics. Cambridge University Press; 1998.
- [9] Nowak MA, May RM. Evolutionary games and spatial chaos. Nature. 1992;359:826. Available from: http://dx.doi.org/10.1038/359826a0.
- [10] Perc M, Szolnoki A. Coevolutionary games - A mini review. Biosystems. 2010;99:109–125. Available from: https://doi.org/10.1016/j.biosystems.2009.10.003.
- [11] Wang Z, Wang L, Szolnoki A, Perc M. Evolutionary games on multilayer networks: a colloquium. Eur Phys J B. 2015;88:124. Available from: https://doi.org/10.1140/epjb/e2015-60270-7.
- [12] Perc M, Jordan JJ, Rand DG, Wang Z, Boccaletti S, Szolnoki A. Statistical physics of human cooperation. Phys Rep. 2017;687:1–51. Available from: http://dx.doi.org/10.1016/j.physrep.2017.05.004.
- [13] Santos FC, Pacheco JM. Scale-free networks provide a unifying framework for the emergence of cooperation. Phys Rev Lett. 2005;95:098104. Available from: http://dx.doi.org/10.1103/PhysRevLett.95.098104.
- [14] Lieberman E, Hauert C, Nowak MA. Evolutionary dynamics on graphs. Nature. 2005;433:312–316. Available from: http://dx.doi.org/10.1038/nature03204.
- [15] Ohtsuki H, Hauert C, Lieberman E, Nowak MA. A simple rule for the evolution of cooperation on graphs and social networks. Nature. 2006;441:502–505. Available from: http://dx.doi.org/10.1038/nature04605.
- [16] Ohtsuki H, Nowak MA. The replicator equation on graphs. J Theor Biol. 2006;243:86–97. Available from: http://dx.doi.org/10.1016/j.jtbi.2006.06.004.
- [17] Taylor PD, Day T, Wild G. Evolution of cooperation in a finite homogeneous graph. Nature. 2007;447:469–472. Available from: http://dx.doi.org/10.1038/nature05784.
- [18] Allen B, Nowak MA. Games on graphs. EMS Surv Math Sci. 2014;1:113–151. Available from: http://dx.doi.org/10.4171/EMSS/3.
- [19] Débarre F, Hauert C, Doebeli M. Social evolution in structured populations. Nat Commun. 2014;5:3409. Available from: http://dx.doi.org/10.1038/ncomms4409.
- [20] Maciejewski W, Fu F, Hauert C. Evolutionary game dynamics in populations with heterogenous structures. PLoS Comput Biol. 2014;10:e1003567. Available from: http://dx.doi.org/10.1371/journal.pcbi.1003567.
- [21] Tarnita CE, Ohtsuki H, Antal T, Fu F, Nowak MA. Strategy selection in structured populations. J Theor Biol. 2009;3:570–581. Available from: http://dx.doi.org/10.1016/j.jtbi.2009.03.035.
- [22] Allen B, Lippner G, Chen YT, Fotouhi B, Momeni N, Yau ST, et al. Evolutionary dynamics on any population structure. Nature. 2017;544(7649):227–230. Available from: http://dx.doi.org/10.1038/nature21723.
- [23] Pinheiro FL, Pacheco JM, Santos FC. From local to global dilemmas in social networks. PLoS One. 2012;7:e32114. Available from: http://dx.doi.org/10.1371/journal.pone.0032114.
- [24] Pinheiro FL, Santos FC, Pacheco JM. How selection pressure changes the nature of social dilemmas in structured populations. New J Phys. 2012;14(7):073035. Available from: https://doi.org/10.1088/1367-2630/14/7/073035.
- [25] Dai Q, Li H, Cheng H, Zhang M, Yang J. The effects of nonlinear imitation probability on the evolution of cooperation. Chaos Solitons Fractals. 2013;56:53–58. Available from: http://dx.doi.org/10.1016/j.chaos.2013.07.001.
- [26] Pinheiro FL, Santos FC, Pacheco JM. Linking individual and collective behavior in adaptive social networks. Phys Rev Lett. 2016;116:128702. Available from: http://dx.doi.org/10.1103/PhysRevLett.116.128702.
- [27] Allen B, Traulsen A, Tarnita CE, Nowak MA. How mutation affects evolutionary games on graphs. J Theor Biol. 2012;299:97–105. Available from: http://dx.doi.org/10.1016/j.jtbi.2011.03.034.
- [28] Débarre F. Fidelity of parent-offspring transmission and the evolution of social behavior in structured populations. J Theor Biol. 2017;420:26–35. Available from: http://dx.doi.org/10.1016/j.jtbi.2017.02.027.
- [29] Szolnoki A, Perc M. Coevolution of teaching activity promotes cooperation. New J Phys. 2008;10:043036. Available from: https://doi.org/10.1088/1367-2630/10/4/043036.
- [30] Perc M, Szolnoki A. Social diversity and promotion of cooperation in the spatial prisoner’s dilemma game. Phys Rev E. 2008;77:011904. Available from: https://doi.org/10.1103/PhysRevE.77.011904.
- [31] Wang Z, Wang L, Yin ZY, Xia CY. Inferring reputation promotes the evolution of cooperation in spatial social dilemma games. PLoS ONE. 2012;7:e40218. Available from: https://doi.org/10.1371/journal.pone.0040218.
- [32] Wang Z, Szolnoki A, Perc M. If players are sparse social dilemmas are too: Importance of percolation for evolution of cooperation. Sci Rep. 2012;2:369. Available from: https://doi.org/10.1038/srep00369.
- [33] Wang Z, Szolnoki A, Perc M. Percolation threshold determines the optimal population density for public cooperation. Phys Rev E. 2012;85:037101. Available from: https://doi.org/10.1103/PhysRevE.85.037101.
- [34] Wang Z, Perc M. Aspiring to the fittest and promotion of cooperation in the prisoner’s dilemma game. Phys Rev E. 2010;82:021115. Available from: https://doi.org/10.1103/PhysRevE.82.021115.
- [35] Perc M, Wang Z. Heterogeneous aspirations promote cooperation in the prisoner’s dilemma game. PLoS ONE. 2010;5:e15117. Available from: https://doi.org/10.1371/journal.pone.0015117.
- [36] Wang Z, Wang Z, Zhu X, Arenzon JJ. Cooperation and age structure in spatial games. Phys Rev E. 2012;85:011149. Available from: https://doi.org/10.1103/PhysRevE.85.011149.
- [37] Wang Z, Murks A, Du WB, Rong ZH, Perc M. Coveting thy neighbors fitness as a means to resolve social dilemmas. J Theor Biol. 2011;277:19–26. Available from: https://doi.org/10.1016/j.jtbi.2011.02.016.
- [38] Szolnoki A, Perc M. Evolutionary dynamics of cooperation in neutral populations. New J Phys. 2018;20:013031. Available from: https://doi.org/10.1088/1367-2630/aa9fd2.
- [39] Battiston F, Perc M, Latora V. Determinants of public cooperation in multiplex networks. New J Phys. 2017;19:073017. Available from: https://doi.org/10.1088/1367-2630/aa6ea1.
- [40] Aleta A, Meloni S, Perc M, Moreno Y. From degree-correlated to payoff-correlated activity for an optimal resolution of social dilemmas. Phys Rev E. 2016;94:1–8. Available from: https://doi.org/10.1103/PhysRevE.94.062315.
- [41] Szolnoki A, Perc M. Resolving social dilemmas on evolving random networks. EPL. 2009;86:30007. Available from: https://doi.org/10.1209/0295-5075/86/30007.
- [42] Perc M. Double resonance in cooperation induced by noise and network variation for an evolutionary prisoner’s dilemma. New J of Phys. 2006;8:183. Available from: https://doi.org/10.1088/1367-2630/8/9/183.
- [43] Szolnoki A, Perc M. Emergence of multilevel selection in the prisoner’s dilemma game on coevolving random networks. New J Phys. 2009;11:093033. Available from: https://doi.org/10.1088/1367-2630/11/9/093033.
- [44] Santos FC, Rodrigues JF, Pacheco JM. Epidemic spreading and cooperation dynamics on homogeneous small-world networks. Phys Rev E. 2005 Nov;72:056128. Available from: http://dx.doi.org/10.1103/PhysRevE.72.056128.
- [45] Barabási AL, Albert R. Emergence of scaling in random networks. Science. 1999;286(5439):509–512. Available from: http://dx.doi.org/10.1126/science.286.5439.509.
- [46] Pacheco JM, Santos FC, Souza MO, Skyrms B. Evolutionary dynamics of collective action in N-person stag hunt dilemmas. Proc R Soc B. 2009;276(1655):315–321. Available from: http://dx.doi.org/10.1098/rspb.2008.1126.
- [47] Santos MD, Pinheiro FL, Santos FC, Pacheco JM. Dynamics of N-person snowdrift games in structured populations. J Theor Biol. 2012;315:81 – 86. Available from: http://dx.doi.org/10.1016/j.jtbi.2012.09.001.
- [48] Santos FC, Pacheco JM. A new route to the evolution of cooperation. J Evol Biol. 2006;19(3):726–733. Available from: http://dx.doi.org/10.1111/j.1420-9101.2005.01063.x.
- [49] Szolnoki A, Perc M, Danku Z. Towards effective payoffs in the prisoner’s dilemma game on scale-free networks. Physica A. 2008;387(8):2075 – 2082. Available from: http://dx.doi.org/10.1016/j.physa.2007.11.021.
- [50] Tomassini M, Pestelacci E, Luthi L. Social dilemmas and cooperation in complex networks. Int J Mod Phys C. 2007;18(07):1173–1185. Available from: http://dx.doi.org/10.1142/S0129183107011212.
- [51] Wu ZX, Guan JY, Xu XJ, Wang YH. Evolutionary prisoner’s dilemma game on Barabási-Albert scale-free networks. Physica A. 2007;379(2):672 – 680. Available from: http://dx.doi.org/10.1016/j.physa.2007.02.085.
- [52] Ichinose G, Sayama H. Invasion of cooperation in scale-free networks: Accumulated versus average payoffs. Artif Life. 2017;23(1):25–33. Available from: http://dx.doi.org/10.1162/ARTL_a_00220.
- [53] Masuda N. Participation costs dismiss the advantage of heterogeneous networks in evolution of cooperation. Proc R Soc B. 2007;274(1620):1815–1821. Available from: http://dx.doi.org/10.1098/rspb.2007.0294.
- [54] Traulsen A, Nowak MA, Pacheco JM. Stochastic dynamics of invasion and fixation. Phys Rev E. 2006 Jul;74:011909. Available from: http://dx.doi.org/10.1103/PhysRevE.74.011909.
- [55] Traulsen A, Pacheco JM, Nowak MA. Pairwise comparison and selection temperature in evolutionary game dynamics. J Theor Biol. 2007;246(3):522 – 529. Available from: http://dx.doi.org/10.1016/j.jtbi.2007.01.002.
- [56] Szabó G, Tőke C. Evolutionary prisoner’s dilemma game on a square lattice. Phys Rev E. 1998;58:69–73. Available from: http://dx.doi.org/10.1103/PhysRevE.58.69.
- [57] Albert R, Jeong H, Barabasi AL. Error and attack tolerance of complex networks. Nature. 2000;406(6794):378–382. Available from: http://dx.doi.org/10.1038/35054111.
- [58] Perc M. Evolution of cooperation on scale-free networks subject to error and attack. New J Phys. 2009;11:033027. Available from: http://dx.doi.org/10.1088/1367-2630/11/3/033027.
- [59] Ichinose G, Tenguishi Y, Tanizawa T. Robustness of cooperation on scale-free networks under continuous topological change. Phys Rev E. 2013;88(5):052808. Available from: http://dx.doi.org/10.1103/PhysRevE.88.052808.
- [60] Sayama H, Dionne SD. Studying collective human decision making and creativity with evolutionary computation. Artif Life. 2015;21:379–393. Available from: http://dx.doi.org/10.1162/ARTL_a_00178.
- [61] Fisher RA. The genetical theory of natural selection. Oxford University Press; 1930.
- [62] Maciejewski W. Reproductive value in graph-structured populations. PLoS Comput Biol. 2014;340:285–293. Available from: http://dx.doi.org/10.1016/j.jtbi.2013.09.032.
- [63] Tarnita CE, Taylor PD. Measures of relative fitness of social behaviors in finite structured population models. Am Nat. 2014;184:477–488. Available from: http://dx.doi.org/10.1086/677924.