Pulsar Science with the SKA
Abstract
The Square Kilometre Array (SKA) will be sensitive enough to discover all of the pulsars in the Milky Way that are beamed towards Earth. Already in the initial deployment, SKA Phase 1, it will make significant advances in pulsar science. In these proceedings I briefly overview what the SKA is, and describe its pulsar search and timing capabilities.
keywords:
gravitation, gravitational waves, telescopes, pulsars: general, Galaxy: stellar content.1 What is the SKA?
What is the SKA? This oft-posed question usually results in a wide range of answers. According to publishable responses made by the delegates of IAU 337, the SKA is:“crazy”, “crazy, but in a good way”, “the most ambitious science project there has ever been”, “the future of pulsar astronomy”, “imminent”, “bloody difficult”, “actually coming together”. The SKA is a number of things, which we now expand upon.
1.1 Two Telescopes
The SKA is 2 telescopes: The SKA observatory consists of two array telescopes, each located at a different site and each covering a different sky frequency range. The initial deployment of SKA, termed Phase 1 or simply SKA1, consists of a ‘low’ frequency array in Western Australia and a ‘mid’ frequency array in South Africa (see Figure 1, Table 1). A number of SKA precursor instruments are currently operating at these sites: the Murchison Widefield Array (MWA) and Australian SKA Pathfinder (ASKAP) in Western Australia; the Hydrogen Epoch of Reionization Array (HERA) and MeerKAT in South Africa. MeerKAT will be fully integrated into the SKA1-Mid array; SKA1-Mid thus consists of 13315-m ‘SKA’ dishes and 6413.5-m MeerKAT dishes.
To justify its name the full SKA deployment, often termed SKA2, will need to have a physical collecting area of for each telescope which is equivalent to that of a -m single dish fully illuminated. In terms of how close the initial deployment is to this we note that SKA1-Mid has a physical collecting area of km2, equivalent to a single dish diameter of 200 metres. SKA1-Low is an aperture array consisting of stations of log-periodic dipole antennas, so that the collecting area is frequency dependent. It falls as the square of the sky frequency above the ‘dense-sparse’ transition frequency which is at approximately MHz for the SKA1-Low design; thus at zenith SKA1-Low has an effective collecting area of km2 at 100 MHz, but only km2 and km2 at 200 and 300 MHz respectively. Clearly the jump from SKA1 to SKA2 will need to be larger for Mid than for Low; indeed the full deployment of SKA-Mid is planned to expand into eight more countries in Southern Africa111The African partner countries are Botswana, Ghana, Kenya, Madagascar, Mauritius, Mozambique, Namibia and Zambia..

| SKA1-Low | SKA1-Mid |
|---|---|
| MHz | Band 1: MHz |
| Band 2: GHz | |
| Band 3*: GHz | |
| Band 4*: GHz | |
| Band 5a: GHz | |
| Band 5b: GHz | |
| Band 6*: GHz |
The top level design of SKA1 is frozen (Caiazzo et al. , 2017). At the time of writing (October 2017) we are in the latter stages of the detailed design phase for SKA1, which itself began in 2013. At that time the entire SKA1 system was divided into design elements (and thence sub-elements). The critical design reviews of the elements, and thence the system, are scheduled to occur during 2018. At this time the project progresses to the construction phase which is expected to take 5 years. As it is already a large leap in capabilities in many senses compared to other facilities the observatory will operate with the Phase 1 deployment for several years before expanding to the full SKA.
1.2 Science Driven
The SKA is science driven: For SKA1 there are 13 High Priority Science Objectives (HPSOs, see Braun et al. 2015b); one is pulsar search, another pulsar timing. The initial deployment is designed to deliver on these in particular but will be capable of much more. The full SKA science case is extremely broad and described in the 2015 Science Book (Braun et al. , 2015a), a 2000-page 1200-author 135-chapter tome on planned science activities with the SKA. Amongst the HPSOs pulsar science is unique in its use of both Mid and Low. Fast Radio Burst (FRB) science is considered a Mid HPSO simply because FRBs have not yet been detected in the Low band; in practice however FRB searching comes with the ability to perform pulsar searches and will also occur on SKA1-Low.
In the first 5 years the HPSOs will be addressed. The observing time needed amounts to y and y for Low and Mid respectively (Braun et al. , 2015b). Even considering just basic observational constraints (e.g. Epoch of Reionisation observations can only meaningfully be performed at night and when the ionospheric conditions permit, pulsar timing applications need a lot of Galactic time, etc.), down time, and the fraction of time spent on non-HPSO science, it is clear that the HPSO time far exceeds wall time if everything is done sequentially. Fortunately commensality is an integral part of the design and one can (on both Low and Mid) perform imaging, pulsar search and pulsar timing simultaneously. Furthermore SKA1-Low can form multiple station beams in different directions on the sky, with each performing different (and multiple) types of observation. On both Low and Mid there is a single pulse search which will identify pulsars via their single pulses (rather than by periodicity searches), but also FRBs. This mode is quite low power (power availability being a key constraint at both sites) so that in principle it could be run commensally 24/7 meaning these single pulse searches would come ‘for free’ (at least in the sense of observing time). Recently the ability to accommodate ‘custom experiments’ has been added to the design. Subject to various practical constraints at each site one could then ‘plug in’ additional hardware and/or run custom pipelines to add further capabilities for simultaneous science applications.
1.3 Sovereign
The SKA is sovereign: The 10 SKA member countries which fund the project are: Australia, Canada, China, India, Italy, the Netherlands, New Zealand, South Africa, Sweden and the United Kingdom. At present the SKA is transitioning, becoming an inter-governmental organisation (IGO). Examples of other IGOs in operation are ESO, CERN, NATO and the UN. The details of the IGO treaty are currently being finalised at government level in the member countries and ultimately require ratificiation in the various parliaments. This IGO process is happening in parallel to the final stages of the technical design work, and should conclude before construction will begin.
1.4 A Community
The SKA is a community: There is a large community of astronomers world wide working on SKA science. The SKA Science Working Groups (SWGs), and Focus Groups comprise professional astronomers from around the world; this community has shaped what the SKA is and is who the SKA will serve. The Pulsar SWG is amongst the most active and engaged of all groups and is open to any active PhD-level pulsar astronomer who is interested in contributing. The SWG is organised into two tiers, with a smaller core group led by two chairs222At the time of writing the Pulsar SWG chairs are Andrea Possenti and Ingrid Stairs; the author is the relevant point of contact in the SKA science team..
2 Pulsar Capabilities
Pulsar-driven design requirements are to be found throughout the entire SKA1 system. Most intensive ‘non-image processing’ is concentrated within the Central Signal Processor (CSP) which is the element for the beam-formers and correlators, but also the pulsar search and timing back-ends. CSP is located at the observatory sites, and fed with data from the individual dishes/stations (the SKA1-Low stations have an additional station-level beam-former). Within CSP, beam-forming occurs and the resultant data products go to the pulsar search and/or timing back-ends. After CSP, the data are transported to the Science Data Processor (SDP). Correlated data for imaging applications are sent directly from the CSP correlator to SDP with no further processing at the observatory site; imaging occurs in SDP. For pulsar purposes SDP assesses pulsar candidates identified by the pulsar search backend, and performs pulsar timing from the folded profiles sent to it from the timing backend. Another element of interest for pulsar applications is Signal And Data Transport (SaDT) which is responsible for the observatory clocks, the distribution of time and frequency across the arrays and the networking of all elements.
2.1 Pulsar Search Capabilities
Pulsar search capabilities are provided by the pulsar search backend (PSS), a sub-element of CSP. It can perform real-time pulsar searches for observations with durations up to 30 mins. These searches dedisperse the data for dispersion measures (DM) from to . A single pulse search (for pulsars and FRBs) is performed across this range. An acceleration search is also performed: for a 10-minute pointing, this involves acceleration searches for binary pulsars in the range for at least DM trials. This happens for each tied-array power beam provided by the beamformer — 500 on SKA1-Low, 1500 on SKA1-Mid. The bandwidth of these beams is and MHz respectively, and one can have less beams for proportionally more bandwidth.
For pulsar applications the entire SKA1 arrays will not be used. The improvement in sensitivity with the addition of long-baseline elements is outweighed by the large decrease in beam-size, i.e. a much larger beam-former would be needed. PSS can operate in up to 16 sub-arrays each containing elements within a 20-km diameter. The maximum size pulsar sub-array (one centred at the array centre) then consists of 404 stations and 164 dishes (100 SKA + all 64 MeerKAT) on SKA1-Low and -Mid respectively, corresponding to and of the full array effective collecting areas. Pulsar search will most likely use a sub-array consisting of approximately the inner 1 km, with the 20-km sub-array option being used for a times improvement on the initial localisation, as done with LOFAR (Stappers et al. , 2011). For the inner km this then involves 224 stations and 93 dishes (55 SKA + 38 MeerKAT) on SKA1-Low and -Mid respectively, corresponding to and of the full array effective collecting areas.
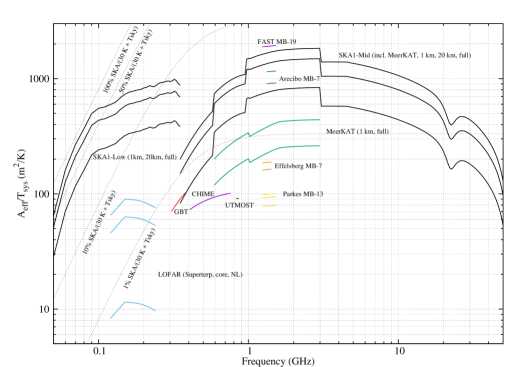
Figure 2 shows the gain of SKA1 for sub-arrays consisting of the inner 1 km, 20 km (and the full array for reference) for an ‘average’ line of sight through the Galaxy; for comparison several other pulsar-search relevant telescopes are also shown. Figure 2 shows the equal-bandwidth non-accelerated pulsar survey speed figure of merit, defined as . A number of caveats must be made in interpreting these figures of merit. A survey performed with sub-arrays of radii m and m could be read as equal — the former configuration involves less longer pointings, the latter more shorter pointings. However this is not true as the observing time per pointing is related directly to the computing needed to process the data. More importantly, this problem is compounded for acceleration searches for two reasons: firstly one cannot compensate for less gain by observing for longer as the number of compute operations required to perform an acceleration search to find the same pulsar scales as . Secondly acceleration searches are ineffectual when is more than of the orbital periods under consideration. As is limited in this way SKA1-Mid pulsar searches will not use sub-arrays at the peak of the survey speed figure of merit, but somewhat larger sub-arrays.

2.2 Pulsar Timing Capabilities
Pulsar timing capabilities are provided by the pulsar timing backend (PST), a sub-element of CSP. For pulsars with DM in the range to and for periods as fast as ms, it can perform observations with durations up to 5 hours. The beamformer produces up to 16 polarisation-calibrated voltage beams for pulsar timing purposes (8 for SKA1-Mid Band 5). The bandwidth of these beams is the entire 300-MHz band for SKA1-Low; for SKA1-Mid it is the full band for Bands 1 and 2, and GHz for Band 5a/b. These data are coherently dedispersed in PST and folded according to the known ephemerides. The process of ‘timing’ to check and update pulsar ephemerides, and react accordingly, is performed in SDP. One can also perform pulsar searches using the timing backend using the “dynamic spectrum mode”, essentially a mode where PST doesn’t fold the data, and reduces the time and/or frequency resolution to keep the data rate within limits, and with coherent dedispersion optional. This mode is appropriate for long targetted search pointings, e.g. Sgr A*, globular clusters, supernova remnants etc. Noteworthy, but on the negative side, is that Band 3 (S-band) is not covered in the initial construction budget — an upgrade focused on pulsar timing would no doubt prioritise this (Cordes et al. , 2016; Shannon & Cordes , 2017). In terms of timing precision, there is uncertainty in the common delay centre of each SKA sub-array in the amount of ns (), with the SKA timescale linked to UTC with an uncertainty of ns () for SKA1-Mid; for SKA1-Low it is ns (). These effects combine in quadrature to give ns and ns for SKA1-Mid and -Low respectively. TOA uncertainty decreases with increasing S/N until this intrumental limit is reached, if the limit due to intrinsic pulse jitter (which is pulsar specific) is not reached first.
Acknowledgements
EK would like to thank everyone involved with the meeting for their fantastic efforts in delivering a truly amazing week. EK looks forward to defending the title of “Pulsar Pub Quiz Champion” in 10 years time, at a venue also hopefully without wifi.
References
- (1)
- Bailes et al. (2017) Bailes, M. et al. 2017, PASA, 34, e045.
- Barr et al. (2013) Barr, E. D. et al. 2013, MNRAS, 435, 2234.
- Braun et al. (2015a) Braun, R., Bourke, T., Green, J. A., Keane, E. F, & Wagg, J. 2015, PoS, Proceedings of Advancing Astrophysics with the Square Kilometre Array (AASKA14), 174.
- Braun et al. (2015b) Braun, R., Bourke, T., Green, J. A., Keane, E. F, & Wagg, J. 2015, SKA1 Level 0 Science Requirements, SKA-TEL-SKO-0000007 revision 2, 2015-10-28.
- Braun et al. (2017) Braun, R., Bonaldi, A., Bourke, T., Keane, E. F, & Wagg, J. 2017, Anticipated SKA1 Science Performance, SKA-TEL-SKO-0000818 revision 1, 2017-10-17.
- Caiazzo et al. (2017) Caiazzo, M., et al. 2017, SKA Phase 1 System Requirements Specification, SKA-TEL-SKO-0000008 revision 11, 2017-07-31.
- Cordes et al. (2006) Cordes, J. M. et al. 2006, ApJ, 637, 446.
- Cordes et al. (2016) Cordes, J. M., Shannon, R. M., Stinebring, D. R. 2016, ApJ, 817, 16.
- van Haarlem et al. (2013) van Haarlem, M. P. et al. 2013, A&A, 556, A2.
- Keane et al. (2018) Keane, E. F. et al. 2018, MNRAS, 473, 116.
- Keith et al. (2010) Keith, M. J. 2010, MNRAS, 409, 619.
- Li & Pan (2016) Li, D., Pan, Z. 2016, Radio Science, 51, 1060.
- Rajwade & Lorimer (2017) Rajwade, K. M., Lorimer, D. R. 2017, MNRAS, 465, 2286.
- Shannon & Cordes (2017) Shannon, R. M., Cordes, J. M. 2017, MNRAS, 464, 2075.
- Stappers et al. (2011) Stappers, B. W. et al. 2011, A&A, 530, A80.
- Stovall et al. (2014) Stovall, K. et al. 2014, ApJ, 791, 67.