Quantum tricritical point in the temperature-pressure-magnetic field phase diagram of CeTiGe3
Abstract
We report the temperature-pressure-magnetic field phase diagram of the ferromagnetic Kondo-lattice CeTiGe3 determined by means of electrical resistivity measurements. Measurements up to 5.8 GPa reveal a rich phase diagram with multiple phase transitions. At ambient pressure, CeTiGe3 orders ferromagnetically at = 14 K. Application of pressure suppresses , but a pressure induced ferromagnetic quantum criticality is avoided by the appearance of two new successive transitions for 4.1 GPa that are probably antiferromagnetic in nature. These two transitions are suppressed under pressure, with the lower temperature phase being fully suppressed above 5.3 GPa. The critical pressures for the presumed quantum phase transitions are 4.1 GPa and 5.3 GPa. Above 4.1 GPa, application of magnetic field shows a tricritical point evolving into a wing structure phase with a quantum tricritical point at 2.8 T at 5.4 GPa, where the first order antiferromagnetic-ferromagnetic transition changes into the second order antiferromagnetic-ferromagnetic transition.
I Introduction
Quantum phase transitions (QPT) in metallic ferromagnets have been studied for many years and remain a subject of great current interest Brando et al. (2015). The paramagnetic (PM) to ferromagnetic (FM) transition can be suppressed with nonthermal control parameters such as pressure, chemical composition or external field often leading to a = 0 K, QPT. However, according to the current theoretical models, when suppressing the FM phase with a clean parameter such as pressure, a continuous PM to FM transition is not possible. Instead, the transition becomes of the first order or a modulated magnetic phase can appear. The possibility of a first-order transition or the appearance of modulated magnetic phases was first discussed in Ref. Belitz et al., 1997 and Belitz et al., 1999. In the case of the transition becoming of the first order, a wing structure was predicted in Ref. Belitz et al., 2005 and observed in UGe2 Taufour et al. (2010) and ZrZn2 Kabeya et al. (2012). The case of the appearance of a modulated magnetic phase is more complexBelitz et al. (1999, 1997); Chubukov et al. (2004); Conduit et al. (2009); Karahasanovic et al. (2012); Thomson et al. (2013); Pedder et al. (2013); Taufour et al. (2016a) and an experimental examples were found in LaCrGe3 Taufour et al. (2016a) and CeRuPO Kotegawa et al. (2013). Observation of both tricritical wings and modulated magnetic phase in LaCrGe3 is a good example of a complex phase diagram and provides a new example of the richness of the phase diagram of metallic quantum ferromagnets Kaluarachchi et al. (2017). Recently, Belitz and Kirkpatrick proposed that such complex phase diagram is due to quantum fluctuation effects Belitz and Kirkpatrick (2017).
Cerium based compounds have attracted attention due to interesting ground states, such as heavy-fermion, unconventional superconductor Grosche et al. (1996); Mathur et al. (1998), Kondo insulator Hundley et al. (1990), magnetic ordering Iglesias et al. (1997); Evans et al. (1991), etc. Whereas many Ce-based compounds manifest an antiferromagnetic (AFM) ground state, only few systems are known with FM order and pronounced Kondo effects. CeRuPO Kotegawa et al. (2013), CeAgSb2 Myers et al. (1999); Sidorov et al. (2003), CeNiSb3 Sidorov et al. (2005), CePd2Ge3 Burghardt et al. (1997) and Ce2Ni5C3 Yamada et al. (2010) are some examples of the Ce-based ferromagnets, which show complex phase diagrams under the application of pressure. Interestingly, the FM transition in these materials is suppressed with the pressure and new magnetic (most probably AFM) phases appear before the Curie temperature reaches 0 K but no wing structure in the -- phase diagrams has been observed so far. According to the recent theoretical work by Belitz et al. Belitz and Kirkpatrick (2017), it is possible to have unobservable tricritical wings inside the AFM dome. In most of these cases, lack of in-field measurements under pressure prevents from constructing the temperature-pressure-field phase diagram and getting a better understanding of the system. Therefore, it is interesting to further investigate the temperature-pressure-field effect on a Ce-based ferromagnetic system. To address this, we present measurements of electrical resistivity under pressure up to 5.8 GPa and magnetic field up to 9 T on ferromagnetic CeTiGe3.
CeTiGe3 is one of the relatively rare examples of a ferromagnetic Kondo lattice (=75 mJ mol−1 K2 Inamdar et al. (2014)); it orders with a Curie temperature, = 14 K Manfrinetti et al. (2005). It crystallizes in the hexagonal perovskite BaNiO3 - type structure () Manfrinetti et al. (2005). Magnetization measurements show highly anisotropic behavior with -axis being the easy axis of magnetization Inamdar et al. (2014). A Curie-Weiss fit to the susceptibility data yields an effective moment of 2.5 , consistent with the reported values Inamdar et al. (2014) and nearly equal to the value for free-ions trivalent Ce (2.54 ). The reported saturation moment at 2 K from the magnetization data (1.72 /Ce) along the -axis Inamdar et al. (2014) is comparable with the value obtained from the neutron diffraction study(1.5 /Ce) Kittler et al. (2013). Substitution of titanium by vanadium (CeTi1-xVxGe3) causes a suppression of the Curie temperature down to 3 K at = 0.3 and suggests a possible quantum critical point or phase transition near 0.35 Kittler et al. (2013). In contrast to the effect of substitution, a very small, initial positive pressure derivative of (d/d 0.3 K GPa-1 up to 1 GPa) suggests that CeTiGe3 is located near the maximum of the magnetic ordering temperature in the Doniach model Kittler et al. (2013). However, all substitution and pressure measurements have been done on the polycrystalline material and only to modest pressure, 1 GPa. To get a better understanding of -- phase diagram, possible FM instability and QCP it is important to perform high pressure studies on single crystalline samples of CeTiGe3 over a wide pressure range.
II Experimental Methods
Single crystals of CeTiGe3 were grown using a high temperature solution growth technique Canfield and Fisk (1992); Canfield and Fisher (2001). A mixture of elemental Ce, Ti and Ge was placed in a 2 mL fritted alumina crucible Canfield et al. (2016) with a molar ratio of Ce:Ti:Ge = 4:1:19 Inamdar et al. (2014) and sealed in a silica ampule under a partial pressure of high purity argon gas. The sealed ampule was heated to 1200 \celsius over 10 hours and held there for 5 hours. It was cooled to 900\celsius over 120 hours and excess liquid was decanted using a centrifuge. A good quality sample (based on the residual resistivity ratio) for the pressure study was selected after ambient pressure characterization by the magnetization and resistivity measurements. Temperature and field dependent resistance measurements were carried out using a Quantum Design (QD) Physical Property Measurement System (PPMS) from 1.8 K to 300 K. The -resistivity ( = 17 Hz) was measured by the standard four-probe method with the 1 mA current in the plane. Four Au wires with diameters of 12.5 m were spot welded to the sample. A magnetic field, up to 9 T, was applied along the -axis, which corresponds to the magnetization easy axis Inamdar et al. (2014). A modified Bridgman cell Colombier and Braithwaite (2007) was used to generate pressure for the resistivity measurement. A 1:1 mixture of -pentane:iso-pentane was used as a pressure medium. The solidification of this medium occurs around 6-7 GPa at room temperature Tateiwa and Haga (2009); Piermarini et al. (1973); Klotz et al. (2009); Kim et al. (2011); Torikachvili et al. (2015). The pressure at low temperature was determined by the superconducting transition temperature of Pb Bireckoven and Wittig (1988).
III Results and Discussion
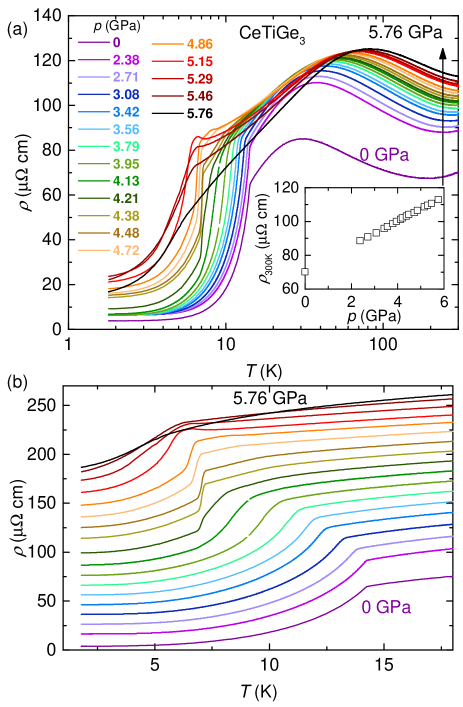
The temperature dependencies of the in-plane resistivity of single crystalline CeTiGe3 under various pressures up to 5.76 GPa are shown in Fig. 1 (a). At ambient pressure, the resistivity exhibits typical Kondo-lattice behavior with a broad minimum 190 K followed by a maximum at = 31 K. The is assumed to be related to the Kondo interaction with a changing population of crystal electric field levels Inamdar et al. (2014); Cornut and Coqblin (1972); Hanzawa et al. (1985); Taufour et al. (2013). The FM transition manifests itself in the resistivity data as a sharp drop at = 14.2 K. Similar values of have been reported from polycrystalline and single crystalline samples Manfrinetti et al. (2005); Kittler et al. (2013); Inamdar et al. (2014). The residual resistivity ratio (RRR) is 19, a value that suggests a rather good quality of the sample. Upon application of pressure the resistivity at room temperature increases linearly with a rate of 7.4 cm GPa-1 over the whole pressure range (see inset of Fig. 1 (a)), both the local maximum and local minimum in the resistivity broaden and move to higher temperatures with increasing pressure. The evolution of the low temperature resistivity is shown in Fig. 1 (b); data are offset by increments of 10 cm for clarity.
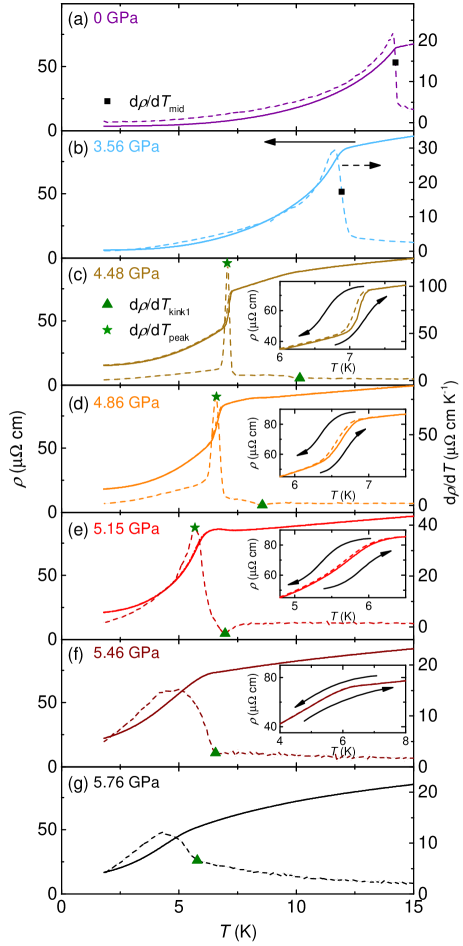
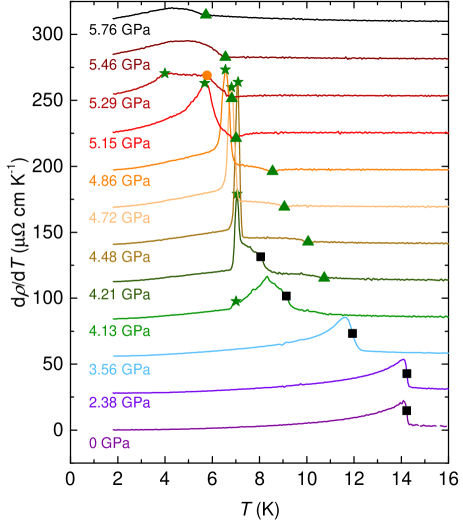
Figure 2 shows the evolution of the low temperature resistivity and its temperature derivatives in three selected pressure regions; (I) 4.1 GPa (II) 4.1 GPa 5.3 GPa and (III) 5.3 GPa. Below 4.1 GPa the FM transition is seen as a sharp change of slope in the resistivity and transition temperature is obtained from the sharpest increase of d/d (black square) (Figs. 2 (a)-(b)). The FM transition temperature initially shows a weak increase with pressure and then decreases with further applied pressure up to 4.1 GPa. Between 4.1-5.3 GPa, the onset of magnetic transition 1 (MP1) and magnetic transition 2 (MP2) are revealed as a kink/upturn and a sharp drop in the as shown in Figs. 2 (c)-(e) . This can be clearly seen in the temperature derivative of the resistivity. Transition temperatures of PM-MP1 and MP1-MP2 are obtained from the kink/minimum (green up-triangle, Figs. 2 (c)-(e)) and sharp peak (green star) in d/d (Figs. 2 (c)-(e)) respectively. Although the magnetic ordering wave vector of MP1 is unknown, the feature in the resistivity is similar to that associated with superzone gap formation Mackintosh (1962) and suggests an AFM nature for MP1. Both MP1 and MP2 transitions are observed between 4.1 to 5.3 GPa and thermal hysteresis in for MP2 up to 5.3 GPa (inset of Figs. 2 (c)-(e)) indicates a first-order nature for this transition. On further increase of pressure, above 5.3 GPa, MP2 disappears and a new magnetic transition, MP1', continue to decrease with the increase of pressure and no thermal hysteresis is observed (Figs. 2 (f)-(g)). Although features in the (T) corresponding to the MP1 and MP1' transitions look similar, it is unclear whether it is same phase or not. Figure 3 shows the evolution of the temperature derivative of the resistivity for representative pressures. Solid symbols represent the criteria described in Fig. 2.
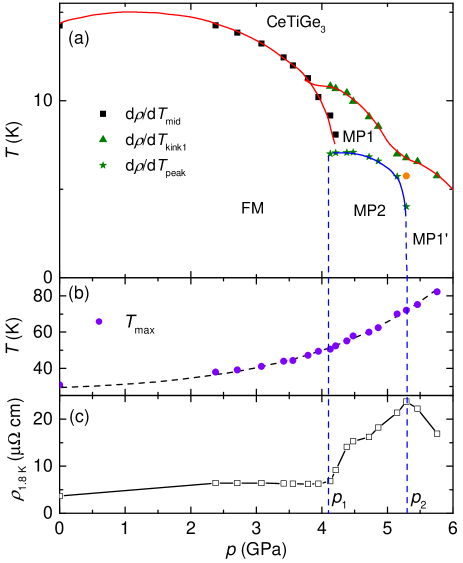
The temperature-pressure () phase diagram of CeTiGe3 obtained from the resistivity measurements, is summarized in Fig. 4 (a). At low pressures, the Curie temperature of the ambient pressure, FM phase (solid squares) shows a very weak pressure dependence and then decreases with pressure. For 4.1 GPa 5.3 GPa, there is an evidence for two phase transitions, MP1 and MP2 in the curves, which interrupted the initial FM phase transition line. A similarly complex phase diagram has been observed in CeNiSb3 Sidorov et al. (2005) and the recently studied itinerant ferromagnet LaCrGe3 Taufour et al. (2016a). Pressure induced transitions from FM to AFM state are also observed in several other Ce-based compounds, such as CeAgSb2 Sidorov et al. (2003), CeNiSb3 Sidorov et al. (2005), CePd2Ge3 Burghardt et al. (1997), Ce2Ni5C3 Yamada et al. (2010) and CeRuPO Kotegawa et al. (2013). Above 5.3 GPa, the low temperature MP2 phase disappears and MP1' continue to decrease with the increase of pressure. As mentioned above, it is unclear whether there is a phase boundary between MP1 and MP1' near 5.3 GPa.
In addition to the phase diagram, we find that, monotonically increases from 31 K to 82 K upon increasing pressure (Fig. 4 (b)). The smooth change of indicates that the existence of the new phases is not associated with a discontinuous changes in the electronic or crystal structure or CEF splitting. Figure 4 (c) shows the pressure evolution of the resistivity at 1.8 K. The results show breaks in at (FM to MP2) and a maximum at (MP2 to MP1). The exact nature of the phase transitions at and are not known and to resolve this, it would be useful to study the magnetic ordering wave vector under pressure.
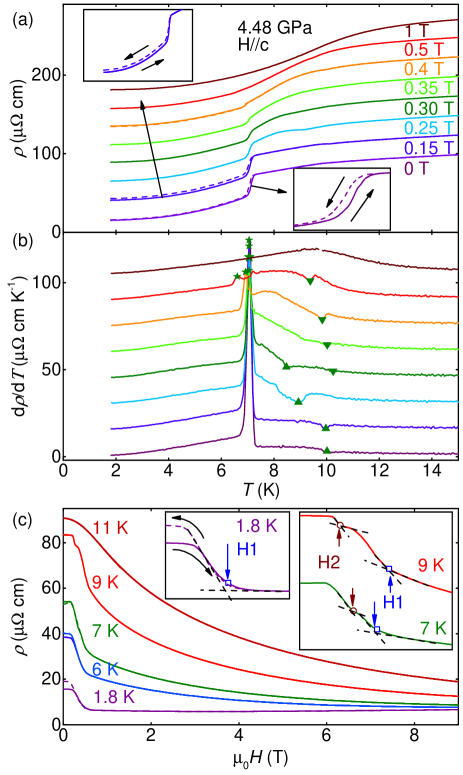
Application of an external magnetic field adds another dimension to our phase diagram and different behavior of the resistivity anomalies under magnetic field allow us to explore further new phase regions of this material. Figure 5 (a) shows the temperature dependence of at different magnetic fields, applied along the -axis, at 4.48 GPa. The sharp drop in the resistivity at low fields ( 0.3 T) broadens at higher fields. These data manifest hysteretic behavior up to 0.5 T, indicating the first order nature of the transition. The zero-field kink in the resistivity, at 9.8 K, changes into a hump with the increase of field (0.25 T) and disappears at 0.3 T. Another hump like feature appears above 0.35 T and broadens with further increase of the field. These features can be clearly observed in temperature derivative shown in Fig. 5 (b).
The field dependence of ( = 4.48 GPa) below 7 K shows a metamagnetic transition with a low field plateau followed by a step-like feature and develops into two transitions above 7 K (Fig. 5 (c)). The solid and dashed lines represent the field increasing () and decreasing () respectively. The difference between - shows a sizable deviation ( is smaller in the increasing-field than the decreasing-field) for 0 0.3 T range. In Fig. 5, hysteresis is apparent not only in the transition temperature (Fig. 5 (a)) and transition field (Fig. 5 (c)), but also in the magnitude of the resistivity. Similar hysteretic behavior is observed in the CeAuSb2 Balicas et al. (2005); Lorenzer et al. (2013); Zhao et al. (2016) and CeAl4Si2 ( = Rh, Ir) Maurya et al. (2016) . Based on the hysteretic behavior, we can conclude these metamagnetic transitions are likely associated with a first-order phase transition. The observed hysteresis in the magnitude of resistivity indicates the possibility of magnetic domains. At temperatures above 11 K, the resistivity shows a very broad anomaly and no transition has been observed. Criteria used to obtain transition fields are shown in the inset of Fig. 5 (c).
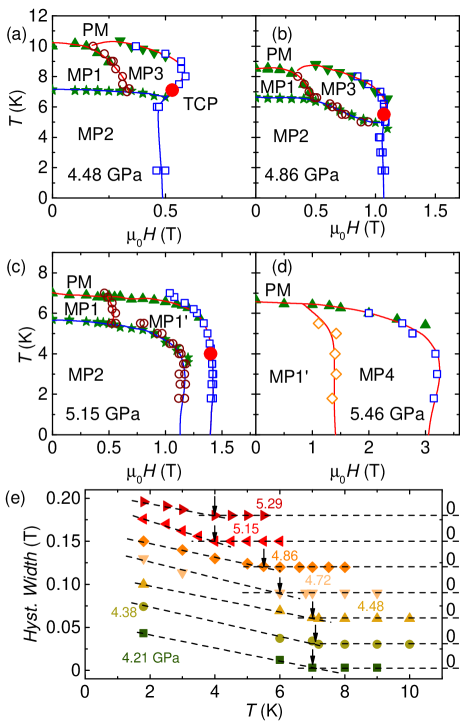
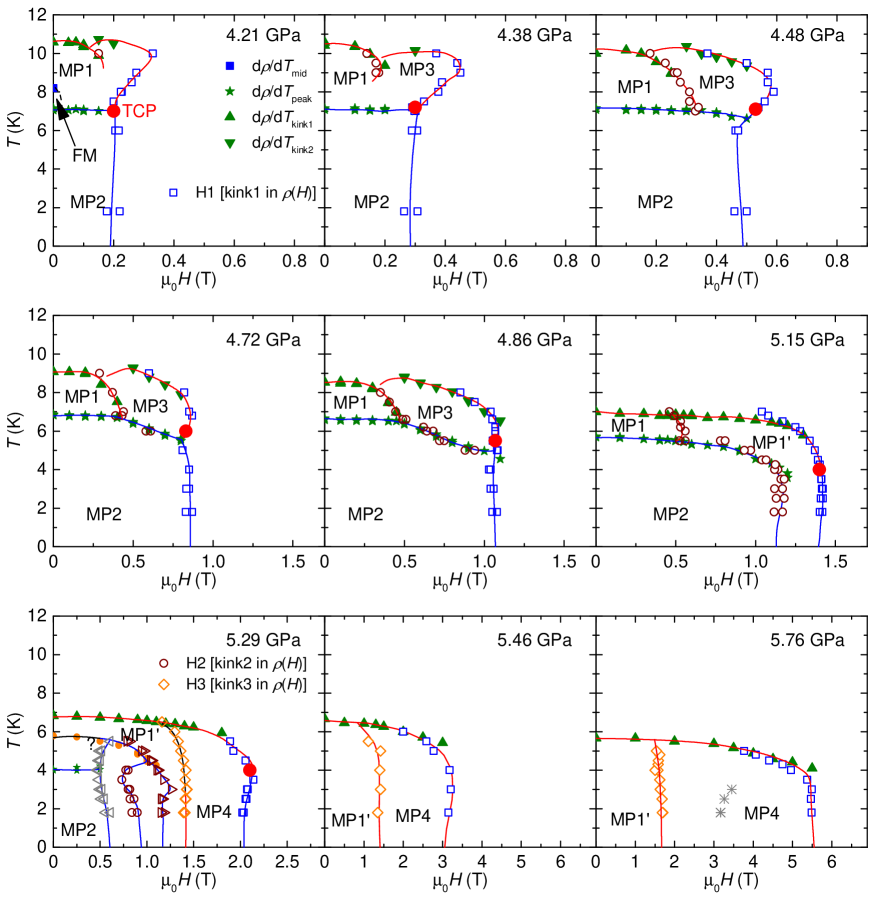
Figures 6 (a)-(d) show the phase diagrams at representative pressures. Transition temperatures determined by -sweep measurements are shown by closed symbols and anomalies appeared in isothermal -sweep measurements are shown by open symbols. Continuous blue and red lines indicate the first order and second order transitions respectively (based on the presence or lack of hysteretic behavior respectively). The red circle represents the tricritical point (TCP) determined by Fig. 6 (e). Temperature dependence hysteresis widths for the transition at H1 are shown in Fig. 6 (e). The data are vertically offset by 0.03 T to avoid overlap. Clear hysteresis at low temperature gradually decreases with increasing temperature and disappears at a TCP as shown by a vertical arrow. In contrast to the wing-critical-point (WCP) in UGe2 Taufour et al. (2010) and LaCrGe3 Kaluarachchi et al. (2017), here we observed a TCP in the phase diagram where first order transition changes into the second order transition. This TCP corresponds to the boundary of the wing structure similar to UGe2 Taufour et al. (2010) and LaCrGe3 Kaluarachchi et al. (2017). The phase diagrams of CeTiGe3 for pressures between 4.1 - 5.3 GPa show complex behavior. Three magnetic phases (MP1, MP1' and MP2) are identified by the anomalies in the resistivity measurement. Both MP1 and MP1' phases are separated by MP2 phase by a first order transition as shown in Figs. 6 (a)-(c). For pressures between 4.1-5.3 GPa, these phase diagrams are similar to those found for CeRu2Al2B Baumbach et al. (2012), which undergoes a second order AFM transition that is followed by a first order FM transition as a function of temperature. Above 5.3 GPa, only two magnetic phases; MP1' and MP4 are identified by the resistivity measurements and there is no longer a first order phase transition boundary observed. The phase diagrams for all the pressures above 4.13 GPa are shown in Fig. 10.
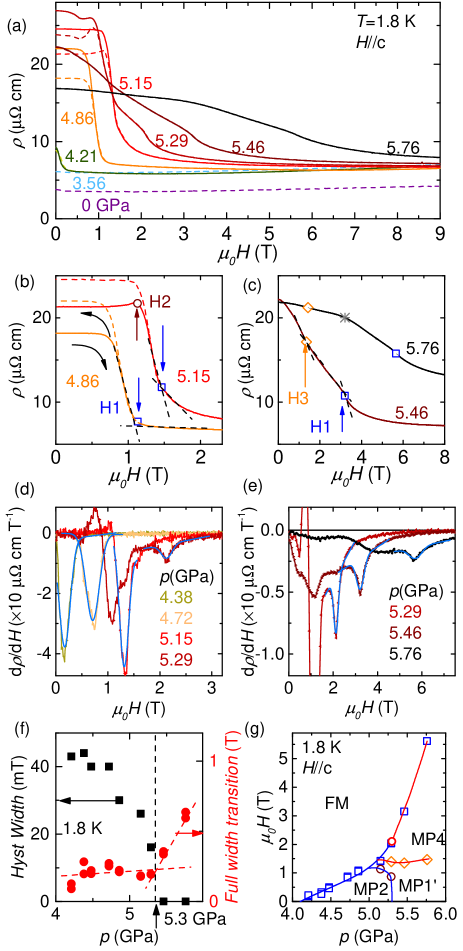
Figure 7 (a) shows the field dependence of the resistivity at 1.8 K, , for different pressures. For the pressures in between and , for an increasing magnetic field shows a clear metamagnetic transition with a substantial ( ), drop of resistivity. For higher pressures, the sharp drop in the disappears and several metamagnetic transitions can be observed. Figures 7 (b) and (c) show the representative magnetoresistance data for 4.1 GPa 5.3 GPa and 5.3 GPa respectively. Transition fields determined by -sweeps measurements are shown by the open symbols. To estimate the transition width, we used the field derivative of the resistivity at 1.8 K, as shown in Figs. 7(d) and (e). The minimum at H1 is fitted with Gaussian+linear-background and obtained the width of the Gaussian distribution. The blue color lines in Figs. 7(b) and (c) represent the fitted curves to the data. We noticed that the transition width (Fig. 7 (f) right axis) at H1 at 1.8 K remains small for the first-order transition and becomes broad in the second-order regime. Using linear extrapolation as represented by red dashed lines, we obtained pressure corresponding to the TCP at 1.8 K, which is 5.3 GPa. In addition to that, the temperature dependence hysteresis width for transition H1 at 1.8 K is also suppressed with the pressure and disappeared above 5.3 GPa as shown in Fig. 7 (f) left axis. Figure 7 (g) shows the phase diagram at 1.8 K constructed from the above criteria. The magnetic field that corresponds to the H1 transition is shifted up with pressure. Its extrapolation down to zero yields 4.1 GPa, which is in agreement with the obtained from - diagram (Fig. 4 (a)). We observe the increasing rate of metamagnetic transition field with respect to pressure, changes near 5.3 GPa. Similar phase diagrams at low temperature have been observed in LaCrGe3 Kaluarachchi et al. (2017) and CeRu2(Si1-xGex)2 system Matsumoto et al. (2011); Aoki et al. (2014). CeRu2Ge2 is a local moment system Süllow et al. (1999), while CeRu2Si2 is itinerant Aoki et al. (1993). Application of pressure to CeRu2Ge2 gives nearly same magnetic phase diagram as that of CeRu2(Si1-xGex)2 Wilhelm and Jaccard (1998); Haen et al. (1999). Observed transport and de Haas-van Alphen data suggest that, for this system, change of the - electron nature from local to itinerant occurs when the FM phase disappears Matsumoto et al. (2011). On the other hand, itinerant ferromagnet LaCrGe3 show tricritical wings as well as modulated magnetic phase. Interestingly, phase diagram of both LaCrGe3 Kaluarachchi et al. (2017) and CeRu2Ge2 Aoki et al. (2014) without AFM states is similar to the itinerant weak ferromagnet like UGe2 Taufour et al. (2010). This similarity might imply that the physics behind these phase diagrams are not very different.
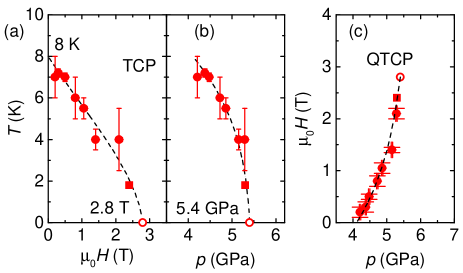
The projection of the wing lines in , and planes are shown in Figs. 8 (a),(b) and (c) respectively. The wing lines can be extrapolated to a quantum-tri-critical-point (QTCP) at 0 K, which is found to be at 2.8 T at 5.4 GPa. Theoretical analysis based on Landau expansion shows that the slope of the wings d/d and d/d are infinite near = 0 T Taufour et al. (2016b). This was observed experimentally in URhGe Nakamura et al. (2017). It was also observed in LaCrGe3, despite the existence of another magnetic phase Kaluarachchi et al. (2017). Here, we do not observe such behavior which could be due to the existence of the magnetic phase MP1 or to the lack of data near . More careful measurements near . are required. Also, the TCP at = 0 T is found to be 8 K and this is below the MP1 transition. A similar observation was made in LaCrGe3 Kaluarachchi et al. (2017) where the TCP seems to be located below the Lifshitz point. Recent theoretical description by Belitz and Kirkpatrick in Ref. Belitz and Kirkpatrick, 2017 shows the complex behavior of the phase diagrams of metallic magnets when an AFM order is observed in addition to the FM phase due to the quantum fluctuations. Similar to the Fig. 4 (a) in Ref. Belitz and Kirkpatrick, 2017, we observed a QTCP where first order AFM-FM transition changes into the second order AFM-FM transition at 2.8 T at 5.4 GPa (see Fig. 7 (g)). Very recently QTCP has experimentally observed in NbFe2 Friedemann et al. (2017).
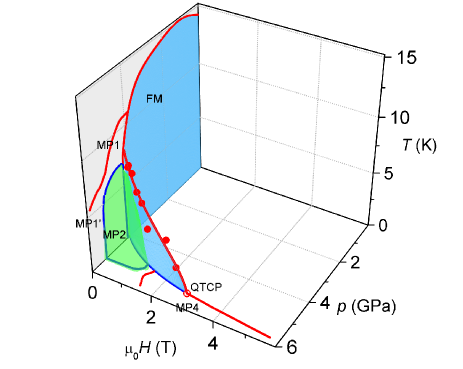
The constructed, partial, phase diagram of CeTiGe3 based on resistivity measurements is shown in Fig. 9. A FM QCP in CeTiGe3 is avoided by the appearance of MP1 and MP2 phases, and shows field induced wing structure above 4.1 GPa. The estimated QTCP is shown by the open red circle. In order to provide clear picture of the wing structure phase diagram, we show only selected phases here (see Fig. 10 for - phase diagrams at various pressures). In the case of the itinerant the ferromagnet, LaCrGe3 Taufour et al. (2016a); Kaluarachchi et al. (2017), the second-order FM transition becomes a first order at a tricritical point in the - plane and application of a magnetic field reveals a wing structure phase diagram. Appearances of modulated magnetic phase in LaCrGe3 Kaluarachchi et al. (2017) makes it the first example of new type of phase diagram of metallic quantum ferromagnets. Unlike LaCrGe3 (Fig. 5 in Ref. Kaluarachchi et al. (2017)), where, wings are extended beyond the AFM phases, the observed wings in CeTiGe3 are always bounded by the AFM phases. This can be clearly visualized in Fig. 7 (g) (for comparison see Fig. 4 in Ref. Kaluarachchi et al. (2017)). The observation of QTCP in metallic magnets in the case of appearance of AFM order in addition to the FM order is theoretically described by Belitz and Kirkpatrick Belitz and Kirkpatrick (2017). This theoretical finding is consistent with our experimental observation of QTCP in CeTiGe3. Therefore, CeTiGe3 is a good example of a Ce-based compounds in which the system can be driven into various magnetic ground state by fine tuning of the exchange interaction achieved by temperature, pressure and magnetic field.
IV Conclusions
We have measured the high pressure electrical resistivity of CeTiGe3 up to 5.8 GPa and 9 T and found a complex phase diagram. The ferromagnetic transition at ambient pressure initially slightly increases and then decreases, indicates that CeTiGe3 is located just below the maximum (left side) of the Doniach phase diagram. The ferromagnetic transition suppresses near 4.1 GPa and cascade of phase transitions are observed above that. Change in residual resistivity near 4.1 GPa and 5.3 GPa suggests a modification of the electronic structure upon entering these magnetic phases. Thus, CeTiGe3 is another clear example of avoided ferromagnetic quantum critical point due to appearance of magnetic phase (probably antiferromagnetic). Application of magnetic field under pressure above 4.1 GPa reveals wing structure phase diagram. In contrast to the wing critical point in LaCrGe3, we observed a tricritical point in - plane, which corresponding to the boundary of the wing structure. Estimated quantum tricritical point of CeTiGe3 is located at 2.8 T at 5.4 GPa. We believe that the present work will stimulate further experiments to investigate the properties of this material.
ACKNOWLEDGMENTS
We would like to thank S. Manni and A. Kreyssig for useful discussions. This work was supported by the U.S. Department of Energy (DOE), Office of Science, Basic Energy Sciences, Materials Science and Engineering Division. The research was performed at the Ames Laboratory, which is operated for the U.S. DOE by Iowa State University under contract No. DE-AC02-07CH11358. V.T. was partially supported by Critical Material Institute, an Energy Innovation Hub funded by U.S. DOE, Office of Energy Efficiency and Renewal Energy, Advanced Manufacturing Office.
Appendix A Appendix
Figure 10 shows the constructed phase diagrams for pressures between 4.21 to 5.76 GPa. There is a clear difference in the phase diagrams below 4.86 GPa and above 5.46 GPa. phase diagram for the intermediate pressure, 5.29 GPa, shows a complex behavior. Also, we observed an additional shoulder-like anomaly in () at 5.76 GPa (gray color star in Fig. 7 (c) and Fig. 10). When the temperature was increased, it became broadened and merged with H1 and no loner resolvable. H1, H2 and H3 are the anomalies observed in () data as shown in Fig. 5 (c) and Figs. 7 (b)-(c)
Current affiliation: Department of Physics, University of California, Davis, California 95616, USA.
References
- Brando et al. (2015) M. Brando, D. Belitz, F. M. Grosche, and T. R. Kirkpatrick, Rev. Mod. Phys. 88, 025006 (2015).
- Belitz et al. (1997) D. Belitz, T. R. Kirkpatrick, and T. Vojta, Phys. Rev. B 55, 9452 (1997).
- Belitz et al. (1999) D. Belitz, T. R. Kirkpatrick, and T. Vojta, Phys. Rev. Lett. 82, 4707 (1999).
- Belitz et al. (2005) D. Belitz, T. R. Kirkpatrick, and J. Rollbühler, Phys. Rev. Lett. 94, 247205 (2005).
- Taufour et al. (2010) V. Taufour, D. Aoki, G. Knebel, and J. Flouquet, Phys. Rev. Lett. 105, 217201 (2010).
- Kabeya et al. (2012) N. Kabeya, H. Maekawa, K. Deguchi, N. Kimura, H. Aoki, and N. K. Sato, J. Phys. Soc. Jpn. 81, 073706 (2012).
- Chubukov et al. (2004) A. V. Chubukov, C. Pépin, and J. Rech, Phys. Rev. Lett. 92, 147003 (2004).
- Conduit et al. (2009) G. J. Conduit, A. G. Green, and B. D. Simons, Phys. Rev. Lett. 103, 207201 (2009).
- Karahasanovic et al. (2012) U. Karahasanovic, F. Krüger, and A. G. Green, Phys. Rev. B 85, 165111 (2012).
- Thomson et al. (2013) S. J. Thomson, F. Krüger, and A. G. Green, Phys. Rev. B 87, 224203 (2013).
- Pedder et al. (2013) C. J. Pedder, F. Krüger, and A. G. Green, Phys. Rev. B 88, 165109 (2013).
- Taufour et al. (2016a) V. Taufour, U. S. Kaluarachchi, R. Khasanov, M. C. Nguyen, Z. Guguchia, P. K. Biswas, P. Bonfà, R. De Renzi, X. Lin, S. K. Kim, E. D. Mun, H. Kim, Y. Furukawa, C.-Z. Wang, K.-M. Ho, S. L. Bud’ko, and P. C. Canfield, Phys. Rev. Lett. 117, 037207 (2016a).
- Kotegawa et al. (2013) H. Kotegawa, T. Toyama, S. Kitagawa, H. Tou, R. Yamauchi, E. Matsuoka, and H. Sugawara, J. Phys. Soc. Jpn. 82, 123711 (2013).
- Kaluarachchi et al. (2017) U. S. Kaluarachchi, S. L. Bud’ko, P. C. Canfield, and V. Taufour, Nat. Commun. 8, 546 (2017).
- Belitz and Kirkpatrick (2017) D. Belitz and T. R. Kirkpatrick, arXiv:1708.00103 (2017).
- Grosche et al. (1996) F. Grosche, S. Julian, N. Mathur, and G. Lonzarich, Physica B 223, 50 (1996).
- Mathur et al. (1998) N. D. Mathur, F. M. Grosche, S. R. Julian, I. R. Walker, D. M. Freye, R. K. W. Haselwimmer, and G. G. Lonzarich, Nature 394, 39 (1998).
- Hundley et al. (1990) M. F. Hundley, P. C. Canfield, J. D. Thompson, Z. Fisk, and J. M. Lawrence, Phys. Rev. B 42, 6842 (1990).
- Iglesias et al. (1997) J. R. Iglesias, C. Lacroix, and B. Coqblin, Phys. Rev. B 56, 11820 (1997).
- Evans et al. (1991) S. Evans, A. Bhattacharjee, and B. Coqblin, Physica B 171, 293 (1991).
- Myers et al. (1999) K. Myers, S. Bud’ko, I. Fisher, Z. Islam, H. Kleinke, A. Lacerda, and P. Canfield, J. Magn. Magn. Mater 205, 27 (1999).
- Sidorov et al. (2003) V. A. Sidorov, E. D. Bauer, N. A. Frederick, J. R. Jeffries, S. Nakatsuji, N. O. Moreno, J. D. Thompson, M. B. Maple, and Z. Fisk, Phys. Rev. B 67, 224419 (2003).
- Sidorov et al. (2005) V. A. Sidorov, E. D. Bauer, H. Lee, S. Nakatsuji, J. D. Thompson, and Z. Fisk, Phys. Rev. B 71, 094422 (2005).
- Burghardt et al. (1997) T. Burghardt, E. Hallmann, and A. Eichler, Physica B 230, 214 (1997).
- Yamada et al. (2010) A. Yamada, K. Matsubayashi, Y. Uwatoko, K. Kondo, S. Katano, and M. Kosaka, Solid State Commun. 150, 725 (2010).
- Inamdar et al. (2014) M. Inamdar, A. Thamizhavel, and S. K. Dhar, J. Phys. Condens. Matter 26, 326003 (2014).
- Manfrinetti et al. (2005) P. Manfrinetti, S. Dhar, R. Kulkarni, and A. Morozkin, Solid State Commun. 135, 444 (2005).
- Kittler et al. (2013) W. Kittler, V. Fritsch, F. Weber, G. Fischer, D. Lamago, G. André, and H. v. Löhneysen, Phys. Rev. B 88, 165123 (2013).
- Canfield and Fisk (1992) P. C. Canfield and Z. Fisk, Philos. Mag. B 65, 1117 (1992).
- Canfield and Fisher (2001) P. C. Canfield and I. R. Fisher, J. Cryst. Growth 225, 155 (2001).
- Canfield et al. (2016) P. C. Canfield, T. Kong, U. S. Kaluarachchi, and N. H. Jo, Philos. Mag. 96, 84 (2016).
- Colombier and Braithwaite (2007) E. Colombier and D. Braithwaite, Rev. Sci. Instrum. 78, 093903 (2007).
- Tateiwa and Haga (2009) N. Tateiwa and Y. Haga, Rev. Sci. Instrum. 80, 123901 (2009).
- Piermarini et al. (1973) G. J. Piermarini, S. Block, and J. Barnett, J. Appl. Phys. 44, 5377 (1973).
- Klotz et al. (2009) S. Klotz, J.-C. Chervin, P. Munsch, and G. L. Marchand, J. Phys. D: Appl. Phys. 42, 075413 (2009).
- Kim et al. (2011) S. K. Kim, M. S. Torikachvili, E. Colombier, A. Thaler, S. L. Bud’ko, and P. C. Canfield, Phys. Rev. B 84, 134525 (2011).
- Torikachvili et al. (2015) M. S. Torikachvili, S. K. Kim, E. Colombier, S. L. Bud’ko, and P. C. Canfield, Rev. Sci. Instrum. 86, 123904 (2015).
- Bireckoven and Wittig (1988) B. Bireckoven and J. Wittig, J. Phys. E: Sci. Instrum. 21, 841 (1988).
- Cornut and Coqblin (1972) B. Cornut and B. Coqblin, Phys. Rev. B 5, 4541 (1972).
- Hanzawa et al. (1985) K. Hanzawa, K. Yamada, and K. Yosida, J. Magn. Magn. Mater 47, 357 (1985).
- Taufour et al. (2013) V. Taufour, H. Hodovanets, S. K. Kim, S. L. Bud’ko, and P. C. Canfield, Phys. Rev. B 88, 195114 (2013).
- Mackintosh (1962) A. R. Mackintosh, Phys. Rev. Lett. 9, 90 (1962).
- Balicas et al. (2005) L. Balicas, S. Nakatsuji, H. Lee, P. Schlottmann, T. P. Murphy, and Z. Fisk, Phys. Rev. B 72, 064422 (2005).
- Lorenzer et al. (2013) K.-A. Lorenzer, A. M. Strydom, A. Thamizhavel, and S. Paschen, Phys. Status Solidi B 250, 464 (2013).
- Zhao et al. (2016) L. Zhao, E. A. Yelland, J. A. N. Bruin, I. Sheikin, P. C. Canfield, V. Fritsch, H. Sakai, A. P. Mackenzie, and C. W. Hicks, Phys. Rev. B 93, 195124 (2016).
- Maurya et al. (2016) A. Maurya, R. Kulkarni, A. Thamizhavel, D. Paudyal, and S. K. Dhar, J. Phys. Soc. Jpn. 85, 034720 (2016).
- Baumbach et al. (2012) R. E. Baumbach, H. Chudo, H. Yasuoka, F. Ronning, E. D. Bauer, and J. D. Thompson, Phys. Rev. B 85, 094422 (2012).
- Matsumoto et al. (2011) Y. Matsumoto, M. Sugi, K. Aoki, Y. Shimizu, N. Kimura, T. Komatsubara, H. Aoki, M. Kimata, T. Terashima, and S. Uji, J. Phys. Soc. Jpn. 80, 074715 (2011).
- Aoki et al. (2014) H. Aoki, N. Kimura, and T. Terashima, J. Phys. Soc. Jpn. 83, 072001 (2014).
- Süllow et al. (1999) S. Süllow, M. C. Aronson, B. D. Rainford, and P. Haen, Phys. Rev. Lett. 82, 2963 (1999).
- Aoki et al. (1993) H. Aoki, S. Uji, A. K. Albessard, and Y. Ōnuki, Phys. Rev. Lett. 71, 2110 (1993).
- Wilhelm and Jaccard (1998) H. Wilhelm and D. Jaccard, Solid State Commun. 106, 239 (1998).
- Haen et al. (1999) P. Haen, H. Bioud, and T. Fukuhara, Physica B: Condensed Matter 259–261, 85 (1999).
- Taufour et al. (2016b) V. Taufour, U. S. Kaluarachchi, and V. G. Kogan, Phys. Rev. B 94, 060410 (2016b).
- Nakamura et al. (2017) S. Nakamura, T. Sakakibara, Y. Shimizu, S. Kittaka, Y. Kono, Y. Haga, J. Pospísil, and E. Yamamoto, Phys. Rev. B 96, 094411 (2017).
- Friedemann et al. (2017) S. Friedemann, W. J. Duncan, M. Hirschberger, T. W. Bauer, R. Kuchler, A. Neubauer, M. Brando, C. Pfleiderer, and F. M. Grosche, Nat Phys advance online publication (2017).