Possible origin of shoulder in the reactor antineutrino spectrum
Abstract
The re-analysis of measured integrated electron spectrum reveals a shape mismatch with respect to the so called ab initio calculation and the ratio resembles well with the recently observed reactor antineutrino shoulder or bump around 5 MeV prompt energy when plotted in a reduced scale where the first two moments (area and average) of the spectrum are made identical (KNO type scaling). However, such bumps are not seen in case of other actinides like and isotopes. Since the magnitude of the bump in is comparable with the experimental observations, can not be the only source of anomaly unless similar contributions come from other uranium and plutonium isotopes as well. Therefore, it is strongly conjectured that the integrated electron spectra of uranium and plutonium isotopes particularly in the MeV to MeV energy range may have additional contributions coming from the harder part of the reactor neutron spectrum which may not be present in the thermal measurements.
All modern reactor antineutrino flux measurements are associated with two important puzzles: one related to the deficit of the total antineutrino yields of the short base line measurements and the other one to the spectral shape that deviates significantly at around to MeV antineutrino energy in comparison to the standard predictions (commonly referred to as Huber-Muller model) muller ; huber . Quite often the first puzzle is interpreted with the possible existence of a fourth neutrino which is sterile in nature in addition to the three standard model light neutrinos that participate in the oscillations mention . If sterile neutrino exists, the expected range of mass and mixing angle have been constrained severely by many recent measurements and analysis aartsen ; adamson1 ; adamson2 ; collin . The Daya Bay measurements of antineutrino flux with changing fuel burn-ups an1 provide additional challenge to the sterile neutrino hypotheses by showing that the deficit has isotopic dependence, although the interpretation is still not free from ambiguities hayes3 ; giunti_ji ; gebre . The second puzzle not necessarily related to the former was first reported by RENO collaboration seo ; choi and subsequently reconfirmed by Daya Bay an , Double Chooz abe and NEOS ko collaborations respectively. In a nuclear reactor, the antineutrinos are produced by successive beta decays of neutron rich fragments coming predominantly from the fission of four (, , and ) isotopes. The above experiments detect these antineutrinos directly through the inverse beta decay process (IBD: ) by measuring the emitted prompt gamma energy due to the positron annihilation followed by thermal neutron capture. It has been reported by the above collaborations that the ratio of the measured spectrum with respect to the Huber-Muller model prediction shows a distinct peak at about MeV prompt energy. This is the second puzzle as mentioned above since the event normalized ratio is expected to be unity at all energies. It may be pointed out here that unlike direct antineutrino measurements using IBD, all model calculations estimate the antineutrino flux indirectly either by using a conversion method or an ab initio method by explaining the measured integrated beta spectrum. The integrated beta spectrum for , and were measured in mid 80’s using high flux thermal reactor at ILL(Institut Laue-Langevin), Grenoble u235 ; pu239 ; pu241 and more recently (in 2014) for using fast neutron beam u238 . The corresponding antineutrino spectra have been derived from these measurements by using a conversion method elaborated more detail in u235 ; pu239 ; pu241 while in u238 , the antineutrino spectrum conversion for has been carried out using an empirical relation between (number of antineutrinos per fission per MeV) and (number of electrons per fission per MeV) given by,
| (1) |
where is close to and the function is expected to be unity. On the other hand, the ab initio method commonly known as summation method requires complete knowledge of fission fragment yields of each isotope and their subsequent decay channels until each fission product reaches equilibrium. The beta spectrum (and corresponding antineutrino spectrum) is estimated as the sum over all beta branches and subsequently as the sum over all fission fragments with proper weight factors. Therefore, the summation method heavily depends on the information available in the nuclear data bases. Although, the summation method is more elegant, it suffers from large uncertainty either due to incomplete information or erroneous measurements of nuclear data. One of the common source of uncertainty is the incorrect assignment of the strength of the beta branching ratios of the nucleus which are prone to the pandemonium effects unless measurements are carried out using total absorption spectroscopy (TAS) fallot ; zakari ; rasco . There could also be uncertainty in the fission yield measurements wilson as well as due to lack of knowledge of several forbidden transitions hayes1 ; sonzogni_Mc . In 2011, Muller et al reported the new predictions for antineutrino flux for the above four isotopes based on an ab initio calculation by using an improved data base (ENSDF plus pandemonium corrected nuclei) which agrees with the ILL electron data within a few percent accuracy. The remaining discrepancies are corrected by fitting the ILL data with a set of five virtual beta branches muller . These results are reconfirmed later on by Huber huber . The Huber-Muller estimations have remained so far as the most upto date and state of the art predictions and is being used as the reference point by all experiments which have reported anomaly an ; abe ; ko . Several attempts have been made in the recent years to understand this anomaly with different interpretations dwyer ; hayes2 ; sonzogni1 ; sonzogni2 . Some argue that is responsible for the bump hayes2 which is ruled out for the fact that this isotope contributes only about less than to the total nuclear power production in a reactor and alone can not reproduce the magnitude of the bump. On the other hand, a recent analysis of Huber using NEOS and Daya Bay data favors as the isotope contributing to the bump huber1 which is corroborated by the fact that the IBD yield of deviates the most from the predictions giunti ; an1 .
Although, future measurements may shed some light on the importance of the individual isotopes buck , in the present work, we reanalyze the most recently measured electron and derived antineutrino spectra u238 . A shape mismatch in the form of a bump is noticed just by comparing the experimental data with the so called ab initio calculation. This bump resembles well with the recently observed 5 MeV reactor antineutrino bump when plotted using KNO type reduced scale where the first two moments (area and average) of the spectra are made identical . However, such bumps are not found in other actinides. Since the magnitude of the bump in is comparable with the experimental observations, can not be the only source of anomaly unless similar contributions come from other uranium and plutonium isotopes also. Therefore, it is conjectured that the integrated electron spectra of uranium and plutonium isotopes measured at the reactor particularly in the MeV to MeV energy range may have additional contributions coming from the harder part of the neutron spectrum which may not be present in the thermal measurements.
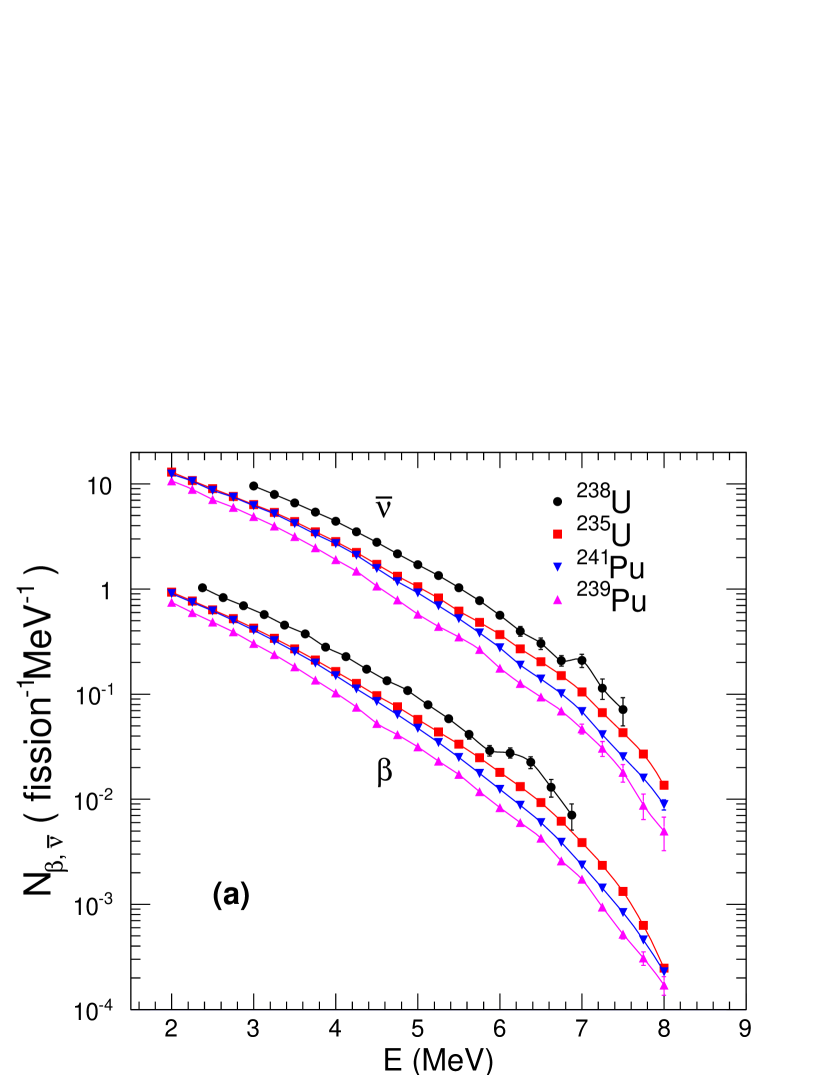
Before proceeding further, we first re-examine the experimental data points once again. For comparison, Figure 1(a) shows (number of electron or antineutrino per fission per MeV) as a function of their kinetic energies for four isotopes. The solid curve joins two successive data points smoothly just to guide the eye. Although the measurements for have large error bars, a simple visual observation shows the existence of a shoulder like structure at around MeV to MeV electron or antineutrino energies whereas such bumpy structures are not seen in case of other three isotopes. Next, we estimate the ratio of the measurements with respect to the corresponding Huber-Muller predictions obtained using the following parametrization,
| (2) |
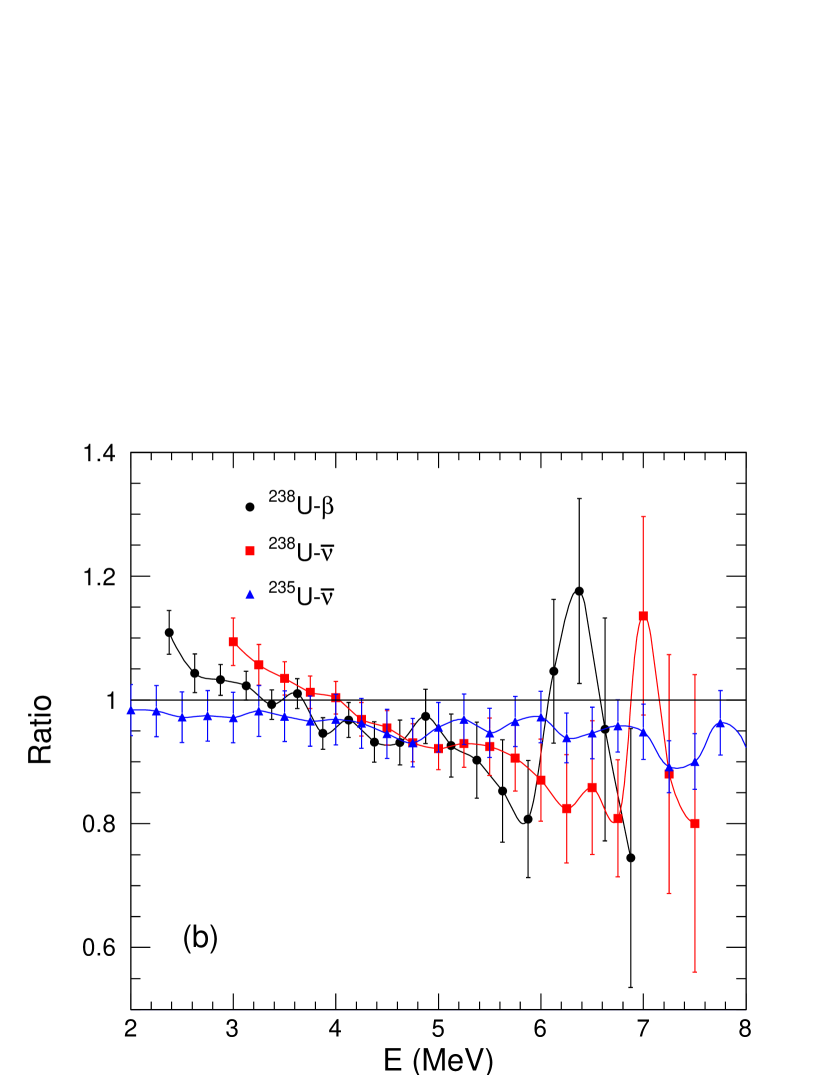
where the parameters for antineutrions are taken directly from muller and huber . However, there is no listed parameters for predicted electron spectra except for which has been tabulated in muller . Therefore, we fit this predicted beta spectrum using the above parametrization assuming an energy independent error of . The fit parameters of beta spectrum for are listed in the second column of table I. The third and fourth columns list the parameters of antineutrino for and taken from muller and huber respectively for easy reference. Figure 1(b) shows the ratio plot for both for electron and antineutrino and ratio plot of only for antineutrino as a function of kinetic energy. The behavior of plutonium isotopes are similar to and not shown in the figure. As can be seen from the figure 1(b), both the ratios of electron and antineutrino for show a peak structure at around MeV to MeV where as such peak is not seen in case of .
| U238-Expt | U238-Muller | U238-Muller | U235-Huber |
|---|---|---|---|
| 6.588 | 0.4619 | 4.833(-1) | 4.367 |
| -7.253 | 0.184 | 1.927(-1) | -4.577 |
| 3.416 | -0.1776 | -1.283(-1) | 2.100 |
| -0.8586 | -3.97(-2) | -6.762(-3) | -5.294(-1) |
| 0.1023 | 3.255(-3) | 2.233(-3) | 6.186(-2) |
| -4.719(-3) | -2.585(-4) | -1.536(-4) | -2.777(-3) |
Being encouraged by this simple observation in case of , we now proceed to see how well this peak compares with the experimental measurements. To make the comparison more sensitive, we use a reduced scale where the x-axis is scaled down and y-axis is scaled up by the average . More explicitly, is replaced by and by,
| (3) |
where is the area under the curve. This is similar to the KNO scaling used in high energy physics to study particle productions when it was first observed by Koba-Nielsen-Olesen (KNO) that particle productions in certain type of process exhibit an universal scaling when ploted in a reduced scale kno . Without going into the physics aspect of the KNO scaling, it can be said that on the KNO scale, all the plots have unity area and unity average value. In other words, the first two moments of the curves (area and average) under KNO scaling are made identical so that any shape differences if any can be seen more conveniently in the reduced scale.
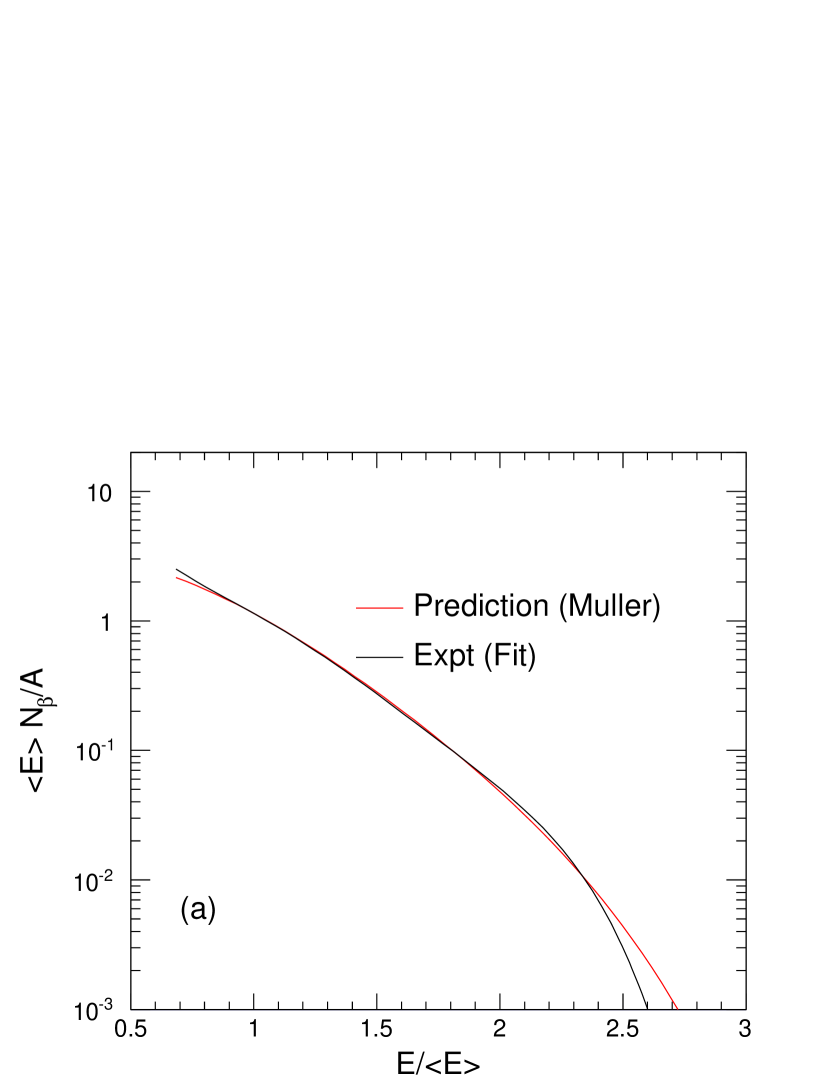
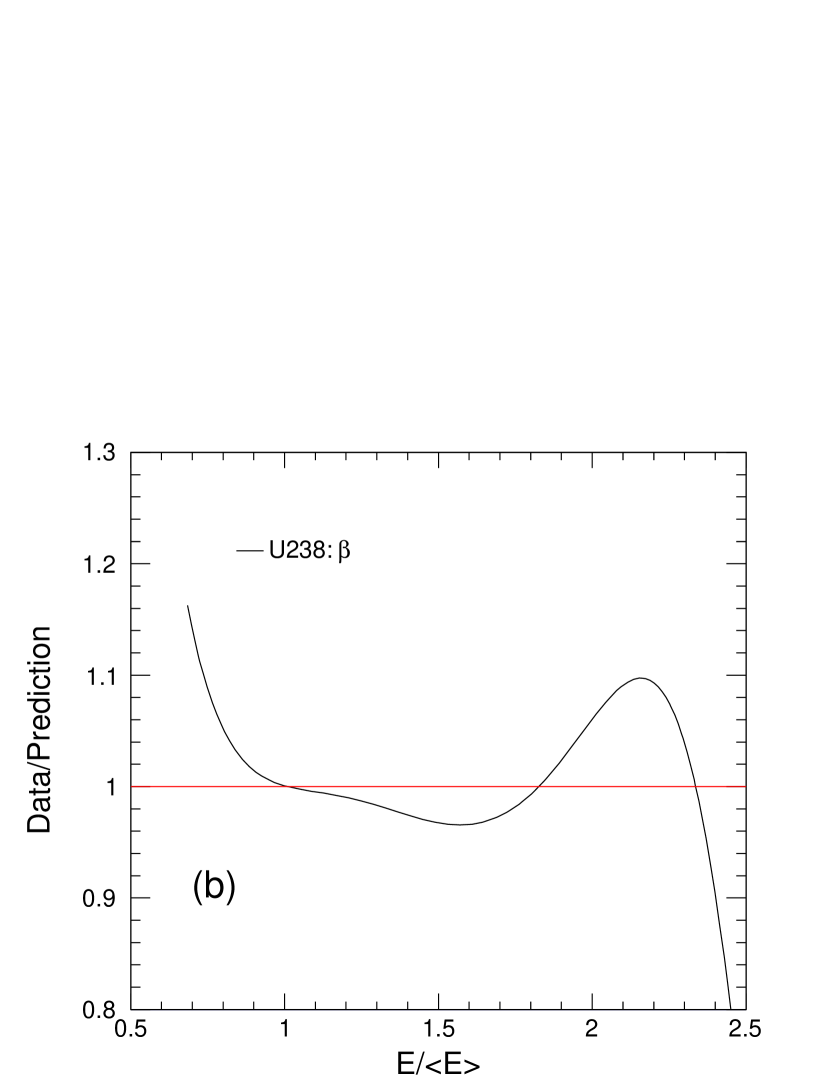
Instead of using discrete points, we fit the experimental electron data points u238 using above parametrization with inclusion of statistical errors only. We get a reasonably good fit with and the parameters are listed in the first column of table I. For comparison with the predictions, we restrict the analysis in the range MeV to MeV only. In this range, the fitted experimental curve has an area (number of electrons per fission) with an average energy MeV where as the corresponding predicted values are (number of electrons per fission) and MeV respectively. Using these values, both the curves are rescaled and plotted in Figure 2. Although in the reduced scale, both the curves have unity area and unity average values, they have considerable shape differences which is evident in the ratio plot as shown in the bottom panel (b). This ratio can be compared with the corresponding ratio in Figure 1 (see the black curve) for beta spectrum. In Figure 1, the peak appears at around MeV which corresponds to in the reduced scale as expected. It is also seen that after the peak, the ratio falls of sharply with increasing energy as the predicted curve falls of less steeply as compared to the fitted curve. While more precise measurements are needed at higher energies, it may be pointed out here that data points for electron spectrum is available only from MeV to MeV (taking the mid point of the energy bin) and the extrapolation may not remain valid at very high energy.
Next, we estimate the antineutrino spectrum from the experimental electron spectrum using the same conversion procedure as given in u238 (Eq.1 above) and compare the ratios with the reported experimental measurements. More explicitly, we calculate the quantity where is the antineutrino interaction cross section given by, (in the leading order) vogel
| (4) |
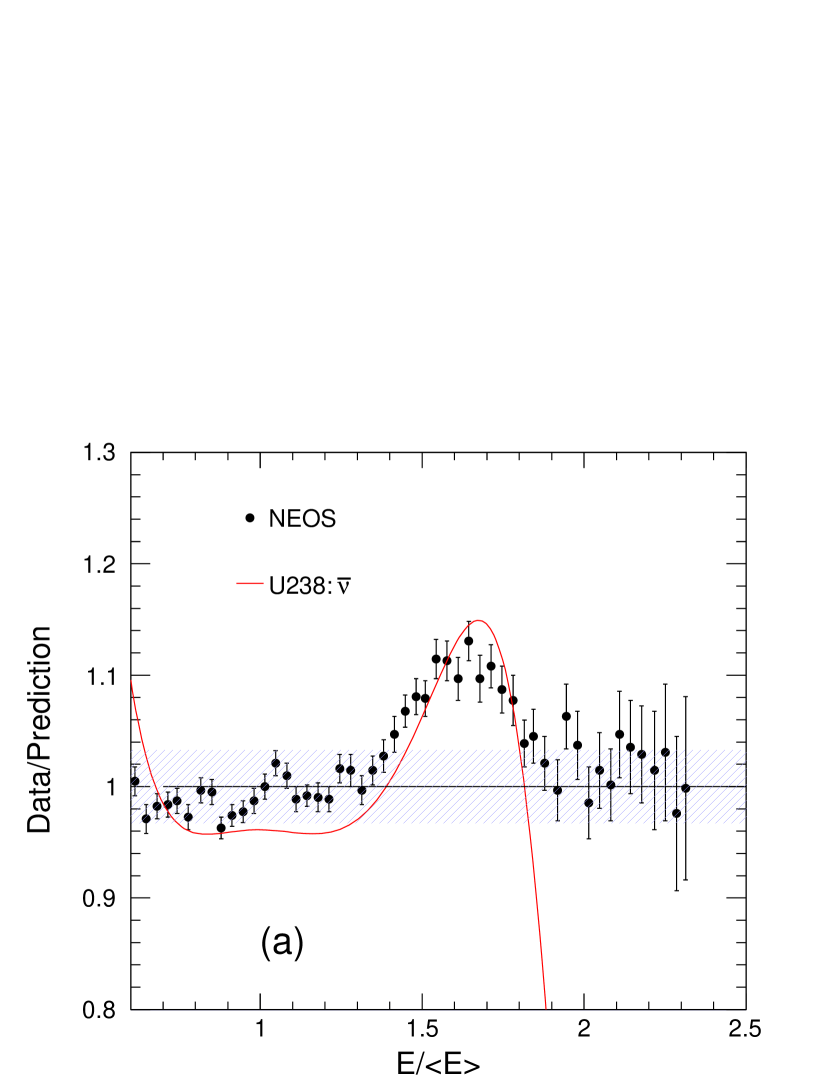
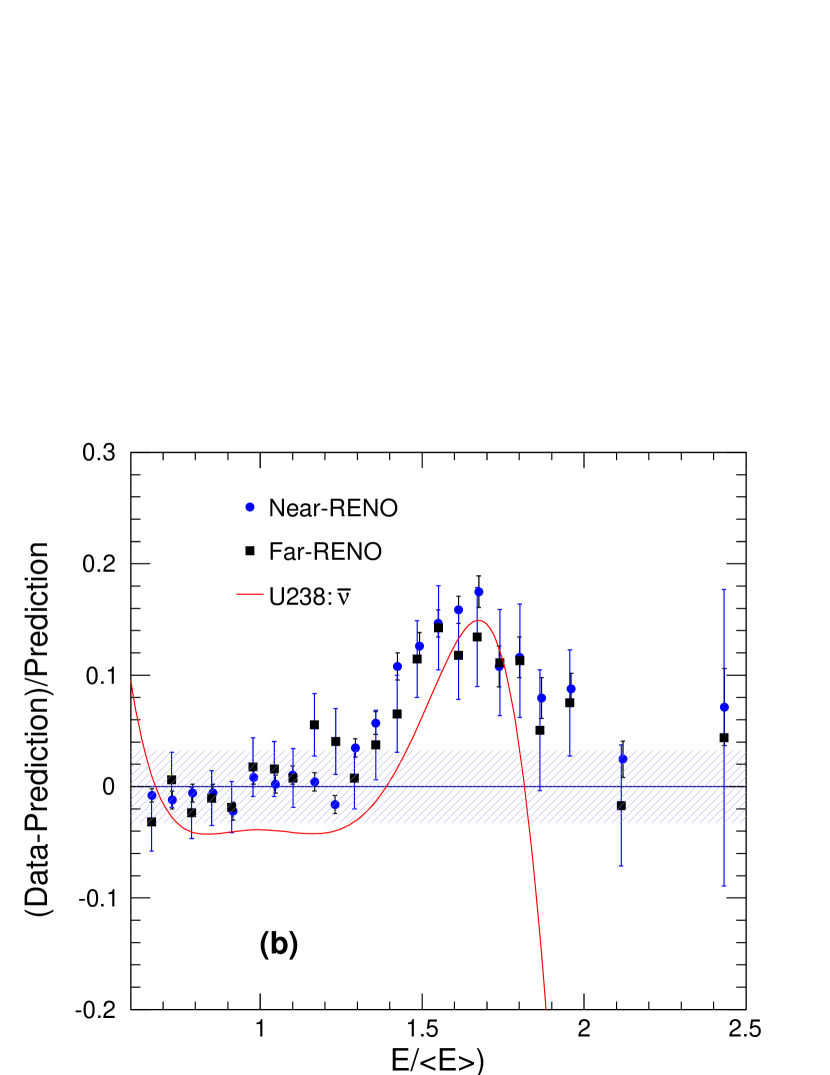
where is the positron energy when neutron recoil energy is ignored and is the positron momentum. As in u238 , we use MeV and evaluate using Muller et al predictions muller . Finally, the ratios are estimated using the reduced scale as shown in Figure 3. The top panel shows the ratios for NEOS collaboration ko and the bottom panel for the RENO collaboration choi (both near and far detectors) respectively. The experimental prompt energy spectrum has a mean value of about MeV for NEOS measurements and MeV for RENO measurements. For comparison, the x-axis of the data points are scaled down by the corresponding . As can be seen, the ratio resembles well with the measurements except at higher energies where the discrepancy arises due to either the experimental measurements falls off sharply or the Huber-Muller prediction over estimates the values. While the above discrepancies at higher energy require further investigation with more precision measurements, it is interesting to note that the strength of the peak obtained from alone is comparable to the experimental measurements although contributes not more than to the total reactor fission power generation. It is expected that if the peak is due to alone, this height (data/prediction) should have been at least huber1 . Therefore, it is unlikely that alone can contribute to the desired strength unless nearly equal contributions come from other uranium and plutonium isotopes as well. It may be mentioned here that the hint for a bump in the measured spectrum at more or less the right energy was noticed, in vogel1 . However, we give a more quatitative estimate of the excess in a model independent way which compares well with the reported experimental ratios.
In conclusions, we have noticed a bumpy structure in both in the measured beta spectrum as well as in the derived antineutrino spectrum when compared with the Muller et al (more precisely Huber-Muller) predictions. Subsequently, for analysis purpose, we represent the experimental data points by a suitable parametrization which is obtained by fitting the experimental electron spectrum with inclusion of statistical errors as quoted in u238 . For a better sensitivity and also to predict the maximum possible deviation, we rescaled the spectrum using a KNO type dimensionless scaling where first two moments of the curve are made unity. In the reduced scale, it is noticed that the estimated ratio of compares well with the reported measurements. However, such deviations are not noticed in case of other fissioning isotopes. Since contributes about to the total fission power generation in a nuclear reactor, the ratio (data/prediction) should have been had it been the only isotope responsible for the observed anomaly. Therefore, it is highly conjectured that the other isotopes particularly and must be contributing significantly to this anomaly. Since the antineutrino spectra obtained from the measured electron spectra for these isotopes do not show any anomaly when compared with Huber-Muller predictions, it is possible that the integrated electron spectra of uranium and plutonium isotopes particularly in the MeV to MeV energy range may have additional contributions coming from the harder part of the neutron spectrum which may not be present in the thermal measurements. Therefore, it is necessary to measure the integrated beta spectrum for all isotopes undergoing neutron induced fission covering energies from thermal to epithermal regions.
Acknowledgments
We would like to thank Dr. Dipak Mishra for many fruitful discussions and critical comments.
References
- (1) Th. A. Muller et al, Phy. Rev C83 (2011) 054615.
- (2) Patrick Huber, Phy. Rev C84 (2011) 024617.
- (3) G. Mention, M. Fechner, Th. Lasserre, Th. A. Muller, D. Lhuillier, M. Cribier and A. Letourneau, Phy. Rev. D83 (2011) 073006.
- (4) M. G. Aartsen et al (IceCube Collaboration) Phy. Rev. Lett. 117 (2016) 071801.
- (5) P. Adamson et al (Daya Bay and MINOS Collaboration), Phy. Rev. Lett. 117 (2016) 151801.
- (6) P. Adamson et al (MINOS Collaboration), Phy. Rev. Lett. 117 (2016) 151803.
- (7) G. H. Collin, C. A. Arguelles, J. M. Conard, and M. H. Shaevitz, Phy. Rev. Lett. 117 (2016) 221801.
- (8) F. P. An et al (Daya Bay Collaboration), Phys. Rev. Lett. 118, 251801 (2017).
- (9) A. C. Hayes, Gerard Jungman, F. A. McCutchan, A. A. Snozogni, G. T. Garvey and X. B. Wang, arXiv:1707.07728 [nucl-th].
- (10) C. Giunti, X. P. Ji, M. Laveder, Y. F. Li and B. R. Littlejohn, arXiv:1708.01133 [nucl-th].
- (11) Y. Gebre, B. R. Littlejohn and P. T. Surukuchi, arXiv:1709.10051 [nucl-th].
- (12) S. H. Seo (RENO Collaboration), AIP Conf. Proc. 1666, 080002 (2015).
- (13) J. H. Choi et al (RENO Collaboration), Phys. Rev. Lett. 116, 211801 (2016).
- (14) F. P. An et al (Daya Bay Collaboration), Phys. Rev. Lett. 116, 061801 (2016).
- (15) Y. Abe et al (Double Chooz Collaboration), J. High Energy Phys. 01, 163 (2016).
- (16) Y. J. Ko et al (NEOS Collaboration), Phys. Rev. Lett. 118, 121802 (2017).
- (17) K. Schreckenbach, G. Colvin, W. Gelletly, and F. Von, Feilitzsch, Phy. Lett. B160 (1885) 325.
- (18) F. Von, Feilitzsch, A. A. Hahn and K. Schreckenbach Phy. Lett. B118 (1882) 162.
- (19) A. A. Hahn, K. Schreckenbach, W. Gelletly, F. Von, Feilitzsch, G. Colvin and B. Krusche, Phy. Lett. B218 (1889) 365.
- (20) N. Haag, A. Gutlein, M. Hofmann, L. Oberauer, W. Potzel, and K. Schreckenbach, Phy. Rev. Lett 112 (2014) 122501.
- (21) M. Fallot et al, Phy. Rev. Lett. 109, 202504 (2012).
- (22) A.-A. Zakari-Issoufou et al, Phy. Rev. Lett. 115, 102503 (2015).
- (23) B. C. Rasco et al, Phy. Rev. Lett. 117, 092501 (2016).
- (24) J. N. Wilson et al, Phy. Rev. Lett. 118, 222501 (2017).
- (25) A. C. Hayes, J. L. Friar, G. T. Garvey, Gerard Jungman, and G. Jonkmans, Phy. Rev. Lett. 112, 202501 (2014).
- (26) A. A. Sonzogni, E. A. McCutchan and A. C. Hayes, Phy. Rev. Lett. 119, 112501 (2017).
- (27) D. A. Dwyer and T. J. Langford, Phy. Rev. Lett. 114, 012502 (2015).
- (28) A. C. Hayes, J. L. Friar, G. T. Garvey, Duligur Ibeling, Gerard Jungman, T. Kawano and Robert W. Mills, Phy. Rev. D92, 033015 (2015).
- (29) A. A. Sonzogni, T. D. Johnson and E. A. McCutchan, Phy. Rev. C91, 011301(R) (2015).
- (30) A. A. Sonzogni, E. A. McCutchan, T. D. Johnson and P. Dimitriou, Phy. Rev. Lett. 116, 132502 (2016).
- (31) Patrik Huber, Phy. Rev. Lett 118, 042502 (2017).
- (32) C. Giunti, Phys. Lett. B764, 145 (2017).
- (33) C. Buck, A. P. Collin, J. Haser and M. Lindner, Phys. Lett. B765, 159 (2017).
- (34) Z. Koba, H. B. Nielson and P. Olesen, Nucl. Phys. B40, 317 (1972).
- (35) P. Vogel and J. F. Beacom, Phy. Rev. D60, 053003 (1999), hep-ph/9903554a .
- (36) A. Hayes and P. Vogel, Ann.Rev. Nucl. Part.Sci. 66, 219 (2016).