Testing for shock-heated X-ray gas around Compact Steep Spectrum Radio Galaxies
Abstract
We present Chandra and XMM-Newton X-ray, VLA radio, and optical observations of three candidate Compact Steep Spectrum (CSS) radio galaxies. CSS sources are galactic scale and are presumably driving a shock through the ISM of their host galaxy. B3 1445+410 is a low excitation emission line CSS radio galaxy with possibly a hybrid Fanaroff-Riley FRI/II (or Fat Double) radio morphology. The Chandra observations reveal a point-like source which is well fit with a power law consistent with emission from a Doppler boosted core. 3C 268.3 is a CSS broad line radio galaxy whose Chandra data are consistent spatially with a point source centered on the nucleus and spectrally with a double power-law model. PKS B1017-325 is a low excitation emission line radio galaxy with a bent double radio morphology. While from our new spectroscopic redshift, PKS B1017-325 falls outside the formal definition of a CSS, the XMM-Newton observations are consistent with ISM emission with either a contribution from hot shocked gas or non-thermal jet emission. We compile selected radio and X-ray properties of the nine bona fide CSS radio galaxies with X-ray detections so far. We find that 2/9 show X-ray spectroscopic evidence for hot shocked gas. We note that the counts in the sources are low and the properties of the 2 sources with evidence for hot shocked gas are typical of the other CSS radio galaxies. We suggest that hot shocked gas may be typical of CSS radio galaxies due to their propagation through their host galaxies.
keywords:
galaxies: active — galaxies: individual (\objectnamePKS B1017-325, 3C 268.3, B3 1445+410) — galaxies: jets — X-rays: galaxiesChristopher P. O’Dea
1 Introduction
The required gaseous medium for the propagation of extragalactic radio sources is provided by the X-ray-emitting atmospheres of their host galaxies and clusters. In radio sources of high power, the energy and momentum fluxes are expected to be sufficient to drive a bow shock at supersonic speed into the ambient medium, heating the gas as it crosses the shock [[, e.g.,]]scheuer, leahy, heinz. Evidence for such heating has been claimed around Cygnus A (e.g., Carilli et al., 1994; Smith et al., 2002). In cluster-embedded sources of lower power it is common for the radio lobes to displace X-ray-emitting gas (e.g., Boehringer et al., 1993; Bîrzan et al., 2004; Forman et al., 2007; Wise et al., 2007; Tremblay et al., 2012), with sufficient power to balance radiative cooling of the dense gas (e.g. Dunn et al., 2005; Rafferty et al., 2006; Fabian, 2012). However, direct evidence for strong shock heating by radio sources remains relatively scarce. Notable exceptions are the closest radio galaxy, Centaurus A (Kraft et al., 2003; Croston et al., 2009), the cluster radio source 3C444 (Croston et al., 2011), and the intermediate-power radio galaxy PKS B2152-699 (Worrall et al., 2012) where prominent shocks have been studied in detail. There has been less routine success in detecting the anticipated dramatic effects of shocks around high-power sources in more typical atmospheres.
A promising source type for observing shock heating is the non-cluster compact steep spectrum (CSS) population, where the radio structures lie within the volume of the host galaxy (for a review see O’Dea, 1998). Here, as for the inner expanding structures of Centaurus A, the ambient gas is the cool galaxy atmosphere, which even when shocked should be accessible to detection in the X-ray band. While CSS sources can show indirect evidence of interaction with the gas in their host galaxies (e.g., Saikia & Gupta, 2003; Orienti, 2016), the amount of gas directly involved appears to be relatively small (e.g., Axon et al., 2000; Stockton et al., 2007), and early suggestions that CSS sources are compact because they are “frustrated” by the presence of dense environments are now generally disfavored as compared with arguments that they are compact because they are young (e.g., Fanti et al., 1995). Typical age estimates of less than years are based on measuring curvature in the radio spectra caused by radiative energy losses of the higher-energy electrons over the lifetime of the sources (e.g., Murgia et al., 1999) or through proper motions of the terminal hotspots of the class of smaller and younger Compact Symmetric Objects (CSOs, a subclass of GPS sources) (e.g., Owsianik & Conway, 1998; Taylor et al., 2000; Peck & Taylor, 2000; Polatidis, 2009; An & Baan, 2012). CSS radio sources are powerful, with statistical arguments made that they decline in luminosity as they age (e.g., Fanti et al., 1995; Readhead et al., 1996). As such they are good candidates for searching for shock heating of surrounding gas at moderate to high Mach number.
The compact nature of CSS sources, and their smaller cousins, Gigahertz Peaked Spectrum (GPS) sources, has the disadvantage that the emission might be confused with other components of X-ray emission. Quasars, whose X-ray cores and inner jets are enhanced by relativistic beaming, and where the potential to image shock discontinuities is diminished through the jets lying far from the plane of the sky, are not ideal for such study. Moreover, it has been argued from polarization and multifrequency variability studies that quasar samples of genuinely young sources can be contaminated by blazars (Cotton et al., 2003; Tornikoski et al., 2009). Where radio galaxies have their cores detected in X-ray and separated from other X-ray components, the nuclear emission is much fainter than in quasars and correlated with the core radio emission (e.g., Worrall & Birkinshaw 1994; Evans et al. 2006, and see Worrall 2009 for a review). In CSS radio galaxies the radio core emission is often too weak to be separated from the steep-spectrum lobes, particularly at low radio frequencies where it is self-absorbed, and core X-ray emission may be weak compared with that from the gaseous environment or possibly that associated with the steep-spectrum radio lobes. CSS radio galaxies are therefore good candidates for observing shock heating.
While CSS and GPS quasars and broad-line radio galaxies are detected quite readily in X-rays (e.g., O’Dea, 1998; Worrall et al., 2004; Guainazzi et al., 2004; Siemiginowska et al., 2005, 2008), the same is not true for radio galaxies. After unsuccessful attempts to detect them with ROSAT (O’Dea et al., 1996), the first detection of a compact radio galaxy was of the GPS source B1345+125 () with ASCA (O’Dea et al., 2000). In addition to B1345+125, we are aware of 32 other GPS radio galaxies having reported detections with XMM-Newton or Chandra (Vink et al., 2006; Guainazzi et al., 2006; Siemiginowska et al., 2008; Tengstrand et al., 2009; Siemiginowska et al., 2016). These GPS sources all have radio sizes less than 1 kpc (most are less than 100 pc) and, even with Chandra, structures on the scale size of the radio cannot be resolved. Count rates are typically low, and all have been fitted to the simplest model of an absorbed single-component power law. Tengstrand et al. (2009) demonstrates a possible anticorrelation between radio-source size and X-ray intrinsic absorption in GPS galaxies (but see Vink et al. (2006) for a different conclusion), as would be consistent with the presence of an inner absorbing torus as seen in powerful radio galaxies with large-scale structures (e.g., Evans et al., 2006) and X-ray emission that arises further from the nucleus in larger GPS sources. This interpretation is also consistent with the finding that GPS quasars show no intrinsic absorption (Siemiginowska et al., 2008). However, while the location of absorption may be probed, the emission mechanism responsible for the X-rays on various spatial scales is far from certain. Siemiginowska et al. (2016) find that their results do not favor thermal emission from the hot ISM for the X-ray continuum emission of the CSO subset of GPS galaxies.
Until relatively recently, there has been less effort to detect CSS radio galaxies in X-rays, despite the fact that their radio structures are on spatial scales resolvable with Chandra. Kunert-Bajraszewska et al. (2014) observed 7 CSS sources with low radio power and detected four of them. Three of the low radio power CSS sources have extended X-ray emission - 0810+077, 0942+355, and 1321+045 which is in a cluster of galaxies (Kunert-Bajraszewska et al., 2013), though all of the four detected sources were fit by an absorbed power-law.
The low redshift CSS radio galaxy 3C305 (Heckman et al., 1982) shows shocked hot gas in the X-rays (Massaro et al., 2009; Hardcastle et al., 2012). The hot gas seems likely to be participating in an outflow driven by the radio source which includes the cool atomic and warm optical emission line gas (Morganti et al., 2005; Hardcastle et al., 2012; Reynaldi & Feinstein, 2013). In such an outflow scenario, the X-ray-emitting phase dominates the energetics of the (known) phases of the gas in the outflow (Hardcastle et al., 2012).
The high throughput of XMM-Newton is useful for the detection of CSS radio galaxies, and we made a good detection of the galaxy 3C 303.1 in a 40 ksec observation (O’Dea et al., 2006). In the spectrum we found a thermal component at keV, which seems likely to be produced by the interstellar medium (ISM) of the host galaxy, and a second harder component. The lack of a detected radio core suggested to us that it is unlikely that the hard component arises from the nucleus. For the harder component to originate from inverse-Compton scattering in the brighter radio lobe, the magnetic field would have to be a factor of about 4 lower than the minimum-energy value. We argued that a plausible hypothesis for the second component is that it is gas that is heated by the bow shock of the expanding radio source. Using an expansion speed of km s-1 as suggested by lifetime and cooling-time arguments, particularly in the emission line nebula (de Vries et al., 1997; O’Dea et al., 2002), the shock would be very strong (Mach number of 13) and the hot gas should have keV, consistent with the observed hard spectral component. 3C 303.1 has subsequently been observed with Chandra for ksec as part of a shallow survey of radio sources. Examination of the archival data (Massaro et al., 2010) shows a detection with only 16 photons, but consistent with expectations from our XMM-Newton detection. While this is insufficient to probe spectral structure, we find that photons are distributed in a more extended fashion than would be the case for a point source (Massaro et al., 2010), supporting our hypothesis that the emission arises from gas rather than being non-thermal in nature.
In this paper we report new X-ray observations of the CSS radio galaxies B3 1445+410 () and 3C 268.3 () and candidate CSS source PKS B1017-325 which is at a redshift of (based on new Large Binocular Telescope optical spectroscopy, see subsection 2.5). We adopt km s-1 Mpc-1, , . 1 arcsec corresponds to 3.2, 5.1, and 4.6 kpc at the distances of B3 1445+410, 3C 268.3, and PKS B1017-325, respectively.
llcccrccc
\tablecaptionProperties of X-ray detected CSS Radio Galaxies
\tablewidth0pt
\tablehead
\colheadSources & \colheadz \colheadSize (kpc) \colheadlog P1.4GHz \colheadlog LX-ray
\colheadCounts \colheadExtended? \colheadShock? \colheadRefs
\startdataB0810+077 & 0.1122 3.0 25.16 42.8a 119 Y N 1
B0942+355 0.2076 5.1 25.25 42.9a 103 Y N 1
3C237 0.877 9.2 28.3 44.0b … Y N 9
PKS B1017-325 0.3186 44a 26.77 42.8c 163 Na ? 3
3C 268.3 0.3717 6.9 27.07 44.5b 398 N N 3,7
B1321+045 0.263 12 25.43 42.3a 53 Y N 1,2
3C303.1 0.2704 7.0 26.63 42.9b 211 Y Y 4,5
B3 1445+410 0.195 26 25.65 42.9c 723 N N 3
3C 305 0.0416 11 25.10 41.7b 148 Y Y 6,8
B1558+536 0.179 6.0 25.19 41.7a 9 N N 1
\enddata\tablecommentsSelected properties of CSS sources detected in X-rays. Col 1. Source name. Col 2. redshift.
Col 3. Largest linear size (e.g., diameter) of the radio source in kpc. aBased on our new spectroscopic redshift, the candidate CSS source PKS B1017-325 is now known to have a projected linear diameter of 44 kpc which is significantly above the cutoff for CSS sources. Thus, PKS B1017-325 is not considered a CSS for
the analysis in §2.7.
Col 4. Log Radio Power at rest frame 1.4 GHz (W Hz-1). A radio spectral index of was adopted. Col 5. X-ray Luminosity (erg s-1). a 2-10 keV, b 0.5-7 keV,
c 0.4 - 6 keV.
Col 6. Chandra X-ray counts, except for 3C303.1 and PKS B1017-325 which are XMM counts. We use the same energy band as used in Col 5.
Col 7. Is there evidence for extended X-ray emission? aThe constraint on PKS B1017-325 is based on XMM data which does not have sufficient angular resolution to rule out a galaxy-scale ISM.
Col 8. Is there evidence for shocked hot gas in the X-rays?
Col 9. References for columns 5-8: 1. Kunert-Bajraszewska et al. (2014). 2. Kunert-Bajraszewska et al. (2013). 3. This paper. 4. O’Dea et al. (2006).
5. Massaro et al. (2010). 6. Massaro et al. (2009). 7. Massaro et al. (2015). 8. Hardcastle et al. (2012). 9.
Massaro et al. (2017).
2 Observations & analysis
2.1 The Candidate CSS Sources
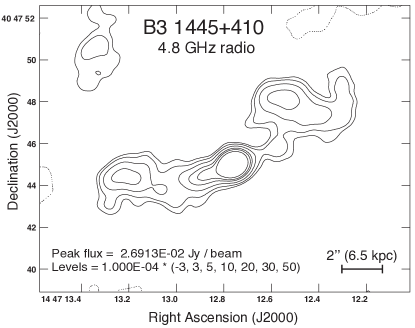
The CSS B3 1445+410 is part of the B3-VLA sample of CSS sources defined by Fanti et al. (2001). The CSS sources are a subset of the B3-VLA sample (Vigotti et al., 1989) and have flux densities at 408 MHz Jy, and based on VLA A configuration 1.5 GHz observations have projected linear diameter kpc and steep spectral index where . The measured angular size of (Fig. 1) gives a projected linear diameter of 26 kpc.
3C 268.3, z=0.3717, is classified optically as a BLRG. It is a member of the original Fanti et al. (1990) sample of CSS sources. The projected total size of the radio source is 6.9 kpc.
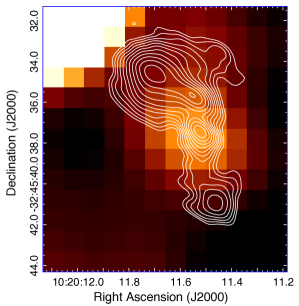
The candidate CSS PKS B1017-325 is a member of the Molonglo Southern 4 Jy Sample (MS4) (Burgess & Hunstead, 2006a) and was one of 41 sources in MS4 classified as a CSS source by Burgess & Hunstead (2006b) based on linear diameter kpc (using their photometric redshift) and spectral index between 2700 and 408 MHz. Our VLA radio image (Figure 2) shows an angular size of which corresponds to a projected linear diameter of 44 kpc using the new spectroscopic redshift and scaling. Thus, PKS B1017-325 is actually larger than the cutoff for CSS sources. We present the data for PKS B1017-325 because it helps to provide constraints on the sizes of radio sources which are capable of shocking the ISM. However, we do not include PKS B1017-325 in the analysis of CSS sources in § 2.7.
2.2 Chandra
We observed B3 1445+410 at the nominal aimpoint of the S3 CCD of the Chandra ACIS camera on 2009 Sep 27. The observations were in VFAINT full-frame data mode (OBSID 11579). Results presented here use CIAO v4.8 and CALDB v4.7. We reprocessed the data following the software ‘threads’ from the Chandra X-ray Center (CXC)111http://cxc.harvard.edu/ciao to make a new level 2 events file. The observation was free from background flares, and after removal of time intervals when the background deviated more than from the average value, the total exposure time is 68.541 ksec. It was necessary to shift the X-ray coordinates by about 0.26 arcsec, mainly in RA, to align the nuclear emission with the radio core at RA= 14:47:12.758, Dec=+40:47:45.00. The 0.4-5 keV count rate from a 1.25-arcsec radius circle at the core is 0.01 counts s-1, rendering pile-up negligible (1% level). The CIAO wavdetect task was run to find unassociated point sources that were then excluded from the annular region used to measure the background for our spectral fitting. Spectral fitting was performed using xspec version 12.9.0u taking into account the absorption along the line of sight in our Galaxy by using a column density of cm-2 (from the colden program provided by the Chandra X-ray Center (CXC), using data of Dickey & Lockman 1990). A circle of radius 1.25 arcsec was used to extract a binned spectrum of the core.
3C 268.3 was observed with Chandra ACIS-S in VFAINT full-frame data mode on 2009 July 29th and 30th (ObsIDs 10382 and 10933). Initial results were published by Massaro et al. (2015). We reprocessed the data using CIAO 4.9 and CALDB 4.7.5.1, giving a total observing time after background screening of 71.520 ks. Galactic absorption of cm-2 was applied to all spectral models.
2.3 XMM-Newton
We observed PKS B1017-325 with XMM-Newton on 2008 Jun 11 (ObsID 0552070101). In this paper we report on the data from the European Photon Imaging Camera (EPIC). The pn, MOS1, and MOS2 CCD-array cameras were operated in Full Frame mode with the thin optical blocking filter. The tasks epchain and emchain from the sas were run to create events lists (see http://xmm.esac.esa.int/ for information on the modes of operation of the cameras and analysis procedures). There were no times of extreme background flaring, and the resulting good exposure times, after removing intervals when the background deviated by more than 3 from the average value, were 15.749, 15.800, and 12.832 ksec in the MOS1, MOS2, and pn, respectively. Our analysis uses good events with patterns 0 to 12 from the MOS data and patterns 0 to 4 from the pn data.
For spectral analysis, background-subtracted events were extracted for each camera separately using the task evselect, and corresponding calibration files were made using the rmfgen and arfgen tasks from version 15 of the sas. Counts were extracted from a source-centered circle, with local background measured from the same CCD. For the pn we followed the recommended procedure of taking background from the same distance to the readout node as the source region. For the MOS cameras this restriction was dropped and somewhat larger background regions were used. The spectral extractions were fitted jointly to models using xspec. Data were grouped to 10 counts/bin and the weighting scheme of Churazov et al. (1996) was adopted to provide an improved estimate of the variance in the limit of small numbers of counts. Spectral fits include absorption along the line of sight in our Galaxy assuming a column density of cm-2 (from the colden program provided by the CXC using data of Dickey & Lockman 1990).
2.4 Radio
2.4.1 B3 1445+410
We obtained archival 4.86 and 8.46 GHz A configuration Karl G. Jansky Very Large Array (VLA) observations (Program AF0398, 2003-Jun-01) of B3 1445+410. The observations were short snapshots - time on source 170 s at 8.4 GHz, and 130s at 4.8 GHz, respectively. The NRAO AIPS package was used for the calibration, imaging, self-calibration, and deconvolution. The 8.46 GHz image (not shown) resolves out nearly all of the extended source structure, however the radio nucleus is detected with a flux density of mJy. The core is detected in the 4.86 GHz image with a similar flux density of mJy, giving a flat spectral index for the core of
Fanti et al. (2001) present 1.5 GHz VLA A configuration observations of B3 1445+410 which shows a double morphology. Our tapered 4.86 GHz image (Fig. 1) shows the extended structure in more detail. Note that because of the limited uv coverage, structures larger than are not adequately imaged. The lobes have weak hot spots and there is a one-sided FRI-like jet extending from the core into the eastern lobe. This structure suggests an intermediate FRI/FRII morphology consistent with the class of “Fat Doubles” described by Owen & Laing (1989). The very weak hot spots and plume-like lobes suggest the lobes are not expanding rapidly into the ISM/ICM.
2.4.2 PKS B1017-325
We observed PKS B1017-325 with the NRAO VLA on 2011 Feb 01 using the hybrid CnB array with extended north arm due to the southern declination of the target (Program 10C-233). The observations covered a total block of 1.5 hours with antenna pointing corrections made at 8.44 GHz and the target observed with a total bandwidth of 256 MHz centered on 22.4 GHz. The phase calibrator used was J10183123 and the flux/bandpass calibrator was 3C 286.
The data were calibrated and imaged with the NRAO Obit package (Cotton, 2008) following standard procedures. Briefly, the data were Hanning smoothed to suppress ringing due to radio frequency interference (RFI). They were flagged for RFI that was impulsive in time or frequency. The calibrator 3C 286 was used to determine corrections for instrumental group delay offsets which were applied to all data. 3C 286 was also used to determine the bandpass to correct for residual variations of gain and/or phase with frequency across the band. The flux scale was set using 3C 286 and was bootstrapped to observations of the phase calibrator J10183123, which bracketed the target observations. The phase calibrator was used to calibrate the amplitudes and phases of our target. Following this initial full calibration and flagging, we reset the calibration and undertook a second full round of RFI flagging and calibration on only the data that passed the initial calibration round. Calibration was applied to PKS B1017-325 and it was split off for imaging. The data were imaged and underwent 3 rounds of phase-only self-calibration. The final image has an rms of 77.6 Jy/beam with a beam of 1.1at a position angle of 48.4 degrees.
The 22.4 GHz image (Fig. 2) shows an amorphous morphology with a central ‘core’ component that is co-spatial with an optical and IR point source detected in ground-based imaging. A single Gaussian component fit to the apparent core gives a position of RA 10 20 11.52411 DEC -32 45 37.4292 , where the uncertainty in RA and DEC is given in arcsec. To the north of the core there is a bright elongated region roughly 4.9 arcsec (22.5 kpc) in length elongated to the north-east. In addition, there is a faint suggestion of further emission extending 7 kpc to the west of the northern portion of the bright emission. To the south of the core, there is faint emission connecting to a brighter compact region. This emission extends 21.6 kpc to the south of the core. The overall radio source morphology is unclear but might be a “bent double” or wide-angle-tail radio source (e.g., Owen & Rudnick, 1976; Blanton et al., 2001). The total flux density of all components of PKS B1017-325 at 22.4 GHz is 110.0 0.6 mJy with 14.2 0.1 mJy in the core component. We note that Gaussian component fitting to the ‘core’ region reveals an extended structure so we are likely measuring a combination of emission from the central AGN and surrounding region.
| FWHM | Flux | |
|---|---|---|
| Line | (km s-1) | ( erg s-1 cm-2) |
| O 2 Å | 627 94 | 1.54 0.23 |
| Ne 3 Å | 573 85 | 0.214 0.03 |
| H 4340 Å | 539 80 | 0.576 0.09 |
| He 2 4685 Å | 551 83 | 0.427 0.06 |
| H 4861 Å | 656 98 | 1.91 0.18 |
| O 3 Å | 660 99 | 4.87 0.73 |
| O 3 Å | 665 98 | 14.8 2.2 |
| N 1 Å | 337 51 | 0.162 0.02 |
| O 1 Å | 491 74 | 0.852 0.13 |
| O 1 Å | 302 45 | 0.285 0.04 |
| N 2 Å | 658 99 | 1.99 0.30 |
| H Å | 602 90 | 8.11 1.2 |
| N 2 Å | 736 111 | 6.50 0.98 |
| S 2 Å | 418 63 | 2.78 0.42 |
| S 2 Å | 418 63 | 2.06 0.31 |
2.5 Optical Spectroscopy
2.5.1 B3 1445+410
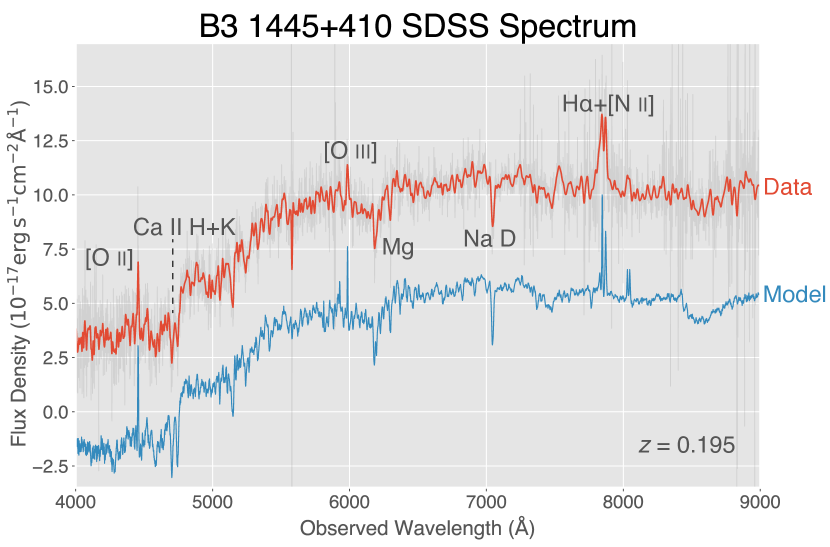
The Sloan Digital Sky Survey (SDSS) spectrum of B3 1445+410 is shown in Fig. 3. The SDSS observations were taken from plate 1397 and fiber 182. The datasets were used as delivered from the SDSS archive, with no post-processing applied. The spectrum is that of a red elliptical galaxy with low ionization emission lines, e.g., H+[NII], [OII], and H. Mg and Na are seen in absorption. The redshift is . The excitation index EI222Buttiglione et al. (2010) defines the excitation index EI log O 3/H - 1/3 (log N 2/H + log S 2/H + log O 1/H) (Buttiglione et al., 2010) is , consistent with B3 1445+410 being a Low Excitation Galaxy (LEG, also as defined by Buttiglione et al. 2010).
2.5.2 Large Binocular Telescope Optical Spectroscopy of PKS B1017-325
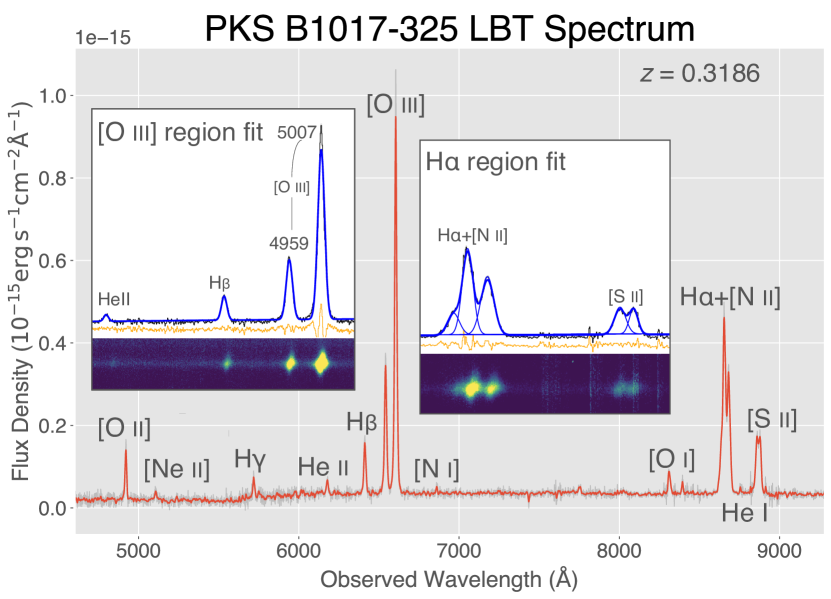
An optical spectrum of PKS B1017-325 (Fig. 4) was obtained on UT January 11, 2017 using the Multi-Object Double Spectrograph 2 (MODS-2; Pogge et al., 2006). MODS-2 is one of two identical optical low-medium resolution two channel (blue & red) spectrographs mounted on the Large Binocular Telescope (LBT). MODS-1 and MODS-2 are each mounted on one of the two f/15 straight Gregorian foci of the two 11.8 meter mirrors. MODS-2 is located on the DX (or right) side of the telescope. Although the LBT has moved to nearly full-time binocular duplex (identical configuration) observations with all three of its facility instruments, including MODS 1 & 2 (Rothberg et al., 2016), PKS 1017-325 could only be observed in monocular mode primarily due to the low declination of the target.
In standard Gregorian or non-prime focus
operations, LBT uses an adaptive secondary (AdSec) mirror with each primary
mirror (Gallieni et al., 2003; Quirós-Pacheco et al., 2010; Miller et al., 2012).
Each AdSec employs a thin shell 91.1cm mirror with 672 actuators. These mirrors
are limited in operation to elevations above 30∘ even when used in
seeing limited (non-adaptive) mode. LBT has a single rigid secondary mirror that
is not subject to the same limits. As PKS 1017-325 never reaches an elevation
above 30∘ at Mount Graham, only the rigid secondary, which was
already mounted on the DX side of the telescope, could be used.
Either MODS spectrograph can be figured to simultaneously observe the wavelength
range 0.3-1.0\micron using a dichroic to split the light into a blue and red
channel. MODS-2 was configured in the dual grating mode using a
wide segmented longslit mask. The mask contains 5
longslit segments, each 60\arcsec in length. A single segment was sufficient
for the observations. The spatial scale of the blue arm and red arms are
pixel-1 and
pixel-1, respectively. The observations were
obtained under nearly Full Moon (98.7) conditions with consistent thick
clouds and seeing of 2\arcsec as determined from the acquisition
image. A single blue and red exposure of 1200 seconds was taken of PKS 1017-325.
The spectrophotometric standard G191B2b was observed using the same instrumental
setup as the science observations, with the exception of the slitwidth. A
5\arcsec wide slit was used in order to minimize light loss for flux
calibrations. Slitless pixel flats were obtained to correct for the detector
response. Ar, Xe, Kr, Ne and Hg lamps were observed for wavelength
calibration.
The first step of the data reduction was to use Version
2.0 of the modsCCDRed collection of Python scripts. These perform basic 2D
reduction including: bias subtraction, removing the overscan regions,
constructing flat fields from the slitless pixel flats, fixing bad columns and
flipping the red arm data so that wavelength increases from left to right along
the x-axis. Further processing was performed using customized IRAF
scripts developed by B. Rothberg (Secrest et al., 2015). Briefly,
cosmic rays were removed using the task CRUTIL. Two dimensional
spectra were extracted in strip mode for the central longslit segment using the
task APALL. MODS spectra are tilted along both the spectral (x-axis)
and spatial (y-axis) dimensions. The spectra were simultaneously corrected in
both axes using the arc lines and the IRAF tasks ID,
REID, FITC, and TRANSFORM. MODS data are very
sensitive to the polynomial order used to wavelength calibrate the data. A 4th
order Legendre polynomial produces the smallest residuals and avoids
introducing low-order noise into the 2D spectra. Once the 2D spectra were
rectified and wavelength calibrated, the background was subtracted in each
exposure by fitting a 2nd order Legendre polynomial to the columns
(spatial axis) using the iraf task BACKGROUND. A 1D spectra
was extracted in a metric aperture of 2\arcsec for both the blue and red
exposures. The exposures were then flux calibrated using the
spectro-photometric standard G1919B2b. This step also removes the instrumental
signature. The red data (0.56-1.0m) were corrected for telluric
absorption features using a normalized spectra of G191B2b in conjunction with
the IRAF task TELLURIC. The data were then corrected for
atmospheric extinction and Galactic reddening assuming and a
value of (Schlafly & Finkbeiner, 2011). Finally, the 1D blue and red
spectra were combined using the IRAF task SCOMBINE, corrected
to a heliocentric velocity, rescaled to a common dispersion value of 0.85 Å
pixel-1, and trimmed to a wavelength range of 0.38-0.9285 m.
Measurements of the sky lines yields a spectral resolution of 4.2Å in the
blue and 7.3Å in the red, which corresponds to a resolution of R
1300 across the entire spectral range.
Simultaneous Gaussian fits to the O 34959,5007, O 16300, and S 26718,6732 emission lines gives a spectroscopic redshift of , with which all other detected lines are consistent. This is the first and only known spectroscopic redshift for PKS B1017-325, and we note that it is inconsistent with the photometric redshift of as reported in Burgess & Hunstead (2006b) and quoted by the NASA/IPAC Extragalactic Database (NED). The measured Balmer decrement (H / H flux ratio) is . Following Tremblay et al. (2010), this corresponds to a color excess of
| (1) |
where and as given by (Cardelli et al., 1989). The excitation index as defined by Buttiglione et al. (2010) is EI0.63, consistent with the source being a LEG. Typical linewidths (e.g., for O 3 and H) are on the order of km s-1. Fluxes and velocity widths of all detected emission lines are given in Table 1.
2.6 X-ray imaging and spectroscopy
Note that because B3 1445+410 and PKS B1017-325 are optically classified as LEGs, it is unlikely that there is detectable X-ray emission from an accretion disk in these sources (e.g. Hardcastle et al., 2009).
2.6.1 B3 1445+410
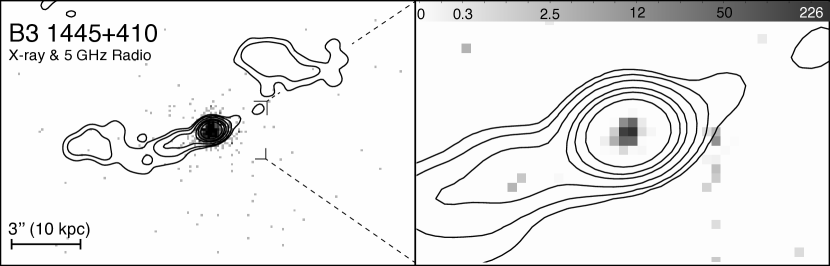
Fig. 5 (Left) is the Chandra image with radio contours and shows the X-ray emission to be concentrated around the radio core with no obvious emission from (or structure induced by) the extended radio features. To test for spatial extent we modeled the X-ray PSF appropriate for the observation using the CXC SAOsac raytrace and MARX software. 50 individual simulations were added and the result compared with the data. Fig. 5 (Right) shows the X-ray data after using the CIAO arestore task to remove the PSF blurring using the modeled PSF and the Richardson Lucy deconvolution algorithm. A point source is recovered.
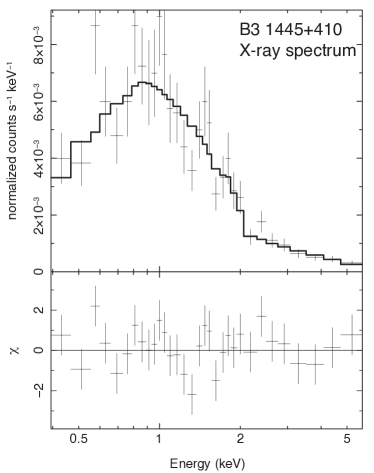
The X-ray spectrum (Fig. 6) gives a good fit ( for 30 degrees of freedom) to a power law of X-ray spectral index (90% confidence), where and flux density is given by . No absorption in excess of Galactic is required. The 1-keV flux density is nJy, and between 0.4 and 6 keV the observed flux is ergs cm-2 s-1 and the luminosity is ergs s-1 (90% confidence uncertainties for one interesting parameter).
The observation that the radio core is flat spectrum and relatively bright and there is a one-sided radio jet is consistent with there being some relativistic boosting. Thus, the measurement that the X-rays are point-like and consistent with a power-law spectrum suggests that the X-ray emission is non-thermal emission from the radio core and/or base of the jet.
2.6.2 3C 268.3
The X-ray emission appears unresolved on inspection. We confirmed this by simulating a PSF using the CXC SAOsac RAYTRACE and MARX software, and using the CIAO ARESTORE task to apply the Richardson Lucy deconvolution algorithm, as used to show that the CSS source B3 1445+410 is also compact in X-rays. The model PSF was constructed using the spectral distribution of counts found in the data (see below). The X-ray results before and after deconvolution are shown in Fig. 7, along with contours from a 5-GHz MERLIN radio map of the source. A small astrometric correction of 0.17 arcsec was applied to the X-ray data to centre the source at 12:06:24.715, 64:13:36.98, which is the unconfirmed position of the radio core given by Lüdke et al. (1998).
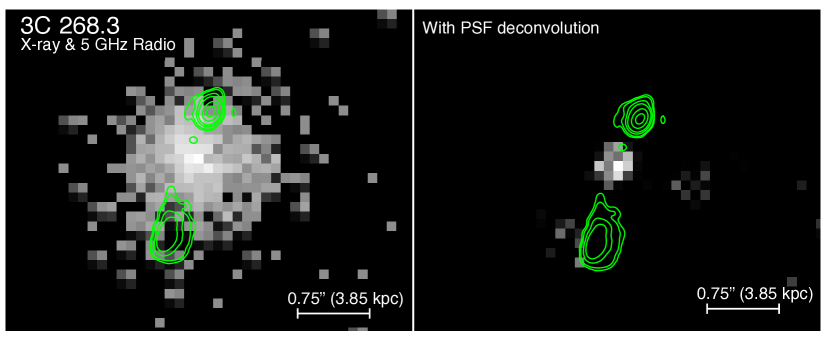
The spectrum was measured from counts between energies of 0.4 and 7 keV extracted from a circle of radius 1.25 arcsec, with background from an annulus of radii 5 and 90 arcsec, masking sources in the background region found by the CIAO wavdetect software. Counts were grouped to 15 per spectral bin, and the weighting scheme of Churazov et al. (1996) was adopted to provide an improved estimate of the variance in the limit of small numbers of counts. A single-component absorbed power-law model indicated high absorption but gives an unacceptable fit ( for 37 degrees of freedom (dof)). An acceptable fit ( for 35 dof) is found when a second, less absorbed, power law is added (Fig. 8). The slope of the second power law is poorly constrained and so we have fixed it at =0.7. The component values, where is the unabsorbed 1-keV flux density and is the unabsorbed 0.4-7-keV luminosity, with 90%-confidence errors for 1 interesting parameter, are as follows:
, cm-2, nJy, and ergs s-1.
(fixed), cm-2 nJy, ergs s-1.
Merely adding a soft thermal component to the heavily-absorbed power law is not acceptable (the temperature pegs at the upper limit of 64 keV), but we cannot rule out an (expected) small contribution to the spectrum from 3C 268.3’s ISM.

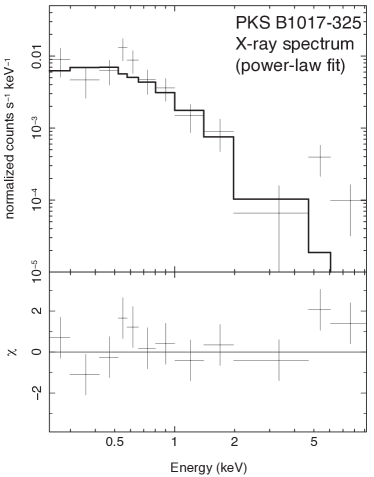
2.6.3 PKS B1017-325
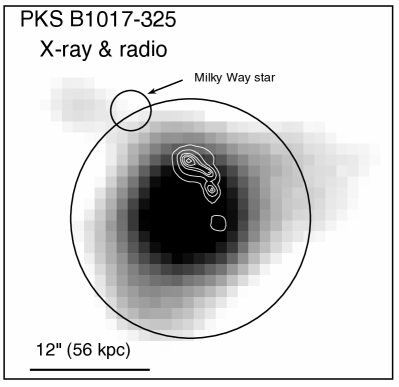
X-ray emission is seen in each of the three XMM-Newton EPIC cameras, centered within 1.5 arcsec of the location of PKS B1017-325. Fig. 9 shows the X-ray image with radio contours. Although the X-ray source appears to be centered slightly to the SE of the radio nucleus, this is within XMM-Newton’s astrometric uncertainties of a few arcseconds, as confirmed by Watson et al. (2009) during the creation of the 2XMM source catalog. The X-ray source is compact, essentially lying within the circle of radius we used for spectral extractions. The data show no excess centered on the location of foreground star (U0525_12970154 in the USNO-A2.0 catalog) with B = 11.9 mag and r=13.8 mag (marked by the small circle in Fig. 9), implying an X-ray to optical flux ratio less than about , consistent with findings for stars that are this blue in color (e.g., Vaiana et al., 1981).
The X-ray spectrum (Fig. 10) gives a good fit ( for 13 degrees of freedom) to a power law of spectral index (90% confidence), where and flux density is given by . The 1-keV flux density is nJy, and between 0.4 and 6 keV the observed flux is ergs cm-2 s-1 and the luminosity is ergs s-1 (90% confidence uncertainties for one interesting parameter).
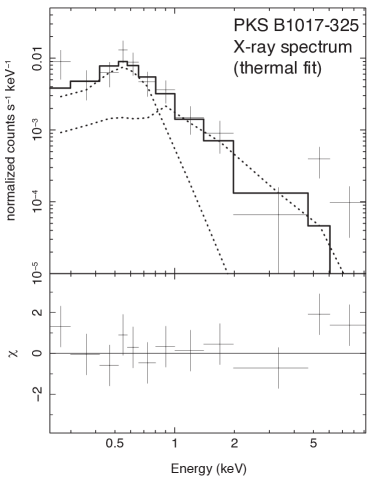
Since the spectral slope is unusually steep for a radio-galaxy core (e.g., Evans et al., 2006; Massaro et al., 2010, 2012, 2013), and the XMM-Newton PSF large enough to contain a significant galaxy atmosphere, we have also explored fits to a thermal (apec) model. We fixed the abundances to Solar, since values close to that are confirmed observationally for early-type galaxies (e.g., Konami et al., 2014) and there is no evidence in luminosity or extent for a significant outer atmosphere where lower abundances are typical. A single component thermal gives a poor fit ( for 13 degrees of freedom), and adding a thermal to the power-law model finds essentially the power-law component alone as it pushes to its maximum bound of 64 keV. When we fix the power-law index to , the value for B3 1445+410, the best-measured X-ray spectral index of any CSS radio galaxy dominated by core emission, the two-component model finds an acceptable fit of for 12 degrees of freedom. Here keV. The 0.4–6-keV luminosities in the thermal and power-law components are and ergs s-1, respectively. The 1-keV flux density of the power-law component is nJy. Alternatively, a model with two thermal components of solar abundances finds a good fit ( for 11 degrees of freedom) with values for of and keV, where the upper limit of the hotter thermal is unconstrained. The 0.4–6-keV luminosities are comparable in the two components, at and ergs s-1, respectively. The cool component, which would be associated with unshocked ISM, has a temperature consistent with the galaxy atmospheres of isolated ellipticals hosting nearby low-power radio sources, such as NGC 315 (Worrall et al., 2003), although with a luminosity roughly a factor of ten higher than expected. Mixed AGN emission could be responsible for some of the excess luminosity, or this may be a case where central collapse has both elevated the X-ray luminosity and triggered the young radio source. Based on the Rankine-Hugoniot conditions for a strong shock (see equations for example in Worrall & Birkinshaw, 2006), the hot component would be consistent with arising from about 8% of the ISM mass in about 2% of the volume that has been shocked by a Mach number of about 5. While this would seem a credible model, the sensitivity of the data limits drawing definitive conclusions.
2.7 Comparison with other CSS Sources
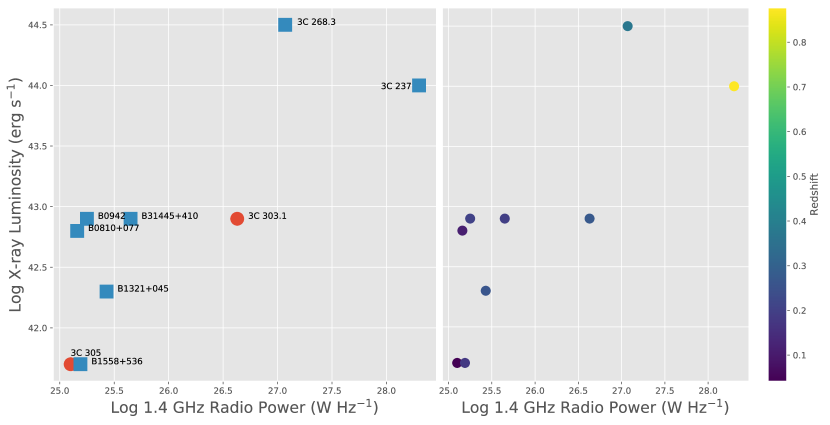
In section 1 we present selected properties of the nine known CSS galaxies with detections in the X-ray333 Based on our new spectroscopic redshift, the candidate CSS source PKS B1017-325 is now known to have a projected linear diameter of 44 kpc which is significantly above the cutoff for CSS sources. Thus, PKS B1017-325 is not considered a CSS for the analysis in this section.. The counts are generally small. Even so, there is X-ray spectroscopic evidence for hot shocked gas in two of the nine CSS galaxies - 3C303.1 (O’Dea et al., 2006) and 3C305 (Massaro et al., 2009; Hardcastle et al., 2012). In addition, 3 of the CSS sources show X-ray emission elongated along the radio source - 3C237 (Massaro et al., 2017), 3C303.1 (Massaro et al., 2010), and 3C305 (Massaro et al., 2009; Hardcastle et al., 2012). Fig. 12 shows the X-ray luminosity vs. radio power for the nine CSS sources with X-ray detections (data taken from section 1). We see an increase in X-ray luminosity with radio power as found by Kunert-Bajraszewska et al. (2014). The Pearson coefficient for this correlation is 0.802, and the associated p-value is 0.009. A partial correlation analysis between the X-ray and radio luminosity, controlling for redshift as a third variable, reveals that the two luminosities remain positively correlated. Redshift is nevertheless also a driver of the correlation (Fig. 12), and, as with any luminosity vs. luminosity plot (subject to Malmquist and ”bigger is bigger” biases), caution should be used in the interpretation of this result.
The CSS radio galaxies with evidence for hot shocked gas are not exceptional in their radio or X-ray luminosities compared to the total sample of nine. We speculate that hot shocked gas is typical in CSS radio galaxies and that deeper X-ray observations will reveal it.
3 Conclusions
We present X-ray, radio, and optical observations of three radio galaxies. 3C 268.3 is a broad line CSS radio galaxy. B3 1445+410 is an LEG CSS radio galaxy with possibly a hybrid FRI/II (or Fat Double) radio morphology. The Chandra observations are point-like and well fit with a power-law consistent with emission from a Doppler boosted core. The Chandra observations of 3C 268.3 are consistent with a point source centered on the nucleus whose spectrum can be fit by two power-law components. PKS B1017-325 is a low excitation emission line radio galaxy with a bent double radio morphology. The XMM-Newton observations are consistent with ISM emission with either a contribution from hot shocked gas or non-thermal jet emission. Using our new spectroscopic redshift, the projected linear size for PKS B1017-325 falls outside the formal definition of a CSS, and thus, we drop PKS B1017-325 from consideration as a CSS source. We compile selected radio and X-ray properties of the nine bona fide CSS radio galaxies with X-ray detections so far. We find that 2/9 show X-ray spectroscopic evidence for hot shocked gas and 3 CSS sources show X-ray emission aligned with the radio source. We note that the counts in the sources are low and the properties of the 2 sources with evidence for hot shocked gas are typical of the other CSS radio galaxies. We suggest that hot shocked gas may be typical of CSS radio galaxies due to their propagation through their host galaxies.
CSO, LBT, VLA, XMM
Acknowledgements.
This work was partially supported by NASA grants NNX08AX40G and GO0-11125X. G.R.T. acknowledges support from the National Aeronautics and Space Administration (NASA) through Einstein Postdoctoral Fellowship Award Number PF-150128, issued by the Chandra X-ray Observatory Center, which is operated by the Smithsonian Astrophysical Observatory for and on behalf of NASA under contract NAS8-03060. Basic research in radio astronomy at the Naval Research Laboratory is supported by 6.1 Base Funding. The National Radio Astronomy Observatory (NRAO) is operated by Associated Universities Inc. under cooperative agreement with the National Science Foundation. This work also contains data obtained at the Large Binocular Telescope (LBT), for which we gratefully acknowledge LBT Director Dr. Christian Veillet. The LBT is an international collaboration among institutions in the United States, Italy and Germany. LBT Corporation partners are: The University of Arizona on behalf of the Arizona university system; Istituto Nazionale di Astrofisica, Italy; LBT Beteiligungsgesellschaft, Germany, representing the Max-Planck Society, the Astrophysical Institute Potsdam, and Heidelberg University; The Ohio State University, and The Research Corporation, on behalf of The University of Notre Dame, University of Minnesota and University of Virginia. We also use data from the Sloan Digital Sky Survey (SDSS). Funding for the SDSS and SDSS-II has been provided by the Alfred P. Sloan Foundation, the Participating Institutions, the National Science Foundation, the U.S. Department of Energy, the National Aeronautics and Space Administration, the Japanese Monbukagakusho, the Max Planck Society, and the Higher Education Funding Council for England. The SDSS Web Site is http://www.sdss.org/. This publication makes use of data products from the Two Micron All Sky Survey, which is a joint project of the University of Massachusetts and the Infrared Processing and Analysis Center/California Institute of Technology, funded by the National Aeronautics and Space Administration and the National Science Foundation.”References
- An & Baan (2012) An, T., & Baan, W. A. 2012, ApJ, 760, 77
- Axon et al. (2000) Axon, D. J., Capetti, A., Fanti, R., et al. 2000, AJ, 120, 2284
- Bîrzan et al. (2004) Bîrzan, L., Rafferty, D. A., McNamara, B. R., Wise, M. W., & Nulsen, P. E. J. 2004, ApJ, 607, 800
- Blanton et al. (2001) Blanton, E. L., Gregg, M. D., Helfand, D. J., Becker, R. H., & Leighly, K. M. 2001, AJ, 121, 2915
- Boehringer et al. (1993) Boehringer, H., Voges, W., Fabian, A. C., Edge, A. C., & Neumann, D. M. 1993, MNRAS, 264, L25
- Burgess & Hunstead (2006a) Burgess, A. M., & Hunstead, R. W. 2006a, AJ, 131, 100
- Burgess & Hunstead (2006b) —. 2006b, AJ, 131, 114
- Buttiglione et al. (2010) Buttiglione, S., Capetti, A., Celotti, A., et al. 2010, A&A, 509, A6
- Cardelli et al. (1989) Cardelli, J. A., Clayton, G. C., & Mathis, J. S. 1989, ApJ, 345, 245
- Carilli et al. (1994) Carilli, C. L., Perley, R. A., & Harris, D. E. 1994, MNRAS, 270, 173
- Churazov et al. (1996) Churazov, E., Gilfanov, M., Forman, W., & Jones, C. 1996, ApJ, 471, 673
- Cotton (2008) Cotton, W. D. 2008, PASP, 120, 439
- Cotton et al. (2003) Cotton, W. D., Dallacasa, D., Fanti, C., et al. 2003, PASA, 20, 12
- Croston et al. (2011) Croston, J. H., Hardcastle, M. J., Mingo, B., et al. 2011, ApJ, 734, L28
- Croston et al. (2009) Croston, J. H., Kraft, R. P., Hardcastle, M. J., et al. 2009, MNRAS, 395, 1999
- de Vries et al. (1997) de Vries, W. H., O’Dea, C. P., Baum, S. A., et al. 1997, ApJS, 110, 191
- Dickey & Lockman (1990) Dickey, J. M., & Lockman, F. J. 1990, ARA&A, 28, 215
- Dunn et al. (2005) Dunn, R. J. H., Fabian, A. C., & Taylor, G. B. 2005, MNRAS, 364, 1343
- Evans et al. (2006) Evans, D. A., Worrall, D. M., Hardcastle, M. J., Kraft, R. P., & Birkinshaw, M. 2006, ApJ, 642, 96
- Fabian (2012) Fabian, A. C. 2012, ARA&A, 50, 455
- Fanti et al. (1995) Fanti, C., Fanti, R., Dallacasa, D., et al. 1995, A&A, 302, 317
- Fanti et al. (2001) Fanti, C., Pozzi, F., Dallacasa, D., et al. 2001, A&A, 369, 380
- Fanti et al. (1990) Fanti, R., Fanti, C., Schilizzi, R. T., et al. 1990, A&A, 231, 333
- Forman et al. (2007) Forman, W., Jones, C., Churazov, E., et al. 2007, ApJ, 665, 1057
- Gallieni et al. (2003) Gallieni, D., Anaclerio, E., Lazzarini, P. G., et al. 2003, in Proc. SPIE, Vol. 4839, Adaptive Optical System Technologies II, ed. P. L. Wizinowich & D. Bonaccini, 765–771
- Guainazzi et al. (2004) Guainazzi, M., Siemiginowska, A., Rodriguez-Pascual, P., & Stanghellini, C. 2004, A&A, 421, 461
- Guainazzi et al. (2006) Guainazzi, M., Siemiginowska, A., Stanghellini, C., et al. 2006, A&A, 446, 87
- Hardcastle et al. (2009) Hardcastle, M. J., Evans, D. A., & Croston, J. H. 2009, MNRAS, 396, 1929
- Hardcastle et al. (2012) Hardcastle, M. J., Massaro, F., Harris, D. E., et al. 2012, MNRAS, 424, 1774
- Heckman et al. (1982) Heckman, T. M., Miley, G. K., Balick, B., van Breugel, W. J. M., & Butcher, H. R. 1982, ApJ, 262, 529
- Heinz et al. (1998) Heinz, S., Reynolds, C. S., & Begelman, M. C. 1998, ApJ, 501, 126
- Konami et al. (2014) Konami, S., Matsushita, K., Nagino, R., & Tamagawa, T. 2014, ApJ, 783, 8
- Kraft et al. (2003) Kraft, R. P., Vázquez, S. E., Forman, W. R., et al. 2003, ApJ, 592, 129
- Kunert-Bajraszewska et al. (2014) Kunert-Bajraszewska, M., Labiano, A., Siemiginowska, A., & Guainazzi, M. 2014, MNRAS, 437, 3063
- Kunert-Bajraszewska et al. (2013) Kunert-Bajraszewska, M., Siemiginowska, A., & Labiano, A. 2013, ApJ, 772, L7
- Leahy (1991) Leahy, J. P. 1991, Interpretation of large scale extragalactic jets, ed. P. A. Hughes, 100
- Lüdke et al. (1998) Lüdke, E., Garrington, S. T., Spencer, R. E., et al. 1998, MNRAS, 299, 467
- Massaro et al. (2013) Massaro, F., Harris, D. E., Tremblay, G. R., et al. 2013, ApJS, 206, 7
- Massaro et al. (2009) Massaro, F., Chiaberge, M., Grandi, P., et al. 2009, ApJ, 692, L123
- Massaro et al. (2010) Massaro, F., Harris, D. E., Tremblay, G. R., et al. 2010, ApJ, 714, 589
- Massaro et al. (2012) Massaro, F., Tremblay, G. R., Harris, D. E., et al. 2012, ApJS, 203, 31
- Massaro et al. (2015) Massaro, F., Harris, D. E., Liuzzo, E., et al. 2015, ApJS, 220, 5
- Massaro et al. (2017) —. 2017, ApJS, 220, 5
- Miller et al. (2012) Miller, D. L., Guerra, J. C., Boutsia, K., et al. 2012, in Proc. SPIE, Vol. 8447, Adaptive Optics Systems III, 84472T
- Morganti et al. (2005) Morganti, R., Oosterloo, T. A., Tadhunter, C. N., van Moorsel, G., & Emonts, B. 2005, A&A, 439, 521
- Murgia et al. (1999) Murgia, M., Fanti, C., Fanti, R., et al. 1999, A&A, 345, 769
- O’Dea (1998) O’Dea, C. P. 1998, PASP, 110, 493
- O’Dea et al. (2000) O’Dea, C. P., De Vries, W. H., Worrall, D. M., Baum, S. A., & Koekemoer, A. 2000, AJ, 119, 478
- O’Dea et al. (2006) O’Dea, C. P., Mu, B., Worrall, D. M., et al. 2006, ApJ, 653, 1115
- O’Dea et al. (1996) O’Dea, C. P., Worrall, D. M., Baum, S. A., & Stanghellini, C. 1996, AJ, 111, 92
- O’Dea et al. (2002) O’Dea, C. P., de Vries, W. H., Koekemoer, A. M., et al. 2002, AJ, 123, 2333
- Orienti (2016) Orienti, M. 2016, Astronomische Nachrichten, 337, 9
- Owen & Laing (1989) Owen, F. N., & Laing, R. A. 1989, MNRAS, 238, 357
- Owen & Rudnick (1976) Owen, F. N., & Rudnick, L. 1976, ApJ, 205, L1
- Owsianik & Conway (1998) Owsianik, I., & Conway, J. E. 1998, A&A, 337, 69
- Peck & Taylor (2000) Peck, A. B., & Taylor, G. B. 2000, ApJ, 534, 90
- Pogge et al. (2006) Pogge, R. W., Atwood, B., Belville, S. R., et al. 2006, in Proc. SPIE, Vol. 6269, Society of Photo-Optical Instrumentation Engineers (SPIE) Conference Series, 62690I
- Polatidis (2009) Polatidis, A. G. 2009, Astronomische Nachrichten, 330, 149
- Quirós-Pacheco et al. (2010) Quirós-Pacheco, F., Busoni, L., Agapito, G., et al. 2010, in Proc. SPIE, Vol. 7736, Adaptive Optics Systems II, 77363H
- Rafferty et al. (2006) Rafferty, D. A., McNamara, B. R., Nulsen, P. E. J., & Wise, M. W. 2006, ApJ, 652, 216
- Readhead et al. (1996) Readhead, A. C. S., Taylor, G. B., Pearson, T. J., & Wilkinson, P. N. 1996, ApJ, 460, 634
- Reynaldi & Feinstein (2013) Reynaldi, V., & Feinstein, C. 2013, MNRAS, 435, 1350
- Rothberg et al. (2016) Rothberg, B., Kuhn, O., Edwards, M. L., et al. 2016, in Proc. SPIE, Vol. 9906, Society of Photo-Optical Instrumentation Engineers (SPIE) Conference Series, 990622
- Saikia & Gupta (2003) Saikia, D. J., & Gupta, N. 2003, A&A, 405, 499
- Scheuer (1974) Scheuer, P. A. G. 1974, MNRAS, 166, 513
- Schlafly & Finkbeiner (2011) Schlafly, E. F., & Finkbeiner, D. P. 2011, ApJ, 737, 103
- Secrest et al. (2015) Secrest, N. J., Satyapal, S., Gliozzi, M., et al. 2015, ApJ, 798, 38
- Siemiginowska et al. (2005) Siemiginowska, A., Cheung, C. C., LaMassa, S., et al. 2005, ApJ, 632, 110
- Siemiginowska et al. (2008) Siemiginowska, A., LaMassa, S., Aldcroft, T. L., Bechtold, J., & Elvis, M. 2008, ApJ, 684, 811
- Siemiginowska et al. (2016) Siemiginowska, A., Sobolewska, M., Migliori, G., et al. 2016, ApJ, 823, 57
- Skrutskie et al. (2006) Skrutskie, M. F., Cutri, R. M., Stiening, R., et al. 2006, AJ, 131, 1163
- Smith et al. (2002) Smith, D. A., Wilson, A. S., Arnaud, K. A., Terashima, Y., & Young, A. J. 2002, ApJ, 565, 195
- Stockton et al. (2007) Stockton, A., Canalizo, G., Fu, H., & Keel, W. 2007, ApJ, 659, 195
- Taylor et al. (2000) Taylor, G. B., Marr, J. M., Pearson, T. J., & Readhead, A. C. S. 2000, ApJ, 541, 112
- Tengstrand et al. (2009) Tengstrand, O., Guainazzi, M., Siemiginowska, A., et al. 2009, A&A, 501, 89
- Tornikoski et al. (2009) Tornikoski, M., Torniainen, I., Lähteenmäki, A., et al. 2009, Astronomische Nachrichten, 330, 128
- Tremblay et al. (2010) Tremblay, G. R., O’Dea, C. P., Baum, S. A., et al. 2010, ApJ, 715, 172
- Tremblay et al. (2012) —. 2012, MNRAS, 424, 1026
- Vaiana et al. (1981) Vaiana, G. S., Cassinelli, J. P., Fabbiano, G., et al. 1981, ApJ, 245, 163
- Vigotti et al. (1989) Vigotti, M., Grueff, G., Perley, R., Clark, B. G., & Bridle, A. H. 1989, AJ, 98, 419
- Vink et al. (2006) Vink, J., Snellen, I., Mack, K.-H., & Schilizzi, R. 2006, MNRAS, 367, 928
- Watson et al. (2009) Watson, M. G., Schröder, A. C., Fyfe, D., et al. 2009, A&A, 493, 339
- Wise et al. (2007) Wise, M. W., McNamara, B. R., Nulsen, P. E. J., Houck, J. C., & David, L. P. 2007, ApJ, 659, 1153
- Worrall (2009) Worrall, D. M. 2009, A&A Rev., 17, 1
- Worrall & Birkinshaw (1994) Worrall, D. M., & Birkinshaw, M. 1994, ApJ, 427, 134
- Worrall & Birkinshaw (2006) Worrall, D. M., & Birkinshaw, M. 2006, in Lecture Notes in Physics, Berlin Springer Verlag, Vol. 693, Physics of Active Galactic Nuclei at all Scales, ed. D. Alloin, 39
- Worrall et al. (2003) Worrall, D. M., Birkinshaw, M., & Hardcastle, M. J. 2003, MNRAS, 343, L73
- Worrall et al. (2012) Worrall, D. M., Birkinshaw, M., Young, A. J., et al. 2012, MNRAS, 424, 1346
- Worrall et al. (2004) Worrall, D. M., Hardcastle, M. J., Pearson, T. J., & Readhead, A. C. S. 2004, MNRAS, 347, 632